smoking during pregnancy in wisconsin and the united states trends and patterns 1990-2010
DESCRIPTION
Health and WellnessTRANSCRIPT

DRAFT– do not distribute
Smoking During Pregnancy in Wisconsin and the United States
Trends and Patterns, 1990‐2010
May 2012
DRAFT DRAFT -- DO NOT DISTRIBUTEDO NOT DISTRIBUTE

Table of Contents Executive Summary ................................................................................................................................ 1 Introduction ............................................................................................................................................. 3 Results .................................................................................................................................................... 4 Discussion ............................................................................................................................................... 9 Limitations ............................................................................................................................................. 10 Technical Notes .................................................................................................................................... 10 References ............................................................................................................................................ 11 Appendix of Data Tables ....................................................................................................................... 12 Table 1 ............................................................................................................................................... 12 Table 2 ............................................................................................................................................... 12 Table 3 ............................................................................................................................................... 13 Table 4 ............................................................................................................................................... 14 Table 5 ............................................................................................................................................... 14
Acknowledgements This report was prepared by Karen A. Palmersheim, Ph.D. Dr. Palmersheim is an epidemiologist and researcher with the University of Wisconsin-Milwaukee, Center for Urban Initiatives and Re-search.
Support for this report was provided by Wisconsin Department of Health Services, Division of Public Health, Bureau of Community Health Promotion, Tobacco Prevention and Control Program. The author wishes to thank Randall L. Glysch and Peter E. Maier for their helpful reviews of the re-port.
Suggested citation: Palmersheim KA. Smoking During Pregnancy in Wisconsin and the United States: Trends and Patterns, 1990-2010. Milwaukee, Wisconsin: University of Wisconsin-Milwaukee Center for Urban Initiatives and Research, 2012.
For additional copies of this report, visit our website cuir.uwm.edu or contact:
Karen Palmersheim, Ph.D. University of Wisconsin-Milwaukee Center for Urban Initiatives and Research P.O. Box 413 Milwaukee, WI. 53201 [email protected]

1
Executive Summary
This report describes trends in cigarette smoking during pregnancy from 1990 to 2010 in Wisconsin for all pregnant women and demographic subgroups. United States data are compared to Wisconsin data for the years 1990 through 2007. The data presented reveal the following major patterns in smoking during preg-nancy:
National
• In the United States, the prevalence of smoking during pregnancy decreased from 18% in 1990 to 9% in 2007.
State
• In Wisconsin, the prevalence of smoking during pregnancy decreased from 23% in 1990 to 15% in 2007; It decreased to 13% in 2010.
• The relative percent decrease in smoking during pregnancy was 42% between 1990 and 2010. How-ever, the rate of change has been small and the direction of change has been inconsistent during the most recent eight years (i.e., 14% in 2003, 15% in 2006, 13% in 2010).
Race
• During 2008-2010, 5% of Laotian/Hmong women, 6% of Hispanic women, 15% of non-Hispanic white women, 16% of non-Hispanic black women, and 37% of American Indian women reported smoking dur-ing pregnancy.
• For all racial and ethnic groups, other than Laotian/Hmong women, the prevalence of smoking during pregnancy decreased between 1990 and 2010.
• American Indian women had the highest prevalence of smoking during pregnancy throughout the study period.
• Though Laotian/Hmong women consistently had the lowest prevalence of smoking during pregnancy, they are the only group for whom prevalence increased between 1993 and 2010 (from 0% during 1993-1995 to 5% during 2008-2010).
• The prevalences of smoking during pregnancy for non-Hispanic black, Hispanic, American Indian, and Laotian/Hmong women in Wisconsin were approximately double the prevalence for each corresponding group in the United States.
Age
• In general, women 18 to 24 years of age were most likely to smoke during pregnancy (~23%).
• When age and race/ethnicity were considered in tandem, the prevalence of smoking during pregnancy for black women was greater for older age groups. Black women 20 years of age and older were almost twice as likely to smoke during pregnancy compared to black women less than 20 years of age. Smok-ing during pregnancy among American Indian women was consistently higher among women aged 18 to 34 years, compared to the youngest group and the two oldest groups.

2
Executive Summary, continued...
Education
• In general, the prevalence of smoking during pregnancy was lower for women in each sequentially higher category of educational attainment during 1990 through 2010.
• However, women with less than a high school diploma were less likely to smoke during pregnancy than women with at high school degree during 2008-2010.
• Compared to women with a college degree or greater, women with a high school diploma and those with less than a high school degree were at least twelve times more likely to smoke during pregnancy during 2008-2010 (2%, 24%, and 23%, respectively).
• Women with some college were approximately seven time more likely to smoke during pregnancy than women with a college degree (13% and 2%, respectively).
Marital Status
• The prevalence of smoking during pregnancy decreased for both married and unmarried women be-tween 1990 and 2010; however, during 1990-1992, unmarried women were about two and one-half times more likely to smoke during pregnancy than married women (40% vs. 16%); during 2008-2010, they were greater than four times more likely to smoke (27% vs. 6%).
Prenatal Care
• Compared to women who initiated prenatal care during the first trimester of their pregnancy, women who initiated care during their second or third trimester were nearly one and one-half times more likely to smoke during pregnancy; women who did not receive prenatal care were almost two and one-half times more likely to smoke (13%, 19%, and 31%, respectively).
Wisconsin Counties
• A decreasing trend in the prevalence of smoking during pregnancy was observed in 67 of Wisconsin’s 72 counties between 1990-1992 and 2008-2010. However, from 2005-2007 to 2008-2010, an increase in the prevalence of smoking during pregnancy was noted in 26 counties.
• During 2008-2010, the average prevalence of smoking during pregnancy among Wisconsin women was 13.9%; however, in 52 of the state’s counties, the prevalences were higher than the state average.
• The prevalence of smoking during pregnancy varied greatly among counties. During 2008-2010, Ozaukee County had the lowest prevalence (7%) and Menominee County had the highest prevalence (39%).
• In general, higher prevalences of smoking during pregnancy were observed in the northern third of the state, and in a number of centrally located counties.

3
Introduction Cigarette smoking during pregnancy has been shown to have adverse effects on both the mother and child. Two reports of the Surgeon General, Women and Smoking1 and The Health Consequences of Smoking,2 highlight the dangers of smoking during pregnancy. Pregnant women who smoke put themselves and their babies at risk for premature rupture of membranes, placenta previa, stillbirth, preterm delivery, and sudden infant death syndrome. These reports also show that infants born to women who smoke are at least twice as likely to be low birthweight, defined as weighing less than 2,500 grams at birth. In Wisconsin, during 2008-2010, 11.1% of babies born to women who smoked were low birthweight babies, compared to 6.4% of babies born to non-smoking women. Comparison of the 2008-2010 data to 2005-2007 data reveals virtually no change in the relative percentages of low birthweight babies for women who smoked during pregnancy relative to non-smoking women. The infant mor-tality rate for the babies of Wisconsin mothers who smoked during their pregnancy was 9.4 deaths per 1,000 live births in 2008-2010. For the babies of mothers who did not smoke, the infant mortality rate was 5.7 deaths per 1,000 live births.3
Wisconsin has long recognized the great risks a woman who smokes takes for herself, her unborn child, and her family. Through many programs with local health departments, coalitions, health care professionals, and interested partners, the state has focused efforts at reducing tobacco use and exposure to secondhand smoke in the general population. In addition, the state supports the First Breath4 program, a nationally-recognized smoking cessation pro-gram for pregnant women established in 2001.
Healthy People 20105 outlined an ambitious objective of increasing abstinence from cigarettes among pregnant women to 99%. In ad-dition, one of the goals of Healthiest Wisconsin 2010,6 Wisconsin’s state health plan, includes eliminating health disparities.
In light of these goals, the purpose of this report is to examine trends in smoking during pregnancy among women in Wisconsin. It compares the prevalence of smoking during pregnancy in Wisconsin to the prevalence in the United States for all pregnant women and for select subgroups. The data for this report came primarily from the Wisconsin Interactive Statistics on Health (WISH)3 (see Techni-cal Notes). Additionally, this report serves as an update to the 2006 and 2009 reports, Smoking During Pregnancy in Wisconsin and the United States: Trends and Patterns, 1990-2004,7 and Smoking Dur-ing Pregnancy in Wisconsin and the United States: An Update in Trends and Patterns, 1990-2007.8
This report identifies social and demographic characteristics associated with an increased likelihood of smoking during pregnancy. However, none of the relationships presented in this report should be construed as causal.
Findings presented here are intended to provide a resource for health professionals, local health departments, and local coalitions working towards the reduction of the prevalence of smoking during pregnancy in Wisconsin. This report may also assist public health agencies attempting to assess progress in the reduction of smoking dur-ing pregnancy, and aid in the determination of focusing future efforts.
Pregnant women who smoke put themselves and their babies at risk for premature rupture of membranes, placenta previa, stillbirth, pre-term delivery, and sudden infant death syndrome.
… infants born to women who smoke are twice as likely to be low birthweight…
Healthy People 2010 outlined an ambitious objective of increasing abstinence from cigarettes among pregnant women to 99%.
4
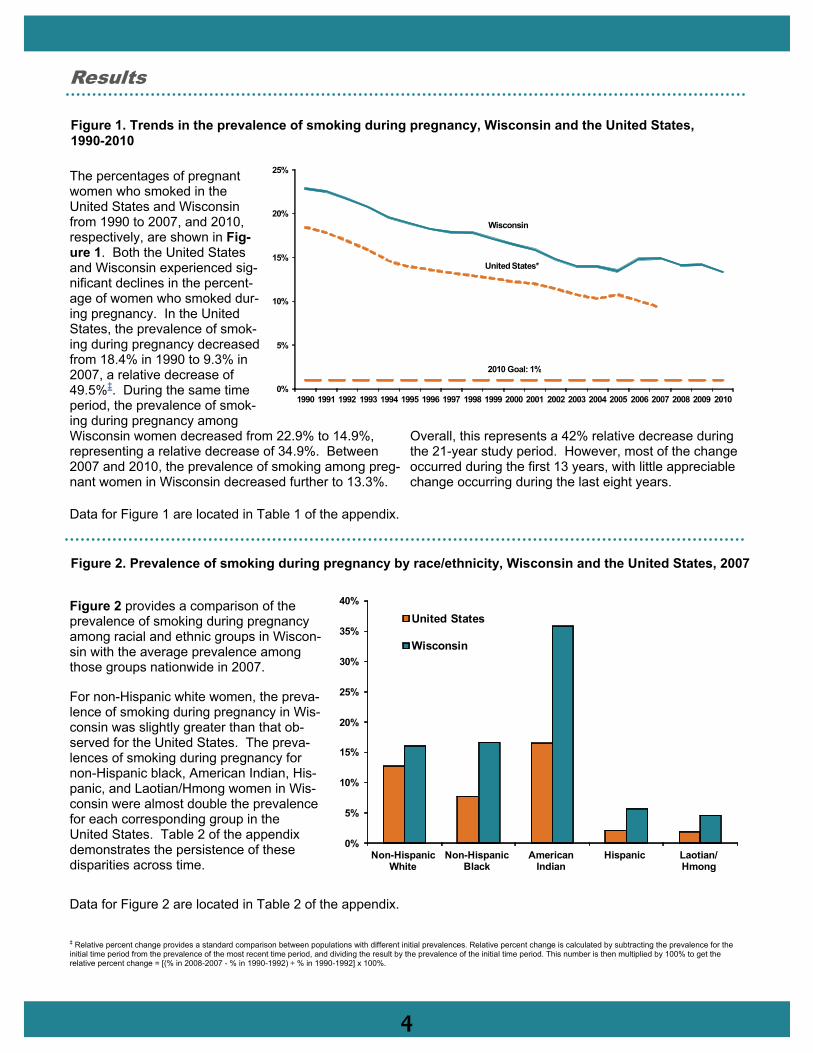
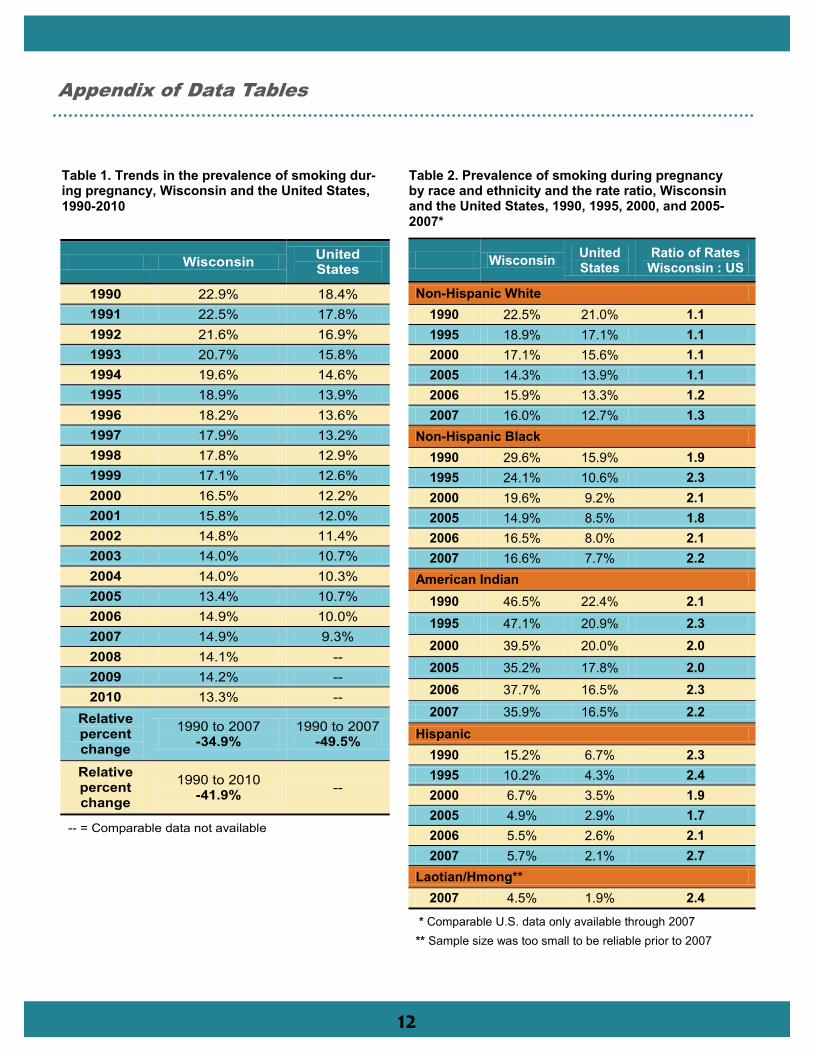
The percentages of pregnant women who smoked in the United States and Wisconsin from 1990 to 2007, and 2010, respectively, are shown in Fig-ure 1. Both the United States and Wisconsin experienced sig-nificant declines in the percent-age of women who smoked dur-ing pregnancy. In the United States, the prevalence of smok-ing during pregnancy decreased from 18.4% in 1990 to 9.3% in 2007, a relative decrease of 49.5%‡. During the same time period, the prevalence of smok-ing during pregnancy among Wisconsin women decreased from 22.9% to 14.9%, representing a relative decrease of 34.9%. Between 2007 and 2010, the prevalence of smoking among preg-nant women in Wisconsin decreased further to 13.3%.
Overall, this represents a 42% relative decrease during the 21-year study period. However, most of the change occurred during the first 13 years, with little appreciable change occurring during the last eight years.
Figure 2 provides a comparison of the prevalence of smoking during pregnancy among racial and ethnic groups in Wiscon-sin with the average prevalence among those groups nationwide in 2007.
For non-Hispanic white women, the preva-lence of smoking during pregnancy in Wis-consin was slightly greater than that ob-served for the United States. The preva-lences of smoking during pregnancy for non-Hispanic black, American Indian, His-panic, and Laotian/Hmong women in Wis-consin were almost double the prevalence for each corresponding group in the United States. Table 2 of the appendix demonstrates the persistence of these disparities across time.
Data for Figure 2 are located in Table 2 of the appendix.
Results
Figure 1. Trends in the prevalence of smoking during pregnancy, Wisconsin and the United States, 1990-2010
Figure 2. Prevalence of smoking during pregnancy by race/ethnicity, Wisconsin and the United States, 2007
Wisconsin
United States*
0%
5%
10%
15%
20%
25%
1990 1991 1992 1993 1994 1995 1996 1997 1998 1999 2000 2001 2002 2003 2004 2005 2006 2007 2008 2009 2010
2010 Goal: 1%
0%
5%
10%
15%
20%
25%
30%
35%
40%
Non-Hispanic White
Non-Hispanic Black
American Indian
Hispanic Laotian/ Hmong
United States
Wisconsin
Data for Figure 1 are located in Table 1 of the appendix.
‡ Relative percent change provides a standard comparison between populations with different initial prevalences. Relative percent change is calculated by subtracting the prevalence for the initial time period from the prevalence of the most recent time period, and dividing the result by the prevalence of the initial time period. This number is then multiplied by 100% to get the relative percent change = [(% in 2008-2007 - % in 1990-1992) ÷ % in 1990-1992] x 100%.

5
Trends in the prevalence of smoking during pregnancy for racial and ethnic groups in Wis-consin from 1990 to 2010 are illustrated in Figure 3 using three-year averages. For all racial/ethnic groups except than Laotian/Hmong, the prevalence of smoking during pregnancy decreased during this period. American Indian women had the highest prevalence of smoking during pregnancy throughout the study period, 48.0% in 1990-1992 and 36.9% in 2008-2010. Laotian/Hmong women consistently exhibited the low-est prevalence of smoking during pregnancy, although their rates have been steadily in-creasing, from 0.4% in 1993-1995 to 5.2% in 2008-2010.
The relative percent decrease in the prevalence of smoking during pregnancy was greatest for Hispanic women (-65.6%), and was smallest for American Indian
women (-24.4%) and non-Hispanic white women (-30.0%) between 1990-1992 and 2005-2007.
In general, younger women are more likely to smoke during pregnancy than older women, as seen in Figure 4. More specifi-cally, women aged 18-19 or 20-24 years were most likely to smoke during preg-nancy during 2008-2010 (22.5% and 22.4%, respectively). The age groups next most likely to smoke during pregnancy were those less than 18 years of age (12.7%) and those 25-29 years of age (13.2%). Smoking during pregnancy was lowest among women in the three highest age groups (8.3%, 7.7%, and 7.6%, re-spectively). Data for Figure 4 are located in Table 3 of the appendix.
Results
Figure 3. Prevalence of smoking during pregnancy by race/ethnicity, Wisconsin, 1990-2010 by three-year averages
Figure 4. Prevalence of smoking during pregnancy by age of mother, Wisconsin, 1990-2010, by three-year averages
White
Black
American Indian
Hispanic
Laotian /Hmong0%
10%
20%
30%
40%
50%
60%
1990-1992 1993-1995 1996-1998 1999-2001 2002-2004 2005-2007 2008-2010
0%
5%
10%
15%
20%
25%
30%
35%
40%
1990-1992 1993-1995 1996-1998 1999-2001 2002-2004 2005-2007 2008-2010
Under 18 18-19 yrs 20-24 yrs 25-29 yrs
30-34 yrs 35-39 yrs 40+ yrs
Data for Figure 3 are located in Table 3 of the appendix.
6
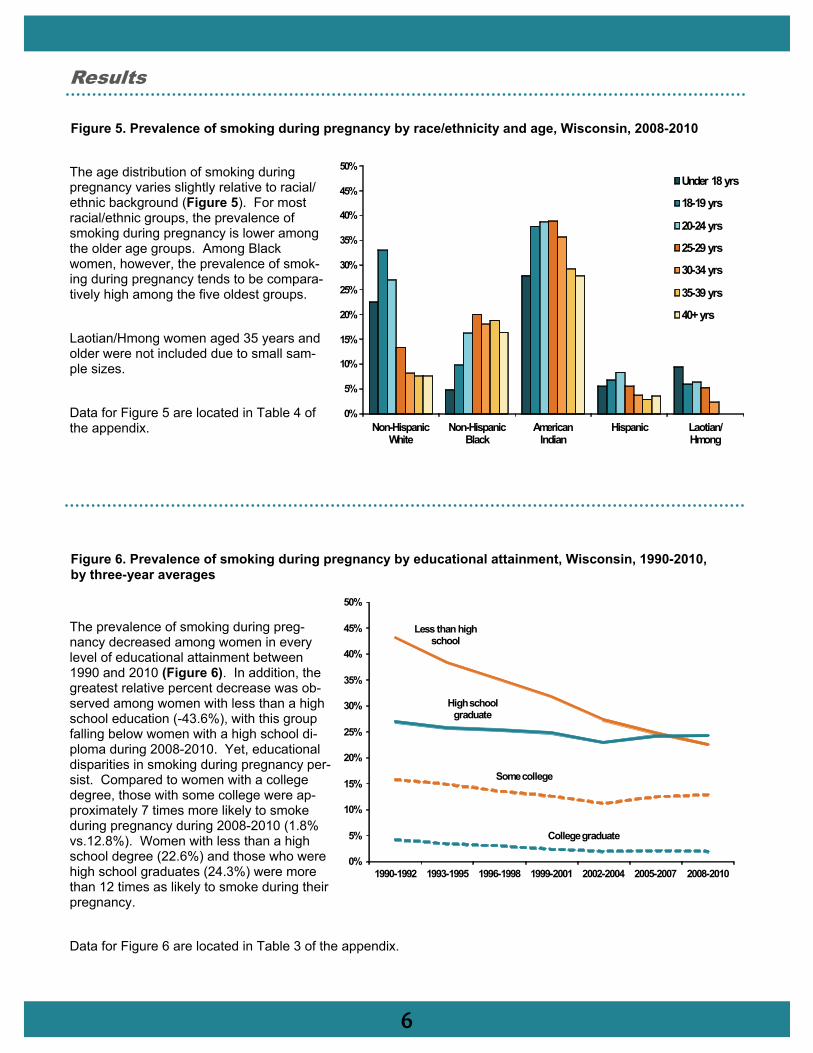
The age distribution of smoking during pregnancy varies slightly relative to racial/ethnic background (Figure 5). For most racial/ethnic groups, the prevalence of smoking during pregnancy is lower among the older age groups. Among Black women, however, the prevalence of smok-ing during pregnancy tends to be compara-tively high among the five oldest groups. Laotian/Hmong women aged 35 years and older were not included due to small sam-ple sizes. Data for Figure 5 are located in Table 4 of the appendix.
The prevalence of smoking during preg-nancy decreased among women in every level of educational attainment between 1990 and 2010 (Figure 6). In addition, the greatest relative percent decrease was ob-served among women with less than a high school education (-43.6%), with this group falling below women with a high school di-ploma during 2008-2010. Yet, educational disparities in smoking during pregnancy per-sist. Compared to women with a college degree, those with some college were ap-proximately 7 times more likely to smoke during pregnancy during 2008-2010 (1.8% vs.12.8%). Women with less than a high school degree (22.6%) and those who were high school graduates (24.3%) were more than 12 times as likely to smoke during their pregnancy. Data for Figure 6 are located in Table 3 of the appendix.
0%
5%
10%
15%
20%
25%
30%
35%
40%
45%
50%
Non-Hispanic White
Non-Hispanic Black
American Indian
Hispanic Laotian/ Hmong
Under 18 yrs
18-19 yrs
20-24 yrs
25-29 yrs
30-34 yrs
35-39 yrs
40+ yrs
Results
Figure 5. Prevalence of smoking during pregnancy by race/ethnicity and age, Wisconsin, 2008-2010
Less than high school
High school graduate
Some college
College graduate
0%
5%
10%
15%
20%
25%
30%
35%
40%
45%
50%
1990-1992 1993-1995 1996-1998 1999-2001 2002-2004 2005-2007 2008-2010
Figure 6. Prevalence of smoking during pregnancy by educational attainment, Wisconsin, 1990-2010, by three-year averages
7
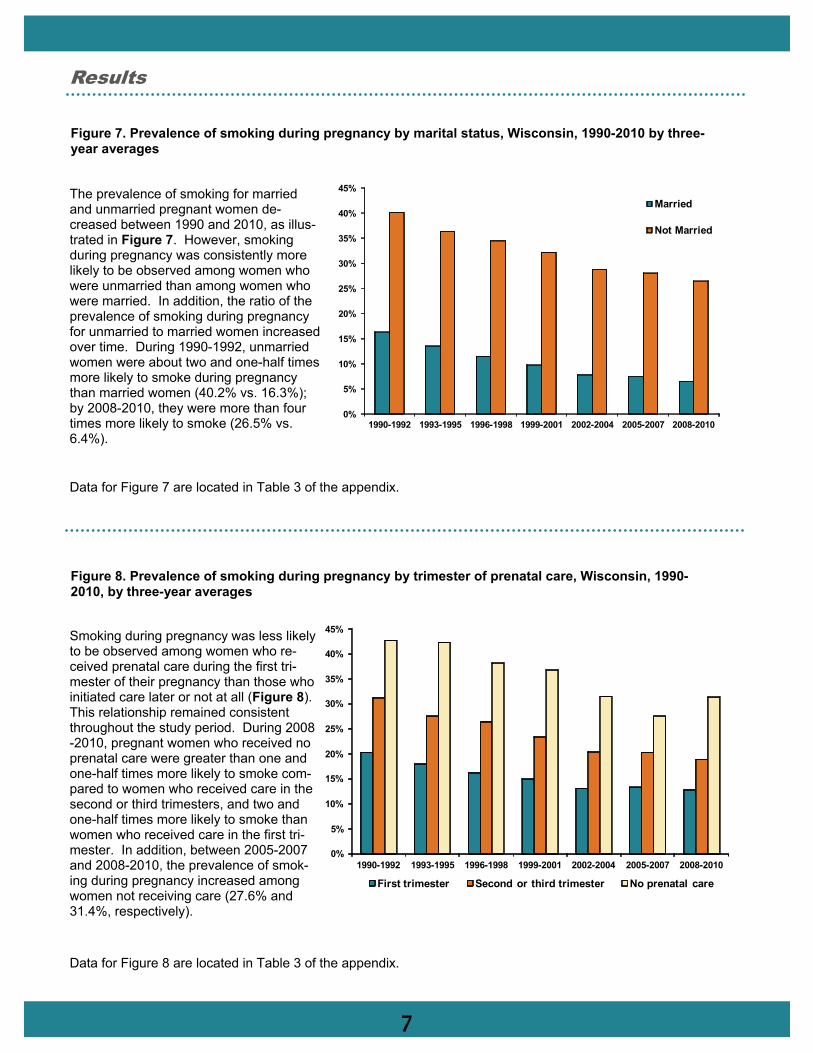
The prevalence of smoking for married and unmarried pregnant women de-creased between 1990 and 2010, as illus-trated in Figure 7. However, smoking during pregnancy was consistently more likely to be observed among women who were unmarried than among women who were married. In addition, the ratio of the prevalence of smoking during pregnancy for unmarried to married women increased over time. During 1990-1992, unmarried women were about two and one-half times more likely to smoke during pregnancy than married women (40.2% vs. 16.3%); by 2008-2010, they were more than four times more likely to smoke (26.5% vs. 6.4%).
Smoking during pregnancy was less likely to be observed among women who re-ceived prenatal care during the first tri-mester of their pregnancy than those who initiated care later or not at all (Figure 8). This relationship remained consistent throughout the study period. During 2008-2010, pregnant women who received no prenatal care were greater than one and one-half times more likely to smoke com-pared to women who received care in the second or third trimesters, and two and one-half times more likely to smoke than women who received care in the first tri-mester. In addition, between 2005-2007 and 2008-2010, the prevalence of smok-ing during pregnancy increased among women not receiving care (27.6% and 31.4%, respectively).
Results
Figure 7. Prevalence of smoking during pregnancy by marital status, Wisconsin, 1990-2010 by three-year averages
Figure 8. Prevalence of smoking during pregnancy by trimester of prenatal care, Wisconsin, 1990-2010, by three-year averages
0%
5%
10%
15%
20%
25%
30%
35%
40%
45%
1990-1992 1993-1995 1996-1998 1999-2001 2002-2004 2005-2007 2008-2010
Married
Not Married
0%
5%
10%
15%
20%
25%
30%
35%
40%
45%
1990-1992 1993-1995 1996-1998 1999-2001 2002-2004 2005-2007 2008-2010
First trimester Second or third trimester No prenatal care
Data for Figure 8 are located in Table 3 of the appendix.
Data for Figure 7 are located in Table 3 of the appendix.
8
Results
Figure 9. Prevalence of smoking during pregnancy by county, in quartiles, Wisconsin, 2008-2010
RichlandCrawford
Vernon
BrownWaupacaPortage
CalumetWinnebago Manitowoc
Door
GreenLake
Marquette
Columbia
OcontoMenominee
Adams
Juneau
WashingtonOzaukee
WaukeshaMilwaukee
Racine
MarinetteForest
Ashland
Bayfield
Kenosha
LaCrosse
Trempealeau
BuffaloPepin
Polk
Burnett
Douglas
Iron
Vilas
SawyerWashburn Florence
Price Oneida
Barron Rusk
LincolnLangladeTaylor
ChippewaSt. CroixDunn Marathon
ClarkShawano
Pierce Eau Claire
WoodKewaunee
JacksonOutagamie
Waushara
Monroe
Fond du Lac Sheboygan
Sauk Dodge
Dane
Grant
Iowa Jefferson
Green Rock WalworthLafayette
6.8%-12.9%13.0%-17.7%17.8%-22.0%22.1%-39.0%
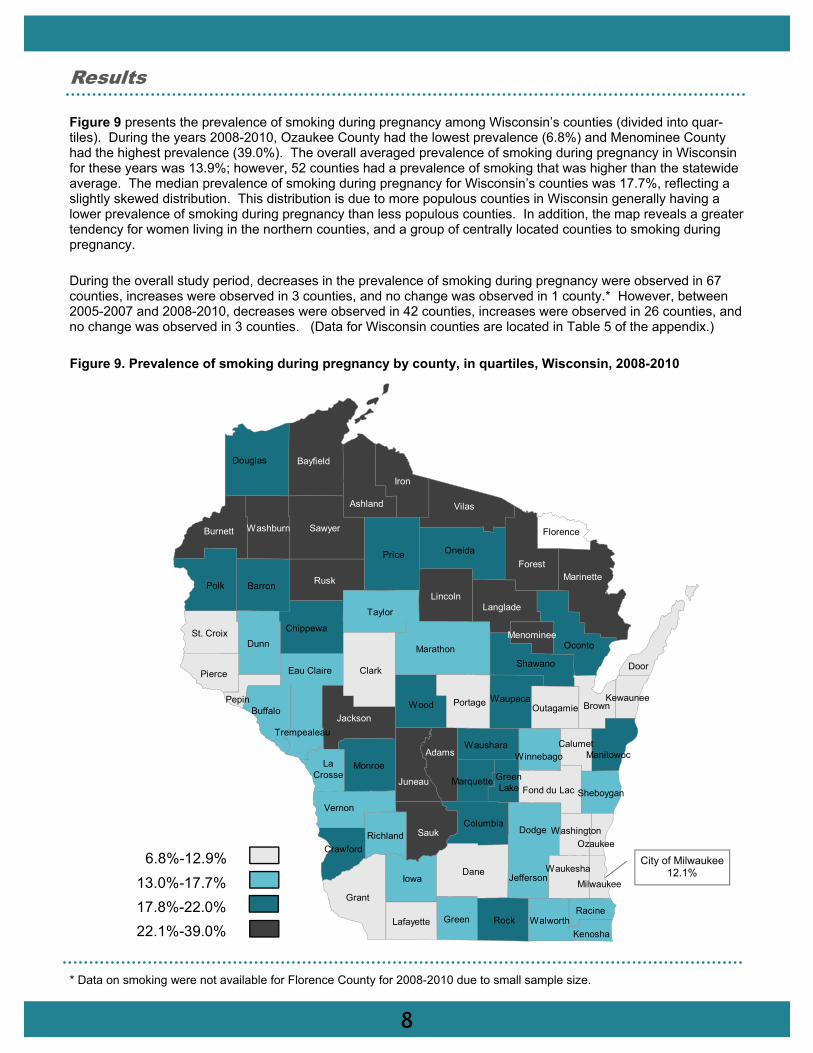
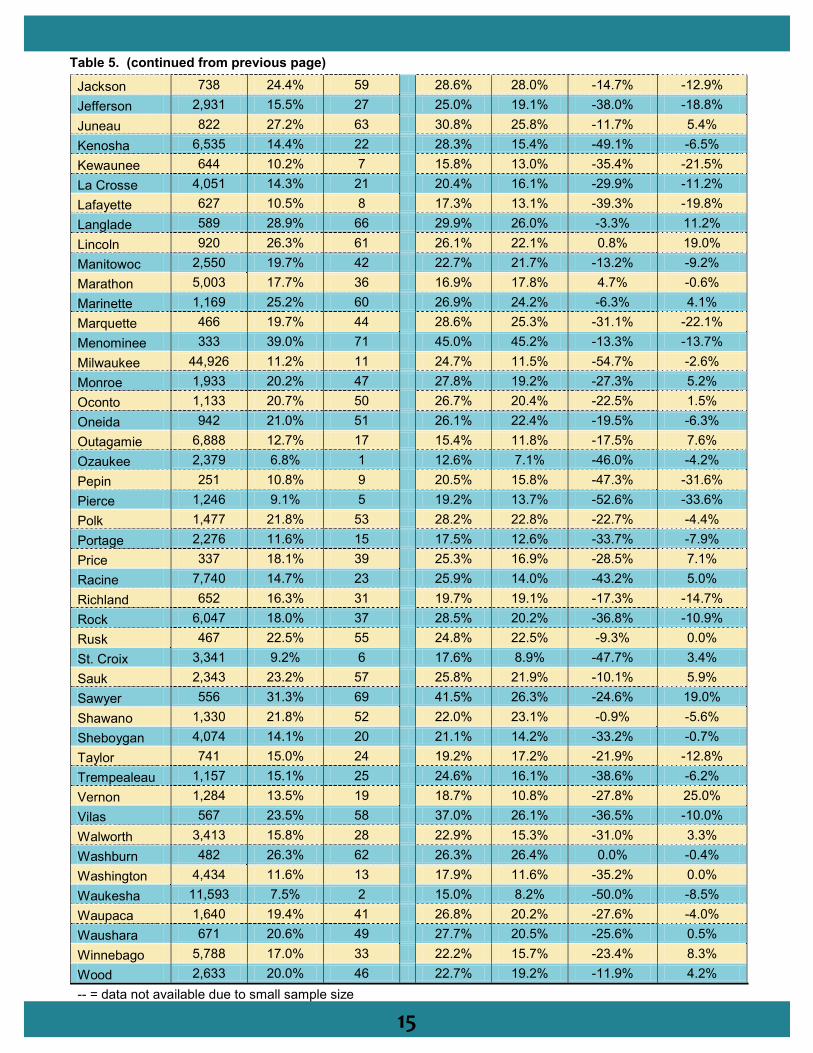
Figure 9 presents the prevalence of smoking during pregnancy among Wisconsin’s counties (divided into quar-tiles). During the years 2008-2010, Ozaukee County had the lowest prevalence (6.8%) and Menominee County had the highest prevalence (39.0%). The overall averaged prevalence of smoking during pregnancy in Wisconsin for these years was 13.9%; however, 52 counties had a prevalence of smoking that was higher than the statewide average. The median prevalence of smoking during pregnancy for Wisconsin’s counties was 17.7%, reflecting a slightly skewed distribution. This distribution is due to more populous counties in Wisconsin generally having a lower prevalence of smoking during pregnancy than less populous counties. In addition, the map reveals a greater tendency for women living in the northern counties, and a group of centrally located counties to smoking during pregnancy.
During the overall study period, decreases in the prevalence of smoking during pregnancy were observed in 67 counties, increases were observed in 3 counties, and no change was observed in 1 county.* However, between 2005-2007 and 2008-2010, decreases were observed in 42 counties, increases were observed in 26 counties, and no change was observed in 3 counties. (Data for Wisconsin counties are located in Table 5 of the appendix.)
* Data on smoking were not available for Florence County for 2008-2010 due to small sample size.
City of Milwaukee 12.1%

9
Discussion Overall, the prevalence of smoking during pregnancy decreased in both Wisconsin and the United States during the period examined in this study. In the United States, the prevalence of smoking during pregnancy decreased from 18% in 1990 to 9% in 2007. In Wisconsin, the prevalence of smoking during pregnancy decreased from 23% in 1990 to 15% in 2007, and further decreased to 13% in 2010.
This decline in smoking during pregnancy indicates that efforts focused on the reduction of smoking among pregnant women, and in the general population, are having an impact. In fact, the prevalence of smoking among pregnant women in Wisconsin decreased by 41.9% (relative percent change) between 1990 and 2010. However, the majority of this decline (-38.9% relative decrease) occurred during the first 14 years of the study period. Since 2003, there has been little change in maternal smoking in Wisconsin. And despite clear evidence on the risks that smoking pre-sents to both a woman and her unborn child, more than 9,000 women in Wisconsin still smoked during their preg-nancies in 2010.3
In addition, the prevalence of smoking during pregnancy is not equally distributed within Wisconsin’s population. For example, among racial/ethnic groups in Wisconsin, American Indian women were most likely to smoke during their pregnancy, while Hispanic and Laotian/Hmong women were least likely to smoke. Moreover, the differences in the prevalence of smoking during pregnancy between Wisconsin and the United States varied by race/ethnicity. While the prevalence of smoking during pregnancy for non-Hispanic white women in Wisconsin was slightly greater than that observed in the United States overall, the prevalence for each minority group in Wisconsin was twice the na-tional prevalence for each respective group in 2007.
The prevalence of smoking during pregnancy also varied by the age of the woman. In general, younger women (18 to 24 years of age) were more likely to smoke during pregnancy than their older peers. However, this pattern was not consistent across all racial/ethnic groups. Specifically, among black women, older cohorts were more likely to smoke during pregnancy compared to their younger counterparts. Other studies have shown that, in general, the likelihood of a black woman smoking is actually greater among older age groups due to later initiation of smoking and decreased cessation.9 This pattern appears to hold true for pregnant women as well. In addition, the relatively high prevalence of maternal smoking among American Indian women was persistent among women aged 18 to 34 years. Thus, programs designed to reduce the incidence of smoking during pregnancy among specific racial/ethnic groups may need to take these age related differences into account.
Level of educational attainment has traditionally been a strong and consistent predictor of maternal smoking, repre-sented by an inverse association between education and smoking. However, during the two most recent 3-year time periods examined in this study, the prevalence of smoking during pregnancy among women with the lowest level of education (less than a high school degree) dropped below that of women who are high school graduates. Yet, dur-ing 2008-2010, women with a high school education or less were 12 times more likely to smoke than women with a college degree or greater. Women with some college education were 7 times more likely to smoke than women with a college degree.
Marital status and prenatal care also provide important indicators of smoking during pregnancy, especially for physi-cians. Although this report presents no evidence signifying either factor as a cause of smoking during pregnancy, both can be used to identify women who may be in particular need of smoking cessation advice. Specifically, preg-nant women who are not married, and those initiating prenatal care during the later stages of their pregnancy are at greater risk of smoking during pregnancy. Women who do not seek prenatal care at all are also at high risk of smok-ing during pregnancy, and present a unique challenge to the public health system.
Considerable progress has been made in reducing the prevalence of smoking among pregnant women in Wisconsin, and in the United States overall. However, the lofty goal of Healthy People 2010, to increase abstinence from ciga-rettes among pregnant women to 99%, and the goal of Healthiest Wisconsin 2010, to eliminate health [related] dis-parities, are yet to be achieved. It will likely take a concerted, sustained effort among public health agencies, health-care personnel, and other groups working with pregnant women to realize these goals in Wisconsin.

10
Limitations
The relationships presented in this report do not imply causality. The evidence displayed here do not suggest that any specific demographic or behavioral characteristic causes a woman to smoke during pregnancy. There are a number of limitations associated with birth certificate data. The data on smoking are self-reported. Thus, the possibility that women underreport tobacco use during pregnancy exists, particularly if there was a poor birth outcome. In addition, while the wording on the birth certificate has remained the same over the years, it may not be asked in the same manner by each health professional at each hospital. Some health professionals may ask the questions in a way that biases a woman’s self-report of tobacco use.
Technical Notes Maternal cigarette use is based on the mother’s report of smoking during pregnancy. Information on smoking dur-ing pregnancy is obtained from the woman during prenatal care visits or at the time of delivery, and is recorded on the birth certificate by the attending physician, nurse, or other health professional at the time of delivery. Data presented in this report are from the 1989 U.S. Standard Certificate of Live Birth. The 1989 version reports smoking at any time during pregnancy. In 2003, the 1989 version of the birth certificate was revised with regards to how smoking is assessed. The 2003 revision assesses cigarette use during the three months prior to preg-nancy and by each trimester of pregnancy. Wisconsin, along with many other states and reporting areas, contin-ued to use the 1989 version through 2010. However, as more states and reporting areas have begun to use the 2003 revision, comparable U.S data (those using the 1989 birth certificate) are not being reported or published in readily accessible databases. Thus, this report could only include comparable U.S. data through 2007. As of 2007, the 1989 Standard Certificate of Live Birth was used in 24 States, New York City, and Washington, DC. Wisconsin data in this report were accessed from the Wisconsin Interactive Statistics on Health (WISH) website, http://dhfs.wisconsin.gov/wish/. The information in the WISH birth-related modules is from Wisconsin resident birth certificate data. Data were primarily analyzed in seven three-year time periods (1990-1992, 1993-1995, 1996-1998, 1999-2001, 2002-2004, 2005-2007, 2008-2010). United States data used in this report were accessed from several sources, including: - Annual editions of the National Center for Health Statistic’s publication: Health, United States, with Chartbook on Trends in the Health of Americans - U.S. Department of Health and Human Services, Health Resources and Services Administration, Maternal and Child Health Bureau. Women's Health USA 2010. Rockville, Maryland: U.S. Department of Health and Human Services, 2010. Online version available at: http://mchb.hrsa.gov/whusa10/ - The CDC’s National Center for Health Statistics (http://www.cdc.gov/nchs/index.htm) - The CDC’s online database “WONDER” (http://wonder.cdc.gov/) - The CDC’s National Vital Statistics System (http://www.cdc.gov/nchs/nvss.htm) Additional examination of data for the city of Milwaukee showed the prevalence of smoking during pregnancy was 12.1% during 2008-2010.

11
References 1. U.S. Department of Health and Human Services. Women and Smoking: A Report of the Surgeon General.
Rockville, MD: U.S. Department of Health and Human Services, Public Health Service, Office of the Surgeon General; 2001.
2. U.S. Department of Health and Human Services. The Health Consequences of Smoking: A Report of the
Surgeon General. Rockville, MD: U.S. Department of Health and Human Services, Public Health Service, Office of the Surgeon General; 2004.
3. Wisconsin Department of Health and Family Services. Wisconsin Interactive Statistics on Health (WISH).
Available at: http://dhfs.wisconsin.gov/wish/. Last accessed April 27, 2012.
4. Wisconsin Women’s Health Foundation. First Breath. Website: http://www.wwhf.org/pg_firstbreath.asp. Accessed April 20, 2012.
5. U.S. Department of Health and Human Services. Healthy People 2010: Understanding and Improving Health.
Washington, DC: U.S. Government Printing Office; 2000. 6. Wisconsin Department of Health and Family Services. Healthiest Wisconsin 2010: A Partnership Plan to
Improve the Health of the Public; 2002. Available at: http://dhs.wisconsin.gov/statehealthplan/shp-pdf/pph0276phip.pdf. Accessed April 20, 2012.
7. Jovaag AR, Palmersheim KA, Ullsvik JC, Kvale K, Umland MA, Wegner MV. Smoking During Pregnancy in
Wisconsin and the United States: Trends and Patterns, 1990-2004. Madison, Wisconsin: University of Wisconsin Comprehensive Cancer Center, Tobacco Surveillance and Evaluation Program; 2006. Available at: http://sep.uwcarbone.wisc.edu/.
8. Hinterthuer CR, Palmersheim KA. Smoking During Pregnancy in Wisconsin and the United States: An Update
on Trends and Patterns, 1990-2007. Madison, Wisconsin: University of Wisconsin Paul P. Carbone Comprehensive Cancer Center, Tobacco Surveillance and Evaluation Program; 2009. Available at: http://www4.uwm.edu/cuir/research/tobacco-s_e-archive.cfm.
9. Moon-Howard J. African American women and smoking: starting later. Am J Public Health. 2003;93(3): 418-
420.
12
Appendix of Data Tables
Wisconsin United States
1990 22.9% 18.4% 1991 22.5% 17.8% 1992 21.6% 16.9% 1993 20.7% 15.8% 1994 19.6% 14.6% 1995 18.9% 13.9% 1996 18.2% 13.6% 1997 17.9% 13.2% 1998 17.8% 12.9% 1999 17.1% 12.6% 2000 16.5% 12.2% 2001 15.8% 12.0% 2002 14.8% 11.4% 2003 14.0% 10.7% 2004 14.0% 10.3% 2005 13.4% 10.7% 2006 14.9% 10.0% 2007 14.9% 9.3% 2008 14.1% -- 2009 14.2% -- 2010 13.3% --
Relative percent change
1990 to 2007 -34.9%
1990 to 2007 -49.5%
Relative percent change
1990 to 2010 -41.9% --
-- = Comparable data not available
Wisconsin United States
Ratio of Rates Wisconsin : US
Non-Hispanic White 1990 22.5% 21.0% 1.1 1995 18.9% 17.1% 1.1 2000 17.1% 15.6% 1.1 2005 14.3% 13.9% 1.1 2006 15.9% 13.3% 1.2 2007 16.0% 12.7% 1.3
Non-Hispanic Black 1990 29.6% 15.9% 1.9 1995 24.1% 10.6% 2.3 2000 19.6% 9.2% 2.1 2005 14.9% 8.5% 1.8 2006 16.5% 8.0% 2.1 2007 16.6% 7.7% 2.2
American Indian 1990 46.5% 22.4% 2.1 1995 47.1% 20.9% 2.3 2000 39.5% 20.0% 2.0 2005 35.2% 17.8% 2.0 2006 37.7% 16.5% 2.3 2007 35.9% 16.5% 2.2
Hispanic 1990 15.2% 6.7% 2.3 1995 10.2% 4.3% 2.4 2000 6.7% 3.5% 1.9 2005 4.9% 2.9% 1.7 2006 5.5% 2.6% 2.1 2007 5.7% 2.1% 2.7
Laotian/Hmong** 2007 4.5% 1.9% 2.4
* Comparable U.S. data only available through 2007 ** Sample size was too small to be reliable prior to 2007
Table 1. Trends in the prevalence of smoking dur-ing pregnancy, Wisconsin and the United States, 1990-2010
Table 2. Prevalence of smoking during pregnancy by race and ethnicity and the rate ratio, Wisconsin and the United States, 1990, 1995, 2000, and 2005-2007*

13
Tabl
e 3.
Num
ber o
f liv
e bi
rths
, pre
vale
nce
of s
mok
ing
durin
g pr
egna
ncy
and
rela
tive
perc
ent c
hang
e, b
y se
lect
mat
erna
l cha
ract
eris
tics,
W
isco
nsin
, 199
0-19
92, 2
005-
2007
, and
200
8-20
10, b
y th
ree-
year
ave
rage
s
19
90-1
992
2005
-200
7 20
08-2
010
Rel
ativ
e C
hang
e (%
) 19
90-1
992
to
2008
-201
0
Rel
ativ
e C
hang
e (%
) 20
05-2
007
to
2008
-201
0 #
of li
ve
birt
hs
Smok
ing
Prev
alen
ce
# of
live
bi
rths
Sm
okin
g Pr
eval
ence
#
of li
ve
birt
hs
Smok
ing
Prev
alen
ce
Wis
cons
in (t
otal
) 21
5,33
7 22
.3%
21
5,99
3 14
.4%
21
1,19
3 13
.9%
-3
7.7%
-3
.5%
Rac
e/et
hnic
ity
Non
-His
pani
c W
hite
18
0,30
6 22
.0%
16
3,33
9 15
.4%
15
6,90
8 14
.7%
-3
3.2%
-4
.5%
Non
-His
pani
c B
lack
21
,505
28
.7%
20
,965
16
.0%
21
,362
15
.8%
-4
4.9%
-1
.3%
Am
eric
an In
dian
2,
501
48.0
%
3,35
6 36
.3%
3,
432
36.9
%
-23.
1%
1.7%
His
pani
c 5,
934
15.7
%
20,0
34
5.4%
20
,511
5.
8%
-63.
1%
7.4%
Laot
ian
/Hm
ong
3,51
8 --
3,
644
4.6%
3,
988
5.2%
--
13
.0%
Age
Und
er 1
8 7,
658
25.4
%
5,74
8 15
.1%
4,
930
12.7
%
-50.
0%
-15.
9%
18-1
9 yr
s 14
,375
32
.9%
12
,765
24
.4%
12
,168
22
.5%
-3
1.6%
-7
.8%
20-2
4 yr
s 51
,481
30
.0%
50
,562
23
.4%
47
,738
22
.4%
-2
5.3%
-4
.3%
25-2
9 yr
s 71
,832
19
.9%
66
,097
13
.4%
66
,316
13
.2%
-3
3.7%
-1
.5%
30-3
4 yr
s 50
,855
17
.2%
51
,542
8.
0%
52,9
32
8.3%
-5
1.7%
3.
8%
35-3
9 yr
s 16
,630
15
.4%
24
,228
7.
9%
22,2
01
7.7%
-5
0.0%
-2
.5%
40+
yrs
2,49
0 13
.7%
5,
013
8.8%
4,
843
7.6%
-4
6.1%
-1
3.6%
Edu
catio
n
< H
igh
scho
ol
34,9
91
43.1
%
33,0
17
24.8
%
29,5
72
22.6
%
-47.
6%
-8.9
%
Hig
h sc
hool
gra
duat
e 87
,245
26
.9%
61
,723
24
.1%
57
,918
24
.3%
-9
.7%
0.
8%
Som
e co
llege
48
,925
15
.7%
53
,141
12
.4%
55
,397
12
.8%
-1
8.5%
3.
2%
Col
lege
gra
duat
e 42
,400
4.
2%
65,8
62
2.0%
66
,898
1.
8%
-57.
1%
-10.
0%
Mar
ital s
tatu
s
Mar
ried
161,
049
16.3
%
141,
889
7.4%
13
2,68
2 6.
4%
-60.
7%
-13.
5%
Not
Mar
ried
54,2
85
40.2
%
74,0
73
28.0
%
78,3
88
26.5
%
-34.
1%
-5.4
%
Trim
este
r pre
nata
l car
e in
itiat
ed
1st tr
imes
ter
175,
784
20.2
%
181,
194
13.3
%
175,
872
12.8
%
-36.
6%
-3.8
%
2nd o
r 3rd
trim
este
r 37
,590
31
.3%
31
,502
20
.2%
31
,055
18
.9%
-3
9.6%
-6
.4%
No
pren
atal
car
e 1,
679
42.7
%
1,63
3 27
.6%
1,
429
31.4
%
-26.
5%
13.8
%
-- =
dat
a no
t ava
ilabl
e du
e to
sm
all s
ampl
e si
ze

Total live births
2008-2010
Smoking Prevalence 2008-2010
Rank 2008-2010
Smoking Prevalence1990-1992
Smoking Prevalence2005-2007
Relative change (%)
1990-1992 to 2008-2010
Relative change (%)
2005-2007 to 2008-2010
Wisconsin 211,193 13.9% 22.3% 14.4% -37.7% -3.5%
Adams 490 28.8% 65 36.1% 33.2% -20.2% -13.3% Ashland 582 30.2% 67 32.7% 32.4% -7.6% -6.8% Barron 1,550 22.0% 54 25.1% 19.4% -12.4% 13.4% Bayfield 372 23.1% 56 32.0% 25.5% -27.8% -9.4% Brown 10,293 11.5% 12 22.3% 13.6% -48.4% -15.4% Buffalo 411 15.8% 30 17.2% 18.9% -8.1% -16.4% Burnett 430 34.7% 70 33.4% 35.8% 3.9% -3.1% Calumet 1,822 9.0% 4 16.9% 8.6% -46.7% 4.7% Chippewa 2,317 19.9% 45 25.2% 21.8% -21.0% -8.7% Clark 1,750 11.6% 14 20.2% 13.4% -42.6% -13.4% Columbia 1,914 18.8% 40 24.2% 15.5% -22.3% 21.3% Crawford 538 18.0% 38 23.0% 16.0% -21.7% 12.5% Dane 18,399 8.5% 3 16.4% 9.5% -48.2% -10.5% Dodge 2,710 17.4% 35 22.0% 18.9% -20.9% -7.9% Door 739 12.9% 18 19.7% 12.9% -34.5% 0.0% Douglas 1,441 20.4% 48 29.0% 20.8% -29.7% -1.9% Dunn 1,348 15.8% 29 19.7% 16.4% -19.8% -3.7% Eau Claire 3,492 17.0% 34 20.8% 16.6% -18.3% 2.4% Florence 103 -- -- 33.6% 13.7% -- -- Fond du Lac 3,404 11.2% 10 21.8% 14.8% -48.6% -24.3% Forest 321 30.7% 68 35.3% 31.7% -13.0% -3.2% Grant 1,713 12.4% 16 23.7% 13.2% -47.7% -6.1% Green 1,240 16.7% 32 19.5% 15.0% -14.4% 11.3% Green Lake 639 19.7% 43 20.4% 18.1% -3.4% 8.8% Iowa 928 15.4% 26 20.1% 14.8% -23.4% 4.1% Iron 128 28.4% 64 33.5% 23.6% -15.2% 20.3%
14
Table 4. Prevalence of smoking during pregnancy by race/ethnicity and age, Wisconsin, 2008-2010
Non-Hispanic White
Non-Hispanic Black American Indian Hispanic Laotian /Hmong
# of live births
Smoking Prevalence
# of live births
Smoking Prevalence
# of live births
Smoking Prevalence
# of live births
Smoking Prevalence
# of live births
Smoking Prevalence
< 18 yrs 1,858 22.5% 1,605 4.8% 194 27.8% 1,041 5.5% 192 9.4%
18-19 yrs 6,497 33.0% 2,881 9.8% 418 37.8% 1,858 6.8% 389 5.9%
20-24 yrs 31,117 26.9% 7,637 16.3% 1,166 38.8% 5,705 8.3% 1,420 6.4%
25-29 yrs 52,065 13.4% 5,003 20.0% 894 38.9% 5,679 5.4% 1,099 5.3%
30-34 yrs 43,499 8.1% 2,791 18.1% 483 35.6% 4,028 3.7% 536 2.2%
35-39 yrs 17,902 7.6% 1,180 18.7% 233 29.2% 1,834 2.8% 268 --
40+ yrs 3,958 7.6% 256 16.4% 43 27.9% 365 3.6% 84 --
-- = data not available due to small sample size
Table 5. Number of live births, prevalence of smoking during pregnancy, rank, and relative percent change, Wisconsin counties, 1990-1992, 2005-2007, and 2008-2010, by three-year averages
15
Jackson 738 24.4% 59 28.6% 28.0% -14.7% -12.9% Jefferson 2,931 15.5% 27 25.0% 19.1% -38.0% -18.8% Juneau 822 27.2% 63 30.8% 25.8% -11.7% 5.4% Kenosha 6,535 14.4% 22 28.3% 15.4% -49.1% -6.5% Kewaunee 644 10.2% 7 15.8% 13.0% -35.4% -21.5% La Crosse 4,051 14.3% 21 20.4% 16.1% -29.9% -11.2% Lafayette 627 10.5% 8 17.3% 13.1% -39.3% -19.8% Langlade 589 28.9% 66 29.9% 26.0% -3.3% 11.2% Lincoln 920 26.3% 61 26.1% 22.1% 0.8% 19.0% Manitowoc 2,550 19.7% 42 22.7% 21.7% -13.2% -9.2% Marathon 5,003 17.7% 36 16.9% 17.8% 4.7% -0.6% Marinette 1,169 25.2% 60 26.9% 24.2% -6.3% 4.1% Marquette 466 19.7% 44 28.6% 25.3% -31.1% -22.1% Menominee 333 39.0% 71 45.0% 45.2% -13.3% -13.7% Milwaukee 44,926 11.2% 11 24.7% 11.5% -54.7% -2.6% Monroe 1,933 20.2% 47 27.8% 19.2% -27.3% 5.2% Oconto 1,133 20.7% 50 26.7% 20.4% -22.5% 1.5% Oneida 942 21.0% 51 26.1% 22.4% -19.5% -6.3% Outagamie 6,888 12.7% 17 15.4% 11.8% -17.5% 7.6% Ozaukee 2,379 6.8% 1 12.6% 7.1% -46.0% -4.2% Pepin 251 10.8% 9 20.5% 15.8% -47.3% -31.6% Pierce 1,246 9.1% 5 19.2% 13.7% -52.6% -33.6% Polk 1,477 21.8% 53 28.2% 22.8% -22.7% -4.4% Portage 2,276 11.6% 15 17.5% 12.6% -33.7% -7.9% Price 337 18.1% 39 25.3% 16.9% -28.5% 7.1% Racine 7,740 14.7% 23 25.9% 14.0% -43.2% 5.0% Richland 652 16.3% 31 19.7% 19.1% -17.3% -14.7% Rock 6,047 18.0% 37 28.5% 20.2% -36.8% -10.9% Rusk 467 22.5% 55 24.8% 22.5% -9.3% 0.0% St. Croix 3,341 9.2% 6 17.6% 8.9% -47.7% 3.4% Sauk 2,343 23.2% 57 25.8% 21.9% -10.1% 5.9% Sawyer 556 31.3% 69 41.5% 26.3% -24.6% 19.0% Shawano 1,330 21.8% 52 22.0% 23.1% -0.9% -5.6% Sheboygan 4,074 14.1% 20 21.1% 14.2% -33.2% -0.7% Taylor 741 15.0% 24 19.2% 17.2% -21.9% -12.8% Trempealeau 1,157 15.1% 25 24.6% 16.1% -38.6% -6.2% Vernon 1,284 13.5% 19 18.7% 10.8% -27.8% 25.0% Vilas 567 23.5% 58 37.0% 26.1% -36.5% -10.0% Walworth 3,413 15.8% 28 22.9% 15.3% -31.0% 3.3% Washburn 482 26.3% 62 26.3% 26.4% 0.0% -0.4% Washington 4,434 11.6% 13 17.9% 11.6% -35.2% 0.0% Waukesha 11,593 7.5% 2 15.0% 8.2% -50.0% -8.5% Waupaca 1,640 19.4% 41 26.8% 20.2% -27.6% -4.0% Waushara 671 20.6% 49 27.7% 20.5% -25.6% 0.5% Winnebago 5,788 17.0% 33 22.2% 15.7% -23.4% 8.3% Wood 2,633 20.0% 46 22.7% 19.2% -11.9% 4.2% -- = data not available due to small sample size
Table 5. (continued from previous page)