smith county - arp isd - 2000 texas school survey of drug and alcohol use
TRANSCRIPT

8/14/2019 SMITH COUNTY - Arp ISD - 2000 Texas School Survey of Drug and Alcohol Use
http://slidepdf.com/reader/full/smith-county-arp-isd-2000-texas-school-survey-of-drug-and-alcohol-use 1/123

8/14/2019 SMITH COUNTY - Arp ISD - 2000 Texas School Survey of Drug and Alcohol Use
http://slidepdf.com/reader/full/smith-county-arp-isd-2000-texas-school-survey-of-drug-and-alcohol-use 2/123
ArpSpring 2000
______________________________________________________________________________________________
Table T-1: How recently, if ever, have you used...
Past School Ever NeverMonth Year Used Used
_____________________________________________________________________________________Any tobacco product All 14.5% 24.4% 44.6% 55.4%
Grades 7-8 9.6% 18.0% 34.3% 65.7%Grades 9-12 17.0% 27.6% 49.7% 50.3%
_____________________________________________________________________________________Cigarettes All 12.2% 20.2% 41.6% 58.4%
Grades 7-8 7.7% 16.7% 35.1% 64.9%Grades 9-12 14.5% 21.9% 44.8% 55.2%
_____________________________________________________________________________________Smokeless tobacco All 5.1% 8.4% 13.5% 86.5%
Grades 7-8 6.4% 9.9% 12.1% 87.9%Grades 9-12 4.5% 7.7% 14.2% 85.8%
______________________________________________________________________________________________
Table T-2: How often do you normally use...
Any tobacco product?
Several Several About About Less ThanNever Every Times Times Once a Once a Once aUsed Day a Week a Month Month Year Year
All 60.9% 7.6% 3.1% 3.7% 5.4% 2.3% 16.9%Grades 7-8 68.8% 1.8% 4.4% 5.9% 3.7% 1.8% 13.6%Grades 9-12 57.1% 10.4% 2.5% 2.7% 6.2% 2.5% 18.5%
Cigarettes?
Several Several About About Less ThanNever Every Times Times Once a Once a Once aUsed Day a Week a Month Month Year Year
All 62.0% 6.4% 2.5% 4.6% 5.9% 2.3% 16.3%
Grades 7-8 68.0% 1.9% 2.3% 8.3% 3.7% 1.9% 13.9%Grades 9-12 59.2% 8.5% 2.6% 2.9% 7.0% 2.6% 17.4%
Smokeless tobacco?
Several Several About About Less ThanNever Every Times Times Once a Once a Once aUsed Day a Week a Month Month Year Year
All 88.1% 1.4% 1.2% 1.7% 1.8% 1.0% 4.8%Grades 7-8 93.0% * % 2.3% 2.3% * % * % 2.3%Grades 9-12 85.7% 2.2% 0.7% 1.3% 2.7% 1.5% 6.0%
______________________________________________________________________________________________
Table T-3: In the past 30 days, how many cigarettes have you smoked?
>1 But >10 But >1 Pack<1 Per <10 Per <1 Pack But <2 >2 PacksNone Day Day Per Day Packs/Day Per Day
All 83.3% 6.4% 6.0% 1.3% 1.5% 1.4%Grades 7-8 83.7% 3.7% 5.9% * % 2.2% 4.5%Grades 9-12 83.2% 7.6% 6.1% 1.9% 1.2% * %

8/14/2019 SMITH COUNTY - Arp ISD - 2000 Texas School Survey of Drug and Alcohol Use
http://slidepdf.com/reader/full/smith-county-arp-isd-2000-texas-school-survey-of-drug-and-alcohol-use 3/123
ArpSpring 2000
______________________________________________________________________________________________
Table T-4: Average age of first use of:
Grades 7-8 Grades 9-12
Tobacco 10.8 12.1
______________________________________________________________________________________________
Table T-5: If you wanted some, how difficult would it be to get...
Cigarettes?
Never Very Somewhat Somewhat VeryHeard Of Impossible Difficult Difficult Easy Easy
All 9.7% 11.6% 4.9% 9.8% 14.4% 49.6%Grades 7-8 12.9% 20.9% 10.2% 13.6% 15.1% 27.2%Grades 9-12 8.2% 7.5% 2.5% 8.1% 14.1% 59.6%
Smokeless Tobacco?
Never Very Somewhat Somewhat VeryHeard Of Impossible Difficult Difficult Easy Easy
All 17.6% 14.4% 9.2% 8.4% 12.5% 37.8%Grades 7-8 18.2% 31.5% 15.9% 9.6% 9.2% 15.5%Grades 9-12 17.3% 6.1% 6.0% 7.8% 14.1% 48.7%
______________________________________________________________________________________________
Table T-6: About how many of your close friends...
Use any tobacco product?
Never heardNone A Few Some Most All
All 34.2% 29.4% 20.6% 13.6% 2.3%
Grades 7-8 46.0% 30.4% 11.4% 7.7% 4.4%Grades 9-12 28.6% 28.9% 24.9% 16.3% 1.3%
Smoke cigarettes?
Never heardNone A Few Some Most All
All 34.8% 30.9% 19.0% 13.7% 1.6%Grades 7-8 47.1% 31.1% 11.6% 7.9% 2.3%Grades 9-12 29.3% 30.8% 22.4% 16.3% 1.3%
Use a smokeless tobacco product?
Never heardNone A Few Some Most All
All 63.0% 21.3% 13.0% 2.0% 0.7%Grades 7-8 81.2% 8.0% 6.1% 2.3% 2.3%Grades 9-12 54.7% 27.2% 16.2% 1.9% * %

8/14/2019 SMITH COUNTY - Arp ISD - 2000 Texas School Survey of Drug and Alcohol Use
http://slidepdf.com/reader/full/smith-county-arp-isd-2000-texas-school-survey-of-drug-and-alcohol-use 4/123
ArpSpring 2000
______________________________________________________________________________________________
Table T-7: How do your parents feel about kids your age smoking cigarettes?
Strongly Mildly Mildly Strongly Don'tDisapprove Disapprove Neither Approve Approve Know
All 71.3% 6.0% 11.9% 1.9% 1.3% 7.7%Grades 7-8 78.2% 2.0% * % 4.4% 2.4% 12.9%Grades 9-12 68.3% 7.8% 17.1% 0.7% 0.7% 5.4%
______________________________________________________________________________________________
Table T-8: How dangerous do you think it is for kids your age to use tobacco?
Very Somewhat Not Very Not at All Do NotDangerous Dangerous Dangerous Dangerous Know
All 48.4% 25.7% 12.9% 5.1% 7.9%Grades 7-8 61.1% 17.6% 8.7% 2.0% 10.6%Grades 9-12 42.7% 29.3% 14.8% 6.6% 6.7%

8/14/2019 SMITH COUNTY - Arp ISD - 2000 Texas School Survey of Drug and Alcohol Use
http://slidepdf.com/reader/full/smith-county-arp-isd-2000-texas-school-survey-of-drug-and-alcohol-use 5/123

8/14/2019 SMITH COUNTY - Arp ISD - 2000 Texas School Survey of Drug and Alcohol Use
http://slidepdf.com/reader/full/smith-county-arp-isd-2000-texas-school-survey-of-drug-and-alcohol-use 6/123
ArpSpring 2000
______________________________________________________________________________________________
Table A-1: How recently, if ever, have you used...
Past School Ever NeverMonth Year Used Used
_____________________________________________________________________________________Any alcohol product All 23.9% 40.7% 68.5% 31.5%
Grades 7-8 19.1% 40.1% 72.2% 27.8%Grades 9-12 26.2% 41.0% 66.7% 33.3%
_____________________________________________________________________________________Beer All 12.5% 21.0% 44.6% 55.4%
Grades 7-8 10.5% 17.7% 42.6% 57.4%Grades 9-12 13.5% 22.5% 45.5% 54.5%
_____________________________________________________________________________________Wine coolers All 18.0% 32.9% 57.2% 42.8%
Grades 7-8 10.0% 27.0% 57.5% 42.5%Grades 9-12 21.9% 35.8% 57.1% 42.9%
_____________________________________________________________________________________Wine All 12.4% 21.6% 41.2% 58.8%
Grades 7-8 9.9% 20.3% 40.5% 59.5%Grades 9-12 13.6% 22.3% 41.6% 58.4%
_____________________________________________________________________________________Liquor All 15.1% 30.1% 45.5% 54.5%
Grades 7-8 9.6% 27.2% 39.0% 61.0%Grades 9-12 17.7% 31.5% 48.7% 51.3%
______________________________________________________________________________________________
Table A-2: How often do you normally use...
Any alcohol product?
Several Several About About Less ThanNever Every Times Times Once a Once a Once aUsed Day a Week a Month Month Year Year
All 38.1% 0.9% 3.0% 11.0% 16.4% 12.6% 18.1%Grades 7-8 35.0% * % 2.2% 7.7% 13.6% 17.3% 24.0%Grades 9-12 39.5% 1.3% 3.4% 12.5% 17.7% 10.3% 15.3%
Beer?
Several Several About About Less ThanNever Every Times Times Once a Once a Once aUsed Day a Week a Month Month Year Year
All 55.3% 0.4% 3.2% 7.3% 8.9% 8.9% 15.9%Grades 7-8 53.7% * % 2.4% 3.9% 8.6% 7.8% 23.6%Grades 9-12 56.1% 0.6% 3.5% 8.9% 9.0% 9.4% 12.3%
Wine coolers?
Several Several About About Less ThanNever Every Times Times Once a Once a Once aUsed Day a Week a Month Month Year Year
All 45.2% * % 2.3% 8.9% 16.2% 12.2% 15.3%Grades 7-8 50.0% * % 2.5% 2.0% 13.1% 13.1% 19.2%Grades 9-12 43.1% * % 2.2% 12.0% 17.5% 11.7% 13.5%
Wine?
Several Several About About Less ThanNever Every Times Times Once a Once a Once aUsed Day a Week a Month Month Year Year
All 56.6% * % 2.2% 7.6% 10.9% 10.2% 12.6%Grades 7-8 67.2% * % 2.5% 2.0% 9.0% 6.1% 13.1%Grades 9-12 51.8% * % 2.0% 10.0% 11.7% 12.0% 12.4%

8/14/2019 SMITH COUNTY - Arp ISD - 2000 Texas School Survey of Drug and Alcohol Use
http://slidepdf.com/reader/full/smith-county-arp-isd-2000-texas-school-survey-of-drug-and-alcohol-use 7/123
ArpSpring 2000
______________________________________________________________________________________________
Liquor?
Several Several About About Less ThanNever Every Times Times Once a Once a Once aUsed Day a Week a Month Month Year Year
All 56.6% 0.5% 2.2% 9.3% 11.3% 10.0% 10.1%Grades 7-8 68.3% * % 2.4% 8.4% 4.4% 10.0% 6.4%Grades 9-12 51.3% 0.7% 2.1% 9.7% 14.5% 10.0% 11.7%
______________________________________________________________________________________________
Table A-3: When you drink the following alcoholic beverages, how many drinks do you usuallyhave at one time, on average?
Beer
Never Ever 5 or More 1 to 4 Less Than 1
All 52.7% 47.3% 12.0% 18.0% 17.4%Grades 7-8 46.7% 53.3% 8.4% 19.5% 25.3%Grades 9-12 55.3% 44.7% 13.6% 17.3% 13.8%
Wine Coolers
Never Ever 5 or More 1 to 4 Less Than 1
All 40.2% 59.8% 14.3% 33.6% 11.9%Grades 7-8 35.3% 64.7% 13.8% 30.2% 20.7%Grades 9-12 42.5% 57.5% 14.5% 35.1% 7.8%
Wine
Never Ever 5 or More 1 to 4 Less Than 1
All 52.6% 47.4% 6.9% 23.7% 16.8%Grades 7-8 50.3% 49.7% 8.1% 20.9% 20.7%Grades 9-12 53.7% 46.3% 6.3% 24.9% 15.0%
Liquor
Never Ever 5 or More 1 to 4 Less Than 1
All 53.1% 46.9% 13.5% 22.7% 10.8%Grades 7-8 62.0% 38.0% 12.4% 17.2% 8.3%Grades 9-12 49.0% 51.0% 14.0% 25.1% 11.9%
______________________________________________________________________________________________
Table A-4: During the past twelve months, how often have you had five or more drinks at onetime?
BeerSeveral Several Less Than
Never Ever Times/Week Times/Month Once/Month
All 72.6% 27.4% 1.1% 14.1% 12.2%Grades 7-8 67.9% 32.1% 2.3% 10.2% 19.6%Grades 9-12 74.7% 25.3% 0.6% 15.8% 8.8%

8/14/2019 SMITH COUNTY - Arp ISD - 2000 Texas School Survey of Drug and Alcohol Use
http://slidepdf.com/reader/full/smith-county-arp-isd-2000-texas-school-survey-of-drug-and-alcohol-use 8/123
ArpSpring 2000
______________________________________________________________________________________________
Wine CoolersSeveral Several Less Than
Never Ever Times/Week Times/Month Once/Month
All 63.3% 36.7% 2.3% 16.4% 18.0%Grades 7-8 61.7% 38.3% 4.4% 9.4% 24.5%Grades 9-12 64.0% 36.0% 1.4% 19.8% 14.9%
WineSeveral Several Less Than
Never Ever Times/Week Times/Month Once/Month
All 70.4% 29.6% 2.1% 11.6% 16.0%Grades 7-8 66.4% 33.6% 2.3% 6.4% 24.8%Grades 9-12 72.1% 27.9% 2.0% 14.0% 11.9%
LiquorSeveral Several Less Than
Never Ever Times/Week Times/Month Once/Month
All 66.9% 33.1% 1.8% 16.7% 14.5%Grades 7-8 69.0% 31.0% 4.5% 7.7% 18.8%Grades 9-12 65.9% 34.1% 0.6% 20.9% 12.6%
______________________________________________________________________________________________
Table A-5: Average age of first use of:
Grades 7-8 Grades 9-12
Alcohol 10.9 12.7
______________________________________________________________________________________________
Table A-6: If you wanted some, how difficult would it be to get...
Beer?
Never Very Somewhat Somewhat VeryHeard Of Impossible Difficult Difficult Easy Easy
All 9.4% 9.5% 8.6% 14.5% 18.0% 40.1%Grades 7-8 10.8% 19.6% 10.4% 13.3% 18.8% 27.3%Grades 9-12 8.8% 4.6% 7.8% 15.0% 17.6% 46.3%
Wine coolers?
Never Very Somewhat Somewhat VeryHeard Of Impossible Difficult Difficult Easy Easy
All 10.4% 9.4% 10.6% 11.1% 22.2% 36.3%Grades 7-8 15.4% 19.9% 15.4% 9.5% 21.4% 18.4%Grades 9-12 8.0% 4.6% 8.4% 11.9% 22.6% 44.6%
Wine?
Never Very Somewhat Somewhat VeryHeard Of Impossible Difficult Difficult Easy Easy
All 10.0% 13.4% 11.4% 17.1% 14.3% 33.8%Grades 7-8 12.6% 23.2% 12.2% 17.3% 12.9% 21.8%Grades 9-12 8.7% 8.6% 11.0% 17.0% 15.0% 39.7%

8/14/2019 SMITH COUNTY - Arp ISD - 2000 Texas School Survey of Drug and Alcohol Use
http://slidepdf.com/reader/full/smith-county-arp-isd-2000-texas-school-survey-of-drug-and-alcohol-use 9/123
ArpSpring 2000
______________________________________________________________________________________________
Liquor?
Never Very Somewhat Somewhat VeryHeard Of Impossible Difficult Difficult Easy Easy
All 11.1% 12.5% 12.9% 9.1% 15.8% 38.5%Grades 7-8 15.2% 21.5% 17.7% 3.8% 15.4% 26.4%Grades 9-12 9.2% 8.4% 10.7% 11.6% 16.0% 44.1%
______________________________________________________________________________________________
Table A-7: Since school began in the fall, on how many days (if any) have you...
Attended class while drunk on alcohol?
None 1-3 Days 4-9 Days 10+ Days
All 92.0% 6.2% 1.8% * %Grades 7-8 93.0% 7.0% * % * %Grades 9-12 91.6% 5.9% 2.5% * %
Gotten into trouble with teachers because of your drinking?
None 1-3 Days 4-9 Days 10+ Days
All 98.1% 0.4% 0.7% 0.7%Grades 7-8 95.3% * % 2.4% 2.4%Grades 9-12 99.4% 0.6% * % * %
______________________________________________________________________________________________
Table A-8: School year use of alcohol by absences and conduct problems:
Average days absent due to illness or other reasons:
Alcohol Users: 4.6 days per studentAlcohol Non-users: 3.8 days per student
Average days conduct problems reported:
Alcohol Users: 4.4 days per studentAlcohol Non-users: 2.7 days per student
______________________________________________________________________________________________
Table A-9: During the past twelve months, how many times have you...
Driven a car when you've had a good bit to drink?
None 1-3 Times 4-9 Times 10+ Times
All 93.5% 5.1% * % 1.4%Grades 9-12 93.5% 5.1% * % 1.4%
Gotten into trouble with the police because of drinking?
None 1-3 Times 4-9 Times 10+ Times
All 95.5% 2.3% 2.2% * %Grades 7-8 95.3% 2.3% 2.3% * %Grades 9-12 95.6% 2.2% 2.1% * %

8/14/2019 SMITH COUNTY - Arp ISD - 2000 Texas School Survey of Drug and Alcohol Use
http://slidepdf.com/reader/full/smith-county-arp-isd-2000-texas-school-survey-of-drug-and-alcohol-use 10/123
ArpSpring 2000
______________________________________________________________________________________________
Table A-10: About how many of your close friends use...
Any alcohol product?
Never heardNone A Few Some Most All
All 25.4% 28.9% 21.3% 17.6% 6.8%Grades 7-8 38.1% 24.8% 20.4% 14.5% 2.1%Grades 9-12 19.2% 30.9% 21.7% 19.1% 9.1%
Beer?
Never heardNone A Few Some Most All
All 31.7% 28.8% 24.1% 10.6% 4.8%Grades 7-8 47.1% 23.3% 21.4% 8.3% * %Grades 9-12 24.5% 31.4% 25.4% 11.7% 7.0%
Wine coolers?
Never heardNone A Few Some Most All
All 30.3% 32.9% 19.9% 11.6% 5.3%Grades 7-8 39.3% 31.6% 17.3% 9.7% 2.2%Grades 9-12 25.8% 33.6% 21.2% 12.5% 6.9%
Wine?
Never heardNone A Few Some Most All
All 51.9% 24.8% 13.2% 7.3% 2.8%Grades 7-8 56.4% 27.0% 12.0% 4.6% * %Grades 9-12 49.8% 23.8% 13.8% 8.6% 4.1%
Liquor?
Never heardNone A Few Some Most All
All 40.7% 22.9% 18.5% 13.4% 4.6%Grades 7-8 55.0% 21.4% 15.4% 8.3% * %Grades 9-12 34.3% 23.5% 19.9% 15.7% 6.6%
______________________________________________________________________________________________
Table A-11: During the past twelve months, how many times have you...
Had difficulties of any kind with your friends because of your drinking?
None 1-3 Times 4-9 Times 10+ Times
All 92.4% 5.9% 1.2% 0.5%Grades 7-8 90.9% 6.6% 2.5% * %Grades 9-12 93.0% 5.6% 0.7% 0.7%
Been criticized by someone you were dating because of drinking?
None 1-3 Times 4-9 Times 10+ Times
All 93.6% 3.4% 3.0% * %Grades 7-8 95.2% * % 4.8% * %Grades 9-12 92.8% 5.0% 2.2% * %
8/14/2019 SMITH COUNTY - Arp ISD - 2000 Texas School Survey of Drug and Alcohol Use
http://slidepdf.com/reader/full/smith-county-arp-isd-2000-texas-school-survey-of-drug-and-alcohol-use 11/123
ArpSpring 2000
______________________________________________________________________________________________
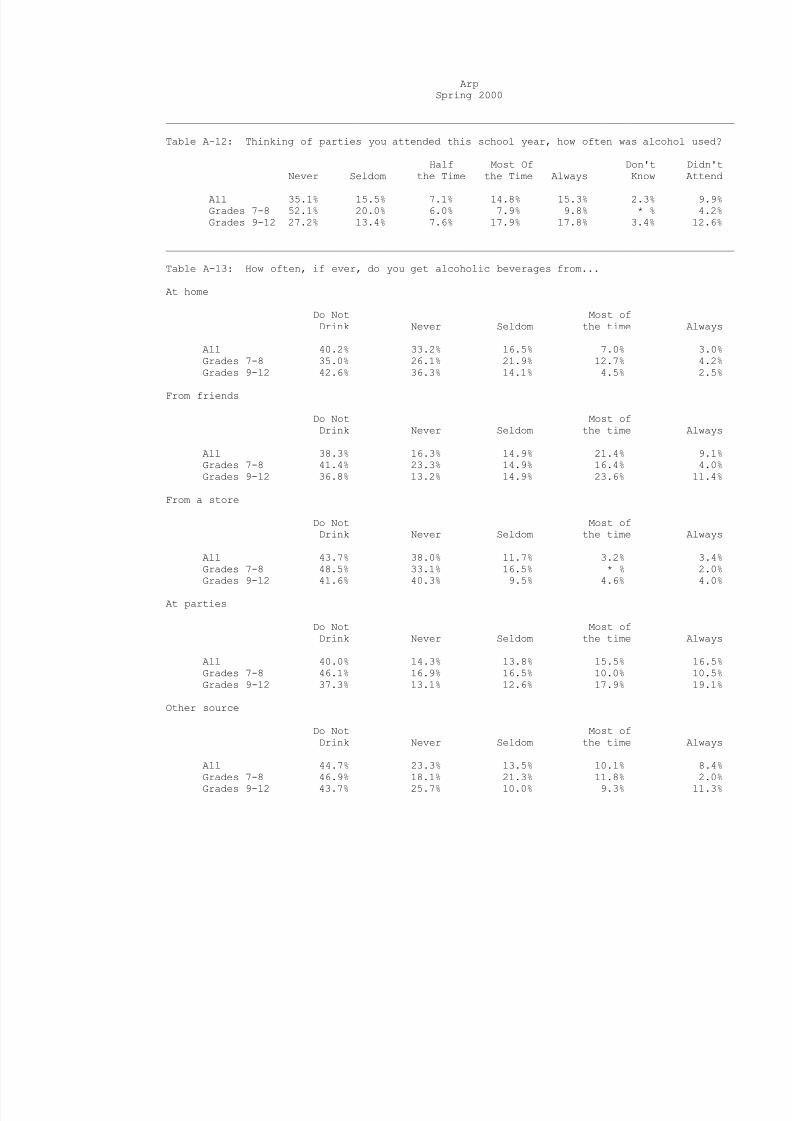
Table A-12: Thinking of parties you attended this school year, how often was alcohol used?
Half Most Of Don't Didn'tNever Seldom the Time the Time Always Know Attend
All 35.1% 15.5% 7.1% 14.8% 15.3% 2.3% 9.9%Grades 7-8 52.1% 20.0% 6.0% 7.9% 9.8% * % 4.2%Grades 9-12 27.2% 13.4% 7.6% 17.9% 17.8% 3.4% 12.6%
______________________________________________________________________________________________
Table A-13: How often, if ever, do you get alcoholic beverages from...
At home
Do Not Most ofDrink Never Seldom the time Always
All 40.2% 33.2% 16.5% 7.0% 3.0%Grades 7-8 35.0% 26.1% 21.9% 12.7% 4.2%Grades 9-12 42.6% 36.3% 14.1% 4.5% 2.5%
From friends
Do Not Most ofDrink Never Seldom the time Always
All 38.3% 16.3% 14.9% 21.4% 9.1%Grades 7-8 41.4% 23.3% 14.9% 16.4% 4.0%Grades 9-12 36.8% 13.2% 14.9% 23.6% 11.4%
From a store
Do Not Most ofDrink Never Seldom the time Always
All 43.7% 38.0% 11.7% 3.2% 3.4%Grades 7-8 48.5% 33.1% 16.5% * % 2.0%
Grades 9-12 41.6% 40.3% 9.5% 4.6% 4.0%
At parties
Do Not Most ofDrink Never Seldom the time Always
All 40.0% 14.3% 13.8% 15.5% 16.5%Grades 7-8 46.1% 16.9% 16.5% 10.0% 10.5%Grades 9-12 37.3% 13.1% 12.6% 17.9% 19.1%
Other source
Do Not Most ofDrink Never Seldom the time Always
All 44.7% 23.3% 13.5% 10.1% 8.4%
Grades 7-8 46.9% 18.1% 21.3% 11.8% 2.0%Grades 9-12 43.7% 25.7% 10.0% 9.3% 11.3%

8/14/2019 SMITH COUNTY - Arp ISD - 2000 Texas School Survey of Drug and Alcohol Use
http://slidepdf.com/reader/full/smith-county-arp-isd-2000-texas-school-survey-of-drug-and-alcohol-use 12/123
ArpSpring 2000
______________________________________________________________________________________________
Table A-14: How do your parents feel about kids your age drinking beer?
Strongly Mildly Mildly Strongly Don'tDisapprove Disapprove Neither Approve Approve Know
All 67.4% 10.6% 12.4% 2.2% 0.8% 6.7%Grades 7-8 73.3% * % 9.3% 4.0% 2.4% 10.9%Grades 9-12 64.8% 15.3% 13.7% 1.3% * % 4.8%
______________________________________________________________________________________________
Table A-15: How dangerous do you think it is for kids your age to use alcohol?
Very Somewhat Not Very Not at All Do NotDangerous Dangerous Dangerous Dangerous Know
All 57.0% 26.0% 7.7% 2.5% 6.8%Grades 7-8 56.5% 27.0% 9.3% 2.2% 4.9%Grades 9-12 57.2% 25.5% 7.1% 2.7% 7.5%

8/14/2019 SMITH COUNTY - Arp ISD - 2000 Texas School Survey of Drug and Alcohol Use
http://slidepdf.com/reader/full/smith-county-arp-isd-2000-texas-school-survey-of-drug-and-alcohol-use 13/123

8/14/2019 SMITH COUNTY - Arp ISD - 2000 Texas School Survey of Drug and Alcohol Use
http://slidepdf.com/reader/full/smith-county-arp-isd-2000-texas-school-survey-of-drug-and-alcohol-use 14/123
ArpSpring 2000
______________________________________________________________________________________________
Table D-1: How recently, if ever, have you used...
Past School Ever NeverMonth Year Used Used
_____________________________________________________________________________________Marijuana? All 6.8% 12.8% 24.2% 75.8%
Grades 7-8 6.2% 11.6% 19.2% 80.8%Grades 9-12 7.1% 13.3% 26.5% 73.5%
_____________________________________________________________________________________Cocaine? All 1.1% 1.8% 4.3% 95.7%
Grades 7-8 2.2% 4.4% 6.6% 93.4%Grades 9-12 0.6% 0.6% 3.2% 96.8%
_____________________________________________________________________________________Crack? All 0.7% 1.4% 2.1% 97.9%
Grades 7-8 2.2% 4.5% 6.7% 93.3%Grades 9-12 * % * % * % 100.0%
_____________________________________________________________________________________Hallucinogens? All * % 1.9% 4.6% 95.4%
Grades 7-8 * % 4.6% 8.7% 91.3%Grades 9-12 * % 0.6% 2.7% 97.3%
_____________________________________________________________________________________Uppers? All 1.4% 3.9% 5.7% 94.3%
Grades 7-8 * % 2.3% 2.3% 97.7%Grades 9-12 2.0% 4.6% 7.2% 92.8%
_____________________________________________________________________________________Downers? All 1.3% 3.4% 4.7% 95.3%
Grades 7-8 * % 2.2% 2.2% 97.8%Grades 9-12 1.9% 4.0% 5.9% 94.1%
_____________________________________________________________________________________Rohypnol? All 0.7% 2.0% 3.4% 96.6%
Grades 7-8 2.4% 2.4% 2.4% 97.6%Grades 9-12 * % 1.9% 3.9% 96.1%
_____________________________________________________________________________________Steroids? All 1.2% 1.7% 3.1% 96.9%
Grades 7-8 2.4% 2.4% 2.4% 97.6%Grades 9-12 0.6% 1.4% 3.4% 96.6%
_____________________________________________________________________________________Ecstasy? All * % 2.4% 2.8% 97.2%
Grades 7-8 * % 4.4% 4.4% 95.6%Grades 9-12 * % 1.4% 2.0% 98.0%_____________________________________________________________________________________Heroin? All * % 0.7% 1.4% 98.6%
Grades 7-8 * % 2.1% 4.3% 95.7%Grades 9-12 * % * % * % 100.0%
______________________________________________________________________________________________
Table D-2: How often do you normally use...
Marijuana?
Several Several About About Less ThanNever Every Times Times Once a Once a Once aUsed Day a Week a Month Month Year Year
All 80.7% 2.6% 2.2% 1.0% 3.3% 4.1% 6.2%Grades 7-8 85.8% * % 2.4% * % 3.9% 3.9% 3.9%Grades 9-12 78.3% 3.9% 2.1% 1.4% 2.9% 4.2% 7.2%
Cocaine?
Several Several About About Less ThanNever Every Times Times Once a Once a Once aUsed Day a Week a Month Month Year Year
All 97.9% * % * % 0.8% * % 0.8% 0.5%Grades 7-8 95.1% * % * % 2.4% * % 2.4% * %Grades 9-12 99.2% * % * % * % * % * % 0.8%

8/14/2019 SMITH COUNTY - Arp ISD - 2000 Texas School Survey of Drug and Alcohol Use
http://slidepdf.com/reader/full/smith-county-arp-isd-2000-texas-school-survey-of-drug-and-alcohol-use 15/123
ArpSpring 2000
______________________________________________________________________________________________
Crack?
Several Several About About Less ThanNever Every Times Times Once a Once a Once aUsed Day a Week a Month Month Year Year
All 99.2% * % * % 0.8% * % * % * %Grades 7-8 97.6% * % * % 2.4% * % * % * %Grades 9-12 100.0% * % * % * % * % * % * %
Hallucinogens?
Several Several About About Less ThanNever Every Times Times Once a Once a Once aUsed Day a Week a Month Month Year Year
All 97.8% * % * % * % 0.8% 0.4% 1.0%Grades 7-8 97.6% * % * % * % 2.4% * % * %Grades 9-12 97.9% * % * % * % * % 0.7% 1.5%
Uppers?
Several Several About About Less ThanNever Every Times Times Once a Once a Once aUsed Day a Week a Month Month Year Year
All 92.4% 0.9% * % 1.0% 1.0% 3.6% 1.1%Grades 7-8 95.0% * % * % * % * % 5.0% * %Grades 9-12 91.2% 1.4% * % 1.5% 1.4% 2.9% 1.6%
Downers?
Several Several About About Less ThanNever Every Times Times Once a Once a Once aUsed Day a Week a Month Month Year Year
All 94.5% 0.5% * % * % 1.0% 2.6% 1.4%Grades 7-8 97.6% * % * % * % * % 2.4% * %
Grades 9-12 93.1% 0.7% * % * % 1.5% 2.7% 2.1%
Rohypnol?
Several Several About About Less ThanNever Every Times Times Once a Once a Once aUsed Day a Week a Month Month Year Year
All 95.6% * % * % 0.5% * % 2.4% 1.5%Grades 7-8 95.2% * % * % * % * % 4.8% * %Grades 9-12 95.9% * % * % 0.7% * % 1.3% 2.1%
Steroids?
Several Several About About Less ThanNever Every Times Times Once a Once a Once aUsed Day a Week a Month Month Year Year
All 97.0% 0.8% * % 0.5% 0.5% 0.8% 0.5%Grades 7-8 95.1% 2.5% * % * % * % 2.5% * %Grades 9-12 97.9% * % * % 0.7% 0.7% * % 0.8%
Ecstasy?
Several Several About About Less ThanNever Every Times Times Once a Once a Once aUsed Day a Week a Month Month Year Year
All 96.9% * % * % 1.3% 0.6% 0.8% 0.5%Grades 7-8 94.6% * % * % 2.7% * % 2.7% * %Grades 9-12 97.9% * % * % 0.7% 0.8% * % 0.7%

8/14/2019 SMITH COUNTY - Arp ISD - 2000 Texas School Survey of Drug and Alcohol Use
http://slidepdf.com/reader/full/smith-county-arp-isd-2000-texas-school-survey-of-drug-and-alcohol-use 16/123
ArpSpring 2000
______________________________________________________________________________________________
Heroin?
Several Several About About Less ThanNever Every Times Times Once a Once a Once aUsed Day a Week a Month Month Year Year
All 97.1% * % * % 0.6% * % 1.6% 0.8%Grades 7-8 91.9% * % * % * % * % 5.4% 2.7%Grades 9-12 99.2% * % * % 0.8% * % * % * %
______________________________________________________________________________________________
Table D-3: Average age of first use of:
Grades 7-8 Grades 9-12
______________________________________________________________________________________________
Table D-4: Age of first use of marijuana by family situation:
Two parent family
Never 9 or Under 10-11 12-13 14-15 16-17 18 or Over
All 79.2% * % * % 6.9% 11.0% 2.9% * %Grades 7-8 88.6% * % * % 7.6% 3.8% * % * %Grades 9-12 75.0% * % * % 6.6% 14.2% 4.2% * %
Other family situation
Never 9 or Under 10-11 12-13 14-15 16-17 18 or Over
All 70.1% 1.8% 0.9% 10.3% 13.2% 2.7% 1.0%Grades 7-8 77.8% * % * % 12.2% 9.9% * % * %Grades 9-12 66.7% 2.6% 1.2% 9.5% 14.6% 3.9% 1.5%
______________________________________________________________________________________________
Table D-5: If you wanted some, how difficult would it be to get...
Marijuana?
Never Very Somewhat Somewhat VeryHeard Of Impossible Difficult Difficult Easy Easy
All 17.1% 26.6% 11.3% 9.6% 11.2% 24.2%Grades 7-8 24.2% 43.9% 7.8% 7.4% 8.8% 7.8%Grades 9-12 13.5% 17.9% 13.1% 10.7% 12.5% 32.4%
Cocaine?
Never Very Somewhat Somewhat VeryHeard Of Impossible Difficult Difficult Easy Easy
All 22.7% 34.1% 20.3% 9.8% 6.4% 6.8%Grades 7-8 25.0% 46.5% 16.9% 7.2% * % 4.4%Grades 9-12 21.5% 27.9% 21.9% 11.1% 9.6% 8.0%

8/14/2019 SMITH COUNTY - Arp ISD - 2000 Texas School Survey of Drug and Alcohol Use
http://slidepdf.com/reader/full/smith-county-arp-isd-2000-texas-school-survey-of-drug-and-alcohol-use 17/123
ArpSpring 2000
______________________________________________________________________________________________
Crack?
Never Very Somewhat Somewhat VeryHeard Of Impossible Difficult Difficult Easy Easy
All 21.3% 35.8% 22.3% 9.3% 5.0% 6.3%Grades 7-8 22.0% 47.6% 24.2% 3.8% * % 2.3%Grades 9-12 20.9% 30.3% 21.4% 11.9% 7.4% 8.2%
Hallucinogens?
Never Very Somewhat Somewhat VeryHeard Of Impossible Difficult Difficult Easy Easy
All 28.6% 31.9% 21.8% 8.0% 4.2% 5.5%Grades 7-8 26.1% 42.8% 16.5% 10.2% * % 4.3%Grades 9-12 29.8% 26.9% 24.2% 6.9% 6.2% 6.1%
Uppers?
Never Very Somewhat Somewhat VeryHeard Of Impossible Difficult Difficult Easy Easy
All 38.0% 24.5% 16.6% 7.9% 3.8% 9.3%Grades 7-8 36.2% 38.3% 11.8% 9.2% * % 4.5%Grades 9-12 38.8% 17.7% 19.0% 7.2% 5.7% 11.6%
Downers?
Never Very Somewhat Somewhat VeryHeard Of Impossible Difficult Difficult Easy Easy
All 38.5% 24.4% 16.7% 7.8% 4.9% 7.7%Grades 7-8 37.2% 35.7% 11.6% 9.0% 2.2% 4.4%Grades 9-12 39.1% 18.8% 19.2% 7.3% 6.2% 9.4%
Rohypnol?
Never Very Somewhat Somewhat VeryHeard Of Impossible Difficult Difficult Easy Easy
All 47.4% 25.6% 13.7% 3.6% 2.8% 7.0%Grades 7-8 34.8% 39.2% 15.8% 5.6% * % 4.6%Grades 9-12 53.4% 19.1% 12.6% 2.6% 4.1% 8.1%
Steroids?
Never Very Somewhat Somewhat VeryHeard Of Impossible Difficult Difficult Easy Easy
All 20.7% 34.2% 19.0% 6.9% 8.6% 10.7%Grades 7-8 20.7% 49.3% 19.3% 6.1% 2.0% 2.5%Grades 9-12 20.7% 27.5% 18.8% 7.3% 11.4% 14.3%
Ecstasy?
Never Very Somewhat Somewhat VeryHeard Of Impossible Difficult Difficult Easy Easy
All 38.5% 27.0% 15.7% 5.6% 5.2% 7.9%Grades 7-8 37.4% 39.9% 12.3% 3.8% 1.9% 4.7%Grades 9-12 39.1% 20.9% 17.3% 6.4% 6.8% 9.5%
8/14/2019 SMITH COUNTY - Arp ISD - 2000 Texas School Survey of Drug and Alcohol Use
http://slidepdf.com/reader/full/smith-county-arp-isd-2000-texas-school-survey-of-drug-and-alcohol-use 18/123
ArpSpring 2000
______________________________________________________________________________________________
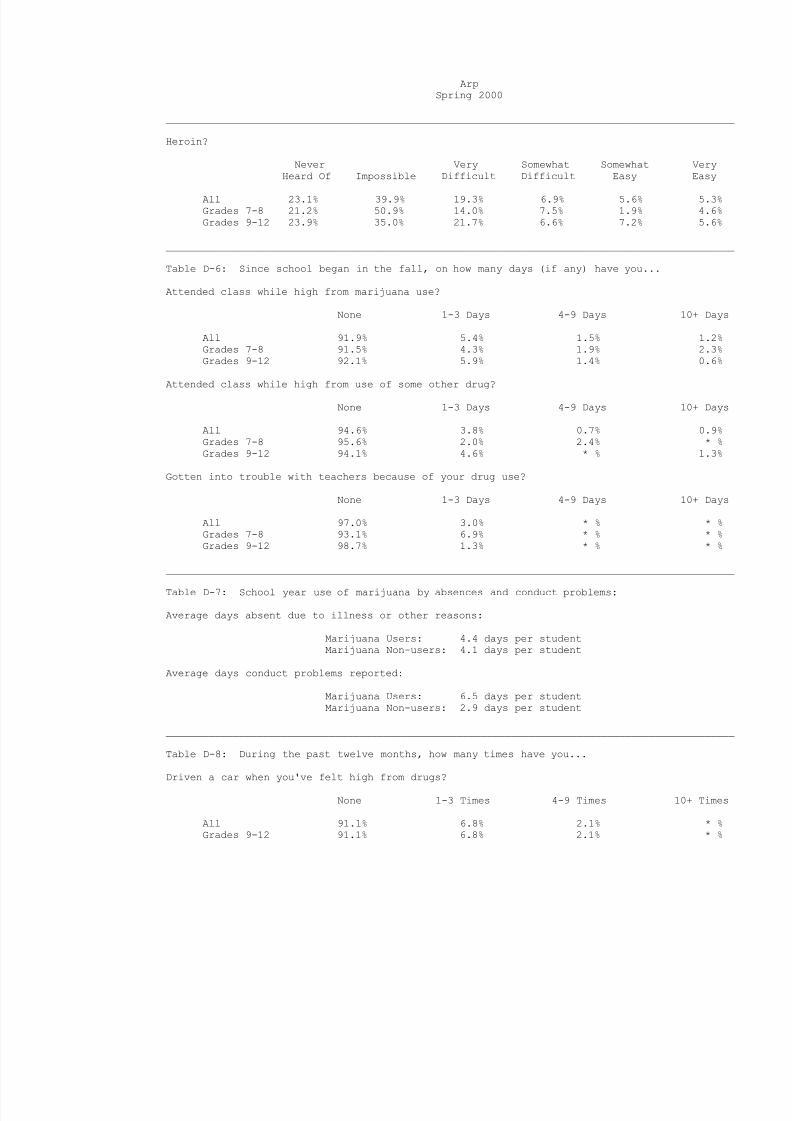
Heroin?
Never Very Somewhat Somewhat VeryHeard Of Impossible Difficult Difficult Easy Easy
All 23.1% 39.9% 19.3% 6.9% 5.6% 5.3%Grades 7-8 21.2% 50.9% 14.0% 7.5% 1.9% 4.6%Grades 9-12 23.9% 35.0% 21.7% 6.6% 7.2% 5.6%
______________________________________________________________________________________________
Table D-6: Since school began in the fall, on how many days (if any) have you...
Attended class while high from marijuana use?
None 1-3 Days 4-9 Days 10+ Days
All 91.9% 5.4% 1.5% 1.2%Grades 7-8 91.5% 4.3% 1.9% 2.3%Grades 9-12 92.1% 5.9% 1.4% 0.6%
Attended class while high from use of some other drug?
None 1-3 Days 4-9 Days 10+ Days
All 94.6% 3.8% 0.7% 0.9%Grades 7-8 95.6% 2.0% 2.4% * %Grades 9-12 94.1% 4.6% * % 1.3%
Gotten into trouble with teachers because of your drug use?
None 1-3 Days 4-9 Days 10+ Days
All 97.0% 3.0% * % * %Grades 7-8 93.1% 6.9% * % * %Grades 9-12 98.7% 1.3% * % * %
______________________________________________________________________________________________
Table D-7: School year use of marijuana by absences and conduct problems:
Average days absent due to illness or other reasons:
Marijuana Users: 4.4 days per studentMarijuana Non-users: 4.1 days per student
Average days conduct problems reported:
Marijuana Users: 6.5 days per studentMarijuana Non-users: 2.9 days per student
______________________________________________________________________________________________
Table D-8: During the past twelve months, how many times have you...
Driven a car when you've felt high from drugs?
None 1-3 Times 4-9 Times 10+ Times
All 91.1% 6.8% 2.1% * %Grades 9-12 91.1% 6.8% 2.1% * %

8/14/2019 SMITH COUNTY - Arp ISD - 2000 Texas School Survey of Drug and Alcohol Use
http://slidepdf.com/reader/full/smith-county-arp-isd-2000-texas-school-survey-of-drug-and-alcohol-use 19/123
ArpSpring 2000
______________________________________________________________________________________________
Gotten into trouble with the police because of drug use?
None 1-3 Times 4-9 Times 10+ Times
All 97.2% 0.4% 1.2% 1.2%Grades 7-8 95.4% * % 2.3% 2.3%Grades 9-12 98.1% 0.6% 0.6% 0.7%
______________________________________________________________________________________________
Table D-9: About how many of your close friends use marijuana?
Never heardNone A Few Some Most All
All 60.4% 20.1% 8.7% 9.3% 1.5%Grades 7-8 76.7% 11.9% 3.7% 5.9% 1.8%Grades 9-12 52.8% 23.9% 11.1% 10.8% 1.4%
______________________________________________________________________________________________
Table D-10: During the past twelve months, how many times have you...
Had difficulties of any kind with your friends because of your drug use?
None 1-3 Times 4-9 Times 10+ Times
All 94.8% 4.0% 1.2% * %Grades 7-8 95.2% 2.4% 2.4% * %Grades 9-12 94.5% 4.8% 0.7% * %
Been criticized by someone you were dating because of drug use?
None 1-3 Times 4-9 Times 10+ Times
All 95.9% 2.4% 1.2% 0.5%Grades 7-8 97.6% * % 2.4% * %Grades 9-12 95.1% 3.5% 0.6% 0.7%
______________________________________________________________________________________________
Table D-11: Thinking of parties you attended this school year, how often was marijuana used?
Half Most Of Don't Didn'tNever Seldom the Time the Time Always Know Attend
All 53.7% 12.4% 8.2% 6.5% 7.0% 2.3% 9.9%Grades 7-8 73.8% 3.8% 8.1% 6.2% 3.8% * % 4.3%Grades 9-12 44.7% 16.3% 8.2% 6.6% 8.4% 3.3% 12.4%
______________________________________________________________________________________________
Table D-12: How often, if ever, do you smoke marijuana in...
Joints?
Half the Most of Don'tNever Seldom Time the Time Always Know
All 77.6% 12.8% 1.3% 6.1% 1.3% 0.8%Grades 7-8 82.2% 11.4% * % 3.5% * % 2.9%Grades 9-12 75.7% 13.3% 1.9% 7.2% 1.9% * %

8/14/2019 SMITH COUNTY - Arp ISD - 2000 Texas School Survey of Drug and Alcohol Use
http://slidepdf.com/reader/full/smith-county-arp-isd-2000-texas-school-survey-of-drug-and-alcohol-use 20/123
ArpSpring 2000
______________________________________________________________________________________________
Blunts?
Half the Most of Don'tNever Seldom Time the Time Always Know
All 77.9% 12.2% 5.3% 1.9% 2.7% * %Grades 7-8 82.2% 14.9% 2.9% * % * % * %Grades 9-12 76.0% 11.0% 6.4% 2.7% 3.9% * %
Bongs or water pipes?
Half the Most of Don'tNever Seldom Time the Time Always Know
All 83.9% 8.1% 4.7% 2.7% * % 0.6%Grades 7-8 82.8% 8.0% 6.5% 2.7% * % * %Grades 9-12 84.3% 8.1% 3.9% 2.7% * % 0.9%
Pipes?
Half the Most of Don'tNever Seldom Time the Time Always Know
All 87.2% 8.7% 2.8% * % 0.7% 0.7%Grades 7-8 90.9% 9.1% * % * % * % * %Grades 9-12 85.6% 8.4% 4.1% * % 1.0% 1.0%
Some other way?
Half the Most of Don'tNever Seldom Time the Time Always Know
All 89.5% 5.8% 0.8% 1.4% 0.6% 1.8%Grades 7-8 88.7% 8.6% 2.7% * % * % * %Grades 9-12 89.9% 4.5% * % 2.1% 0.9% 2.7%
______________________________________________________________________________________________
Table D-13: How do your parents feel about kids your age using marijuana?
Strongly Mildly Mildly Strongly Don'tDisapprove Disapprove Neither Approve Approve Know
All 82.9% 2.5% 5.8% 1.1% 1.3% 6.6%Grades 7-8 82.1% * % 2.5% 2.0% 2.5% 11.0%Grades 9-12 83.2% 3.5% 7.2% 0.6% 0.7% 4.7%
______________________________________________________________________________________________
Table D-14: How dangerous do you think it is for kids your age to use...
Marijuana?
Very Somewhat Not Very Not at All Do NotDangerous Dangerous Dangerous Dangerous Know
All 69.5% 12.3% 9.6% 4.0% 4.6%Grades 7-8 73.7% 6.7% 12.5% 2.1% 5.1%Grades 9-12 67.6% 14.8% 8.3% 4.9% 4.3%

8/14/2019 SMITH COUNTY - Arp ISD - 2000 Texas School Survey of Drug and Alcohol Use
http://slidepdf.com/reader/full/smith-county-arp-isd-2000-texas-school-survey-of-drug-and-alcohol-use 21/123
ArpSpring 2000
______________________________________________________________________________________________
Cocaine?
Very Somewhat Not Very Not at All Do NotDangerous Dangerous Dangerous Dangerous Know
All 84.8% 7.3% * % 2.6% 5.2%Grades 7-8 82.8% 9.5% * % 2.2% 5.5%Grades 9-12 85.7% 6.4% * % 2.8% 5.1%
Crack?
Very Somewhat Not Very Not at All Do NotDangerous Dangerous Dangerous Dangerous Know
All 84.0% 7.4% 0.5% 2.0% 6.1%Grades 7-8 81.4% 9.0% * % 2.1% 7.4%Grades 9-12 85.1% 6.8% 0.7% 2.0% 5.5%
Ecstasy?
Very Somewhat Not Very Not at All Do NotDangerous Dangerous Dangerous Dangerous Know
All 76.5% 9.2% 1.4% 2.5% 10.5%Grades 7-8 78.2% 8.6% * % 2.0% 11.1%Grades 9-12 75.8% 9.4% 2.0% 2.6% 10.2%
Steroids?
Very Somewhat Not Very Not at All Do NotDangerous Dangerous Dangerous Dangerous Know
All 76.1% 10.5% 2.8% 2.1% 8.4%Grades 7-8 76.6% 9.2% * % 2.2% 11.9%Grades 9-12 75.9% 11.1% 4.0% 2.0% 6.9%
Heroin?
Very Somewhat Not Very Not at All Do NotDangerous Dangerous Dangerous Dangerous Know
All 83.9% 4.9% 0.6% 1.8% 8.8%Grades 7-8 80.2% 6.3% 2.1% * % 11.4%Grades 9-12 85.4% 4.4% * % 2.5% 7.7%

8/14/2019 SMITH COUNTY - Arp ISD - 2000 Texas School Survey of Drug and Alcohol Use
http://slidepdf.com/reader/full/smith-county-arp-isd-2000-texas-school-survey-of-drug-and-alcohol-use 22/123
ArpSpring 2000
______________________________________________________________________________________________
Table I-1: How recently, if ever, have you used...
Past School Ever NeverMonth Year Used Used
_____________________________________________________________________________________Any inhalant? All 5.6% 7.8% 14.3% 85.7%
Grades 7-8 12.1% 12.1% 23.1% 76.9%Grades 9-12 2.5% 5.7% 10.1% 89.9%
_____________________________________________________________________________________Liquid or spray paint? All 2.5% 3.3% 9.5% 90.5%
Grades 7-8 6.6% 6.6% 15.9% 84.1%Grades 9-12 0.6% 1.8% 6.4% 93.6%
_____________________________________________________________________________________Whiteout, correction fluid? All 2.2% 4.0% 9.2% 90.8%
Grades 7-8 6.9% 11.1% 19.1% 80.9%Grades 9-12 * % 0.7% 4.7% 95.3%
_____________________________________________________________________________________Gasoline? All 1.7% 2.3% 6.5% 93.5%
Grades 7-8 2.4% 4.4% 8.8% 91.2%Grades 9-12 1.4% 1.4% 5.5% 94.5%
_____________________________________________________________________________________Freon? All * % 1.4% 1.4% 98.6%
Grades 7-8 * % 4.5% 5.9% 94.1%Grades 9-12 * % * % 5.9% 94.1%
_____________________________________________________________________________________Poppers, Locker Room, etc.? All 1.1% 1.1% 2.8% 97.2%
Grades 7-8 2.3% 3.4% 5.7% 94.3%Grades 9-12 0.6% 4.0% 5.4% 94.6%
_____________________________________________________________________________________Glue? All * % 1.9% 4.9% 95.1%
Grades 7-8 * % 4.6% 8.3% 91.7%Grades 9-12 * % 0.6% 3.3% 96.7%
_____________________________________________________________________________________Paint, lacquer thinner, etc.? All 1.4% 3.2% 5.0% 95.0%
Grades 7-8 4.4% 8.5% 8.5% 91.5%Grades 9-12 * % 0.6% 3.4% 96.6%
_____________________________________________________________________________________Nitrous oxide, laughing gas? All 1.0% 2.6% 4.1% 95.9%
Grades 7-8 1.9% 3.8% 5.8% 94.2%Grades 9-12 0.6% 2.0% 3.3% 96.7%_____________________________________________________________________________________Octane booster? All 0.6% 0.6% 0.6% 99.4%
Grades 7-8 1.8% 2.4% 3.0% 97.0%Grades 9-12 * % 2.4% 5.5% 94.5%
_____________________________________________________________________________________Other sprays? All 1.3% 1.7% 3.7% 96.3%
Grades 7-8 4.3% 4.3% 6.2% 93.8%Grades 9-12 * % 0.6% 2.6% 97.4%
_____________________________________________________________________________________Other inhalants? All 1.1% 3.2% 6.8% 93.2%
Grades 7-8 2.2% 6.2% 6.2% 93.8%Grades 9-12 0.6% 1.8% 7.0% 93.0%
______________________________________________________________________________________________
Table I-2: How often do you normally use inhalants?
Several Several About About Less ThanNever Every Times Times Once a Once a Once aUsed Day a Week a Month Month Year Year
All 88.9% * % 0.8% 3.3% 0.4% 2.3% 4.4%Grades 7-8 80.2% * % 2.4% 8.9% * % 4.0% 4.4%Grades 9-12 92.9% * % * % 0.7% 0.7% 1.5% 4.3%

8/14/2019 SMITH COUNTY - Arp ISD - 2000 Texas School Survey of Drug and Alcohol Use
http://slidepdf.com/reader/full/smith-county-arp-isd-2000-texas-school-survey-of-drug-and-alcohol-use 23/123
ArpSpring 2000
______________________________________________________________________________________________
Table I-3: Number of different kinds of inhalants used:
0 1 2-3 4+
All 87.2% 3.9% 3.7% 5.1%Grades 7-8 78.3% 7.0% 5.3% 9.4%Grades 9-12 91.5% 2.4% 2.9% 3.1%
______________________________________________________________________________________________
Table I-4: Average age of first use of:
Grades 7-8 Grades 9-12
______________________________________________________________________________________________
Table I-5: Since school began in the fall, on how many days (if any) have you attendedclass while high from inhalant use?
None 1-3 Days 4-9 Days 10+ Days
All 98.3% 1.3% 0.4% * %Grades 7-8 100.0% * % * % * %Grades 9-12 97.5% 1.8% 0.6% * %
______________________________________________________________________________________________
Table I-6: School year use of inhalants by absences and conduct problems:
Average days absent due to illness or other reasons:
Inhalants Users: 5.3 days per studentInhalants Non-users: 4.0 days per student
Average days conduct problems reported:
Inhalants Users: 12.2 days per student
Inhalants Non-users: 2.6 days per student
______________________________________________________________________________________________
Table I-7: About how many of your close friends use inhalants?
Never heardNone A Few Some Most All
All 83.9% 12.1% 0.6% 3.4% * %Grades 7-8 75.4% 12.1% 1.9% 10.6% * %Grades 9-12 87.9% 12.1% * % * % * %
______________________________________________________________________________________________
Table I-8: How dangerous do you think it is for kids your age to use inhalants?
Very Somewhat Not Very Not at All Do NotDangerous Dangerous Dangerous Dangerous Know
All 75.3% 10.5% 3.5% 1.5% 9.2%Grades 7-8 70.1% 13.4% 6.9% * % 9.6%Grades 9-12 77.6% 9.3% 2.0% 2.1% 9.1%
8/14/2019 SMITH COUNTY - Arp ISD - 2000 Texas School Survey of Drug and Alcohol Use
http://slidepdf.com/reader/full/smith-county-arp-isd-2000-texas-school-survey-of-drug-and-alcohol-use 24/123
ArpSpring 2000
______________________________________________________________________________________________
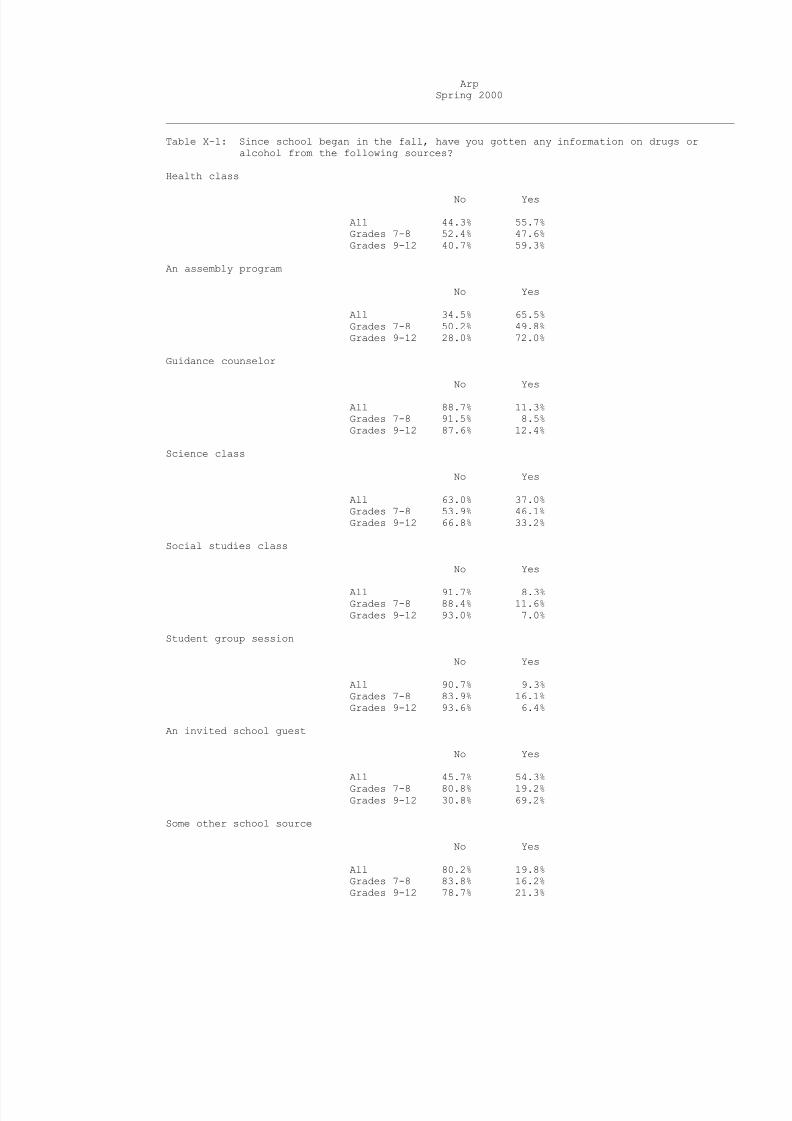
Table X-1: Since school began in the fall, have you gotten any information on drugs oralcohol from the following sources?
Health class
No Yes
All 44.3% 55.7%Grades 7-8 52.4% 47.6%Grades 9-12 40.7% 59.3%
An assembly program
No Yes
All 34.5% 65.5%Grades 7-8 50.2% 49.8%Grades 9-12 28.0% 72.0%
Guidance counselor
No Yes
All 88.7% 11.3%Grades 7-8 91.5% 8.5%Grades 9-12 87.6% 12.4%
Science class
No Yes
All 63.0% 37.0%Grades 7-8 53.9% 46.1%Grades 9-12 66.8% 33.2%
Social studies class
No Yes
All 91.7% 8.3%Grades 7-8 88.4% 11.6%Grades 9-12 93.0% 7.0%
Student group session
No Yes
All 90.7% 9.3%Grades 7-8 83.9% 16.1%Grades 9-12 93.6% 6.4%
An invited school guest
No Yes
All 45.7% 54.3%Grades 7-8 80.8% 19.2%Grades 9-12 30.8% 69.2%
Some other school source
No Yes
All 80.2% 19.8%Grades 7-8 83.8% 16.2%Grades 9-12 78.7% 21.3%

8/14/2019 SMITH COUNTY - Arp ISD - 2000 Texas School Survey of Drug and Alcohol Use
http://slidepdf.com/reader/full/smith-county-arp-isd-2000-texas-school-survey-of-drug-and-alcohol-use 25/123
ArpSpring 2000
______________________________________________________________________________________________
Any school source
No Yes
All 34.2% 65.8%Grades 7-8 48.0% 52.0%Grades 9-12 27.5% 72.5%
______________________________________________________________________________________________
Table X-2: If you had a drug or alcohol problem and needed help, who would you go to?
A counselor or program in school
No Yes
All 73.7% 26.3%Grades 7-8 83.4% 16.6%Grades 9-12 69.5% 30.5%
Another adult in school (such as a nurse or teacher)
No Yes
All 67.3% 32.7%Grades 7-8 78.9% 21.1%Grades 9-12 62.3% 37.7%
A counselor or program outside of school
No Yes
All 69.3% 30.7%Grades 7-8 74.1% 25.9%Grades 9-12 67.4% 32.6%
Your parents
No Yes
All 42.7% 57.3%Grades 7-8 45.2% 54.8%Grades 9-12 41.6% 58.4%
A medical doctor
No Yes
All 59.6% 40.4%Grades 7-8 58.7% 41.3%Grades 9-12 60.0% 40.0%
Your friends
No Yes
All 35.1% 64.9%Grades 7-8 44.7% 55.3%Grades 9-12 31.0% 69.0%

8/14/2019 SMITH COUNTY - Arp ISD - 2000 Texas School Survey of Drug and Alcohol Use
http://slidepdf.com/reader/full/smith-county-arp-isd-2000-texas-school-survey-of-drug-and-alcohol-use 26/123
ArpSpring 2000
______________________________________________________________________________________________
Another adult (a relative, clergyman, or other family friend)
No Yes
All 42.5% 57.5%Grades 7-8 48.8% 51.2%Grades 9-12 39.6% 60.4%
______________________________________________________________________________________________
Table X-3: Since school began in the fall, have you sought help, other than from family orfriends, for problems in any way connected with your use of alcohol, marijuana,or other drugs?
No Yes
All 97.0% 3.0%Grades 7-8 97.8% 2.2%Grades 9-12 96.7% 3.3%
______________________________________________________________________________________________
Table X-4: About how many of your friends:
Feel close to their parents?
None A Few Some Most All
All 4.1% 32.7% 28.3% 27.9% 6.9%Grades 7-8 6.6% 32.5% 29.9% 21.3% 9.8%Grades 9-12 3.0% 32.8% 27.6% 31.0% 5.5%
Sometimes carry weapons?
None A Few Some Most All
All 64.8% 18.7% 8.4% 4.8% 3.3%Grades 7-8 71.7% 10.9% 5.7% 5.7% 6.0%
Grades 9-12 61.4% 22.5% 9.7% 4.4% 2.0%
Care about making good grades?
None A Few Some Most All
All 1.6% 16.7% 23.7% 38.3% 19.8%Grades 7-8 2.2% 17.6% 22.7% 28.6% 28.8%Grades 9-12 1.2% 16.2% 24.1% 42.7% 15.7%
Belong/want to belong to a gang?
None A Few Some Most All
All 81.2% 12.3% 4.3% 1.6% 0.7%Grades 7-8 81.6% 10.4% 3.8% 2.1% 2.1%Grades 9-12 81.0% 13.2% 4.5% 1.3% * %
Wish they could drop out of school?
None A Few Some Most All
All 55.2% 32.6% 6.1% 2.3% 3.8%Grades 7-8 63.6% 24.9% 5.2% 2.1% 4.2%Grades 9-12 51.1% 36.3% 6.5% 2.4% 3.7%

8/14/2019 SMITH COUNTY - Arp ISD - 2000 Texas School Survey of Drug and Alcohol Use
http://slidepdf.com/reader/full/smith-county-arp-isd-2000-texas-school-survey-of-drug-and-alcohol-use 27/123

8/14/2019 SMITH COUNTY - Arp ISD - 2000 Texas School Survey of Drug and Alcohol Use
http://slidepdf.com/reader/full/smith-county-arp-isd-2000-texas-school-survey-of-drug-and-alcohol-use 28/123
ArpSpring 2000
Table B1: Prevalence and recency of use of selected substances by grade--> All students
Past School Ever NeverMonth Year Used Used
_____________________________________________________________________________________Tobacco All 14.5% 24.4% 44.6% 55.4%
Grades 7-8 9.6% 18.0% 34.3% 65.7%Grades 9-12 17.0% 27.6% 49.7% 50.3%
_____________________________________________________________________________________Alcohol All 23.9% 40.7% 68.5% 31.5%
Grades 7-8 19.1% 40.1% 72.2% 27.8%Grades 9-12 26.2% 41.0% 66.7% 33.3%
_____________________________________________________________________________________Inhalants All 5.6% 7.8% 14.3% 85.7%
Grades 7-8 12.1% 12.1% 23.1% 76.9%Grades 9-12 2.5% 5.7% 10.1% 89.9%
_____________________________________________________________________________________Any Illicit Drug All 7.5% 14.2% 25.9% 74.1%
Grades 7-8 5.9% 11.1% 18.4% 81.6%Grades 9-12 8.2% 15.7% 29.4% 70.6%
_____________________________________________________________________________________Marijuana All 6.8% 12.8% 24.2% 75.8%
Grades 7-8 6.2% 11.6% 19.2% 80.8%Grades 9-12 7.1% 13.3% 26.5% 73.5%
_____________________________________________________________________________________Marijuana Only All 3.0% 7.0% 14.2% 85.8%
Grades 7-8 1.7% 6.6% 9.9% 90.1%Grades 9-12 3.7% 7.2% 16.2% 83.8%
_____________________________________________________________________________________Cocaine or Crack All 1.1% 1.8% 4.2% 95.8%
Grades 7-8 2.1% 4.3% 6.4% 93.6%Grades 9-12 0.6% 0.6% 3.2% 96.8%
_____________________________________________________________________________________Cocaine All 1.1% 1.8% 4.3% 95.7%
Grades 7-8 2.2% 4.4% 6.6% 93.4%Grades 9-12 0.6% 0.6% 3.2% 96.8%
_____________________________________________________________________________________Crack All 0.7% 1.4% 2.1% 97.9%
Grades 7-8 2.2% 4.5% 6.7% 93.3%Grades 9-12 * % * % * % 100.0%
_____________________________________________________________________________________
Hallucinogens All * % 1.9% 4.6% 95.4%Grades 7-8 * % 4.6% 8.7% 91.3%Grades 9-12 * % 0.6% 2.7% 97.3%
_____________________________________________________________________________________Uppers All 1.4% 3.9% 5.7% 94.3%
Grades 7-8 * % 2.3% 2.3% 97.7%Grades 9-12 2.0% 4.6% 7.2% 92.8%
_____________________________________________________________________________________Downers All 1.3% 3.4% 4.7% 95.3%
Grades 7-8 * % 2.2% 2.2% 97.8%Grades 9-12 1.9% 4.0% 5.9% 94.1%
_____________________________________________________________________________________Rohypnol All 0.7% 2.0% 3.4% 96.6%
Grades 7-8 2.4% 2.4% 2.4% 97.6%Grades 9-12 * % 1.9% 3.9% 96.1%
_____________________________________________________________________________________Steroids All 1.2% 1.7% 3.1% 96.9%
Grades 7-8 2.4% 2.4% 2.4% 97.6%Grades 9-12 0.6% 1.4% 3.4% 96.6%_____________________________________________________________________________________Ecstasy All * % 2.4% 2.8% 97.2%
Grades 7-8 * % 4.4% 4.4% 95.6%Grades 9-12 * % 1.4% 2.0% 98.0%
_____________________________________________________________________________________Heroin All * % 0.7% 1.4% 98.6%
Grades 7-8 * % 2.1% 4.3% 95.7%Grades 9-12 * % * % * % 100.0%

8/14/2019 SMITH COUNTY - Arp ISD - 2000 Texas School Survey of Drug and Alcohol Use
http://slidepdf.com/reader/full/smith-county-arp-isd-2000-texas-school-survey-of-drug-and-alcohol-use 29/123
ArpSpring 2000
Table B2: Prevalence and recency of use of selected substances by grade--> Male students
Past School Ever NeverMonth Year Used Used
_____________________________________________________________________________________Tobacco All 11.7% 21.8% 41.2% 58.8%
Grades 7-8 4.8% 12.8% 26.4% 73.6%Grades 9-12 14.9% 25.9% 47.9% 52.1%
_____________________________________________________________________________________Alcohol All 18.0% 33.2% 62.0% 38.0%
Grades 7-8 12.8% 38.3% 79.3% 20.7%Grades 9-12 20.3% 30.8% 54.1% 45.9%
_____________________________________________________________________________________Inhalants All 5.1% 6.0% 16.2% 83.8%
Grades 7-8 10.7% 10.7% 29.3% 70.7%Grades 9-12 2.8% 4.1% 10.9% 89.1%
_____________________________________________________________________________________Any Illicit Drug All 4.7% 8.8% 22.0% 78.0%
Grades 7-8 * % 4.2% 13.4% 86.6%Grades 9-12 6.7% 10.8% 25.6% 74.4%
_____________________________________________________________________________________Marijuana All 4.8% 8.9% 22.2% 77.8%
Grades 7-8 * % 4.2% 13.4% 86.6%Grades 9-12 6.8% 11.0% 26.0% 74.0%
_____________________________________________________________________________________Marijuana Only All 3.6% 7.5% 14.5% 85.5%
Grades 7-8 * % 4.0% 4.0% 96.0%Grades 9-12 5.1% 8.9% 18.9% 81.1%
_____________________________________________________________________________________Cocaine or Crack All * % * % 2.4% 97.6%
Grades 7-8 * % * % 5.1% 94.9%Grades 9-12 * % * % 1.3% 98.7%
_____________________________________________________________________________________Cocaine All * % * % 2.5% 97.5%
Grades 7-8 * % * % 5.3% 94.7%Grades 9-12 * % * % 1.3% 98.7%
_____________________________________________________________________________________Crack All * % * % 1.6% 98.4%
Grades 7-8 * % * % 5.1% 94.9%Grades 9-12 * % * % * % 100.0%
_____________________________________________________________________________________
Hallucinogens All * % * % 4.0% 96.0%Grades 7-8 * % * % 9.8% 90.2%Grades 9-12 * % * % 1.6% 98.4%
_____________________________________________________________________________________Uppers All * % * % 2.1% 97.9%
Grades 7-8 * % * % * % 100.0%Grades 9-12 * % * % 3.0% 97.0%
_____________________________________________________________________________________Downers All 1.0% 1.0% 2.9% 97.1%
Grades 7-8 * % * % * % 100.0%Grades 9-12 1.4% 1.4% 4.1% 95.9%
_____________________________________________________________________________________Rohypnol All * % * % 2.2% 97.8%
Grades 7-8 * % * % * % 100.0%Grades 9-12 * % * % 3.1% 96.9%
_____________________________________________________________________________________Steroids All * % 1.1% 3.2% 96.8%
Grades 7-8 * % * % * % 100.0%Grades 9-12 * % 1.5% 4.4% 95.6%_____________________________________________________________________________________Ecstasy All * % * % 0.9% 99.1%
Grades 7-8 * % * % * % 100.0%Grades 9-12 * % * % 1.3% 98.7%
_____________________________________________________________________________________Heroin All * % * % * % 100.0%
Grades 7-8 * % * % * % 100.0%Grades 9-12 * % * % * % 100.0%

8/14/2019 SMITH COUNTY - Arp ISD - 2000 Texas School Survey of Drug and Alcohol Use
http://slidepdf.com/reader/full/smith-county-arp-isd-2000-texas-school-survey-of-drug-and-alcohol-use 30/123
ArpSpring 2000
Table B3: Prevalence and recency of use of selected substances by grade--> Female students
Past School Ever NeverMonth Year Used Used
_____________________________________________________________________________________Tobacco All 16.8% 26.5% 47.4% 52.6%
Grades 7-8 13.1% 21.9% 40.2% 59.8%Grades 9-12 18.8% 29.0% 51.2% 48.8%
_____________________________________________________________________________________Alcohol All 28.7% 46.9% 73.8% 26.2%
Grades 7-8 23.8% 41.5% 67.0% 33.0%Grades 9-12 31.2% 49.7% 77.4% 22.6%
_____________________________________________________________________________________Inhalants All 6.0% 9.2% 12.8% 87.2%
Grades 7-8 13.1% 13.1% 18.9% 81.1%Grades 9-12 2.2% 7.2% 9.5% 90.5%
_____________________________________________________________________________________Any Illicit Drug All 9.7% 18.6% 29.0% 71.0%
Grades 7-8 10.1% 16.0% 21.9% 78.1%Grades 9-12 9.5% 20.0% 32.8% 67.2%
_____________________________________________________________________________________Marijuana All 8.5% 15.9% 25.8% 74.2%
Grades 7-8 10.9% 17.2% 23.6% 76.4%Grades 9-12 7.3% 15.3% 26.9% 73.1%
_____________________________________________________________________________________Marijuana Only All 2.6% 6.7% 13.9% 86.1%
Grades 7-8 2.8% 8.5% 14.2% 85.8%Grades 9-12 2.4% 5.7% 13.7% 86.3%
_____________________________________________________________________________________Cocaine or Crack All 2.0% 3.3% 5.7% 94.3%
Grades 7-8 3.7% 7.4% 7.4% 92.6%Grades 9-12 1.2% 1.2% 4.8% 95.2%
_____________________________________________________________________________________Cocaine All 2.1% 3.3% 5.8% 94.2%
Grades 7-8 3.7% 7.4% 7.4% 92.6%Grades 9-12 1.2% 1.2% 4.9% 95.1%
_____________________________________________________________________________________Crack All 1.3% 2.6% 2.6% 97.4%
Grades 7-8 4.0% 8.0% 8.0% 92.0%Grades 9-12 * % * % * % 100.0%
_____________________________________________________________________________________
Hallucinogens All * % 3.5% 5.1% 94.9%Grades 7-8 * % 8.0% 8.0% 92.0%Grades 9-12 * % 1.2% 3.6% 96.4%
_____________________________________________________________________________________Uppers All 2.5% 7.2% 8.8% 91.2%
Grades 7-8 * % 4.3% 4.3% 95.7%Grades 9-12 3.7% 8.5% 10.9% 89.1%
_____________________________________________________________________________________Downers All 1.6% 5.4% 6.2% 93.8%
Grades 7-8 * % 3.8% 3.8% 96.2%Grades 9-12 2.4% 6.2% 7.4% 92.6%
_____________________________________________________________________________________Rohypnol All 1.3% 3.6% 4.4% 95.6%
Grades 7-8 4.0% 4.0% 4.0% 96.0%Grades 9-12 * % 3.5% 4.7% 95.3%
_____________________________________________________________________________________Steroids All 2.1% 2.1% 2.9% 97.1%
Grades 7-8 4.0% 4.0% 4.0% 96.0%Grades 9-12 1.2% 1.2% 2.4% 97.6%_____________________________________________________________________________________Ecstasy All * % 4.3% 4.3% 95.7%
Grades 7-8 * % 7.4% 7.4% 92.6%Grades 9-12 * % 2.7% 2.7% 97.3%
_____________________________________________________________________________________Heroin All * % 1.3% 2.5% 97.5%
Grades 7-8 * % 3.7% 7.4% 92.6%Grades 9-12 * % * % * % 100.0%

8/14/2019 SMITH COUNTY - Arp ISD - 2000 Texas School Survey of Drug and Alcohol Use
http://slidepdf.com/reader/full/smith-county-arp-isd-2000-texas-school-survey-of-drug-and-alcohol-use 31/123
ArpSpring 2000
Table B4: Prevalence and recency of use of selected substances by grade--> White students
Past School Ever NeverMonth Year Used Used
_____________________________________________________________________________________Tobacco All 17.5% 28.1% 48.6% 51.4%
Grades 7-8 6.0% 20.9% 39.4% 60.6%Grades 9-12 22.5% 31.2% 52.6% 47.4%
_____________________________________________________________________________________Alcohol All 20.9% 40.1% 68.3% 31.7%
Grades 7-8 15.6% 43.1% 75.5% 24.5%Grades 9-12 23.2% 38.8% 65.2% 34.8%
_____________________________________________________________________________________Inhalants All 2.2% 5.1% 12.5% 87.5%
Grades 7-8 3.1% 3.1% 19.2% 80.8%Grades 9-12 1.8% 5.9% 9.7% 90.3%
_____________________________________________________________________________________Any Illicit Drug All 7.0% 15.1% 29.3% 70.7%
Grades 7-8 3.0% 11.9% 20.9% 79.1%Grades 9-12 8.7% 16.5% 33.0% 67.0%
_____________________________________________________________________________________Marijuana All 5.7% 12.5% 26.2% 73.8%
Grades 7-8 3.1% 12.4% 21.7% 78.3%Grades 9-12 6.8% 12.6% 28.2% 71.8%
_____________________________________________________________________________________Marijuana Only All 2.8% 6.7% 15.7% 84.3%
Grades 7-8 2.9% 11.5% 17.3% 82.7%Grades 9-12 2.8% 4.6% 15.0% 85.0%
_____________________________________________________________________________________Cocaine or Crack All 0.7% 0.7% 3.5% 96.5%
Grades 7-8 * % * % * % 100.0%Grades 9-12 1.0% 1.0% 4.9% 95.1%
_____________________________________________________________________________________Cocaine All 0.7% 0.7% 3.5% 96.5%
Grades 7-8 * % * % * % 100.0%Grades 9-12 1.0% 1.0% 5.0% 95.0%
_____________________________________________________________________________________Crack All * % * % * % 100.0%
Grades 7-8 * % * % * % 100.0%Grades 9-12 * % * % * % 100.0%
_____________________________________________________________________________________
Hallucinogens All * % 0.7% 3.0% 97.0%Grades 7-8 * % * % 3.3% 96.7%Grades 9-12 * % 0.9% 2.9% 97.1%
_____________________________________________________________________________________Uppers All 2.2% 5.1% 7.2% 92.8%
Grades 7-8 * % * % * % 100.0%Grades 9-12 3.0% 7.1% 10.0% 90.0%
_____________________________________________________________________________________Downers All 1.4% 3.6% 5.7% 94.3%
Grades 7-8 * % * % * % 100.0%Grades 9-12 2.0% 5.1% 8.1% 91.9%
_____________________________________________________________________________________Rohypnol All * % 2.0% 3.5% 96.5%
Grades 7-8 * % * % * % 100.0%Grades 9-12 * % 2.8% 4.8% 95.2%
_____________________________________________________________________________________Steroids All 0.7% 0.7% 1.4% 98.6%
Grades 7-8 * % * % * % 100.0%Grades 9-12 1.0% 1.0% 2.0% 98.0%_____________________________________________________________________________________Ecstasy All * % 1.5% 2.2% 97.8%
Grades 7-8 * % * % * % 100.0%Grades 9-12 * % 2.1% 3.1% 96.9%
_____________________________________________________________________________________Heroin All * % * % * % 100.0%
Grades 7-8 * % * % * % 100.0%Grades 9-12 * % * % * % 100.0%

8/14/2019 SMITH COUNTY - Arp ISD - 2000 Texas School Survey of Drug and Alcohol Use
http://slidepdf.com/reader/full/smith-county-arp-isd-2000-texas-school-survey-of-drug-and-alcohol-use 32/123
ArpSpring 2000
Table B5: Prevalence and recency of use of selected substances by grade--> Black students
Past School Ever NeverMonth Year Used Used
_____________________________________________________________________________________Tobacco All 8.3% 14.1% 35.4% 64.6%
Grades 7-8 17.2% 17.2% 27.7% 72.3%Grades 9-12 2.3% 12.0% 40.5% 59.5%
_____________________________________________________________________________________Alcohol All 27.9% 41.8% 71.9% 28.1%
Grades 7-8 23.0% 33.5% 65.9% 34.1%Grades 9-12 31.2% 47.4% 76.0% 24.0%
_____________________________________________________________________________________Inhalants All 13.0% 14.5% 17.3% 82.7%
Grades 7-8 29.4% 29.4% 29.4% 70.6%Grades 9-12 2.7% 5.0% 9.7% 90.3%
_____________________________________________________________________________________Any Illicit Drug All 9.6% 14.2% 20.8% 79.2%
Grades 7-8 12.2% 12.2% 18.3% 81.7%Grades 9-12 7.9% 15.4% 22.5% 77.5%
_____________________________________________________________________________________Marijuana All 9.8% 14.5% 21.3% 78.7%
Grades 7-8 13.0% 13.0% 19.5% 80.5%Grades 9-12 7.9% 15.4% 22.5% 77.5%
_____________________________________________________________________________________Marijuana Only All 4.6% 8.9% 13.0% 87.0%
Grades 7-8 * % * % * % 100.0%Grades 9-12 7.5% 14.7% 21.5% 78.5%
_____________________________________________________________________________________Cocaine or Crack All 2.4% 4.8% 7.2% 92.8%
Grades 7-8 6.1% 12.2% 18.3% 81.7%Grades 9-12 * % * % * % 100.0%
_____________________________________________________________________________________Cocaine All 2.4% 4.8% 7.2% 92.8%
Grades 7-8 6.1% 12.2% 18.3% 81.7%Grades 9-12 * % * % * % 100.0%
_____________________________________________________________________________________Crack All 2.5% 4.9% 7.4% 92.6%
Grades 7-8 6.5% 13.0% 19.5% 80.5%Grades 9-12 * % * % * % 100.0%
_____________________________________________________________________________________
Hallucinogens All * % 5.1% 7.7% 92.3%Grades 7-8 * % 13.0% 19.5% 80.5%Grades 9-12 * % * % * % 100.0%
_____________________________________________________________________________________Uppers All * % 2.6% 2.6% 97.4%
Grades 7-8 * % 6.9% 6.9% 93.1%Grades 9-12 * % * % * % 100.0%
_____________________________________________________________________________________Downers All * % 2.5% 2.5% 97.5%
Grades 7-8 * % 6.5% 6.5% 93.5%Grades 9-12 * % * % * % 100.0%
_____________________________________________________________________________________Rohypnol All 2.7% 2.7% 2.7% 97.3%
Grades 7-8 6.9% 6.9% 6.9% 93.1%Grades 9-12 * % * % * % 100.0%
_____________________________________________________________________________________Steroids All 2.5% 4.2% 5.9% 94.1%
Grades 7-8 6.4% 6.4% 6.4% 93.6%Grades 9-12 * % 2.8% 5.6% 94.4%_____________________________________________________________________________________Ecstasy All * % 5.0% 5.0% 95.0%
Grades 7-8 * % 12.8% 12.8% 87.2%Grades 9-12 * % * % * % 100.0%
_____________________________________________________________________________________Heroin All * % 2.4% 4.8% 95.2%
Grades 7-8 * % 6.1% 12.2% 87.8%Grades 9-12 * % * % * % 100.0%

8/14/2019 SMITH COUNTY - Arp ISD - 2000 Texas School Survey of Drug and Alcohol Use
http://slidepdf.com/reader/full/smith-county-arp-isd-2000-texas-school-survey-of-drug-and-alcohol-use 33/123
ArpSpring 2000
Table B6: Prevalence and recency of use of selected substances by grade--> Mexican/American students
Past School Ever NeverMonth Year Used Used
_____________________________________________________________________________________Tobacco All * % * % * % 100.0%
Grades 7-8 * % * % * % 100.0%Grades 9-12 * % * % * % 100.0%
_____________________________________________________________________________________Alcohol All * % * % * % 100.0%
Grades 7-8 * % * % * % 100.0%Grades 9-12 * % * % * % 100.0%
_____________________________________________________________________________________Inhalants All * % * % * % 100.0%
Grades 7-8 * % * % * % 100.0%Grades 9-12 * % * % * % 100.0%
_____________________________________________________________________________________Any Illicit Drug All * % * % * % 100.0%
Grades 7-8 * % * % * % 100.0%Grades 9-12 * % * % * % 100.0%
_____________________________________________________________________________________Marijuana All * % * % * % 100.0%
Grades 7-8 * % * % * % 100.0%Grades 9-12 * % * % * % 100.0%
_____________________________________________________________________________________Marijuana Only All * % * % * % 100.0%
Grades 7-8 * % * % * % 100.0%Grades 9-12 * % * % * % 100.0%
_____________________________________________________________________________________Cocaine or Crack All * % * % * % 100.0%
Grades 7-8 * % * % * % 100.0%Grades 9-12 * % * % * % 100.0%
_____________________________________________________________________________________Cocaine All * % * % * % 100.0%
Grades 7-8 * % * % * % 100.0%Grades 9-12 * % * % * % 100.0%
_____________________________________________________________________________________Crack All * % * % * % 100.0%
Grades 7-8 * % * % * % 100.0%Grades 9-12 * % * % * % 100.0%
_____________________________________________________________________________________
Hallucinogens All * % * % * % 100.0%Grades 7-8 * % * % * % 100.0%Grades 9-12 * % * % * % 100.0%
_____________________________________________________________________________________Uppers All * % * % * % 100.0%
Grades 7-8 * % * % * % 100.0%Grades 9-12 * % * % * % 100.0%
_____________________________________________________________________________________Downers All * % * % * % 100.0%
Grades 7-8 * % * % * % 100.0%Grades 9-12 * % * % * % 100.0%
_____________________________________________________________________________________Rohypnol All * % * % * % 100.0%
Grades 7-8 * % * % * % 100.0%Grades 9-12 * % * % * % 100.0%
_____________________________________________________________________________________Steroids All * % * % * % 100.0%
Grades 7-8 * % * % * % 100.0%Grades 9-12 * % * % * % 100.0%_____________________________________________________________________________________Ecstasy All * % * % * % 100.0%
Grades 7-8 * % * % * % 100.0%Grades 9-12 * % * % * % 100.0%
_____________________________________________________________________________________Heroin All * % * % * % 100.0%
Grades 7-8 * % * % * % 100.0%Grades 9-12 * % * % * % 100.0%

8/14/2019 SMITH COUNTY - Arp ISD - 2000 Texas School Survey of Drug and Alcohol Use
http://slidepdf.com/reader/full/smith-county-arp-isd-2000-texas-school-survey-of-drug-and-alcohol-use 34/123
ArpSpring 2000
Table B7: Prevalence and recency of use of selected substances by grade--> Students reporting A and B grades
Past School Ever NeverMonth Year Used Used
_____________________________________________________________________________________Tobacco All 13.8% 23.3% 47.1% 52.9%
Grades 7-8 9.6% 16.1% 34.9% 65.1%Grades 9-12 15.9% 26.8% 53.0% 47.0%
_____________________________________________________________________________________Alcohol All 24.5% 40.7% 70.0% 30.0%
Grades 7-8 21.9% 42.4% 73.5% 26.5%Grades 9-12 25.8% 39.9% 68.4% 31.6%
_____________________________________________________________________________________Inhalants All 4.2% 7.0% 14.0% 86.0%
Grades 7-8 10.2% 10.2% 22.1% 77.9%Grades 9-12 1.5% 5.5% 10.3% 89.7%
_____________________________________________________________________________________Any Illicit Drug All 7.0% 14.0% 27.0% 73.0%
Grades 7-8 4.9% 11.6% 18.8% 81.2%Grades 9-12 7.9% 15.1% 30.8% 69.2%
_____________________________________________________________________________________Marijuana All 6.5% 12.5% 25.2% 74.8%
Grades 7-8 5.1% 12.0% 19.3% 80.7%Grades 9-12 7.2% 12.8% 27.9% 72.1%
_____________________________________________________________________________________Marijuana Only All 2.8% 6.4% 14.2% 85.8%
Grades 7-8 2.2% 8.7% 10.9% 89.1%Grades 9-12 3.0% 5.3% 15.8% 84.2%
_____________________________________________________________________________________Cocaine or Crack All 0.5% 1.4% 3.9% 96.1%
Grades 7-8 * % 2.8% 5.6% 94.4%Grades 9-12 0.8% 0.8% 3.2% 96.8%
_____________________________________________________________________________________Cocaine All 0.5% 1.4% 4.0% 96.0%
Grades 7-8 * % 2.9% 5.7% 94.3%Grades 9-12 0.8% 0.8% 3.2% 96.8%
_____________________________________________________________________________________Crack All * % 0.9% 1.8% 98.2%
Grades 7-8 * % 2.9% 5.7% 94.3%Grades 9-12 * % * % * % 100.0%
_____________________________________________________________________________________
Hallucinogens All * % 1.4% 4.8% 95.2%Grades 7-8 * % 2.9% 8.1% 91.9%Grades 9-12 * % 0.8% 3.3% 96.7%
_____________________________________________________________________________________Uppers All 1.2% 4.3% 6.6% 93.4%
Grades 7-8 * % 2.9% 2.9% 97.1%Grades 9-12 1.7% 5.0% 8.2% 91.8%
_____________________________________________________________________________________Downers All 1.6% 4.3% 5.9% 94.1%
Grades 7-8 * % 2.8% 2.8% 97.2%Grades 9-12 2.4% 4.9% 7.3% 92.7%
_____________________________________________________________________________________Rohypnol All 0.9% 2.6% 4.3% 95.7%
Grades 7-8 3.0% 3.0% 3.0% 97.0%Grades 9-12 * % 2.4% 4.9% 95.1%
_____________________________________________________________________________________Steroids All 1.5% 2.1% 3.2% 96.8%
Grades 7-8 3.1% 3.1% 3.1% 96.9%Grades 9-12 0.8% 1.7% 3.3% 96.7%_____________________________________________________________________________________Ecstasy All * % 2.1% 2.6% 97.4%
Grades 7-8 * % 2.8% 2.8% 97.2%Grades 9-12 * % 1.7% 2.5% 97.5%
_____________________________________________________________________________________Heroin All * % * % 0.9% 99.1%
Grades 7-8 * % * % 2.7% 97.3%Grades 9-12 * % * % * % 100.0%

8/14/2019 SMITH COUNTY - Arp ISD - 2000 Texas School Survey of Drug and Alcohol Use
http://slidepdf.com/reader/full/smith-county-arp-isd-2000-texas-school-survey-of-drug-and-alcohol-use 35/123
ArpSpring 2000
Table B8: Prevalence and recency of use of selected substances by grade--> Students reporting C, D, and F grades
Past School Ever NeverMonth Year Used Used
_____________________________________________________________________________________Tobacco All 18.0% 28.1% 35.0% 65.0%
Grades 7-8 10.3% 27.1% 35.5% 64.5%Grades 9-12 21.9% 28.6% 34.7% 65.3%
_____________________________________________________________________________________Alcohol All 22.5% 41.0% 60.7% 39.3%
Grades 7-8 10.3% 35.5% 64.5% 35.5%Grades 9-12 28.7% 43.8% 58.8% 41.2%
_____________________________________________________________________________________Inhalants All 11.2% 11.2% 16.1% 83.9%
Grades 7-8 20.5% 20.5% 28.9% 71.1%Grades 9-12 6.6% 6.6% 9.7% 90.3%
_____________________________________________________________________________________Any Illicit Drug All 9.9% 16.0% 22.8% 77.2%
Grades 7-8 10.3% 10.3% 18.7% 81.3%Grades 9-12 9.7% 18.8% 24.9% 75.1%
_____________________________________________________________________________________Marijuana All 8.2% 14.5% 21.6% 78.4%
Grades 7-8 11.4% 11.4% 20.8% 79.2%Grades 9-12 6.7% 15.9% 21.9% 78.1%
_____________________________________________________________________________________Marijuana Only All 4.3% 10.2% 14.9% 85.1%
Grades 7-8 * % * % 7.6% 92.4%Grades 9-12 6.7% 15.9% 18.8% 81.2%
_____________________________________________________________________________________Cocaine or Crack All 3.4% 3.4% 5.5% 94.5%
Grades 7-8 10.3% 10.3% 10.3% 89.7%Grades 9-12 * % * % 3.1% 96.9%
_____________________________________________________________________________________Cocaine All 3.4% 3.4% 5.5% 94.5%
Grades 7-8 10.3% 10.3% 10.3% 89.7%Grades 9-12 * % * % 3.1% 96.9%
_____________________________________________________________________________________Crack All 3.5% 3.5% 3.5% 96.5%
Grades 7-8 11.4% 11.4% 11.4% 88.6%Grades 9-12 * % * % * % 100.0%
_____________________________________________________________________________________
Hallucinogens All * % 3.7% 3.7% 96.3%Grades 7-8 * % 12.6% 12.6% 87.4%Grades 9-12 * % * % * % 100.0%
_____________________________________________________________________________________Uppers All 2.3% 2.3% 2.3% 97.7%
Grades 7-8 * % * % * % 100.0%Grades 9-12 3.1% 3.1% 3.1% 96.9%
_____________________________________________________________________________________Downers All * % * % * % 100.0%
Grades 7-8 * % * % * % 100.0%Grades 9-12 * % * % * % 100.0%
_____________________________________________________________________________________Rohypnol All * % * % * % 100.0%
Grades 7-8 * % * % * % 100.0%Grades 9-12 * % * % * % 100.0%
_____________________________________________________________________________________Steroids All * % * % 2.5% 97.5%
Grades 7-8 * % * % * % 100.0%Grades 9-12 * % * % 3.7% 96.3%_____________________________________________________________________________________Ecstasy All * % 3.6% 3.6% 96.4%
Grades 7-8 * % 11.2% 11.2% 88.8%Grades 9-12 * % * % * % 100.0%
_____________________________________________________________________________________Heroin All * % 3.5% 3.5% 96.5%
Grades 7-8 * % 11.2% 11.2% 88.8%Grades 9-12 * % * % * % 100.0%

8/14/2019 SMITH COUNTY - Arp ISD - 2000 Texas School Survey of Drug and Alcohol Use
http://slidepdf.com/reader/full/smith-county-arp-isd-2000-texas-school-survey-of-drug-and-alcohol-use 36/123
ArpSpring 2000
Table B9: Prevalence and recency of use of selected substances by grade--> Students living with two parents
Past School Ever NeverMonth Year Used Used
_____________________________________________________________________________________Tobacco All 13.3% 22.3% 35.5% 64.5%
Grades 7-8 3.3% 13.4% 23.4% 76.6%Grades 9-12 18.1% 26.6% 41.4% 58.6%
_____________________________________________________________________________________Alcohol All 20.1% 30.4% 61.1% 38.9%
Grades 7-8 21.5% 28.2% 69.2% 30.8%Grades 9-12 19.5% 31.4% 57.2% 42.8%
_____________________________________________________________________________________Inhalants All 2.1% 4.5% 13.2% 86.8%
Grades 7-8 4.1% 4.1% 18.1% 81.9%Grades 9-12 1.1% 4.7% 10.8% 89.2%
_____________________________________________________________________________________Any Illicit Drug All 4.2% 10.5% 21.2% 78.8%
Grades 7-8 3.3% 10.0% 13.4% 86.6%Grades 9-12 4.6% 10.7% 24.9% 75.1%
_____________________________________________________________________________________Marijuana All 3.5% 9.1% 20.1% 79.9%
Grades 7-8 3.5% 10.4% 13.9% 86.1%Grades 9-12 3.5% 8.6% 23.0% 77.0%
_____________________________________________________________________________________Marijuana Only All 2.6% 6.4% 12.7% 87.3%
Grades 7-8 3.3% 10.0% 10.0% 90.0%Grades 9-12 2.3% 4.7% 13.9% 86.1%
_____________________________________________________________________________________Cocaine or Crack All * % * % 1.6% 98.4%
Grades 7-8 * % * % * % 100.0%Grades 9-12 * % * % 2.4% 97.6%
_____________________________________________________________________________________Cocaine All * % * % 1.6% 98.4%
Grades 7-8 * % * % * % 100.0%Grades 9-12 * % * % 2.4% 97.6%
_____________________________________________________________________________________Crack All * % * % * % 100.0%
Grades 7-8 * % * % * % 100.0%Grades 9-12 * % * % * % 100.0%
_____________________________________________________________________________________
Hallucinogens All * % * % 2.9% 97.1%Grades 7-8 * % * % 3.6% 96.4%Grades 9-12 * % * % 2.6% 97.4%
_____________________________________________________________________________________Uppers All 0.8% 2.5% 5.2% 94.8%
Grades 7-8 * % * % * % 100.0%Grades 9-12 1.2% 3.6% 7.5% 92.5%
_____________________________________________________________________________________Downers All * % 1.7% 3.3% 96.7%
Grades 7-8 * % * % * % 100.0%Grades 9-12 * % 2.5% 5.0% 95.0%
_____________________________________________________________________________________Rohypnol All * % 0.8% 3.6% 96.4%
Grades 7-8 * % * % * % 100.0%Grades 9-12 * % 1.2% 5.2% 94.8%
_____________________________________________________________________________________Steroids All 0.8% 1.8% 2.6% 97.4%
Grades 7-8 * % * % * % 100.0%Grades 9-12 1.2% 2.6% 3.9% 96.1%_____________________________________________________________________________________Ecstasy All * % 1.7% 2.6% 97.4%
Grades 7-8 * % * % * % 100.0%Grades 9-12 * % 2.6% 3.8% 96.2%
_____________________________________________________________________________________Heroin All * % * % * % 100.0%
Grades 7-8 * % * % * % 100.0%Grades 9-12 * % * % * % 100.0%

8/14/2019 SMITH COUNTY - Arp ISD - 2000 Texas School Survey of Drug and Alcohol Use
http://slidepdf.com/reader/full/smith-county-arp-isd-2000-texas-school-survey-of-drug-and-alcohol-use 37/123
ArpSpring 2000
Table B10: Prevalence and recency of use of selected substances by grade--> Students not living with two parents
Past School Ever NeverMonth Year Used Used
_____________________________________________________________________________________Tobacco All 15.8% 26.7% 54.2% 45.8%
Grades 7-8 15.9% 22.8% 45.6% 54.4%Grades 9-12 15.7% 28.7% 58.6% 41.4%
_____________________________________________________________________________________Alcohol All 27.8% 51.7% 76.3% 23.7%
Grades 7-8 16.7% 52.5% 75.3% 24.7%Grades 9-12 33.4% 51.3% 76.8% 23.2%
_____________________________________________________________________________________Inhalants All 9.4% 11.4% 15.5% 84.5%
Grades 7-8 21.1% 21.1% 28.6% 71.4%Grades 9-12 3.9% 6.9% 9.4% 90.6%
_____________________________________________________________________________________Any Illicit Drug All 11.1% 18.4% 31.0% 69.0%
Grades 7-8 8.7% 12.3% 23.8% 76.2%Grades 9-12 12.3% 21.4% 34.5% 65.5%
_____________________________________________________________________________________Marijuana All 10.4% 16.7% 28.6% 71.4%
Grades 7-8 9.1% 12.8% 24.9% 75.1%Grades 9-12 11.0% 18.6% 30.4% 69.6%
_____________________________________________________________________________________Marijuana Only All 3.5% 7.7% 15.7% 84.3%
Grades 7-8 * % 3.3% 9.9% 90.1%Grades 9-12 5.2% 10.0% 18.7% 81.3%
_____________________________________________________________________________________Cocaine or Crack All 2.3% 3.8% 7.2% 92.8%
Grades 7-8 4.6% 9.1% 13.7% 86.3%Grades 9-12 1.3% 1.3% 4.1% 95.9%
_____________________________________________________________________________________Cocaine All 2.3% 3.8% 7.2% 92.8%
Grades 7-8 4.6% 9.1% 13.7% 86.3%Grades 9-12 1.3% 1.3% 4.1% 95.9%
_____________________________________________________________________________________Crack All 1.5% 3.0% 4.5% 95.5%
Grades 7-8 4.6% 9.1% 13.7% 86.3%Grades 9-12 * % * % * % 100.0%
_____________________________________________________________________________________
Hallucinogens All * % 4.0% 6.5% 93.5%Grades 7-8 * % 9.5% 14.2% 85.8%Grades 9-12 * % 1.3% 2.7% 97.3%
_____________________________________________________________________________________Uppers All 2.0% 5.4% 6.3% 93.7%
Grades 7-8 * % 4.8% 4.8% 95.2%Grades 9-12 2.8% 5.6% 7.0% 93.0%
_____________________________________________________________________________________Downers All 2.7% 5.3% 6.2% 93.8%
Grades 7-8 * % 4.7% 4.7% 95.3%Grades 9-12 4.0% 5.5% 6.8% 93.2%
_____________________________________________________________________________________Rohypnol All 1.5% 3.3% 3.3% 96.7%
Grades 7-8 5.0% 5.0% 5.0% 95.0%Grades 9-12 * % 2.6% 2.6% 97.4%
_____________________________________________________________________________________Steroids All 1.5% 1.5% 3.5% 96.5%
Grades 7-8 5.2% 5.2% 5.2% 94.8%Grades 9-12 * % * % 2.8% 97.2%_____________________________________________________________________________________Ecstasy All * % 3.1% 3.1% 96.9%
Grades 7-8 * % 9.4% 9.4% 90.6%Grades 9-12 * % * % * % 100.0%
_____________________________________________________________________________________Heroin All * % 1.5% 2.9% 97.1%
Grades 7-8 * % 4.5% 9.0% 91.0%Grades 9-12 * % * % * % 100.0%

8/14/2019 SMITH COUNTY - Arp ISD - 2000 Texas School Survey of Drug and Alcohol Use
http://slidepdf.com/reader/full/smith-county-arp-isd-2000-texas-school-survey-of-drug-and-alcohol-use 38/123
ArpSpring 2000
Table B11: Prevalence and recency of use of selected substances by grade--> Students who would seek help from adults for substance abuse problems
Past School Ever NeverMonth Year Used Used
_____________________________________________________________________________________Tobacco All 13.9% 20.8% 40.5% 59.5%
Grades 7-8 9.1% 17.6% 32.4% 67.6%Grades 9-12 15.7% 22.0% 43.5% 56.5%
_____________________________________________________________________________________Alcohol All 23.2% 40.2% 65.4% 34.6%
Grades 7-8 19.4% 48.4% 68.8% 31.2%Grades 9-12 24.6% 37.2% 64.1% 35.9%
_____________________________________________________________________________________Inhalants All 2.8% 5.8% 11.1% 88.9%
Grades 7-8 6.5% 6.5% 15.3% 84.7%Grades 9-12 1.5% 5.6% 9.6% 90.4%
_____________________________________________________________________________________Any Illicit Drug All 6.7% 12.4% 23.5% 76.5%
Grades 7-8 3.4% 11.9% 17.6% 82.4%Grades 9-12 7.9% 12.5% 25.7% 74.3%
_____________________________________________________________________________________Marijuana All 5.6% 10.1% 20.8% 79.2%
Grades 7-8 3.4% 11.9% 17.6% 82.4%Grades 9-12 6.4% 9.4% 22.0% 78.0%
_____________________________________________________________________________________Marijuana Only All 2.3% 6.3% 14.0% 86.0%
Grades 7-8 * % 8.5% 14.2% 85.8%Grades 9-12 3.2% 5.4% 13.9% 86.1%
_____________________________________________________________________________________Cocaine or Crack All 0.6% 1.5% 3.3% 96.7%
Grades 7-8 * % 3.4% 3.4% 96.6%Grades 9-12 0.8% 0.8% 3.2% 96.8%
_____________________________________________________________________________________Cocaine All 0.6% 1.5% 3.3% 96.7%
Grades 7-8 * % 3.5% 3.5% 96.5%Grades 9-12 0.8% 0.8% 3.2% 96.8%
_____________________________________________________________________________________Crack All * % 0.9% 0.9% 99.1%
Grades 7-8 * % 3.4% 3.4% 96.6%Grades 9-12 * % * % * % 100.0%
_____________________________________________________________________________________
Hallucinogens All * % 1.0% 2.8% 97.2%Grades 7-8 * % 3.5% 3.5% 96.5%Grades 9-12 * % * % 2.5% 97.5%
_____________________________________________________________________________________Uppers All 1.8% 4.6% 7.0% 93.0%
Grades 7-8 * % 3.5% 3.5% 96.5%Grades 9-12 2.5% 5.0% 8.3% 91.7%
_____________________________________________________________________________________Downers All 1.2% 4.0% 5.7% 94.3%
Grades 7-8 * % 3.5% 3.5% 96.5%Grades 9-12 1.6% 4.1% 6.5% 93.5%
_____________________________________________________________________________________Rohypnol All 1.0% 1.5% 3.4% 96.6%
Grades 7-8 3.7% 3.7% 3.7% 96.3%Grades 9-12 * % 0.8% 3.3% 96.7%
_____________________________________________________________________________________Steroids All 1.6% 1.6% 2.1% 97.9%
Grades 7-8 3.8% 3.8% 3.8% 96.2%Grades 9-12 0.8% 0.8% 1.6% 98.4%_____________________________________________________________________________________Ecstasy All * % 1.6% 2.1% 97.9%
Grades 7-8 * % 3.7% 3.7% 96.3%Grades 9-12 * % 0.8% 1.6% 98.4%
_____________________________________________________________________________________Heroin All * % * % 1.0% 99.0%
Grades 7-8 * % * % 3.5% 96.5%Grades 9-12 * % * % * % 100.0%

8/14/2019 SMITH COUNTY - Arp ISD - 2000 Texas School Survey of Drug and Alcohol Use
http://slidepdf.com/reader/full/smith-county-arp-isd-2000-texas-school-survey-of-drug-and-alcohol-use 39/123
ArpSpring 2000
Table B12: Prevalence and recency of use of selected substances by grade--> Students who wouldn't seek help from adults for substance abuse problems
Past School Ever NeverMonth Year Used Used
_____________________________________________________________________________________Tobacco All 16.1% 34.1% 58.7% 41.3%
Grades 7-8 7.3% 19.2% 45.7% 54.3%Grades 9-12 23.6% 46.7% 69.8% 30.2%
_____________________________________________________________________________________Alcohol All 28.7% 41.6% 75.6% 24.4%
Grades 7-8 19.2% 25.2% 73.5% 26.5%Grades 9-12 36.4% 54.8% 77.3% 22.7%
_____________________________________________________________________________________Inhalants All 13.7% 13.7% 24.5% 75.5%
Grades 7-8 20.5% 20.5% 39.7% 60.3%Grades 9-12 7.9% 7.9% 11.5% 88.5%
_____________________________________________________________________________________Any Illicit Drug All 12.7% 23.4% 38.2% 61.8%
Grades 7-8 13.2% 13.2% 26.5% 73.5%Grades 9-12 12.3% 32.4% 48.6% 51.4%
_____________________________________________________________________________________Marijuana All 13.2% 24.3% 39.6% 60.4%
Grades 7-8 14.3% 14.3% 28.6% 71.4%Grades 9-12 12.3% 32.4% 48.6% 51.4%
_____________________________________________________________________________________Marijuana Only All 6.9% 11.1% 17.4% 82.6%
Grades 7-8 6.0% 6.0% 6.0% 94.0%Grades 9-12 7.7% 15.3% 26.6% 73.4%
_____________________________________________________________________________________Cocaine or Crack All 3.5% 3.5% 9.2% 90.8%
Grades 7-8 7.8% 7.8% 15.7% 84.3%Grades 9-12 * % * % 3.9% 96.1%
_____________________________________________________________________________________Cocaine All 3.5% 3.5% 9.2% 90.8%
Grades 7-8 7.8% 7.8% 15.7% 84.3%Grades 9-12 * % * % 3.9% 96.1%
_____________________________________________________________________________________Crack All 3.7% 3.7% 7.5% 92.5%
Grades 7-8 8.5% 8.5% 17.0% 83.0%Grades 9-12 * % * % * % 100.0%
_____________________________________________________________________________________
Hallucinogens All * % 5.9% 12.7% 87.3%Grades 7-8 * % 8.5% 24.0% 76.0%Grades 9-12 * % 3.9% 3.9% 96.1%
_____________________________________________________________________________________Uppers All * % 2.2% 2.2% 97.8%
Grades 7-8 * % * % * % 100.0%Grades 9-12 * % 3.7% 3.7% 96.3%
_____________________________________________________________________________________Downers All 2.3% 2.3% 2.3% 97.7%
Grades 7-8 * % * % * % 100.0%Grades 9-12 4.1% 4.1% 4.1% 95.9%
_____________________________________________________________________________________Rohypnol All * % 4.7% 4.7% 95.3%
Grades 7-8 * % * % * % 100.0%Grades 9-12 * % 8.6% 8.6% 91.4%
_____________________________________________________________________________________Steroids All * % 2.8% 7.9% 92.1%
Grades 7-8 * % * % * % 100.0%Grades 9-12 * % 4.9% 13.9% 86.1%_____________________________________________________________________________________Ecstasy All * % 5.9% 5.9% 94.1%
Grades 7-8 * % 7.3% 7.3% 92.7%Grades 9-12 * % 4.7% 4.7% 95.3%
_____________________________________________________________________________________Heroin All * % 3.4% 3.4% 96.6%
Grades 7-8 * % 7.3% 7.3% 92.7%Grades 9-12 * % * % * % 100.0%
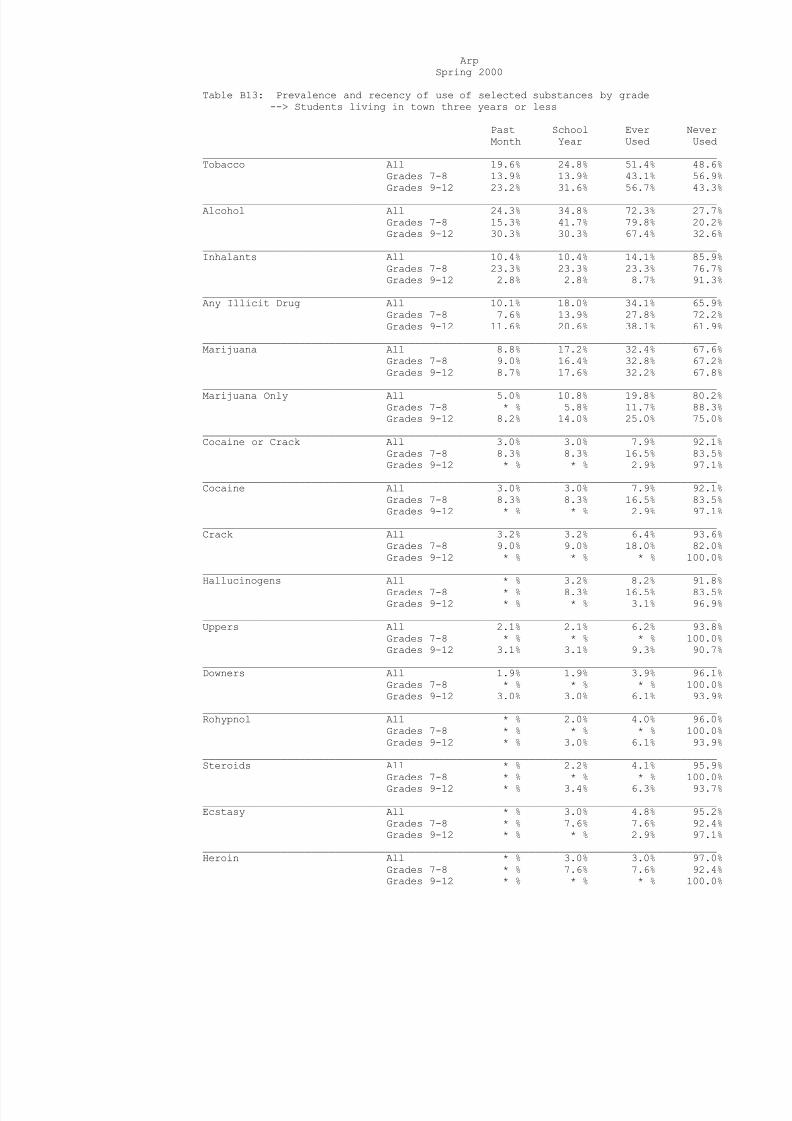
8/14/2019 SMITH COUNTY - Arp ISD - 2000 Texas School Survey of Drug and Alcohol Use
http://slidepdf.com/reader/full/smith-county-arp-isd-2000-texas-school-survey-of-drug-and-alcohol-use 40/123
ArpSpring 2000
Table B13: Prevalence and recency of use of selected substances by grade--> Students living in town three years or less
Past School Ever NeverMonth Year Used Used
_____________________________________________________________________________________Tobacco All 19.6% 24.8% 51.4% 48.6%
Grades 7-8 13.9% 13.9% 43.1% 56.9%Grades 9-12 23.2% 31.6% 56.7% 43.3%
_____________________________________________________________________________________Alcohol All 24.3% 34.8% 72.3% 27.7%
Grades 7-8 15.3% 41.7% 79.8% 20.2%Grades 9-12 30.3% 30.3% 67.4% 32.6%
_____________________________________________________________________________________Inhalants All 10.4% 10.4% 14.1% 85.9%
Grades 7-8 23.3% 23.3% 23.3% 76.7%Grades 9-12 2.8% 2.8% 8.7% 91.3%
_____________________________________________________________________________________Any Illicit Drug All 10.1% 18.0% 34.1% 65.9%
Grades 7-8 7.6% 13.9% 27.8% 72.2%Grades 9-12 11.6% 20.6% 38.1% 61.9%
_____________________________________________________________________________________Marijuana All 8.8% 17.2% 32.4% 67.6%
Grades 7-8 9.0% 16.4% 32.8% 67.2%Grades 9-12 8.7% 17.6% 32.2% 67.8%
_____________________________________________________________________________________Marijuana Only All 5.0% 10.8% 19.8% 80.2%
Grades 7-8 * % 5.8% 11.7% 88.3%Grades 9-12 8.2% 14.0% 25.0% 75.0%
_____________________________________________________________________________________Cocaine or Crack All 3.0% 3.0% 7.9% 92.1%
Grades 7-8 8.3% 8.3% 16.5% 83.5%Grades 9-12 * % * % 2.9% 97.1%
_____________________________________________________________________________________Cocaine All 3.0% 3.0% 7.9% 92.1%
Grades 7-8 8.3% 8.3% 16.5% 83.5%Grades 9-12 * % * % 2.9% 97.1%
_____________________________________________________________________________________Crack All 3.2% 3.2% 6.4% 93.6%
Grades 7-8 9.0% 9.0% 18.0% 82.0%Grades 9-12 * % * % * % 100.0%
_____________________________________________________________________________________
Hallucinogens All * % 3.2% 8.2% 91.8%Grades 7-8 * % 8.3% 16.5% 83.5%Grades 9-12 * % * % 3.1% 96.9%
_____________________________________________________________________________________Uppers All 2.1% 2.1% 6.2% 93.8%
Grades 7-8 * % * % * % 100.0%Grades 9-12 3.1% 3.1% 9.3% 90.7%
_____________________________________________________________________________________Downers All 1.9% 1.9% 3.9% 96.1%
Grades 7-8 * % * % * % 100.0%Grades 9-12 3.0% 3.0% 6.1% 93.9%
_____________________________________________________________________________________Rohypnol All * % 2.0% 4.0% 96.0%
Grades 7-8 * % * % * % 100.0%Grades 9-12 * % 3.0% 6.1% 93.9%
_____________________________________________________________________________________Steroids All * % 2.2% 4.1% 95.9%
Grades 7-8 * % * % * % 100.0%Grades 9-12 * % 3.4% 6.3% 93.7%_____________________________________________________________________________________Ecstasy All * % 3.0% 4.8% 95.2%
Grades 7-8 * % 7.6% 7.6% 92.4%Grades 9-12 * % * % 2.9% 97.1%
_____________________________________________________________________________________Heroin All * % 3.0% 3.0% 97.0%
Grades 7-8 * % 7.6% 7.6% 92.4%Grades 9-12 * % * % * % 100.0%

8/14/2019 SMITH COUNTY - Arp ISD - 2000 Texas School Survey of Drug and Alcohol Use
http://slidepdf.com/reader/full/smith-county-arp-isd-2000-texas-school-survey-of-drug-and-alcohol-use 41/123
ArpSpring 2000
Table B14: Prevalence and recency of use of selected substances by grade--> Students living in town more than three years
Past School Ever NeverMonth Year Used Used
_____________________________________________________________________________________Tobacco All 12.4% 23.0% 41.0% 59.0%
Grades 7-8 5.4% 17.6% 27.4% 72.6%Grades 9-12 15.5% 25.3% 47.0% 53.0%
_____________________________________________________________________________________Alcohol All 23.9% 41.3% 66.3% 33.7%
Grades 7-8 21.7% 38.7% 67.7% 32.3%Grades 9-12 24.9% 42.4% 65.7% 34.3%
_____________________________________________________________________________________Inhalants All 4.3% 7.2% 13.5% 86.5%
Grades 7-8 8.4% 8.4% 23.6% 76.4%Grades 9-12 2.5% 6.6% 9.0% 91.0%
_____________________________________________________________________________________Any Illicit Drug All 6.9% 13.0% 22.9% 77.1%
Grades 7-8 5.4% 10.3% 15.2% 84.8%Grades 9-12 7.6% 14.2% 26.4% 73.6%
_____________________________________________________________________________________Marijuana All 6.4% 11.2% 21.2% 78.8%
Grades 7-8 5.4% 10.3% 15.2% 84.8%Grades 9-12 6.8% 11.7% 23.9% 76.1%
_____________________________________________________________________________________Marijuana Only All 2.5% 5.6% 12.4% 87.6%
Grades 7-8 2.4% 7.3% 9.8% 90.2%Grades 9-12 2.6% 4.8% 13.5% 86.5%
_____________________________________________________________________________________Cocaine or Crack All 0.6% 1.5% 3.2% 96.8%
Grades 7-8 * % 3.0% 3.0% 97.0%Grades 9-12 0.8% 0.8% 3.3% 96.7%
_____________________________________________________________________________________Cocaine All 0.6% 1.5% 3.3% 96.7%
Grades 7-8 * % 3.0% 3.0% 97.0%Grades 9-12 0.8% 0.8% 3.4% 96.6%
_____________________________________________________________________________________Crack All * % 0.9% 0.9% 99.1%
Grades 7-8 * % 3.1% 3.1% 96.9%Grades 9-12 * % * % * % 100.0%
_____________________________________________________________________________________
Hallucinogens All * % 1.5% 2.9% 97.1%Grades 7-8 * % 3.2% 5.9% 94.1%Grades 9-12 * % 0.8% 1.6% 98.4%
_____________________________________________________________________________________Uppers All 1.2% 4.5% 5.0% 95.0%
Grades 7-8 * % 3.1% 3.1% 96.9%Grades 9-12 1.7% 5.0% 5.9% 94.1%
_____________________________________________________________________________________Downers All 1.1% 3.9% 5.0% 95.0%
Grades 7-8 * % 3.0% 3.0% 97.0%Grades 9-12 1.7% 4.3% 5.9% 94.1%
_____________________________________________________________________________________Rohypnol All 1.0% 2.1% 2.7% 97.3%
Grades 7-8 3.2% 3.2% 3.2% 96.8%Grades 9-12 * % 1.6% 2.5% 97.5%
_____________________________________________________________________________________Steroids All 1.6% 1.6% 2.8% 97.2%
Grades 7-8 3.3% 3.3% 3.3% 96.7%Grades 9-12 0.8% 0.8% 2.6% 97.4%_____________________________________________________________________________________Ecstasy All * % 2.2% 2.2% 97.8%
Grades 7-8 * % 3.1% 3.1% 96.9%Grades 9-12 * % 1.8% 1.8% 98.2%
_____________________________________________________________________________________Heroin All * % * % 0.9% 99.1%
Grades 7-8 * % * % 3.0% 97.0%Grades 9-12 * % * % * % 100.0%

8/14/2019 SMITH COUNTY - Arp ISD - 2000 Texas School Survey of Drug and Alcohol Use
http://slidepdf.com/reader/full/smith-county-arp-isd-2000-texas-school-survey-of-drug-and-alcohol-use 42/123
ArpSpring 2000
The FREQ Procedure
GENDER
q1 Frequency Percent_______________________________Female 121.079 54.30Male 101.921 45.70
GRADE
q2 Frequency Percent____________________________________Grade 7 29.18848 13.09Grade 8 43.19895 19.37Grade 9 37.36126 16.75Grade 10 39.11257 17.54Grade 11 41.44764 18.59Grade 12 32.6911 14.66
LIVE WITH BOTH PARENTS
q3 Frequency Percent___________________________________No 108.9976 48.88Yes 114.0024 51.12
AGE
q4 Frequency Percent______________________________________11 or younger 1.459424 0.6612 2.918848 1.3213 33.96183 15.3914 36.72147 16.6415 32.2061 14.5916 41.32485 18.7317 42.124 19.0918 27.93174 12.66
19 or older 2.043194 0.93
Frequency Missing = 2.3085435507
ETHNICITY
q5 Frequency Percent_________________________________________African/American 64.1822 29.28Asian/American 1.459424 0.67Mexican/American 8.497091 3.88Native/American 2.221568 1.01Other 5.989849 2.73White 136.8686 62.43
Frequency Missing = 3.7812351261
The frequencies have been weighted so that theanalysis reflects the distribution of students by grade

8/14/2019 SMITH COUNTY - Arp ISD - 2000 Texas School Survey of Drug and Alcohol Use
http://slidepdf.com/reader/full/smith-county-arp-isd-2000-texas-school-survey-of-drug-and-alcohol-use 43/123

8/14/2019 SMITH COUNTY - Arp ISD - 2000 Texas School Survey of Drug and Alcohol Use
http://slidepdf.com/reader/full/smith-county-arp-isd-2000-texas-school-survey-of-drug-and-alcohol-use 44/123
ArpSpring 2000
The FREQ Procedure
ON AVERAGE WHAT GRADES DO YOU GET
q6 Frequency Percent___________________________________Mostly A's 61.29042 27.88Mostly B's 114.3474 52.02Mostly C's 40.35695 18.36Mostly D's 0.888922 0.40Mostly F's 2.918848 1.33
Frequency Missing = 3.1974654926
LENGTH OF TIME IN THIS DISTRICT
q7 Frequency Percent__________________________________<1 year 19.50089 9.002-3 years 33.12545 15.30>4 years 163.9401 75.70
Frequency Missing = 6.4335729468
DO YOU HAVE A JOB
q8 Frequency Percent___________________________________No 158.7045 73.85Yes 56.19137 26.15
Frequency Missing = 8.1041163838
DO YOU GET AN ALLOWANCE
q9 Frequency Percent___________________________________No 138.4033 64.55Yes 76.00639 35.45
Frequency Missing = 8.5902774261
EITHER PARENT COLLEGE GRADUATE
q10 Frequency Percent___________________________________Don't Know 42.99718 19.89No 73.96539 34.22Yes 99.16603 45.88
Frequency Missing = 6.8714001719
QUALIFY FOR FREE/REDUCED PRICE LUNCH
q11 Frequency Percent___________________________________Don't Know 15.02269 6.89No 109.3007 50.16Yes 93.57568 42.94
Frequency Missing = 5.1009271168
The frequencies have been weighted so that theanalysis reflects the distribution of students by grade

8/14/2019 SMITH COUNTY - Arp ISD - 2000 Texas School Survey of Drug and Alcohol Use
http://slidepdf.com/reader/full/smith-county-arp-isd-2000-texas-school-survey-of-drug-and-alcohol-use 45/123
level in the district

8/14/2019 SMITH COUNTY - Arp ISD - 2000 Texas School Survey of Drug and Alcohol Use
http://slidepdf.com/reader/full/smith-county-arp-isd-2000-texas-school-survey-of-drug-and-alcohol-use 46/123
ArpSpring 2000
The FREQ Procedure
PARTICIPATE IN ATHLETICS
q12a Frequency Percent___________________________________No 64.47744 30.45Yes 147.2593 69.55
Frequency Missing = 11.263253567
PARTICIPATE IN BAND/ORCHESTRA
q12b Frequency Percent___________________________________No 110.1446 58.47Yes 78.24637 41.53
Frequency Missing = 34.609083201
PARTICIPATE IN CHOIR
q12c Frequency Percent___________________________________No 139.1662 76.82Yes 42.00391 23.18
Frequency Missing = 41.829860654
PARTICIPATE IN DRAMA/SPEECH
q12d Frequency Percent___________________________________No 130.975 74.93Yes 43.81986 25.07
Frequency Missing = 48.205094276
PARTICIPATE IN DRILL TEAM/CHEERLEADING q12e Frequency Percent___________________________________No 147.3005 87.20Yes 21.61873 12.80
Frequency Missing = 54.080805268
PARTICIPATE IN STUDENT GOVERNMENT
q12f Frequency Percent___________________________________No 155.7135 92.59Yes 12.45648 7.41
Frequency Missing = 54.829995117
The frequencies have been weighted so that theanalysis reflects the distribution of students by grade

8/14/2019 SMITH COUNTY - Arp ISD - 2000 Texas School Survey of Drug and Alcohol Use
http://slidepdf.com/reader/full/smith-county-arp-isd-2000-texas-school-survey-of-drug-and-alcohol-use 47/123
level in the district

8/14/2019 SMITH COUNTY - Arp ISD - 2000 Texas School Survey of Drug and Alcohol Use
http://slidepdf.com/reader/full/smith-county-arp-isd-2000-texas-school-survey-of-drug-and-alcohol-use 48/123
ArpSpring 2000
The FREQ Procedure
PARTICIPATE IN SCHOOL NEWSPAPER/YEARBOOK
q12g Frequency Percent___________________________________No 150.315 86.65Yes 23.16702 13.35
Frequency Missing = 49.517948647
PARTICIPATE IN ACADEMIC CLUBS/SOCIETIES
q12h Frequency Percent___________________________________No 138.4315 77.74Yes 39.64198 22.26
Frequency Missing = 44.926549667
PARTICIPATE IN SERVICE CLUBS
q12i Frequency Percent___________________________________No 165.1202 96.15Yes 6.605203 3.85
Frequency Missing = 51.274621001
PARTICIPATE IN VOE/DE/WORK-STUDY
q12j Frequency Percent___________________________________No 170.5333 97.32Yes 4.688788 2.68
Frequency Missing = 47.777899863
PARTICIPATE IN OTHER CLUBS q12k Frequency Percent___________________________________No 139.2803 76.72Yes 42.26894 23.28
Frequency Missing = 41.450780502
DO YOU FEEL SAFE IN YOUR HOME
q13a Frequency Percent________________________________________Very Safe 178.869 83.29Somewhat Safe 26.26204 12.23Not Very Safe 3.197465 1.49
Not Safe At All 5.227392 2.43Don't Know 1.199971 0.56
Frequency Missing = 8.2441621293
The frequencies have been weighted so that theanalysis reflects the distribution of students by grade

8/14/2019 SMITH COUNTY - Arp ISD - 2000 Texas School Survey of Drug and Alcohol Use
http://slidepdf.com/reader/full/smith-county-arp-isd-2000-texas-school-survey-of-drug-and-alcohol-use 49/123
level in the district
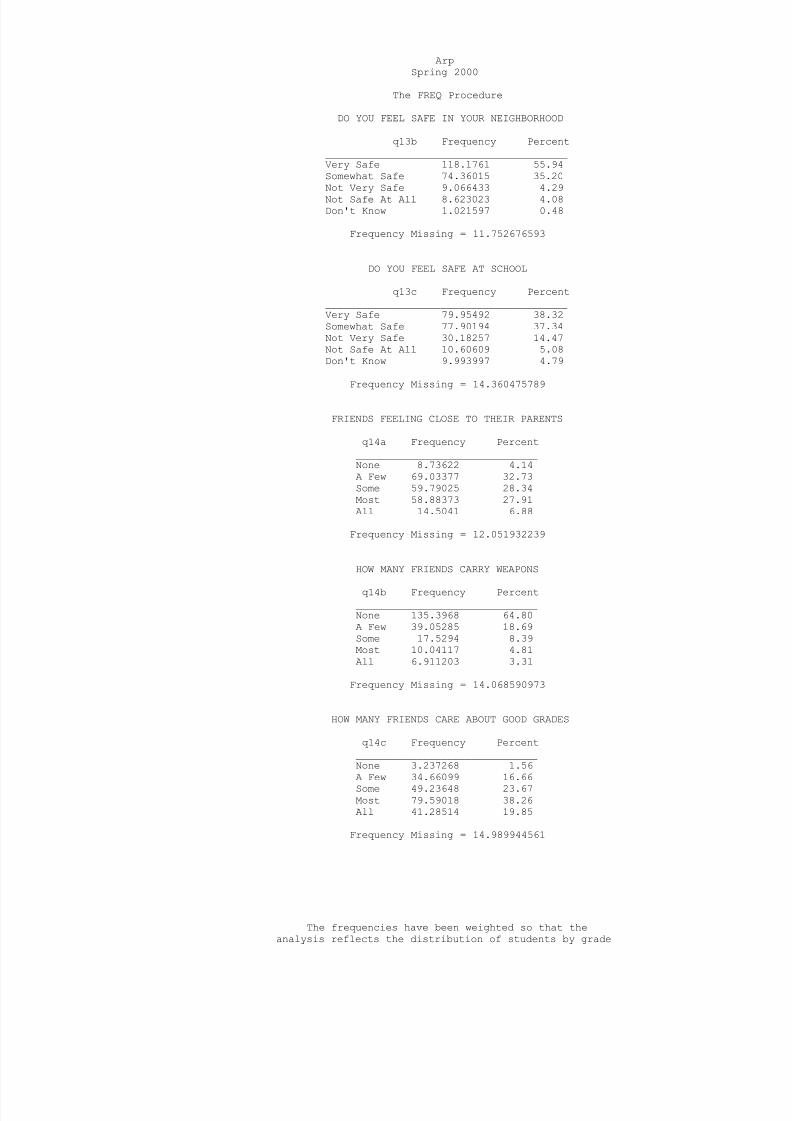
8/14/2019 SMITH COUNTY - Arp ISD - 2000 Texas School Survey of Drug and Alcohol Use
http://slidepdf.com/reader/full/smith-county-arp-isd-2000-texas-school-survey-of-drug-and-alcohol-use 50/123
ArpSpring 2000
The FREQ Procedure
DO YOU FEEL SAFE IN YOUR NEIGHBORHOOD
q13b Frequency Percent________________________________________Very Safe 118.1761 55.94Somewhat Safe 74.36015 35.20Not Very Safe 9.066433 4.29Not Safe At All 8.623023 4.08Don't Know 1.021597 0.48
Frequency Missing = 11.752676593
DO YOU FEEL SAFE AT SCHOOL
q13c Frequency Percent________________________________________Very Safe 79.95492 38.32Somewhat Safe 77.90194 37.34Not Very Safe 30.18257 14.47Not Safe At All 10.60609 5.08Don't Know 9.993997 4.79
Frequency Missing = 14.360475789
FRIENDS FEELING CLOSE TO THEIR PARENTS
q14a Frequency Percent______________________________None 8.73622 4.14A Few 69.03377 32.73Some 59.79025 28.34Most 58.88373 27.91All 14.5041 6.88
Frequency Missing = 12.051932239
HOW MANY FRIENDS CARRY WEAPONS
q14b Frequency Percent______________________________None 135.3968 64.80A Few 39.05285 18.69Some 17.5294 8.39Most 10.04117 4.81All 6.911203 3.31
Frequency Missing = 14.068590973
HOW MANY FRIENDS CARE ABOUT GOOD GRADES
q14c Frequency Percent______________________________None 3.237268 1.56
A Few 34.66099 16.66Some 49.23648 23.67Most 79.59018 38.26All 41.28514 19.85
Frequency Missing = 14.989944561
The frequencies have been weighted so that theanalysis reflects the distribution of students by grade

8/14/2019 SMITH COUNTY - Arp ISD - 2000 Texas School Survey of Drug and Alcohol Use
http://slidepdf.com/reader/full/smith-county-arp-isd-2000-texas-school-survey-of-drug-and-alcohol-use 51/123
level in the district

8/14/2019 SMITH COUNTY - Arp ISD - 2000 Texas School Survey of Drug and Alcohol Use
http://slidepdf.com/reader/full/smith-county-arp-isd-2000-texas-school-survey-of-drug-and-alcohol-use 52/123

8/14/2019 SMITH COUNTY - Arp ISD - 2000 Texas School Survey of Drug and Alcohol Use
http://slidepdf.com/reader/full/smith-county-arp-isd-2000-texas-school-survey-of-drug-and-alcohol-use 53/123
level in the district

8/14/2019 SMITH COUNTY - Arp ISD - 2000 Texas School Survey of Drug and Alcohol Use
http://slidepdf.com/reader/full/smith-county-arp-isd-2000-texas-school-survey-of-drug-and-alcohol-use 54/123

8/14/2019 SMITH COUNTY - Arp ISD - 2000 Texas School Survey of Drug and Alcohol Use
http://slidepdf.com/reader/full/smith-county-arp-isd-2000-texas-school-survey-of-drug-and-alcohol-use 55/123
level in the district

8/14/2019 SMITH COUNTY - Arp ISD - 2000 Texas School Survey of Drug and Alcohol Use
http://slidepdf.com/reader/full/smith-county-arp-isd-2000-texas-school-survey-of-drug-and-alcohol-use 56/123
ArpSpring 2000
The FREQ Procedure
EVER INHALED OCTANE BOOSTER FOR KICKS
q16i Frequency Percent___________________________________________Never Heard/Used 199.9369 99.40In the Past Month 1.199971 0.60
Frequency Missing = 21.863132551
EVER INHALED OTHER SPRAYS FOR KICKS
q16j Frequency Percent___________________________________________Never Heard/Used 196.3305 96.32In Your Lifetime 3.952552 1.94Since School Began 0.881865 0.43In the Past Month 2.659395 1.30
Frequency Missing = 19.175728405
EVER INHALED OTHER INHALANTS FOR KICKS
q16k Frequency Percent___________________________________________Never Heard/Used 194.9557 93.25In Your Lifetime 7.422738 3.55Since School Began 4.390379 2.10In the Past Month 2.308544 1.10
Frequency Missing = 13.922648564
RECENT CIGARETTE USE
q17a Frequency Percent___________________________________________Never Heard/Used 123.5069 58.38In Your Lifetime 45.38448 21.45
Since School Began 16.75926 7.92In the Past Month 25.91361 12.25
Frequency Missing = 11.435730959
RECENT SMOKELESS TOBACCO USE
q17b Frequency Percent___________________________________________Never Heard/Used 181.9643 86.48In Your Lifetime 10.67158 5.07Since School Began 7.055985 3.35In the Past Month 10.71223 5.09
Frequency Missing = 12.595899397
The frequencies have been weighted so that theanalysis reflects the distribution of students by grade

8/14/2019 SMITH COUNTY - Arp ISD - 2000 Texas School Survey of Drug and Alcohol Use
http://slidepdf.com/reader/full/smith-county-arp-isd-2000-texas-school-survey-of-drug-and-alcohol-use 57/123
level in the district

8/14/2019 SMITH COUNTY - Arp ISD - 2000 Texas School Survey of Drug and Alcohol Use
http://slidepdf.com/reader/full/smith-county-arp-isd-2000-texas-school-survey-of-drug-and-alcohol-use 58/123
ArpSpring 2000
The FREQ Procedure
RECENT BEER USE
q17c Frequency Percent___________________________________________Never Heard/Used 114.9049 55.43In Your Lifetime 48.97313 23.62Since School Began 17.48107 8.43In the Past Month 25.95457 12.52
Frequency Missing = 15.686378095
RECENT WINE COOLER USE
q17d Frequency Percent___________________________________________Never Heard/Used 89.29135 42.79In Your Lifetime 50.63747 24.26Since School Began 31.21596 14.96In the Past Month 37.54129 17.99
Frequency Missing = 14.31392979
RECENT WINE USE
q17e Frequency Percent___________________________________________Never Heard/Used 121.6164 58.75In Your Lifetime 40.58397 19.61Since School Began 19.0817 9.22In the Past Month 25.71343 12.42
Frequency Missing = 16.004484243
RECENT LIQUOR USE
q17f Frequency Percent___________________________________________
Never Heard/Used 114.4956 54.46In Your Lifetime 32.3675 15.40Since School Began 31.63757 15.05In the Past Month 31.74393 15.10
Frequency Missing = 12.75542295
RECENT MARIJUANA USE
q18a Frequency Percent___________________________________________Never Heard/Used 158.9428 75.81In Your Lifetime 23.95591 11.43Since School Began 12.5343 5.98In the Past Month 14.23401 6.79
Frequency Missing = 13.332982268
The frequencies have been weighted so that theanalysis reflects the distribution of students by grade

8/14/2019 SMITH COUNTY - Arp ISD - 2000 Texas School Survey of Drug and Alcohol Use
http://slidepdf.com/reader/full/smith-county-arp-isd-2000-texas-school-survey-of-drug-and-alcohol-use 59/123
level in the district

8/14/2019 SMITH COUNTY - Arp ISD - 2000 Texas School Survey of Drug and Alcohol Use
http://slidepdf.com/reader/full/smith-county-arp-isd-2000-texas-school-survey-of-drug-and-alcohol-use 60/123
ArpSpring 2000
The FREQ Procedure
RECENT COCAINE USE
q18b Frequency Percent___________________________________________Never Heard/Used 200.2756 95.73In Your Lifetime 5.133672 2.45Since School Began 1.459424 0.70In the Past Month 2.348346 1.12
Frequency Missing = 13.782916471
RECENT CRACK USE
q18c Frequency Percent___________________________________________Never Heard/Used 200.3532 97.86In Your Lifetime 1.459424 0.71Since School Began 1.459424 0.71In the Past Month 1.459424 0.71
Frequency Missing = 18.268489169
RECENT HALLUCINOGEN USE
q18e Frequency Percent___________________________________________Never Heard/Used 191.6919 95.41In Your Lifetime 5.451779 2.71Since School Began 3.767968 1.88
Frequency Missing = 22.088366257
RECENT UPPER USE
q18f Frequency Percent___________________________________________Never Heard/Used 190.5302 94.28
In Your Lifetime 3.688363 1.83Since School Began 5.100927 2.52In the Past Month 2.759638 1.37
Frequency Missing = 20.92082699
RECENT DOWNER USE
q18g Frequency Percent___________________________________________Never Heard/Used 193.8624 95.31In Your Lifetime 2.619906 1.29Since School Began 4.251808 2.09In the Past Month 2.659709 1.31
Frequency Missing = 19.606184801
The frequencies have been weighted so that theanalysis reflects the distribution of students by grade

8/14/2019 SMITH COUNTY - Arp ISD - 2000 Texas School Survey of Drug and Alcohol Use
http://slidepdf.com/reader/full/smith-county-arp-isd-2000-texas-school-survey-of-drug-and-alcohol-use 61/123
level in the district

8/14/2019 SMITH COUNTY - Arp ISD - 2000 Texas School Survey of Drug and Alcohol Use
http://slidepdf.com/reader/full/smith-county-arp-isd-2000-texas-school-survey-of-drug-and-alcohol-use 62/123
ArpSpring 2000
The FREQ Procedure
RECENT ROHYPNOL USE
q18h Frequency Percent___________________________________________Never Heard/Used 190.353 96.55In Your Lifetime 2.792384 1.42Since School Began 2.547358 1.29In the Past Month 1.459424 0.74
Frequency Missing = 25.847802549
RECENT STEROID USE
q18i Frequency Percent___________________________________________Never Heard/Used 193.9945 96.94In Your Lifetime 2.759638 1.38Since School Began 1.021597 0.51In the Past Month 2.341289 1.17
Frequency Missing = 22.882941591
RECENT ECSTASY USE
q18j Frequency Percent___________________________________________Never Heard/Used 199.2747 97.21In Your Lifetime 0.888922 0.43Since School Began 4.82231 2.35
Frequency Missing = 18.014085801
RECENT HEROIN USE
q18k Frequency Percent___________________________________________Never Heard/Used 205.8471 98.60
In Your Lifetime 1.459424 0.70Since School Began 1.459424 0.70
Frequency Missing = 14.234011188
TOBACCO USE IN PAST MONTH
q19a Frequency Percent_________________________________________Never Heard/Used 163.9564 79.651-2 times 13.28349 6.453-10 times 4.537482 2.2011+ times 24.06974 11.69
Frequency Missing = 17.152859356
The frequencies have been weighted so that theanalysis reflects the distribution of students by grade

8/14/2019 SMITH COUNTY - Arp ISD - 2000 Texas School Survey of Drug and Alcohol Use
http://slidepdf.com/reader/full/smith-county-arp-isd-2000-texas-school-survey-of-drug-and-alcohol-use 63/123

8/14/2019 SMITH COUNTY - Arp ISD - 2000 Texas School Survey of Drug and Alcohol Use
http://slidepdf.com/reader/full/smith-county-arp-isd-2000-texas-school-survey-of-drug-and-alcohol-use 64/123
ArpSpring 2000
The FREQ Procedure
ALCOHOL USE IN PAST MONTH
q19b Frequency Percent_________________________________________Never Heard/Used 137.6994 67.201-2 times 47.68534 23.273-10 times 8.383047 4.0911+ times 11.1509 5.44
Frequency Missing = 18.08127012
INHALANT USE IN PAST MONTH
q19c Frequency Percent_________________________________________Never Heard/Used 192.0129 93.961-2 times 11.32043 5.5411+ times 1.021597 0.50
Frequency Missing = 18.645028738
MARIJUANA USE IN PAST MONTH
q19d Frequency Percent_________________________________________Never Heard/Used 182.0684 88.181-2 times 11.24145 5.443-10 times 4.119133 1.9911+ times 9.047582 4.38
Frequency Missing = 16.523390584
COCAINE USE IN PAST MONTH
q19e Frequency Percent_________________________________________Never Heard/Used 200.2615 98.13
1-2 times 2.348346 1.1511+ times 1.459424 0.72
Frequency Missing = 18.930703239
CRACK USE IN PAST MONTH
q19f Frequency Percent_________________________________________Never Heard/Used 201.2094 98.571-2 times 1.459424 0.713-10 times 1.459424 0.71
Frequency Missing = 18.87173661
The frequencies have been weighted so that theanalysis reflects the distribution of students by grade

8/14/2019 SMITH COUNTY - Arp ISD - 2000 Texas School Survey of Drug and Alcohol Use
http://slidepdf.com/reader/full/smith-county-arp-isd-2000-texas-school-survey-of-drug-and-alcohol-use 65/123
level in the district

8/14/2019 SMITH COUNTY - Arp ISD - 2000 Texas School Survey of Drug and Alcohol Use
http://slidepdf.com/reader/full/smith-county-arp-isd-2000-texas-school-survey-of-drug-and-alcohol-use 66/123
ArpSpring 2000
The FREQ Procedure
CLOSE FRIENDS USE CIGARETTES
q20a Frequency Percent_________________________________________Never heard/None 71.37108 34.84A few 63.30359 30.91Some 38.92638 19.00Most 27.98839 13.66All 3.237268 1.58
Frequency Missing = 18.173295701
CLOSE FRIENDS USE SMOKELESS TOBACCO
q20b Frequency Percent_________________________________________Never heard/None 127.6386 62.96A few 43.08425 21.25Some 26.44346 13.04Most 4.112076 2.03All 1.459424 0.72
Frequency Missing = 20.262188556
CLOSE FRIENDS USE BEER
q20c Frequency Percent_________________________________________Never heard/None 63.28581 31.74A few 57.35449 28.76Some 48.09748 24.12Most 21.17796 10.62All 9.498677 4.76
Frequency Missing = 23.585585441
CLOSE FRIENDS USE WINE COOLERS
q20d Frequency Percent_________________________________________Never heard/None 61.2901 30.27A few 66.63257 32.91Some 40.31831 19.91Most 23.43227 11.57All 10.79268 5.33
Frequency Missing = 20.534062357
CLOSE FRIENDS USE WINE
q20e Frequency Percent_________________________________________Never heard/None 104.864 51.89
A few 50.11066 24.80Some 26.73556 13.23Most 14.79071 7.32All 5.598881 2.77
Frequency Missing = 20.90018867
The frequencies have been weighted so that theanalysis reflects the distribution of students by grade

8/14/2019 SMITH COUNTY - Arp ISD - 2000 Texas School Survey of Drug and Alcohol Use
http://slidepdf.com/reader/full/smith-county-arp-isd-2000-texas-school-survey-of-drug-and-alcohol-use 67/123
level in the district

8/14/2019 SMITH COUNTY - Arp ISD - 2000 Texas School Survey of Drug and Alcohol Use
http://slidepdf.com/reader/full/smith-county-arp-isd-2000-texas-school-survey-of-drug-and-alcohol-use 68/123
ArpSpring 2000
The FREQ Procedure
CLOSE FRIENDS USE LIQUOR
q20f Frequency Percent_________________________________________Never heard/None 83.74616 40.71A few 47.0485 22.87Some 37.99703 18.47Most 27.55793 13.40All 9.366002 4.55
Frequency Missing = 17.284373759
CLOSE FRIENDS USE INHALANTS
q20g Frequency Percent_________________________________________Never heard/None 168.6055 83.93A few 24.29519 12.09Some 1.199971 0.60Most 6.778214 3.37
Frequency Missing = 22.121111556
CLOSE FRIENDS USE MARIJUANA
q20h Frequency Percent_________________________________________Never heard/None 124.186 60.35A few 41.40687 20.12Some 17.96892 8.73Most 19.09496 9.28All 3.11049 1.51
Frequency Missing = 17.232777958
DIFFICULT TO GET CIGARETTES
q21a Frequency Percent_______________________________________Never heard of 19.89722 9.65Impossible 23.97646 11.63Very difficult 10.06739 4.88Somewhat diff 20.22145 9.81Somewhat easy 29.75055 14.43Very easy 102.2654 49.60
Frequency Missing = 16.821485716
DIFFICULT TO GET SMOKELESS TOBACCO
q21b Frequency Percent_______________________________________Never heard of 35.0726 17.61
Impossible 28.62893 14.37Very difficult 18.38463 9.23Somewhat diff 16.78579 8.43Somewhat easy 24.93708 12.52Very easy 75.38457 37.84
Frequency Missing = 23.80639665
The frequencies have been weighted so that theanalysis reflects the distribution of students by grade

8/14/2019 SMITH COUNTY - Arp ISD - 2000 Texas School Survey of Drug and Alcohol Use
http://slidepdf.com/reader/full/smith-county-arp-isd-2000-texas-school-survey-of-drug-and-alcohol-use 69/123
level in the district

8/14/2019 SMITH COUNTY - Arp ISD - 2000 Texas School Survey of Drug and Alcohol Use
http://slidepdf.com/reader/full/smith-county-arp-isd-2000-texas-school-survey-of-drug-and-alcohol-use 70/123

8/14/2019 SMITH COUNTY - Arp ISD - 2000 Texas School Survey of Drug and Alcohol Use
http://slidepdf.com/reader/full/smith-county-arp-isd-2000-texas-school-survey-of-drug-and-alcohol-use 71/123
level in the district

8/14/2019 SMITH COUNTY - Arp ISD - 2000 Texas School Survey of Drug and Alcohol Use
http://slidepdf.com/reader/full/smith-county-arp-isd-2000-texas-school-survey-of-drug-and-alcohol-use 72/123
ArpSpring 2000
The FREQ Procedure
DIFFICULT TO GET INHALANTS
q21g Frequency Percent_______________________________________Never heard of 36.84517 18.61Impossible 28.32293 14.31Very difficult 13.8103 6.98Somewhat diff 5.90877 2.98Somewhat easy 22.04414 11.13Very easy 91.05611 45.99
Frequency Missing = 25.012577879
DIFFICULT TO GET MARIJUANA
q21h Frequency Percent_______________________________________Never heard of 34.5758 17.07Impossible 53.86115 26.59Very difficult 22.93633 11.33Somewhat diff 19.43424 9.60Somewhat easy 22.78154 11.25Very easy 48.93553 24.16
Frequency Missing = 20.47540938
DIFFICULT TO GET COCAINE
q21i Frequency Percent_______________________________________Never heard of 45.55454 22.66Impossible 68.50025 34.07Very difficult 40.72223 20.25Somewhat diff 19.75065 9.82Somewhat easy 12.84209 6.39Very easy 13.68951 6.81
Frequency Missing = 21.940730126
DIFFICULT TO GET CRACK
q21j Frequency Percent_______________________________________Never heard of 41.75383 21.28Impossible 70.22534 35.80Very difficult 43.67856 22.26Somewhat diff 18.25375 9.30Somewhat easy 9.895855 5.04Very easy 12.36982 6.31
Frequency Missing = 26.822853409
The frequencies have been weighted so that theanalysis reflects the distribution of students by grade

8/14/2019 SMITH COUNTY - Arp ISD - 2000 Texas School Survey of Drug and Alcohol Use
http://slidepdf.com/reader/full/smith-county-arp-isd-2000-texas-school-survey-of-drug-and-alcohol-use 73/123

8/14/2019 SMITH COUNTY - Arp ISD - 2000 Texas School Survey of Drug and Alcohol Use
http://slidepdf.com/reader/full/smith-county-arp-isd-2000-texas-school-survey-of-drug-and-alcohol-use 74/123
ArpSpring 2000
The FREQ Procedure
DIFFICULT TO GET HALLUCINOGENS
q21l Frequency Percent_______________________________________Never heard of 55.45567 28.63Impossible 61.81017 31.91Very difficult 42.18818 21.78Somewhat diff 15.40682 7.95Somewhat easy 8.150756 4.21Very easy 10.69159 5.52
Frequency Missing = 29.296817175
DIFFICULT TO GET UPPERS
q21m Frequency Percent_______________________________________Never heard of 75.40618 37.96Impossible 48.60312 24.47Very difficult 32.98286 16.60Somewhat diff 15.63742 7.87Somewhat easy 7.627961 3.84Very easy 18.39947 9.26
Frequency Missing = 24.34299298
DIFFICULT TO GET DOWNERS
q21n Frequency Percent_______________________________________Never heard of 77.76748 38.49Impossible 49.31367 24.41Very difficult 33.69225 16.68Somewhat diff 15.80989 7.83Somewhat easy 9.803829 4.85Very easy 15.63983 7.74
Frequency Missing = 20.973050095
DIFFICULT TO GET ROHYPNOL
q21o Frequency Percent_______________________________________Never heard of 92.97686 47.36Impossible 50.34822 25.65Very difficult 26.80579 13.65Somewhat diff 7.068938 3.60Somewhat easy 5.445035 2.77Very easy 13.67088 6.96
Frequency Missing = 26.684281829
The frequencies have been weighted so that theanalysis reflects the distribution of students by grade

8/14/2019 SMITH COUNTY - Arp ISD - 2000 Texas School Survey of Drug and Alcohol Use
http://slidepdf.com/reader/full/smith-county-arp-isd-2000-texas-school-survey-of-drug-and-alcohol-use 75/123
level in the district

8/14/2019 SMITH COUNTY - Arp ISD - 2000 Texas School Survey of Drug and Alcohol Use
http://slidepdf.com/reader/full/smith-county-arp-isd-2000-texas-school-survey-of-drug-and-alcohol-use 76/123
ArpSpring 2000
The FREQ Procedure
DIFFICULT TO GET STEROIDS
q21p Frequency Percent_______________________________________Never heard of 39.86248 20.67Impossible 65.84854 34.15Very difficult 36.58983 18.98Somewhat diff 13.39132 6.95Somewhat easy 16.50106 8.56Very easy 20.61429 10.69
Frequency Missing = 30.192482641
DIFFICULT TO GET ECSTASY
q21q Frequency Percent_______________________________________Never heard of 75.89592 38.54Impossible 53.12649 26.98Very difficult 30.95378 15.72Somewhat diff 11.0495 5.61Somewhat easy 10.28651 5.22Very easy 15.6212 7.93
Frequency Missing = 26.066606384
DIFFICULT TO GET HEROIN
q21r Frequency Percent_______________________________________Never heard of 47.279 23.10Impossible 81.73161 39.93Very difficult 39.43676 19.27Somewhat diff 14.03321 6.86Somewhat easy 11.40098 5.57Very easy 10.81837 5.28
Frequency Missing = 18.300073954
AGE WHEN FIRST USED CIGARETTES
q22a Frequency Percent______________________________________9 or younger 24.71037 27.0410 years old 4.390693 4.8011 years old 7.944906 8.6912 years old 16.22097 17.7513 years old 16.65343 18.2214 years old 9.471829 10.3615 years old 8.21173 8.9916 years old 2.759638 3.0217 years old 1.021597 1.12
Frequency Missing = 131.61483471
The frequencies have been weighted so that theanalysis reflects the distribution of students by grade

8/14/2019 SMITH COUNTY - Arp ISD - 2000 Texas School Survey of Drug and Alcohol Use
http://slidepdf.com/reader/full/smith-county-arp-isd-2000-texas-school-survey-of-drug-and-alcohol-use 77/123
level in the district
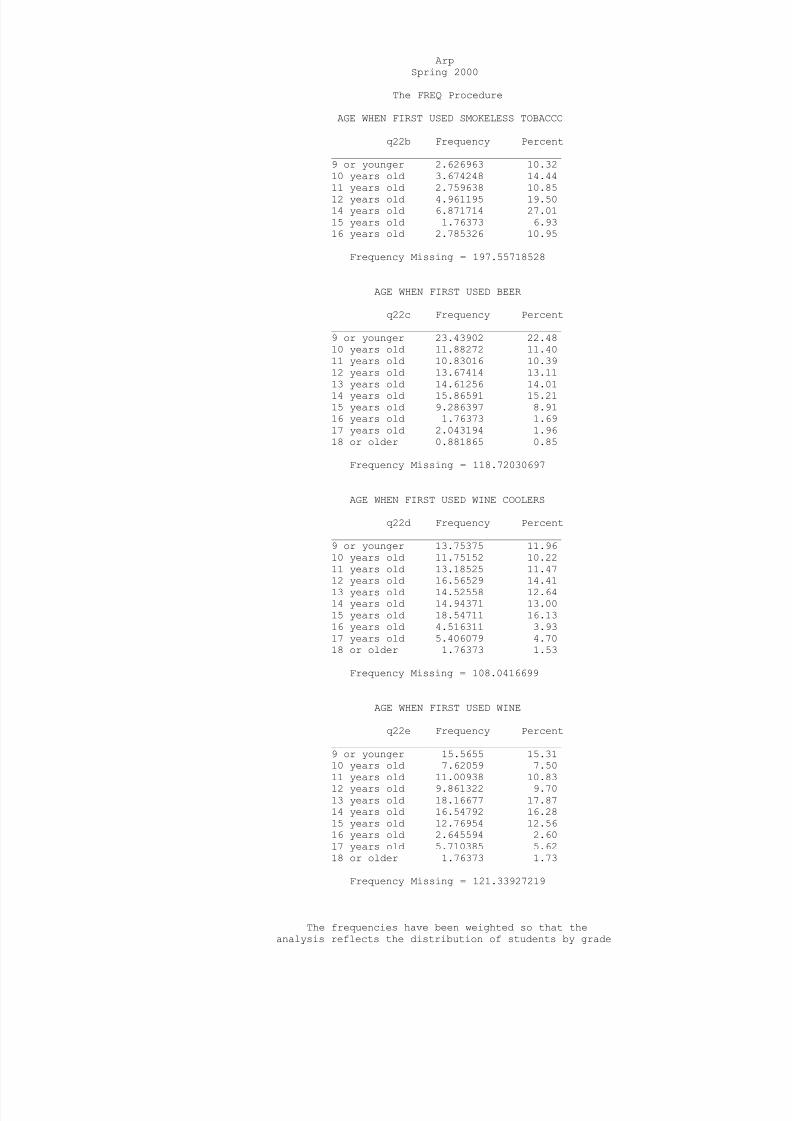
8/14/2019 SMITH COUNTY - Arp ISD - 2000 Texas School Survey of Drug and Alcohol Use
http://slidepdf.com/reader/full/smith-county-arp-isd-2000-texas-school-survey-of-drug-and-alcohol-use 78/123

8/14/2019 SMITH COUNTY - Arp ISD - 2000 Texas School Survey of Drug and Alcohol Use
http://slidepdf.com/reader/full/smith-county-arp-isd-2000-texas-school-survey-of-drug-and-alcohol-use 79/123
level in the district

8/14/2019 SMITH COUNTY - Arp ISD - 2000 Texas School Survey of Drug and Alcohol Use
http://slidepdf.com/reader/full/smith-county-arp-isd-2000-texas-school-survey-of-drug-and-alcohol-use 80/123

8/14/2019 SMITH COUNTY - Arp ISD - 2000 Texas School Survey of Drug and Alcohol Use
http://slidepdf.com/reader/full/smith-county-arp-isd-2000-texas-school-survey-of-drug-and-alcohol-use 81/123

8/14/2019 SMITH COUNTY - Arp ISD - 2000 Texas School Survey of Drug and Alcohol Use
http://slidepdf.com/reader/full/smith-county-arp-isd-2000-texas-school-survey-of-drug-and-alcohol-use 82/123
ArpSpring 2000
The FREQ Procedure
AGE WHEN FIRST USED CRACK
q22j Frequency Percent______________________________________13 years old 1.459424 50.0017 years old 1.459424 50.00
Frequency Missing = 220.08115183
AGE WHEN FIRST USED HALLUCINOGENS
q22l Frequency Percent______________________________________11 years old 1.459424 24.3613 years old 1.910519 31.9014 years old 1.730984 28.9016 years old 0.888922 14.84
Frequency Missing = 217.01015094
AGE WHEN FIRST USED UPPERS
q22m Frequency Percent______________________________________9 or younger 1.459424 9.4211 years old 0.888922 5.7412 years old 1.459424 9.4213 years old 2.792384 18.0314 years old 4.670157 30.1515 years old 2.308544 14.9016 years old 0.888922 5.7418 or older 1.021597 6.60
Frequency Missing = 207.51062691
AGE WHEN FIRST USED DOWNERS
q22n Frequency Percent______________________________________9 or younger 1.459424 13.2813 years old 4.119133 37.4814 years old 2.659709 24.2015 years old 1.730984 15.7516 years old 1.021597 9.29
Frequency Missing = 212.00915344
AGE WHEN FIRST USED ROHYPNOL
q22o Frequency Percent______________________________________10 years old 0.888922 9.7112 years old 1.777844 19.42
13 years old 1.021597 11.1614 years old 0.849119 9.2815 years old 3.157663 34.4916 years old 1.459424 15.94
Frequency Missing = 213.84543075
The frequencies have been weighted so that theanalysis reflects the distribution of students by grade

8/14/2019 SMITH COUNTY - Arp ISD - 2000 Texas School Survey of Drug and Alcohol Use
http://slidepdf.com/reader/full/smith-county-arp-isd-2000-texas-school-survey-of-drug-and-alcohol-use 83/123

8/14/2019 SMITH COUNTY - Arp ISD - 2000 Texas School Survey of Drug and Alcohol Use
http://slidepdf.com/reader/full/smith-county-arp-isd-2000-texas-school-survey-of-drug-and-alcohol-use 84/123

8/14/2019 SMITH COUNTY - Arp ISD - 2000 Texas School Survey of Drug and Alcohol Use
http://slidepdf.com/reader/full/smith-county-arp-isd-2000-texas-school-survey-of-drug-and-alcohol-use 85/123

8/14/2019 SMITH COUNTY - Arp ISD - 2000 Texas School Survey of Drug and Alcohol Use
http://slidepdf.com/reader/full/smith-county-arp-isd-2000-texas-school-survey-of-drug-and-alcohol-use 86/123

8/14/2019 SMITH COUNTY - Arp ISD - 2000 Texas School Survey of Drug and Alcohol Use
http://slidepdf.com/reader/full/smith-county-arp-isd-2000-texas-school-survey-of-drug-and-alcohol-use 87/123
level in the district

8/14/2019 SMITH COUNTY - Arp ISD - 2000 Texas School Survey of Drug and Alcohol Use
http://slidepdf.com/reader/full/smith-county-arp-isd-2000-texas-school-survey-of-drug-and-alcohol-use 88/123

8/14/2019 SMITH COUNTY - Arp ISD - 2000 Texas School Survey of Drug and Alcohol Use
http://slidepdf.com/reader/full/smith-county-arp-isd-2000-texas-school-survey-of-drug-and-alcohol-use 89/123
level in the district

8/14/2019 SMITH COUNTY - Arp ISD - 2000 Texas School Survey of Drug and Alcohol Use
http://slidepdf.com/reader/full/smith-county-arp-isd-2000-texas-school-survey-of-drug-and-alcohol-use 90/123

8/14/2019 SMITH COUNTY - Arp ISD - 2000 Texas School Survey of Drug and Alcohol Use
http://slidepdf.com/reader/full/smith-county-arp-isd-2000-texas-school-survey-of-drug-and-alcohol-use 91/123
level in the district

8/14/2019 SMITH COUNTY - Arp ISD - 2000 Texas School Survey of Drug and Alcohol Use
http://slidepdf.com/reader/full/smith-county-arp-isd-2000-texas-school-survey-of-drug-and-alcohol-use 92/123

8/14/2019 SMITH COUNTY - Arp ISD - 2000 Texas School Survey of Drug and Alcohol Use
http://slidepdf.com/reader/full/smith-county-arp-isd-2000-texas-school-survey-of-drug-and-alcohol-use 93/123
level in the district

8/14/2019 SMITH COUNTY - Arp ISD - 2000 Texas School Survey of Drug and Alcohol Use
http://slidepdf.com/reader/full/smith-county-arp-isd-2000-texas-school-survey-of-drug-and-alcohol-use 94/123

8/14/2019 SMITH COUNTY - Arp ISD - 2000 Texas School Survey of Drug and Alcohol Use
http://slidepdf.com/reader/full/smith-county-arp-isd-2000-texas-school-survey-of-drug-and-alcohol-use 95/123

8/14/2019 SMITH COUNTY - Arp ISD - 2000 Texas School Survey of Drug and Alcohol Use
http://slidepdf.com/reader/full/smith-county-arp-isd-2000-texas-school-survey-of-drug-and-alcohol-use 96/123

8/14/2019 SMITH COUNTY - Arp ISD - 2000 Texas School Survey of Drug and Alcohol Use
http://slidepdf.com/reader/full/smith-county-arp-isd-2000-texas-school-survey-of-drug-and-alcohol-use 97/123
level in the district

8/14/2019 SMITH COUNTY - Arp ISD - 2000 Texas School Survey of Drug and Alcohol Use
http://slidepdf.com/reader/full/smith-county-arp-isd-2000-texas-school-survey-of-drug-and-alcohol-use 98/123

8/14/2019 SMITH COUNTY - Arp ISD - 2000 Texas School Survey of Drug and Alcohol Use
http://slidepdf.com/reader/full/smith-county-arp-isd-2000-texas-school-survey-of-drug-and-alcohol-use 99/123
level in the district

8/14/2019 SMITH COUNTY - Arp ISD - 2000 Texas School Survey of Drug and Alcohol Use
http://slidepdf.com/reader/full/smith-county-arp-isd-2000-texas-school-survey-of-drug-and-alcohol-use 100/123

8/14/2019 SMITH COUNTY - Arp ISD - 2000 Texas School Survey of Drug and Alcohol Use
http://slidepdf.com/reader/full/smith-county-arp-isd-2000-texas-school-survey-of-drug-and-alcohol-use 101/123
level in the district

8/14/2019 SMITH COUNTY - Arp ISD - 2000 Texas School Survey of Drug and Alcohol Use
http://slidepdf.com/reader/full/smith-county-arp-isd-2000-texas-school-survey-of-drug-and-alcohol-use 102/123

8/14/2019 SMITH COUNTY - Arp ISD - 2000 Texas School Survey of Drug and Alcohol Use
http://slidepdf.com/reader/full/smith-county-arp-isd-2000-texas-school-survey-of-drug-and-alcohol-use 103/123

8/14/2019 SMITH COUNTY - Arp ISD - 2000 Texas School Survey of Drug and Alcohol Use
http://slidepdf.com/reader/full/smith-county-arp-isd-2000-texas-school-survey-of-drug-and-alcohol-use 104/123

8/14/2019 SMITH COUNTY - Arp ISD - 2000 Texas School Survey of Drug and Alcohol Use
http://slidepdf.com/reader/full/smith-county-arp-isd-2000-texas-school-survey-of-drug-and-alcohol-use 105/123

8/14/2019 SMITH COUNTY - Arp ISD - 2000 Texas School Survey of Drug and Alcohol Use
http://slidepdf.com/reader/full/smith-county-arp-isd-2000-texas-school-survey-of-drug-and-alcohol-use 106/123

8/14/2019 SMITH COUNTY - Arp ISD - 2000 Texas School Survey of Drug and Alcohol Use
http://slidepdf.com/reader/full/smith-county-arp-isd-2000-texas-school-survey-of-drug-and-alcohol-use 107/123
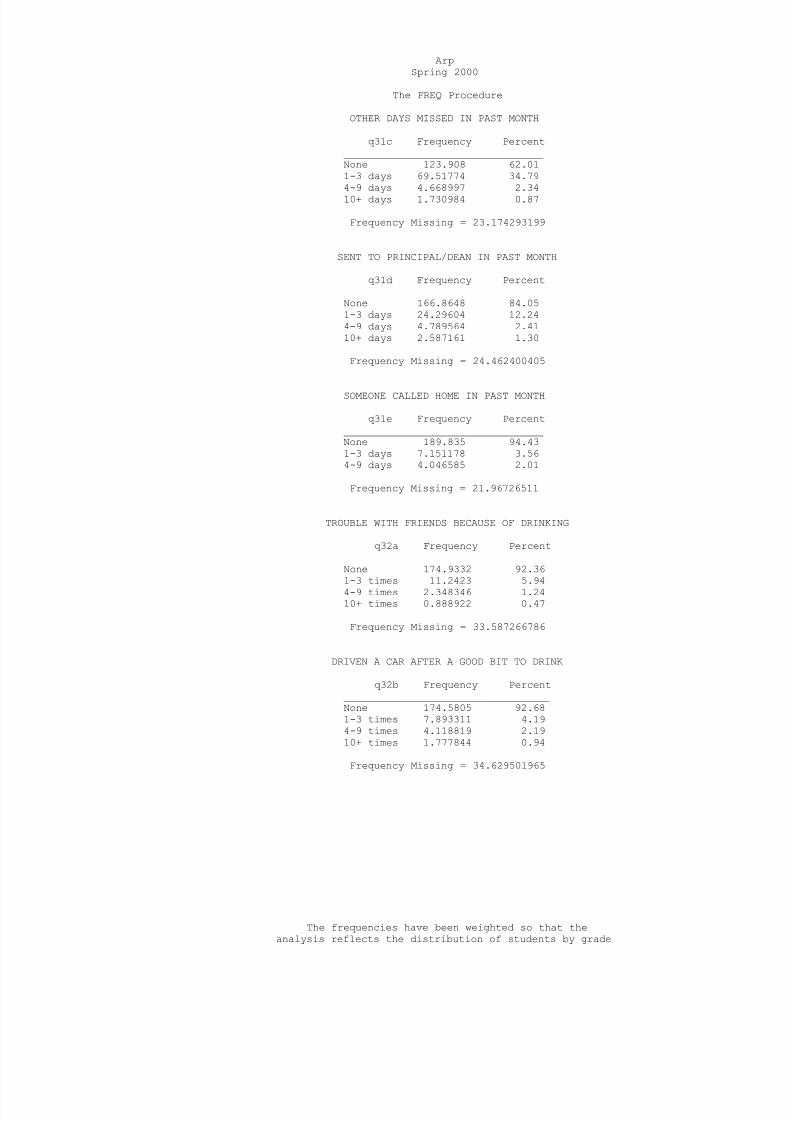
8/14/2019 SMITH COUNTY - Arp ISD - 2000 Texas School Survey of Drug and Alcohol Use
http://slidepdf.com/reader/full/smith-county-arp-isd-2000-texas-school-survey-of-drug-and-alcohol-use 108/123

8/14/2019 SMITH COUNTY - Arp ISD - 2000 Texas School Survey of Drug and Alcohol Use
http://slidepdf.com/reader/full/smith-county-arp-isd-2000-texas-school-survey-of-drug-and-alcohol-use 109/123

8/14/2019 SMITH COUNTY - Arp ISD - 2000 Texas School Survey of Drug and Alcohol Use
http://slidepdf.com/reader/full/smith-county-arp-isd-2000-texas-school-survey-of-drug-and-alcohol-use 110/123
ArpSpring 2000
The FREQ Procedure
CRITICIZED BY DATE BECAUSE OF DRINKING
q32c Frequency Percent__________________________________None 174.3149 93.591-3 times 6.254352 3.364-9 times 5.678486 3.05
Frequency Missing = 36.752300632
TROUBLE WITH POLICE BECAUSE OF DRINKING
q32d Frequency Percent__________________________________None 184.382 95.541-3 times 4.351737 2.254-9 times 4.258865 2.21
Frequency Missing = 30.007365062
TROUBLE WITH FRIENDS BECAUSE OF DRUG USE
q32e Frequency Percent__________________________________None 178.3685 94.771-3 times 7.501496 3.994-9 times 2.348346 1.25
Frequency Missing = 34.781654689
DRIVEN A CAR WHILE HIGH FROM DRUGS
q32f Frequency Percent__________________________________None 176.4391 92.511-3 times 10.07423 5.284-9 times 4.219062 2.21
Frequency Missing = 32.267574796
CRITICIZED BY DATE BECAUSE OF DRUG USE
q32g Frequency Percent__________________________________None 183.6809 95.901-3 times 4.656043 2.434-9 times 2.308544 1.2110+ times 0.888922 0.46
Frequency Missing = 31.465628632
TROUBLE WITH POLICE BECAUSE OF DRUG USE
q32h Frequency Percent__________________________________None 193.6162 97.231-3 times 0.849119 0.434-9 times 2.308544 1.1610+ times 2.348346 1.18
Frequency Missing = 23.87778391
The frequencies have been weighted so that theanalysis reflects the distribution of students by grade

8/14/2019 SMITH COUNTY - Arp ISD - 2000 Texas School Survey of Drug and Alcohol Use
http://slidepdf.com/reader/full/smith-county-arp-isd-2000-texas-school-survey-of-drug-and-alcohol-use 111/123
level in the district

8/14/2019 SMITH COUNTY - Arp ISD - 2000 Texas School Survey of Drug and Alcohol Use
http://slidepdf.com/reader/full/smith-county-arp-isd-2000-texas-school-survey-of-drug-and-alcohol-use 112/123
ArpSpring 2000
The FREQ Procedure
CLASS DAYS DRUNK ON ALCOHOL SINCE SEPT
q33a Frequency Percent_________________________________None 182.4741 91.991-3 days 12.38362 6.244-9 days 3.508828 1.77
Frequency Missing = 24.633403631
CLASS DAYS HIGH ON MARIJUANA SINCE SEPT
q33b Frequency Percent_________________________________None 185.9685 91.901-3 days 10.93125 5.404-9 days 3.11049 1.5410+ days 2.348346 1.16
Frequency Missing = 20.641362804
CLASS DAYS HIGH ON INHALANTS SINCE SEPT
q33c Frequency Percent_________________________________None 198.7569 98.281-3 days 2.580104 1.284-9 days 0.888922 0.44
Frequency Missing = 20.77403772
CLASS DAYS HIGH ON OTHER DRUG(S)
q33d Frequency Percent_________________________________None 189.0322 94.571-3 days 7.647972 3.83
4-9 days 1.459424 0.7310+ days 1.738041 0.87
Frequency Missing = 23.122383746
ALCOHOL USE AT PARTIES THIS SCHOOL YEAR
q34a Frequency Percent_________________________________________Never 70.88228 35.08Seldom 31.2642 15.47Half the time 14.40617 7.13Most of the time 29.84583 14.77Always 30.89365 15.29Don't know 4.702902 2.33Didn't attend 20.04517 9.92
Frequency Missing = 20.959782604
The frequencies have been weighted so that theanalysis reflects the distribution of students by grade

8/14/2019 SMITH COUNTY - Arp ISD - 2000 Texas School Survey of Drug and Alcohol Use
http://slidepdf.com/reader/full/smith-county-arp-isd-2000-texas-school-survey-of-drug-and-alcohol-use 113/123
level in the district

8/14/2019 SMITH COUNTY - Arp ISD - 2000 Texas School Survey of Drug and Alcohol Use
http://slidepdf.com/reader/full/smith-county-arp-isd-2000-texas-school-survey-of-drug-and-alcohol-use 114/123

8/14/2019 SMITH COUNTY - Arp ISD - 2000 Texas School Survey of Drug and Alcohol Use
http://slidepdf.com/reader/full/smith-county-arp-isd-2000-texas-school-survey-of-drug-and-alcohol-use 115/123

8/14/2019 SMITH COUNTY - Arp ISD - 2000 Texas School Survey of Drug and Alcohol Use
http://slidepdf.com/reader/full/smith-county-arp-isd-2000-texas-school-survey-of-drug-and-alcohol-use 116/123

8/14/2019 SMITH COUNTY - Arp ISD - 2000 Texas School Survey of Drug and Alcohol Use
http://slidepdf.com/reader/full/smith-county-arp-isd-2000-texas-school-survey-of-drug-and-alcohol-use 117/123
level in the district

8/14/2019 SMITH COUNTY - Arp ISD - 2000 Texas School Survey of Drug and Alcohol Use
http://slidepdf.com/reader/full/smith-county-arp-isd-2000-texas-school-survey-of-drug-and-alcohol-use 118/123
ArpSpring 2000
The FREQ Procedure
DRUG/ALCOHOL INFO--GUIDANCE COUNSELOR
q37c Frequency Percent___________________________________No 146.1411 88.72Yes 18.57248 11.28
Frequency Missing = 58.286380571
DRUG/ALCOHOL INFO--SCIENCE CLASS
q37d Frequency Percent___________________________________No 104.3988 63.04Yes 61.1967 36.96
Frequency Missing = 57.404515805
DRUG/ALCOHOL INFO--SOCIAL STUDIES CLASS
q37e Frequency Percent___________________________________No 151.5929 91.69Yes 13.74311 8.31
Frequency Missing = 57.663968976
DRUG/ALCOHOL INFO--DRUG RAP SESSION
q37f Frequency Percent___________________________________No 148.9756 90.69Yes 15.29394 9.31
Frequency Missing = 58.730418111
DRUG/ALCOHOL INFO--INVITED SCHOOL GUEST q37g Frequency Percent___________________________________No 75.63995 45.65Yes 90.04694 54.35
Frequency Missing = 57.313117529
DRUG/ALCOHOL INFO--OTHER SCHOOL SOURCE
q37h Frequency Percent___________________________________No 134.1702 80.23Yes 33.06309 19.77
Frequency Missing = 55.766717667
The frequencies have been weighted so that theanalysis reflects the distribution of students by grade

8/14/2019 SMITH COUNTY - Arp ISD - 2000 Texas School Survey of Drug and Alcohol Use
http://slidepdf.com/reader/full/smith-county-arp-isd-2000-texas-school-survey-of-drug-and-alcohol-use 119/123

8/14/2019 SMITH COUNTY - Arp ISD - 2000 Texas School Survey of Drug and Alcohol Use
http://slidepdf.com/reader/full/smith-county-arp-isd-2000-texas-school-survey-of-drug-and-alcohol-use 120/123
ArpSpring 2000
The FREQ Procedure
PARENTS FEEL ABOUT KIDS SMOKING CIGARET
q38a Frequency Percent__________________________________________Strong disapprove 141.0594 71.30Mild disapprove 11.90599 6.02Neither 23.55968 11.91Mildly approve 3.680992 1.86Strongly approve 2.481021 1.25Don't know 15.14147 7.65
Frequency Missing = 25.171474126
PARENTS FEEL ABOUT KIDS DRINKING BEER
q38b Frequency Percent__________________________________________Strong disapprove 129.7758 67.42Mild disapprove 20.3577 10.58Neither 23.79282 12.36Mildly approve 4.177786 2.17Strongly approve 1.459424 0.76Don't know 12.91285 6.71
Frequency Missing = 30.523636724
PARENTS FEEL ABOUT KIDS USING MARIJUANA
q38c Frequency Percent__________________________________________Strong disapprove 162.9995 82.89Mild disapprove 4.835577 2.46Neither 11.32253 5.76Mildly approve 2.088893 1.06Strongly approve 2.481021 1.26Don't know 12.9199 6.57
Frequency Missing = 26.352594537
PURCHASED LOTTERY TICKET IN PAST YEAR
q39 Frequency Percent___________________________________No 144.505 72.73Yes 54.18641 27.27
Frequency Missing = 24.308553959
NON-LOTTERY GAMBLING IN PAST YEAR
q40 Frequency Percent___________________________________No 149.7363 76.66
Yes 45.57813 23.34
Frequency Missing = 27.68555402
The frequencies have been weighted so that theanalysis reflects the distribution of students by grade

8/14/2019 SMITH COUNTY - Arp ISD - 2000 Texas School Survey of Drug and Alcohol Use
http://slidepdf.com/reader/full/smith-county-arp-isd-2000-texas-school-survey-of-drug-and-alcohol-use 121/123

8/14/2019 SMITH COUNTY - Arp ISD - 2000 Texas School Survey of Drug and Alcohol Use
http://slidepdf.com/reader/full/smith-county-arp-isd-2000-texas-school-survey-of-drug-and-alcohol-use 122/123

8/14/2019 SMITH COUNTY - Arp ISD - 2000 Texas School Survey of Drug and Alcohol Use
http://slidepdf.com/reader/full/smith-county-arp-isd-2000-texas-school-survey-of-drug-and-alcohol-use 123/123
level in the district