sme monitor - aldermore€¦ · sme monitor q3 2014 | 2 the aldermore sme monitor shows that annual...
TRANSCRIPT

SME Monitor
Q3 2014
aldermore.co.uk

SME Monitor Q3 2014 | 1
This report was produced by Centre for Economics and Business Research (Cebr) for Aldermore.
Cebr is not licensed in the conduct of investment business as defined in the Financial Services and Markets Act 2000. Any client considering a specific investment should consult their own broker or other investment adviser. Any views on investments expressed by Cebr, or on behalf of Cebr, are intended to be generic only. Cebr accepts no liability for any specific investment decision which must be at the investor’s own risk.
Whilst every effort has been made to ensure the accuracy of the material in this report, neither the authors nor Cebr will be liable for any loss or damages incurred through the use of this report or associated materials.
Executive summary
UK economic overview
SME cost inflation trends
SME business confidence
SME credit conditions
UK business insolvencies
Appendix: cost base analysis
Contact and methodological note
3
5
6
16
17
18
19
20
Contents

SME Monitor Q3 2014 | 2
The Aldermore SME Monitor shows that annual cost inflation has accelerated to 0.8% in the third quarter, up from last quarter’s 0.2%. The increase is predominately driven by wages returning to growth, as well an increase in business and construction services costs. Given that employee costs account for the largest proportion of most small and medium sized businesses total costs, they are always a key determining factor in cost inflation.
The rise in annual cost inflation was slightly offset by reduced prices of physical inputs, transport and storage, as well as in telecoms & IT - areas that on average account for just over a quarter of SME overall spend. Energy and utilities costs also fell, with the price of gas falling by 17% year-on-year. Looking at specific sectors, cost inflation was highest for SMEs in construction, while manufacturing SMEs saw costs fall.
Company liquidations continued on their downward trend in Q3. With the exception of Q1 2014, insolvencies have been declining year-on-year for around two years, showing that the current cost climate for SMEs is increasingly favourable. Looking ahead, the SME cost environment is expected to remain favourable as a slowdown in emerging markets is keeping demand and hence the price of commodities imports subdued.
Although confidence has fallen, it remains high by historical standards, and confidence amongst SMEs fell at a much slower pace when compared to larger businesses. The UK economy is expected to have grown by 2.9% over 2014 as a whole in what has been an good year, and although 2015 is not expected to produce the same magnitude of growth, it is still expected to hit 2.3% in what promises to be the second highest year of growth since the financial crisis. I‘m delighted that the signs going into 2015 are positive, especially for SMEs.
Foreword
Mark Stephens, Deputy CEO and Group Commercial Director, Aldermore

SME Monitor Q3 2014 | 3
Costs faced by the UK’s small and medium-sized enterprises rose by 0.8% over the year to Q3 2014. This compares to 0.2% seen last quarter but remains low when considered from a long-term perspective. With the exception of a few blips, cost inflation among the UK’s SMEs has been following a downward trend for the past three years and is now less than a third of what was felt by SMEs back in Q3 2011.
The pickup seen this quarter was mainly driven by wages returning to growth after declining marginally in Q2. Employment costs make up more than half of SMEs total costs on average and hence the overall rate of cost inflation is highly sensitive to changes in wages. Looking ahead, the labour market is tightening as the recovery proceeds. Wage growth is thus expected to pick up yet more pace in the coming quarters, putting upward-cost pressure especially for the UK’s labour-intensive SMEs in the services sectors.
The cost of other significant inputs to UK SMEs, such as business and construction services, which together make up about a quarter of total costs, also rose strongly this quarter, by 2.3% and 3.1% year-on-year respectively. This was partly offset by falls in the cost of physical inputs. These make up a fifth of SMEs’ total costs on average and over half of the costs faced by SMEs in the manufacturing sector. The prices of food products, chemicals, metals, and gas in particular recorded strong declines. This is driven by weakening global commodities prices in turn caused by slowing demand from emerging markets as they enter a phase of weaker economic growth. This is expected to continue setting a benign inflationary backdrop for UK businesses.
Overall, SMEs continue to be relatively more optimistic compared to other size groups but in absolute terms their confidence has cooled compared to previous quarters. 2014 was a year for very strong growth for the UK but signs are indicating that the pace of growth may have already peaked and is now slowing down.
Executive Summary
Annual cost inflation for
UK SMEs accelerated to
0.8% in Q3 2014.
This is up from last
quarter’s 0.2% but
remains low by historical
standards and close to
what was recorded at
the same point last year.
The pickup was driven
by wages returning
to growth as well as
by a rise in the cost of
business services and
construction inputs. The
cost of physical inputs
on the other hand fell
further.
Annual cost inflation was
highest for SMEs in the
construction sector while
manufacturing SMEs
actually saw costs fall.

SME Monitor Q3 2014 | 4
Annual cost inflation for UK SMEs accelerated to 0.8% in Q3 2014.

SME Monitor Q3 2014 | 5
UK economic prospects solid for now but there are risks ahead
The UK has performed exceptionally well in 2014, posting year-on-year growth of around 3.0% in the first three quarters of the year.
Output is expected to expand by 2.9% over 2014 as a whole, but performance is expected to slow slightly in 2015, to 2.3%.
The risks around the UK economic outlook have increased. Uncertainty in the global economy is considerably elevated due to sluggish growth in the Eurozone, crises in the Middle East and Eastern Europe, instability in the oil and commodities markets, and a continued slowdown in China.
Some of these developments are likely to negatively affect the UK. Uncertainty in the Eurozone, the UK’s largest trading partner, may harm its already weak exports.
Others, such as the falling oil and commodity prices, should support household finances, consumer spending, and hence growth.
A benign inflationary outlook should also keep the pressure off the Bank of England to raise interest rates, allowing it to support the recovery with loose monetary policy for longer.
4%
3%
2%
1%
0%
-1%
-2%
-3%
-4%
-5%
2000
2001
2002
2003
2004
2005
2006
2007
2008
2009
2010
2011
2012
2013
2014
2015
UK annual GDP growth
Fore
cast
Source: ONS Cebr Analysis
5%
SME Monitor Q3 2014 | 6
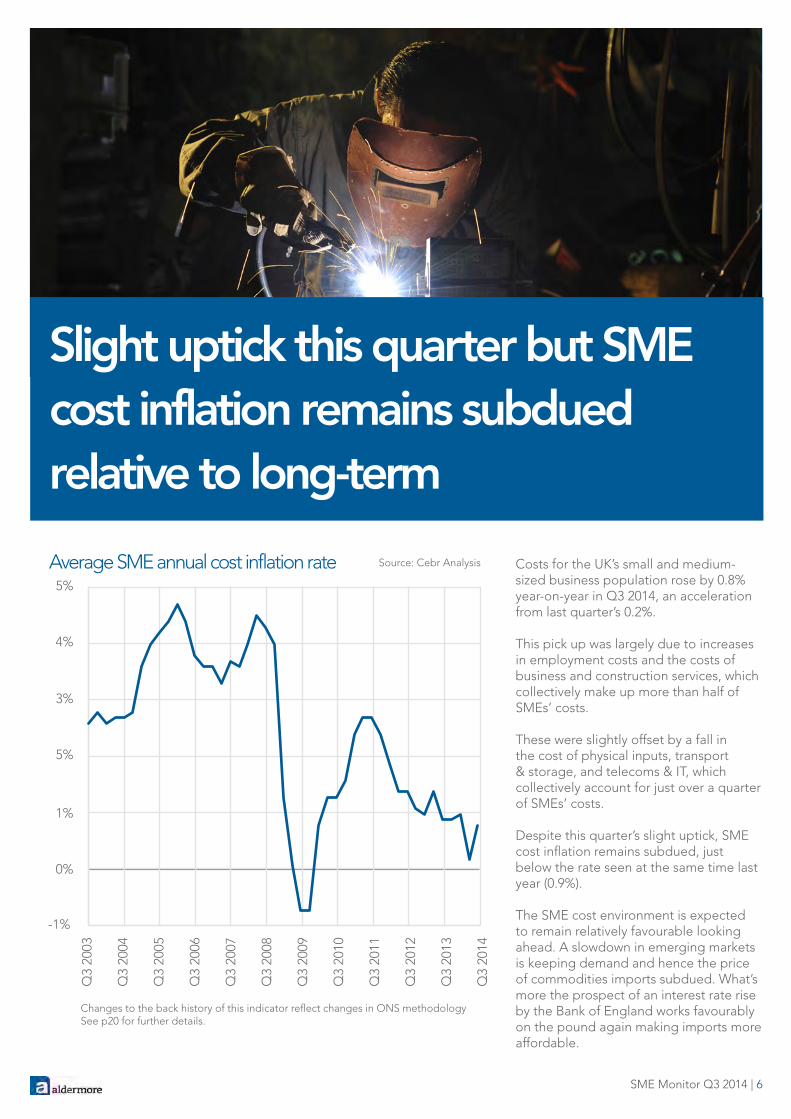
Slight uptick this quarter but SME cost inflation remains subdued relative to long-term
Costs for the UK’s small and medium-sized business population rose by 0.8% year-on-year in Q3 2014, an acceleration from last quarter’s 0.2%.
This pick up was largely due to increases in employment costs and the costs of business and construction services, which collectively make up more than half of SMEs’ costs.
These were slightly offset by a fall in the cost of physical inputs, transport & storage, and telecoms & IT, which collectively account for just over a quarter of SMEs’ costs.
Despite this quarter’s slight uptick, SME cost inflation remains subdued, just below the rate seen at the same time last year (0.9%).
The SME cost environment is expected to remain relatively favourable looking ahead. A slowdown in emerging markets is keeping demand and hence the price of commodities imports subdued. What’s more the prospect of an interest rate rise by the Bank of England works favourably on the pound again making imports more affordable.
Average SME annual cost inflation rate Source: Cebr Analysis
Changes to the back history of this indicator reflect changes in ONS methodology See p20 for further details.
5%
4%
3%
5%
1%
0%
-1%
Q3
2003
Q3
2004
Q3
2005
Q3
2006
Q3
2007
Q3
2008
Q3
2009
Q3
2010
Q3
2011
Q3
2012
Q3
2014
Q3
2013

SME Monitor Q3 2014 | 7
Constructi
on
Comm
ercial
rent
Wage cost inflation picks up pace while physical input costs fallAnnual wage growth picked up pace in Q3 2014 after dipping in Q2. Average total pay - which accounts for about a third of SMEs’ total costs on average - rose year-on-year by 1.1%. The increases were more pronounced in the construction and manufacturing sectors, which are suffering from skills shortages. Wages in the hospitality sector actually recorded a decline for the first time since 2011.
Inflation in the cost of construction and business services inputs also picked up pace this quarter compared with Q2 - the cost of advertising and market research in particular saw exceptionally strong growth at 9.4% year-on-year.
Increases in these cost types were partly offset by a decline in the cost of physical inputs of 1.2% year-on-year. These were brought down by drops in the prices of chemicals, metals, and agricultural products.
Producer costs of energy and utilities also declined marginally due to a significant drop in the price of gas, which declined by 17% year-on-year this quarter marking the second consecutive quarter of double-digit drop. This was partially contained by a modest rise in the cost of electricity, which accounts for more than half of SMEs’ energy & utilities costs.
Percentage point contribution to headline annual SME cost inflation rate Source: Cebr Analysis
Q3 2014Q2 2014
* Includes financial services, insurance, accounting and legal services
0.4%
0.3%
0.2%
0.1%
0.0%
-0.1%
-0.2%
-0.3%
Physica
l Inputs
Teleco
ms &
IT
Energy &
utilitie
s
Finan
cial, in
suran
ce le
gal &
acco
untin
g
Other s
ervice
s
Business
Service
s
Employm
ent costs
Transp
ort & Sto
rage

SME Monitor Q3 2014 | 8
Pickup was driven by wages returning to growth as well as by a rise in the cost of business services and construction inputs

SME Monitor Q3 2014 | 9
Construction
Construction and retail sectors continue to see costs rising
The construction sector saw the biggest cost increases among the UK’s major SME industry groupings. Annual cost inflation accelerated to 1.9% this quarter, up from just 0.1% in Q2. This was chiefly due to an increase in wages - a direct corollary of the skills shortages the sector faces - which make up just under half of construction SMEs’ total costs.
Business services firms also saw relatively strong cost growth at 1.0%. This was due to rising costs across the board, with wage bills returning to growth after a substantial drop last quarter.
Cost inflation in the retail sector remained positive, easing slightly from last quarter. The industry saw declines in employment costs and transport, storage, and physical input costs, which together make up about half of the sectors’ costs. This was partially offset by a rise in the cost of business services and construction inputs.
Small and medium-sized manufacturers on the other hand again faced cost deflation. Costs in the industry fell by 0.1% year-on-year in Q3, mainly owing to declines in energy and utilities prices as well as due to the falling cost of physical inputs which makes up over 50% of the industry’s costs.
2.0%
1.0%
0.5%
1.5%
-0.5%
-1.0%
-1.5%
0.0%
Retail
Note that the chart here is of selected industries only and is not exhaustive of the entire SME economy. The overall SME inflation index presented on page 6 does, however, cover all SMEs.
Manufacturing Business Services
SME annual inflation rate by selected industry
Source: ONS Cebr AnalysisQ3 2014Q2 2014

SME Monitor Q3 2014 | 10
Cost inflation continues to fall for UK manufacturing SMEsCosts for SMEs in the manufacturing sector recorded a marginal dip of 0.1% in Q3 2014.
Costs in the sector are kept subdued by global deflationary forces: slowing growth in emerging markets, and especially China, is keeping demand for commodities weak and thus easing pressure on their prices.As an indication of this, physical input costs - accounting for 53% of SME manufacturers - declined by 1.5% year-on-year this quarter, thereby making the largest negative contribution to the headline SME manufacturing cost inflation rate.
The cost of gas as an energy input for manufacturers also saw a substantial decline this quarter, by 17.1%. This was only partially offset by a 3.8% annual rise in the cost of electricity. The overall cost of energy and utilities inputs for manufacturing SMEs fell by 2.9% as a result.
Costs did not fall across the board however for manufacturing firms. Business services costs rose by 3.0% in the sector, while average pay also saw robust growth of 1.9% - well above the overall economy average, suggesting that the sector may be responding to skills shortages.
SME annual inflation rate, manufacturersSource: Cebr Analysis
8%
7%
6%
5%
3%
4%
2%
1%
0%
-1%
-2%
Q3
2006
Q3
2007
Q3
2008
Q3
2009
Q3
2010
Q3
2011
Q3
2012
Q3
2014
Q3
2013
Business services costs rose by 3.0% in the manufacturing sector, while average pay also saw robust growth of 1.9%

SME Monitor Q3 2014 | 11
Cost inflation for construction SMEs rebounds
SME annual inflation rate, construction firmsSource: Cebr Analysis
Q3
2006
Q3
2007
Q3
2008
Q3
2009
Q3
2010
Q3
2011
Q3
2012
Q3
2014
Q3
2013
7%
6%
5%
3%
4%
2%
1%
0%
-1%
Cost inflation for the construction sector’s small and medium enterprises has tended to be more volatile in recent quarters compared to other sectors. This quarter cost pressures increased slightly, with inflation rebounding to 1.9% year-on-year, close to the 2.0% we saw in Q1.
This suggests that last quarter’s weak cost growth could have been a blip with employment costs falling – the only time this happened during the past six quarters.
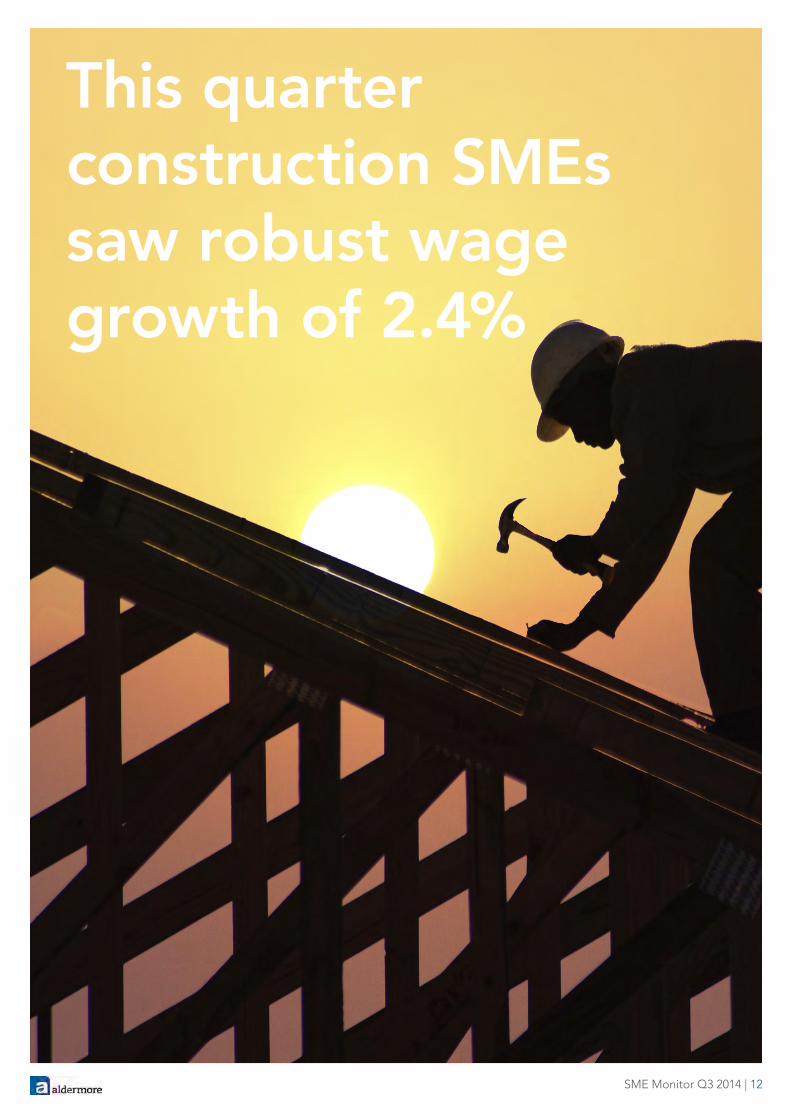
This quarter construction SMEs saw robust wage growth of 2.4% and an even greater rise of 3.1% in the cost of construction inputs. These two components make up more than two thirds of the sectors’ overall costs.
Pulling the headline figure to the other direction was the easing of cost pressures from physical inputs such as chemicals and metals, whose price declined by 1.1% year-on-year in Q3. These make up roughly a sixth of the overall costs in the sector.
SME Monitor Q3 2014 | 12
This quarter construction SMEs saw robust wage growth of 2.4%

SME Monitor Q3 2014 | 13
Pace of cost inflation eases for SMEs in the retail sector
The main sources of costs for SMEs in the retail sector are physical inputs
(such as food and chemicals) and transport & storage costs
Cost pressures fell further for SME retailers this quarter, in line with the general downward trend that has seen annual cost inflation easing since early 2013. The pace stood at 0.3% year-on-year this quarter, down from last quarter’s already weak 0.6% and marking the lowest rate seen in over four years.
The main sources of costs for SMEs in the retail sector are physical inputs (such as food and chemicals) and transport & storage costs, both of which declined in cost by about 1% year-on-year this quarter. Lower wage bills and cheaper telecoms & IT also helped bring the overall cost inflation pace down.
However, there were also some rises in the costs of construction inputs and business services that prevented overall inflation from cooling even further.
SME annual inflation rate, retail firms Source: Cebr Analysis
5%
3%
4%
2%
1%
0%
-1%
-2%
Q3
2006
Q3
2007
Q3
2008
Q3
2009
Q3
2010
Q3
2011
Q3
2012
Q3
2014
Q3
2013

SME Monitor Q3 2014 | 14
Costs for business service firms return to positive growth
Costs for the UK’s business services SMEs were up 1.0% in Q3 2014 compared to the same time last year.
The cost of bringing in outsourced services from other firms, which represents over a fifth of business services’ SMEs total costs, rose by 2.3% year-on-year.
Wage bills - which make up more than half of the overall costs - rose by 0.8% on the year. This was a big change from last quarter which saw wages fall by 3.2%, helping bring overall costs down by 1.4%.
The picture was mixed for the remaining cost inputs: telecoms & IT, physical inputs, and transport & storage all declined on a year-on-year basis this quarter. On the other hand, business services SMEs saw rises in the costs of financial & other services, commercial rent, construction, and energy.
Wage bills rose by 0.8% year-on-year
SME annual inflation rate, business service firmsSource: Cebr Analysis
6%
4%
2%
0%
-2%
-4%
-6%
Q3
2006
Q3
2007
Q3
2008
Q3
2009
Q3
2010
Q3
2011
Q3
2012
Q3
2014
Q3
2013

SME Monitor Q3 2014 | 15
Confidence remains highest amongthe UK’s Small and Medium-sizedbusinesses

SME Monitor Q3 2014 | 16
Business confidence cools further but
remains high by historical standardsConfidence among UK businesses, as measured by the ICAEW/Grant Thornton Business Confidence Monitor, showed signs of cooling further for the second consecutive quarter this year.
This gentle downward turn in business sentiment suggests that the recovery may be losing some steam after an impressive run so far this year. The pace of GDP expansion has also started decelerating since the second half of the year, official data shows.
It would however be mistaken to view this cooling as alarming: confidence remains high by historical standards. The recent downturn should be rather viewed as a return to normality from exceptionally strong positive sentiment among businesses in the past year as the recovery really took off.
Confidence remains highest among the UK’s Small and Medium-sized businesses (SMEs), stressing their contribution to the recovery.
Business confidence by company employment sizeSource: ICAEW / Grant Thornton Business Confidence Monitor
40
30
20
10
0
-10
-20
Q2
2010
Q1
2010
Q2
2011
Q2
2012
Q2
2013
Q3
2010
Q3
2011
Q3
2012
Q3
2013
Q4
2010
Q4
2011
Q4
2012
Q4
2013
Q1
2011
Q1
2012
Q1
2013
Q2
2014
Q3
2014
Q4
2014
Q1
2014
Confidence scores are calculated by asking the question “how confident are you in business prospects in next 12 months, versus last 12 months”, with positive and negative answers being balanced to give overall score.
Large (250+) Very large (1,000+)SMEs (0-249)

SME Monitor Q3 2014 | 17
Loan prices to small enterprises dip over the summerMedian interest rates for the UK’s small enterprises fell in July and August to stand at 4.5% on the latest data.
This is the lowest level seen since November last year, but remains elevated compared to pre-crisis levels.
Moreover, interest rates for small enterprises are above those enjoyed by their medium- sized counterparts.
The median rate for medium-sized enterprises also continued to gently decline and stood at 3.18% in August, the lowest seen since July 2009.
5.0%
3.0%
3.5%
4.0%
4.5%
May
11
May
12
May
13
May
14
Aug
14
Aug
10
Aug
11
Aug
12
Aug
13
No
v 10
No
v 11
No
v 12
No
v 13
Feb
11
Feb
12
Feb
13
Feb
14
Smaller SMEs are those with annual debit account turnover on the main business account of less than £1 million. Medium SMEs are those with annual debit account turnover on the main business account of between £1 million and £25 million.
Median interest rates on variable-rate facilities for SMEs, three month average
Medium SMEsSmaller SMEs
Source: Bank of England. Trends in Lending report
Median interest rates for the UK’s small enterprises fell in July and August to 4.5% - the lowest level since November last year

SME Monitor Q3 2014 | 18
Company liquidations continue on downward trendThe level of UK business failures has come down significantly over the past year to stand at just over 3,600 in the latest quarter (Q3 2014), compared to over 4,100 at the same point a year ago.
With the exception of a blip in Q1 2014, the level of insolvencies has been declining on a year-on-year basis for over two years now.
However, there is still room for the picture to improve as failure levels are still higher than before the crisis, when they averaged 3,300 between 2004 and 2008.
The recent downward trend can be partly explained by the highly accommodative monetary policy environment characterised by record-low interest rates and unconventional expansionary measures such as quantitative easing.
The backdrop of a strong recovery however is slowly setting the scene for a rate rise next year, something that could challenge some of the UK’s businesses and potentially raise the level of insolvencies.
4,000
5,000
6,000
2,000
3,000
1,000
0
Total number of UK company liquidationsSource: UK Insolvency Service
Q3
2006
Q3
2005
Q3
2004
Q3
2007
Q3
2008
Q3
2009
Q3
2010
Q3
2011
Q3
2012
Q3
2014
Q3
2013

SME Monitor Q3 2014 | 19
Appendix: Employment costs and physical inputs make up the bulk of average SME costs
Purchases of physical inputs and labour costs are the largest costs for SMEs, accounting for some 20% and 33% of total businesses expenses for the average SME.
On top of this, a further 21% of total costs are spent on business services such as legal & accounting, advertising, IT & telecommunications.
SMEs in manufacturing are heavily weighted toward physical inputs - more than 50% of total cost is on these intermediate goods.
SMEs in retail have a strong transport and storage weighting in their cost profile.
Meanwhile, over half of the costs for business services SMEs are on employment.
Breakdown of business costs, % of total, by SME type
Source: Cebr analysis
Physical Inputs* Transport and Storage Other Service
Business Services** Commercial Rent
Employment costs Construction Energy and Utilities
100%
80%
60%
40%
20%
0%All SMEs Manufacturing RetailConstruction Business
Services
*including raw materials such as those fromagriculture, mining and forestry, as well as manufactured products such as steel, textiles, timber, chemicals and foodstuffs.
** including finance, legal & accounting, IT & telecoms

SME Monitor Q3 2014 | 20
Methodological note:
The figures presented within this report are calculated from a range of data provided by the Office for National Statistics (ONS), including the Services Producer Price Indices (SPPI) and Producer Price Indices (PPI).
For any questions or comments on this report please contact:Andy Homer, PR Manager
0203 553 4244
aldermore.co.uk
Contact