smc regional stormwater monitoring …socalsmc.org/wp-content/uploads/2017/01/long-beach.pdfsmc...
TRANSCRIPT

SMC REGIONAL STORMWATER
MONITORING COMPARISON AND
EVALUATION
OVERVIEW OF CITY OF LONG BEACH
MONITORING PROGRAM
May 15, 2012

MS4 Permit
Los Angeles RWQCB
Term: 1999 – ?
Most monitoring plan details prescribed in permit
City of Long Beach
Description # sites # storm events # dry events1,2
Mass emission
– complete
4 4 2
Mass emission
– TSS
4 All > 0.25
inches
1. Dry events between April 15th and Sep 30th
2. Only 3 sites, Belmont Pump Station now has a low flow diversion
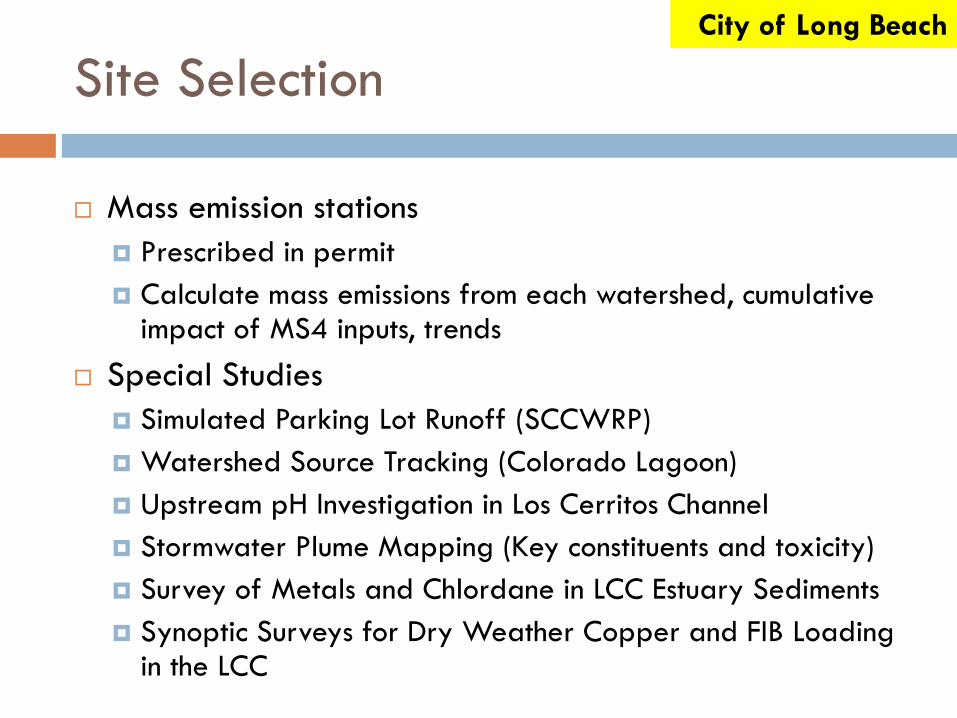
Site Selection
Mass emission stations
Prescribed in permit
Calculate mass emissions from each watershed, cumulative impact of MS4 inputs, trends
Special Studies
Simulated Parking Lot Runoff (SCCWRP)
Watershed Source Tracking (Colorado Lagoon)
Upstream pH Investigation in Los Cerritos Channel
Stormwater Plume Mapping (Key constituents and toxicity)
Survey of Metals and Chlordane in LCC Estuary Sediments
Synoptic Surveys for Dry Weather Copper and FIB Loading in the LCC
City of Long Beach
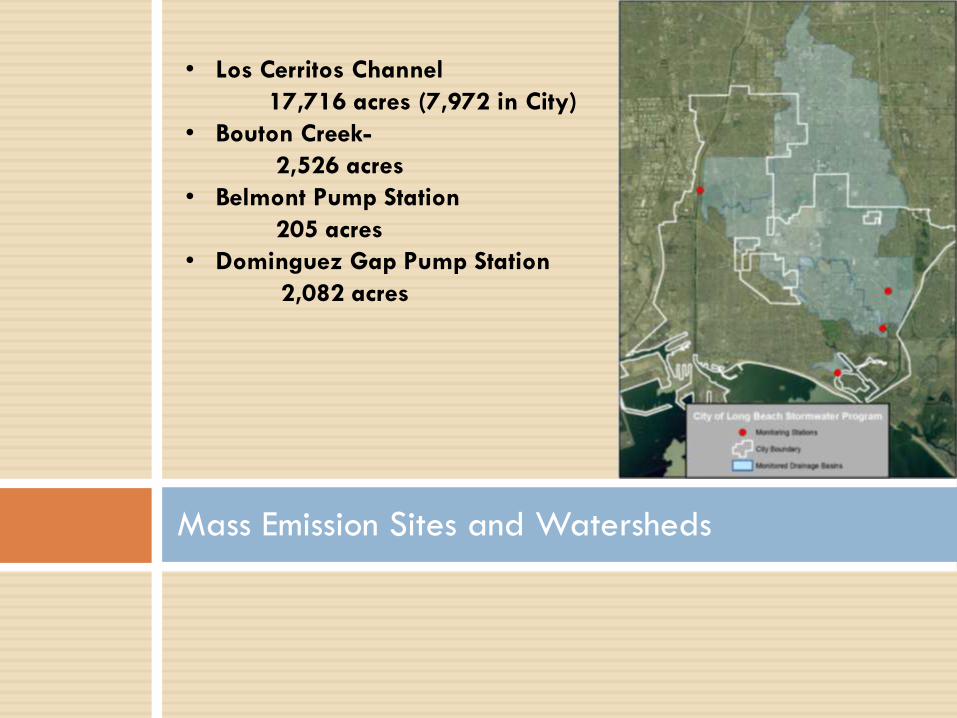
Mass Emission Sites and Watersheds
• Los Cerritos Channel
17,716 acres (7,972 in City)
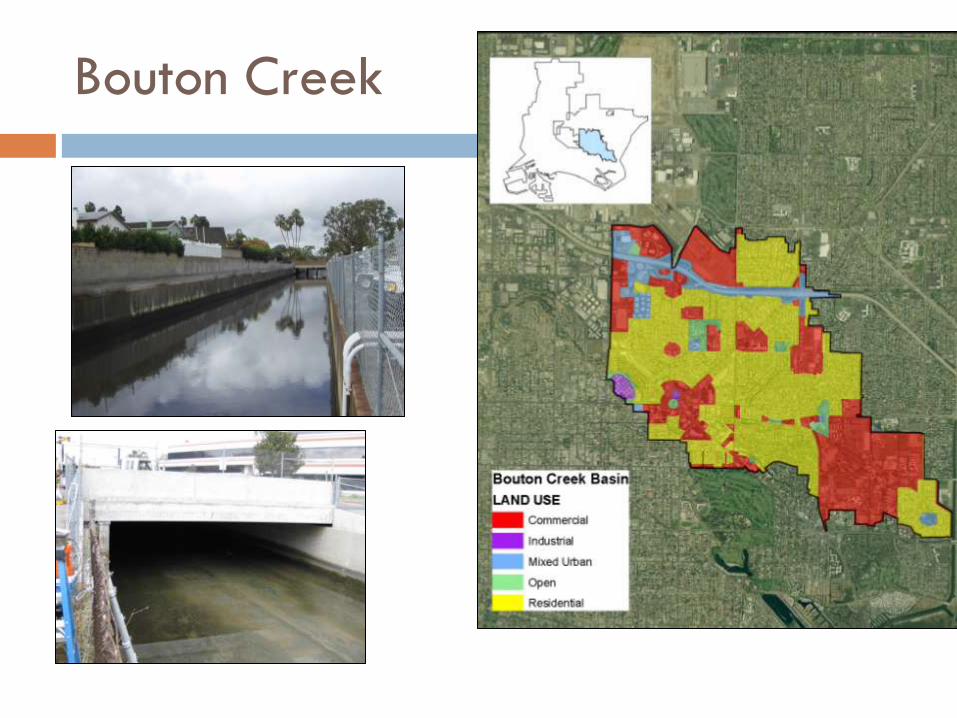
• Bouton Creek-
2,526 acres
• Belmont Pump Station
205 acres
• Dominguez Gap Pump Station
2,082 acres
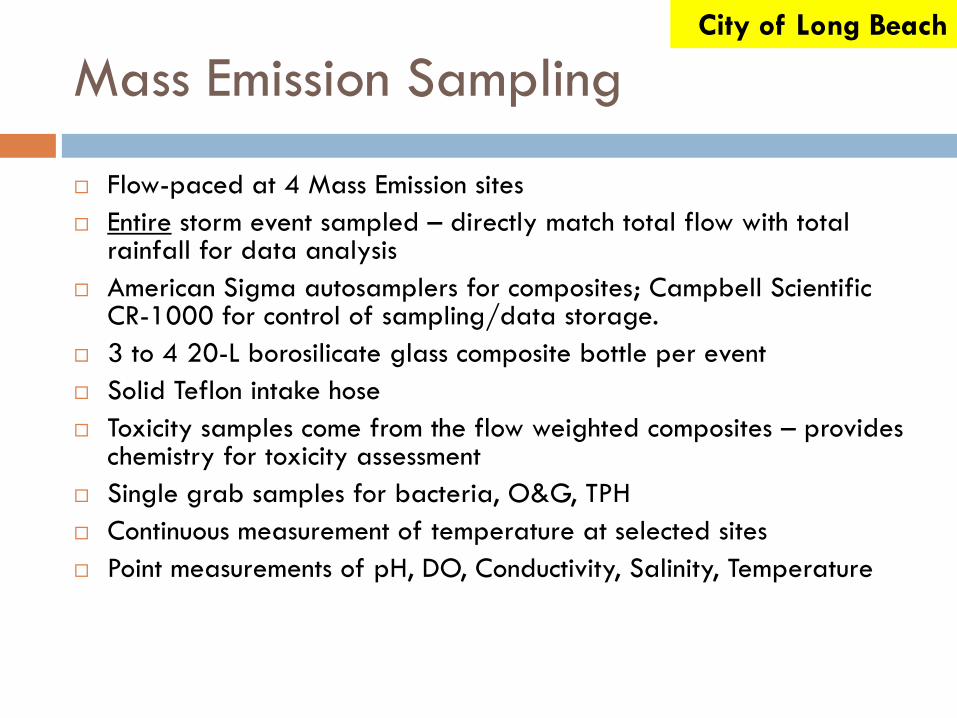
Mass Emission Sampling
Flow-paced at 4 Mass Emission sites
Entire storm event sampled – directly match total flow with total rainfall for data analysis
American Sigma autosamplers for composites; Campbell Scientific CR-1000 for control of sampling/data storage.
3 to 4 20-L borosilicate glass composite bottle per event
Solid Teflon intake hose
Toxicity samples come from the flow weighted composites – provides chemistry for toxicity assessment
Single grab samples for bacteria, O&G, TPH
Continuous measurement of temperature at selected sites
Point measurements of pH, DO, Conductivity, Salinity, Temperature
City of Long Beach
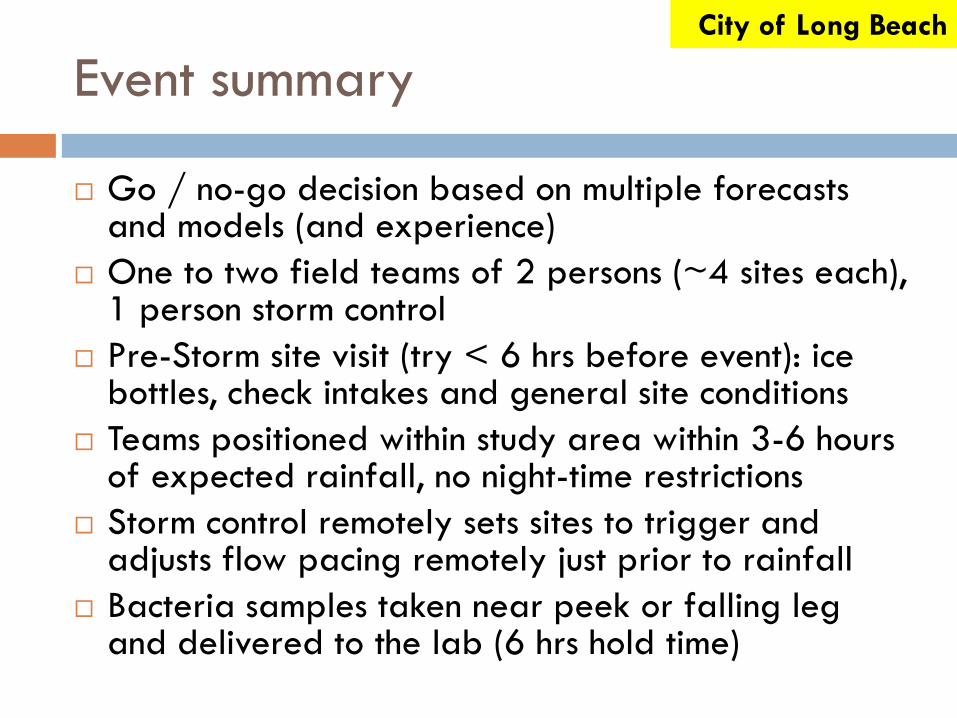
Event summary
Go / no-go decision based on multiple forecasts and models (and experience)
One to two field teams of 2 persons (~4 sites each), 1 person storm control
Pre-Storm site visit (try < 6 hrs before event): ice bottles, check intakes and general site conditions
Teams positioned within study area within 3-6 hours of expected rainfall, no night-time restrictions
Storm control remotely sets sites to trigger and adjusts flow pacing remotely just prior to rainfall
Bacteria samples taken near peek or falling leg and delivered to the lab (6 hrs hold time)
City of Long Beach
Event summary
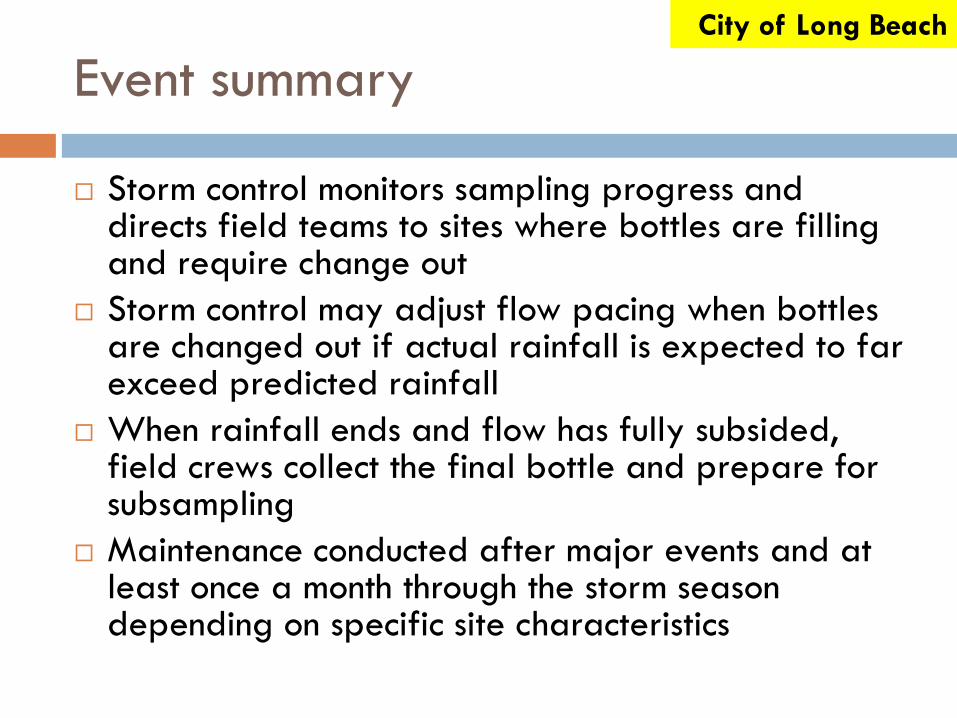
Storm control monitors sampling progress and directs field teams to sites where bottles are filling and require change out
Storm control may adjust flow pacing when bottles are changed out if actual rainfall is expected to far exceed predicted rainfall
When rainfall ends and flow has fully subsided, field crews collect the final bottle and prepare for subsampling
Maintenance conducted after major events and at least once a month through the storm season depending on specific site characteristics
City of Long Beach

Analytes
Conventionals – TSS,TVS, BOD, COD, TOC, alkalinity, pH (field & lab) nutrients, specific conductance, fluoride, chloride, MBAS, total hardness
Indicator Bacteria (total & fecal coliform, enterococcus
Dissolved and Total Metals (11)
Chlorinated Pesticides
PCBs
Organochlorine Pesticides
Organophosphate Pesticides (diazinon, chlorpyrifos, malathion)
Pyrethroid Pesticides (11)
Toxicity Testing/TIEs (urchin, water flea)
City of Long Beach

Quality Assurance
Field/Subsampling Dup, Matrix Spike/Spike Duplicates for each Event
Composite Bottles batch cleaned, blanked, and individually tracked.
QA-Grade Laboratory bottles purchased in Lots and blanked before deployment
Subsampling hoses batch cleaned inside and out, blanked, bagged on the ends and stored in large sealed bags for later use.
Subsampling of Composites perform by field staff trained in the procedures – allows for blind dups and effective testing of entire process
City of Long Beach

Uses Stage-Discharge Rating Curve from former Gaging Station (~150-200 ft
upstream )
Los Cerritos Channel
Bouton Creek

05
101520253035404550
17
-De
c-10
00
:00
17
-De
c-10
06
:00
17
-De
c-10
12
:00
17
-De
c-10
18
:00
18
-De
c-10
00
:00
18
-De
c-10
06
:00
18
-De
c-10
12
:00
18
-De
c-10
18
:00
19
-De
c-10
00
:00
19
-De
c-10
06
:00
19
-De
c-10
12
:00
19
-De
c-10
18
:00
Co
nd
uct
ivit
y (m
S/cm
)
C1 - Float
C2 - Bottom
C3 - 1 ft Above Bottom
0
0.05
0.1
0.15
0.2
0.25
0.3
0.35
0.4
0
0.5
1
1.5
2
2.5
3
17
-De
c-10
00
:00
17
-De
c-10
06
:00
17
-De
c-10
12
:00
17
-De
c-10
18
:00
18
-De
c-10
00
:00
18
-De
c-10
06
:00
18
-De
c-10
12
:00
18
-De
c-10
18
:00
19
-De
c-10
00
:00
19
-De
c-10
06
:00
19
-De
c-10
12
:00
19
-De
c-10
18
:00
Rai
n In
ten
sity
(in
/hr)
Cu
mu
lati
ve R
ain
fall
(in
)
Bouton Creek Cumulative RainRainIntesity
Total Rainfall: 2.34 inMaximum Intensity = 0.36 in/hr
-100
-50
0
50
100
150
200
17
-De
c-10
00
:00
17
-De
c-10
06
:00
17
-De
c-10
12
:00
17
-De
c-10
18
:00
18
-De
c-10
00
:00
18
-De
c-10
06
:00
18
-De
c-10
12
:00
18
-De
c-10
18
:00
19
-De
c-10
00
:00
19
-De
c-10
06
:00
19
-De
c-10
12
:00
19
-De
c-10
18
:00
Flo
w (
cfs)
BC-GS5
Sample Taken
Total Storm Volume: 9029 kcfPeak Flow: 183 cfs
93% Capture
Bouton Creek
Tidal Conditions
• 3 Conductivity/Temp Sensors
• Directional Flow Measurement
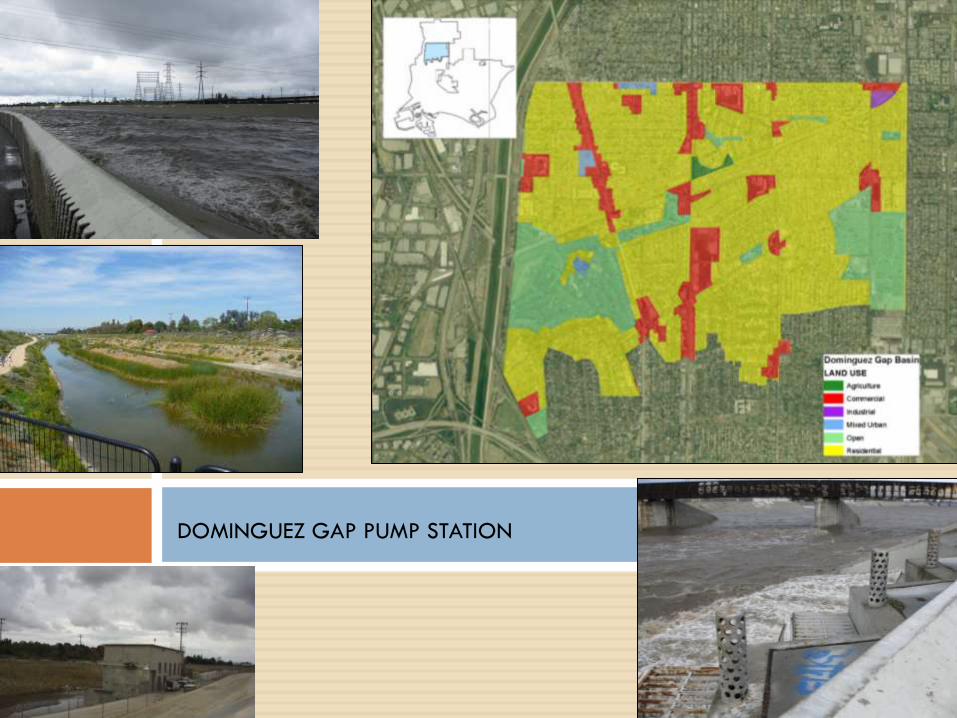
DOMINGUEZ GAP PUMP STATION

DATA ANALYSIS
Graphical Comparisons
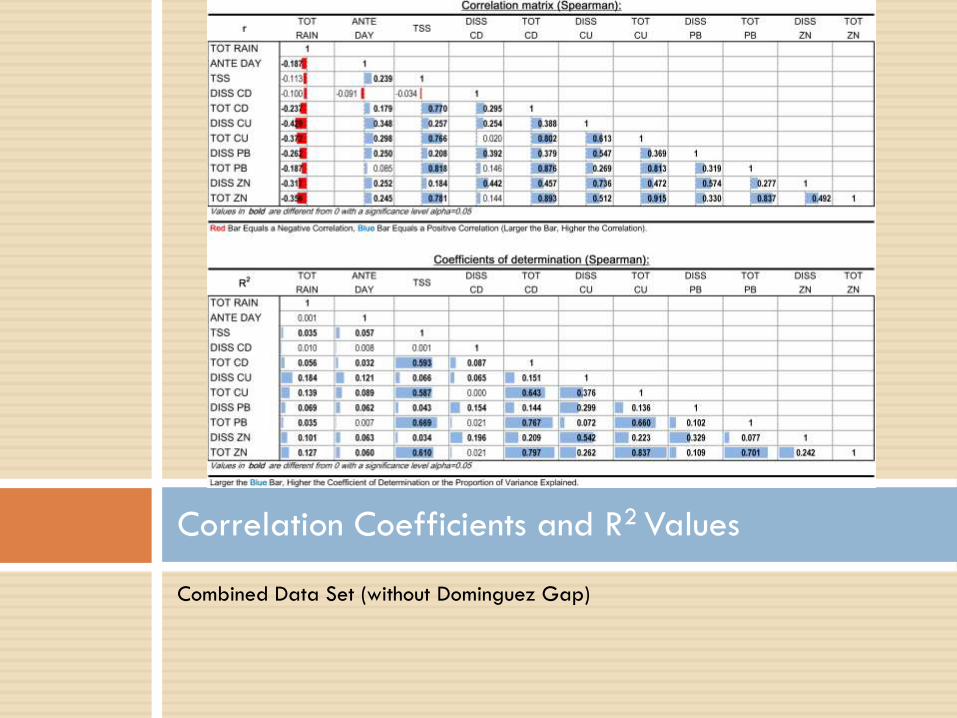
Correlation Coefficients and R2 Values
Combined Data Set (without Dominguez Gap)

Complete Data except Dominguez Gap
Multiple Linear Regression
Multiple Linear Regression Results: Stepwise Backward Procedure
Dependent Y's
Explanatory Model Diss. Total Diss. Total Diss. Total Diss. Total
X's Statistics Cadmium Cadmium Copper Copper Lead Lead Zinc Zinc
(overall importance from high to
low)
R² 0.10 0.65 0.34 0.77 0.32 0.68 0.21 0.67
F 5.22 127.7 17.6 91.0 16.3 74.4 12.0 96.1
Pr > F 0.002 < 0.0001 < 0.0001 < 0.0001 < 0.0001 < 0.0001 < 0.0001 < 0.0001
TSS F 233.9 200.2 12.4 204.2 174.7
Pr > F < 0.0001 < 0.0001 0.001 < 0.0001 < 0.0001
ANTEDAY F 6.0 13.7 36.9 6.8 9.13 14.5
Pr > F 0.015 0.000 < 0.0001 0.010 0.003 0.000
SEASONRAIN F 11.5 8.0 9.6 3.2 6.3
Pr > F 0.001 0.005 0.002 0.075 0.014
DURATION F 4.4 5.7 10.1 8.7
Pr > F 0.037 0.019 0.002 0.004
TOTFLOW F 5.3 10.7 12.7
Pr > F 0.023 0.001 0.000
TOTRAIN F 5.6 11.6 9.46
Pr > F 0.019 0.001 0.003
MAXINT F 6.25
Pr > F 0.014
ANTERAIN F 5.2
Pr > F 0.025