smartphone data utilization march 2010
TRANSCRIPT

Smartphone Data UtilizationMarch 2010
Validas® Patent Pending Copyright 2010Validas LLC All Rights Reserved.

• Sample of roughly 14,000+ U.S. consumer lines– AT&T, Sprint, Verizon Wireless, T Mobile, and US Cellular– Carrier distribution aligns with published market share
• ARPU of $49-– Aligns with US ARPU of roughly $51-
• Enterprise data growth drawn from Fortune 500 customer with more than 4000 lines (last slide)
• All data drawn from bills uploaded to Validas’ analytical engine– Via website, via licensee website, or via advisory services process– January 1, 2009 through March 5, 2010
Sources

Data Utilization: MBs per Month (Mean)
2554
150273
1416
1
10
100
1000
10000
Non-Smartphone Blackberry Other Smartphone iPhone Aircard
Avg MBs Month (no tethering)

MB Usage Distribution: All Users
8723
4060
364 332 271
116 101
1
10
100
1000
10000
0 MB 0 to 50 MB 50 to 100 MB 100 to 200 MB 200 to 500 MB 500 to 1000 MB More than 1000 MB
MB Usage Distribution - All Users
Total Users
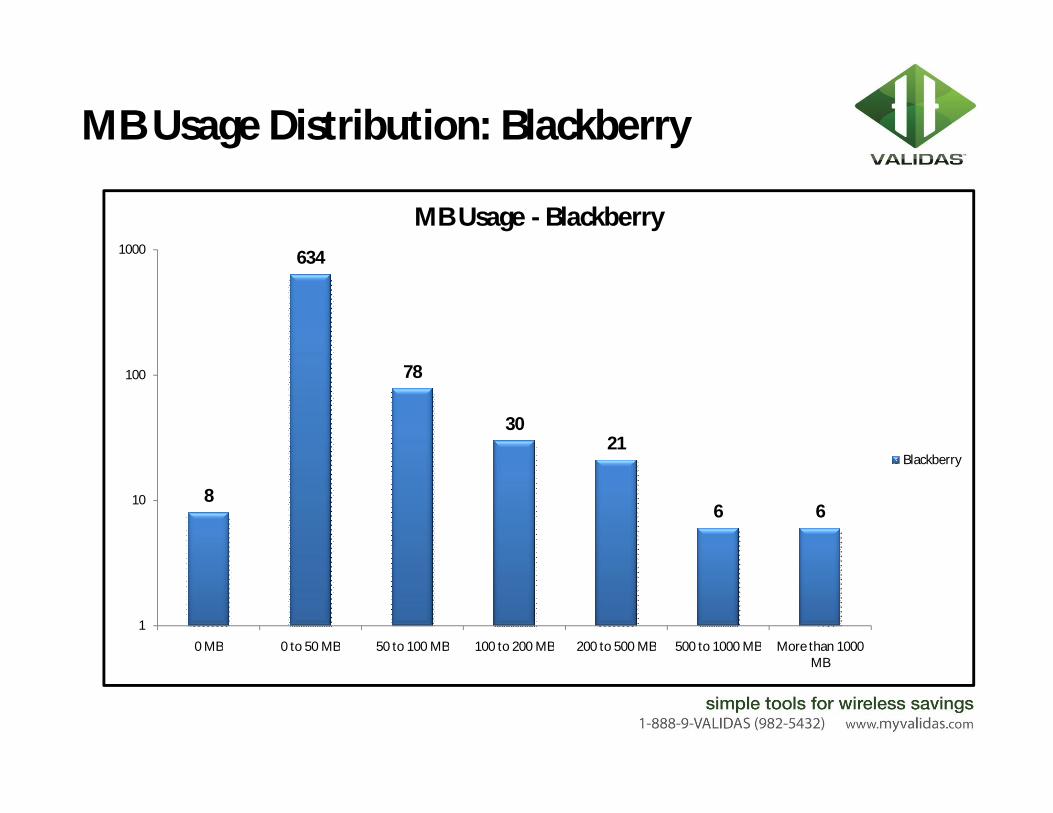
MB Usage Distribution: Blackberry
8
634
78
3021
6 6
1
10
100
1000
0 MB 0 to 50 MB 50 to 100 MB 100 to 200 MB 200 to 500 MB 500 to 1000 MB More than 1000 MB
MB Usage - Blackberry
Blackberry

MB Usage Distribution: iPhone
11
120
141
204
183
64
34
0
50
100
150
200
250
0 MB 0 to 50 MB 50 to 100 MB 100 to 200 MB 200 to 500 MB 500 to 1000 MB More than 1000 MB
MB Usage - iPhone
iPhone

MB Usage Distribution: Other Smartphone
8
138
38 35
189 9
0
20
40
60
80
100
120
140
160
0 MB 0 to 50 MB 50 to 100 MB 100 to 200 MB 200 to 500 MB 500 to 1000 MB More than 1000 MB
MB Usage - Other Smartphone
Other PDA

MB Usage: iPhone v Non-Smartphone
746
3374
0500
1000150020002500300035004000
iPhone Non-Smartphone
# Devices with Data Usage
203,825
83,925
0
50,000
100,000
150,000
200,000
250,000
iPhone Non-Smartphone
Total Megabytes Used (1 Month)
273.2
24.9
0.0
50.0
100.0
150.0
200.0
250.0
300.0
iPhone Non-Smartphone
Avg Megabytes Per User
18%
82%
iPhones v Non-Smartphone by %
iPhone Non-Smartphone
71%
29%
Total Data Usage by %
iPhone Non-Smartphone
Notes:- 18% of the devices used 71% of the data- iPhones used nearly 11 times as much data as non-smartphones- 85% of iPhones used data, where only 21% of non-smartphones used data

Enterprise Data Usage Growth Example
2130 2168 2277 2341 2392 2451 2547
1831 1917 1960 2042 2035 2074 2070
0
500
1000
1500
2000
2500
3000
Aug-09 Sep-09 Oct-09 Nov-09 Dec-09 Jan-10 Feb-10
Total Lines vs Lines with Data Usage
Lines Lines with Data Usage
42.93
67.72 71.8682.55
92.63109.77
117.98
0.00
20.00
40.00
60.00
80.00
100.00
120.00
140.00
Aug-09 Sep-09 Oct-09 Nov-09 Dec-09 Jan-10 Feb-10
Per Line Avg (MB)
Per Line Avg (MB)
Notes:- End of 2009, Early 2010 saw huge growth in data usage
- Avg MBs per line increased 275%
- % of lines with data usage remained relatively steady between 80 % and 85%
- This account is typical of what Validas is seeing across its large enterprise customer base
