smart steel analysts and investors conference 2018 · disproportionate increase in cost of sales...
TRANSCRIPT

SMART STEEL
March 16, 2018
Detlef Borghardt, CEO
Dr. Matthias Heiden, CFO
Stephan Haas, Head of IR / Corp. Comm.
Analysts and Investors Conference 2018

2
Agenda
1 Highlights business year 2017
2 Market trend
3 Financial information
4 Outlook 2018
5 Takeover V.Orlandi S.p.A

3
Business summary: Sales target 2017 overachieved
FY 2017 sales driven by soaring customer demand from the US truck and trailer
industries, a solid increase in Europe and dynamic sales growth in China, sales revenue
picked up 9.3% equalling € 1,138.9 mn (py: 1,042.0)
Negative FX effects (€ 9.1 mn) and sales contribution of the acquired Brazilian company
KLL (€ 9.2 mn) balanced out
Organic sales were up 9.3% to € 1,138.8 mn topping the upward guidance adjustment
from Oct. 2017 (€ 1,125 to 1,135 mn) and the originally planned figure of up to € 1,090 mn
In Q4 sales momentum continued in all regions with sales increasing by 8.6% to
€ 274.2 mn (py: 252.6)
In Q4 2017 negative FX effects came in at € 11.4 mn, organic sales growth was double-
digit at 13.1%

4
Business summary: Adj. EBIT margin within target range despite
burdening cost overshoot in the Americas region
FY 2017 adj. EBIT increased to € 91.2 mn (py: 90.4)
As expected, adj. EBIT margin came in at 8.0% (py: 8.7%) at the lower end of the
8 to 9% range, mostly due to an unexpected, swift increase in demand from US truck and
trailer customers coinciding with the transitioning measures from the US plant consolidation
> Negative impact from steel price increase and unfavorable product mix
> Significant impact on earnings from implementation of major US plant consolidation
> € 10.9 mn (of a total of € 13.2 mn) in one-time restructuring cost related to US plant
consolidation that largely consisted of relocation costs, impairments of tools and
equipment and severance payments, that were adj. for
> € 10.3 mn burden from unplanned additional cost attributable to the US plant
consolidation measures and effects which were fully accounted for in the EBIT
Reported EBIT achieved approx. € 72.7 mn (py: 78.4)

5
Business summary: Final phase of US plant consolidation weighing in
on Q4 2017
Q4 saw significant negative impact on earnings from the US plant consolidation as
OEM sales in the US picked up 13.7% organically while plants were transitioned
Q4 included € 1.6 mn (Group total € 1.7 mn) in one-time restructuring cost related to the
US plant consolidation, which were readded in the adj. EBIT
€ 6.3 mn burden in Q4 2017 (€ 4.0 mn in Q3 2017) from higher operating cost related to
the final phase of the US plant consolidation transition measures which were fully
booked into the EBIT
In Q4 2017 adj. EBIT in the Americas region was negative at € -3.9 mn
Compensated partially by strong earnings trend in Europe (including volume-related
year-end positive purchasing effects of € 4.5 mn) and China
Overall in Q4 2017 the Group achieved an adj. EBIT of € 18.5 mn (py: 19.8) equaling an
adj. EBIT margin of 6.7% (py: 7.8%)

6
Agenda
1 Highlights business year 2017
2 Market trend
3 Financial information
4 Outlook 2018
5 Takeover V.Orlandi S.p.A

7
2014 2015 2016
Change
in % yoy
North America
Class 8
ACT Truck Build1) 297 323 228 -29.4
FTR Truck Shipment2) 295 320 227 -29.1
2017
Change
in % yoy
256 +12.0
250 +9.5
2014 2015 2016
Change
in % yoy
Western, Central
& East. EuropeLMC3) 403 427 445 +4.3
2014 2015 2016
Change
in % yoy
North AmericaACT Trailer Shipm.1) 296 334 313 -6.4
FTR Trailer Build2) 292 331 309 -6.6
Global truck forecast in thousand
Global trailer forecast in thousand
2014 2015 2016
Change
in % yoy
Western &
Eastern EuropeTrailer Production4) 261 279 301 +7.8
Sources: 1) ACT N.A. Commercial Vehicle Outlook, Feb. 2018, published monthly by Americas Commercial Transportation Research Co., LLC, Columbus, Indiana.2) North American Commercial Truck & Trailer Outlook, Feb. 2018, published monthly by FTR Associates, Nashville, Indiana.3) LMC/Global Commercial Vehicle Forecast Q3 20174) CLEAR Nov. 2017, Western Europe, Eastern Europe (incl. RU, TR)* Figure relates to OEM business of the Americas region; not only North America** Figure relates to OEM business of the EMEA/I region; not only Western & Eastern Europe
2017
Change
in % yoy
470 +5.5
2017
Change
in % yoy
316 +1.0
314 +2.0
2017
Change
in % yoy
301 0.0
End of 2016, NA class-8 truck production was projected to decrease by around 8% and trailer to fall by 14%;
Instead both segments successively picked up in 2017. For 2018 NA class-8 truck and trailer production are
projected up, European trailer market to consolidate at a high level.
Market trend 2017 and forecast 2018
Share in group
sales FY17*
approx. 20 %
Share in group
sales FY17**
approx. 40 %
Share in group
sales FY17*
approx. 11 %
Share in group
sales FY17**
approx. 4 %
2018
Change
in % yoy
324 +26.6
315 +26.0
2018
Change
in % yoy
490 +4.3
2018
Change
in % yoy
332 +5.1
319 +1.6
2018
Change
in % yoy
286 -5.0

8
Agenda
1 Highlights business year 2017
2 Market trend
3 Financial information
4 Outlook 2018
5 Takeover V.Orlandi S.p.A

9
Strong organic sales growth of 9.3% or almost € 100 mn in FY 2017
1,042.0
96.8-9.1
9.21,138.9
900
1000
1100
1200
Sales in FY 2016 Organic growth FX effects M&A Sales in FY 2017
Reported sales in FY 2017 increased by 9.3% yoy to € 1,138.9 mn featuring strong organic growth of 9.3%;
Negative translational impact (-0.9%) and contribution of KLL (0.9%) balanced out.
in € mn

10
Sustained strong organic growth in Q4 2017: Plus 13.1%
252.6
33.0 -11.4
274.2
200
300
Sales in Q4 2016 Organic growth FX effects Sales in Q4 2017
Q4 2017 top line momentum continued in all regions resulting in an overall revenue increase of 8.5%;
Despite negative FX effects of € 11.4 mn, organic sales growth reached its highest level throughout the year
2017 at 13.1%.
in € mn

11
9.9%
1.6%
26.0%
4.3% 5.4%
41.9%
8.6%6.4%
35.8%
8.1%11.0%
52.9%
13.7%
0%
10%
20%
30%
40%
50%
60%
EMEA/I Americas APAC/China
Q1 17 Q2 17 Q3 17 Q4 17 prel. Q4 17 prel. OE
Upbeat trend in organic sales continued in all regions in Q4 2017
– organic growth rate versus py quarters
Americas: Noticeably higher demand from OEM customers coinciding with relocation measures of US plant
consolidation resulted in noticeable cost issue also in Q4: Organic sales growth in the OEM business in the
US soared by 13.7%. Driven by legislation, demand in China has continued to accelerate also in Q4.
(at constant currencies
versus py quarter)US only

12
1,042.0
1,138.9
700
800
900
1,000
1,100
1,200
2016 2017
Sales in € mn
Group sales and group adj. EBIT in FY 2017
+ 96.9
90.4 91.2
8.7%8.0%
0%
2%
4%
6%
8%
10%
12%
14%
0
10
20
30
40
50
60
70
80
90
100
2016 2017
+ 0.8
Adj. EBIT in € mn and margin in %

13
Group sales and group adj. EBIT by quarter
252.6
287.3300.3
277.1 274.2
0
100
200
300
Q4 Q1 Q2 Q3 Q4
2017
19.8
25.1
26.7
20.9
18.5
7.8%
8.7% 8.9%
7.5%
6.7%
0%
4%
8%
12%
16%
0
10
20
30
Q4 Q1 Q2 Q3 Q4
2017
Adj. EBIT in € mn and margin in %Sales in € mn

14
Reconciliation of sales to gross profit FY 2017
1,138.9
205.110.9
10.3
0
200
400
600
800
1000
1200
1400
FY 2017 sales Cost of sales Gross profit
Additional operating cost
Restructuring
cost US
933.8
total
+-FY 2017 preliminary gross profit reached € 205.1 mn carrying gross margin of 18.0% (py: 19.8%);
Disproportionate increase in cost of sales (+11.8% yoy) vs sales growth (+9.3% yoy) to a large extent due to
the US: temporarily higher number of workforce, significantly higher expedited freight cost due to seasonally
untypical soaring of customer call-offs coinciding with US plant consolidation.
in € mnImpacts on gross margin in FY 17
Volume +-
Segment Mix -Restructuring Cost -
Exchange Rate -Operating
Efficiencies
Steel Price -
Temp. Workforce -
15
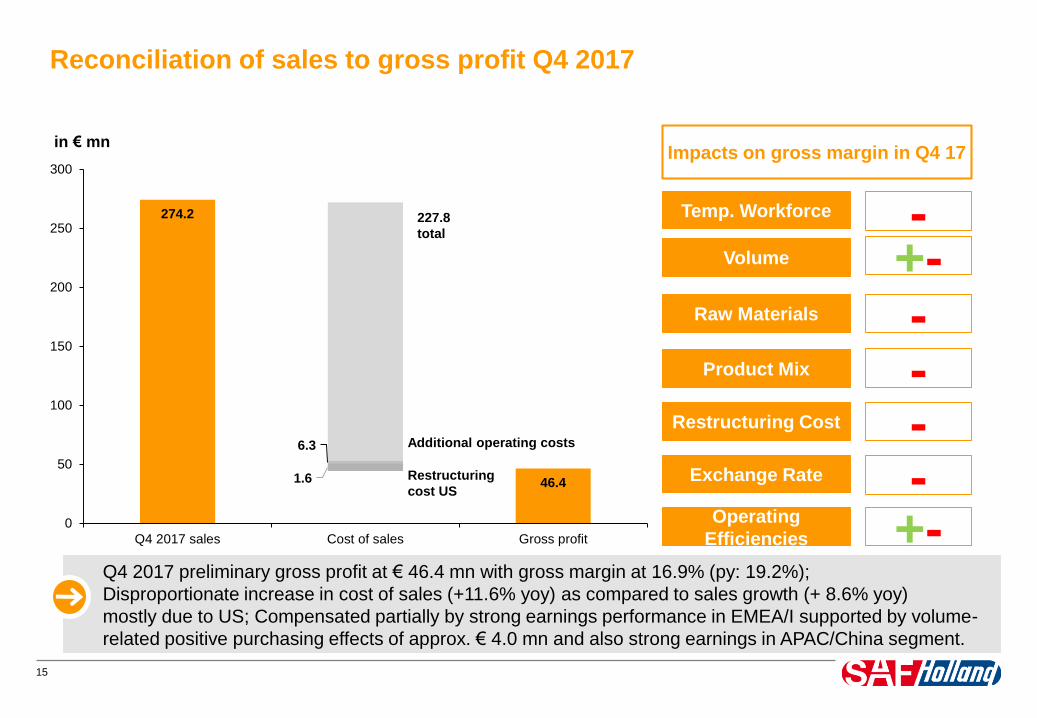
Reconciliation of sales to gross profit Q4 2017
274.2
46.41.6
6.3
0
50
100
150
200
250
300
Q4 2017 sales Cost of sales Gross profit
Additional operating costs
Restructuring
cost US
227.8
total
+-Q4 2017 preliminary gross profit at € 46.4 mn with gross margin at 16.9% (py: 19.2%);
Disproportionate increase in cost of sales (+11.6% yoy) as compared to sales growth (+ 8.6% yoy)
mostly due to US; Compensated partially by strong earnings performance in EMEA/I supported by volume-
related positive purchasing effects of approx. € 4.0 mn and also strong earnings in APAC/China segment.
in € mnImpacts on gross margin in Q4 17
Volume +-
Product Mix -Restructuring Cost -
Exchange Rate -Operating
Efficiencies
Raw Materials -
Temp. Workforce -

16
Reconciliation reported EBIT to adj. EBIT FY 2017
72.7
91.2
5.3
13.2
0
10
20
30
40
50
60
70
80
90
100
Reported EBIT Depreciation and amortization fromPPA
Restructuring costs Adjusted EBIT
Incl. restructuring and transaction costs totaling € 13.2 (6.6) mn and PPA of € 5.3 (5.3) mn, the adj. EBIT
amounted to € 91.2 (90.4) mn. Adjustments for the large part were related to the US plant consolidation (€
10.9 mn).
in € mn

17
Reconciliation reported EBIT to adj. EBIT Q4 2017
15.5
18.5
1.3
1.7
0
10
20
Reported EBIT Depreciation and amortization fromPPA
Restructuring costs Adjusted EBIT
Incl. restructuring and transaction costs totaling € 1.7 (0.9) mn and PPA of € 1.3 (1.3) mn, the adj. EBIT
amounted to € 18.5 (19.8) mn. Adjustments in Q4 2017 for the large part were related to the US plant (€ 1.6
mn) consolidation.
in € mn

18
Negative effects on Q4 EBIT and adj. EBIT in the AMERICAS region
in € mn
5.7
-1.1
-2.3
-1.0
-1.9
-3.3-3.9
-5
-4
-3
-2
-1
0
1
2
3
4
5
6
7
Adj. EBIT Q4 2016 Compensationpayments
Expedited freight Increasedsubcontracting
Plant inefficiencies Mix / Other Adj. EBIT Q4 2017
Apart from € 1.6 mn in restructuring charges (that were adjusted for), € 6.3 mn unplanned extra operating
expenses occurred related to the US plant transition; Besides the continued steel price increase and
restraints on supplying the AM burdened.
Add-on operating expenses € 6.3 mn

19
Share of group sales by channel and region in 2017
75.6 % (py: 74.1 %)
24.4 %(py: 25.9 %)
OE business Aftermarket business
Share of OEM business increases due to well-above trend line sales growth; Well-balanced geographic
exposure in the EMEA/I and Americas regions with clear growth strategy until 2020 in APAC/China and
EMEA. In 2017 highest growth rate percentage-wise in APAC/China.
53.7%(py: 54.6%)
37.7%(py: 38.6%)
8.6 %(py: 6.8%)
EMEA/I Americas APAC/China

20
Adj. EBIT in € mn and margin in %
Sales in € mn
Business performance by region – EMEA/I: Solid organic growth
Summary
• Robust market environment in most countries. Significant
growth impetus from Southern European countries such as
Spain, Italy, and France combined with market share gains.
• Well-above market 7.6% sales increase in 2017 to € 611.8 mn
(568.8), organic growth amounted to 7.7% yoy
• Solid overall development in the markets in the Middle East
and Africa with Turkish plant ramping succesfully
• Adj. EBIT 2017 up by 16.1% yoy rising to € 67.7 mn (58.3)
• Pick-up in the adj. EBIT margin 11.1% (10.3%)
• The effect of higher steel prices and a high sales volume of
standard products were offset by cost reductions, further
process improvements and economies of scale
• In Q4 positive effects on material cost from attaining specific
purchasing volumes in the amout of € 4.5 mn
568.8611.8
0
100
200
300
400
500
600
700
2016 2017
58.3
67.7
10.3%11.1%
0%
2%
4%
6%
8%
10%
12%
14%
0
10
20
30
40
50
60
70
80
2016 2017

21
Adj. EBIT in € mn and margin in %
Sales in € mn
Business performance by region – Americas: Unexpectedly high OEM
sales growth in HY 2 coinciding with US plant transition measures
402.3429.4
0
100
200
300
400
500
2016 2017
30.0
16.1
7.4%
3.7%
0%
2%
4%
6%
8%
10%
12%
14%
16%
0
10
20
30
40
2016 2017
Summary
• In 2017 sales increased 6.7% to € 429.4 mn (402.3)
• Adj. for FX and KLL (approx. € 9.7 mn), sales organically
picked up 6.0%
• Unexpectedly strong jump in customer demand in the OEM
business accompanied by structural growth drivers
• In Q4 organic sales growth of 11.0%
• In 2017 adj. EBIT fell to € 16.1 mn (30.0), translating into adj.
EBIT margin of 3.7% (7.4%)
• One-time restructuring costs in the course of the consolidation
of the US plant network in the amount of € 10.9 mn, which
were added back in the calculation of the adj. EBIT.
• Unplanned additional expenses of € 4.0 mn in the third quarter
and € 6.3 mn in the fourth quarter of 2017, which were fully
recognized in profit or loss
• Weak Mexican market and steel price increase burdened
• Restraints in supplying the AM (Aftermarket)

22
Adj. EBIT in € mn and margin in %
Sales in € mn
Business performance by region – APAC/ China: Strong sales growth
and enhanced profitability
Summary
• Sales in 2017 increased 37.8% to € 97.7 mn (70.9), organically
sales rose by 40.5%
• Business development in the APAC/China region was driven
by strong demand for trailer components in China
• The overload ban for commercial vehicles (GB 1589) and the
announcement of stricter safety regulations (GB 7258) for
dangerous goods transportation led to a noticeable increase in
demand in the premium segment in China
• Adj. EBIT in the region increased to € 7.4 mn (2.1); adj EBIT
margin rose to 7.6% (3.0%)
• Positive trend in China despite the fact that sales originate
almost exclusively from OE, but supported by positive mix
effects and economies of scale
• Solid development also in other markets of the region
70.9
97.7
0
10
20
30
40
50
60
70
80
90
100
110
2016 2017
2.1
7.4
3.0%
7.6%
0%
2%
4%
6%
8%
10%
12%
0
2
4
6
8
2016 2017

23
From pre-tax earnings to EPS FY 2017
in € mn 2017 2016
Financial result -16.5 -13.5
Result before tax 56.2 65.0
Income tax -15.2 -21.5
Result for the period 41.0 43.5
Result for the period
attributable to equity holders of the parent 42.9 44.2
Adj. Result for the period 52.7 53.7
Basic EPS 0.95 0.98
Adj. basic EPS 1.16 1.18

24
Extraordinary effect from US tax reform on net income: Overall € 2.0 mn
positive effect
39.1
41.0
4.5 -2.6
0
10
20
30
40
50
Normalized result for the period Effect from US tax reform Recognized deferred tax assets Result for the period
While the US tax effects, including the statutory changes from the US tax reform, resulted primarily in one-
time positive effects in the amount of € 4.5 mn, one-time impairment on recognized deferred tax assets for
recognized loss carryforwards at other subsidiaries had a countering effect of around € 2.6 mn

25
Reconciliation from result before tax to free cash flow
in € mn 2017 2016
Result before tax 56.2 65.0
Finance result -16.5 -13.5
Amortization/depreciation 24.6 22.6
Changes in Net Working Capital -25.4 1.9
Other items cash flow 2.2 3.4
Operating cash flow before income tax 74.1 106.4
Income tax paid -17.3 -13.7
Operating cash flow 56.8 92.7
Investments in PPE and intangible assets -27.1 -25.0
Free cash flow 29.7 67.7

26
13.0
6.1
19.4
29.2
7.510.9
26.8
-15
-5
5
15
25
35
Q1 Q2 Q3 Q4 Q1 Q2 Q3 Q4
2016 2017
Free cash flow reaches € 30 mn
Operating free cash flow in € mn
Operating FCF
• Full-year 2017 free cash flow at solid € 29.7 mn (67.7)
• Dividend distribution in 2017 was once again fully covered
by the generation of internal funds
NWC/ Inventories
• Net working capital due to strong organic sales growth
increased by € 10.3 mn to € 120.6 mn yoy
• Disproportionately low increase in inventories of € 4.3 mn
yoy versus sales growth
• Days of inventories at 53 (PY: 57) days at the end of Q4
2017
Net working capital in € mn and as % of sales
118.4
133.3125.2
110.3
144.8 142.8 142,7
120.6
11.4%12.2%12.2%
10.3%
12.6% 11.9%12.9%
11.0 %
0%
5%
10%
15%
20%
0
20
40
60
80
100
120
140
160
Q1 Q2 Q3 Q4 Q1 Q2 Q3 Q4
2016 2017
127.2 123.7 124.6 129.4
145.7138.9 139.3 133.7
5551
5457
57
5154
53
25
35
45
55
65
75
0
20
40
60
80
100
120
140
160
Q1 Q2 Q3 Q4 Q1 Q2 Q3 Q4
2016 2017
Inventories in € mn and days of inventories
-15.6

27
Sustainable dividend payed from own cash flow generated,
yield around 3%
0.27
0.32
0.40
0.44 0.45
2013 2014 2015 2016 2017*
* To be proposed at Annual General Meeting 2017
in € per share

28
Agenda
1 Highlights business year 2017
2 Market trend
3 Financial information
4 Outlook 2018
5 Takeover V.Orlandi S.p.A

29
Outlook: Financial targets 2018 and mid-term planning 2020
FY 2018* Strategy 2020
Sales
Organic increase of 4 to 5%
+ potential M&A
Assuming stable FX rates and
unchanged scope of consolidation
Organic: € 1,250 mn
+ M&A: Coops, JVs, acquisitions
Total: € 1,500 mn
Adj. EBIT margin 8 to 8.5% ≥ 8%
NWC ratio 12% 12%
CAPEX
€ 38 to 40 mn
incl. high single-digit Euro mn
amount related to new China plant
€ 26 mn to € 28 mn p.a.
* Projections assume that there is no significant deterioration of the political, economic or industry-specific environment; organic projections do not
include potential sales and earnings contributions from acquisitions or JVs

30
Agenda
1 Highlights business year 2017
2 Market trend
3 Financial information
4 Outlook 2018
5 Takeover V.Orlandi S.p.A

31
Takeover of V.Orlandi S.p.A.: The specialty fifth wheel and coupling
specialist
SAF-HOLLAND is strengthening its position as the number 2 in fifth-wheels and couplings in the European
market by taking over the number 3 player.
Headquarter in Flero (Brescia), Italy
Supplier of couplings for trucks and
specialty fifth wheels
Specialty business with couplings and
drawbar eyes for trailers and specialized
commercial vehicles systems
Serves the industrial, agricultural, forestry
and mining segments
Two production sites in Northern Italy,
currently employing around 60 people
Well-established international sales
network for OEM and Aftermarket

32
V.Orlandi S.p.A.: Fully complementary product range
MININGDUAL INDUSTRY USE
AGRICULTURAL AUTOMOTIVE
SAF-HOLLAND is complementing and strengthening its position in coupling systems and specialty fifth
wheels for trucks, trailers, semi-trailers and agricultural vehicles. Significant cross-selling potential of
Orlandi products to be realized within the worldwide set-up of the SAF-HOLLAND Group network.

33
41%
31%
28%
Overseas Europe Italy
V. Orlandi S.p.A.: Sales turnover by region and business unit in 2017
81%
19%
Automotive Agricultural
Almost two thirds from overseas sales originate from the APAC region besides Russia, South America, the
Middle East and Africa.

34
Impressions: A very specialized product range

35
Terms and key financials
After the takeover, V.Orlandi S.p.A. will continue to operate under its strong, well-established brand. As part
of the SAF-HOLLAND Group, V.Orlandi S.p.A. will benefit from additional growth prospects and attractive
cross-selling opportunities worldwide.
SAF-HOLLAND acquires 70% stake in V.Orlandi S.p.A.
Call option for SAF-HOLLAND for the remainder
Expected full year sales: approx. € 22 million
Expected annual growth rate: 3-5%
Margin accretive: Adj. EBIT margin in the mid teens
Pro rata tempore inclusion in the SAF-HOLLAND Group scope of consolidation
Closing of transaction expected no later than in Q2 2018

36
Appendix

37
SMART STEEL provides for add-on business
opportunities in a digitized transport world
SAFH Connect App
Predictive Maintenance
Big Data Analytics
SAF-HOLLAND combines mechanics with sensors and electronics.
The Company‘s integration and data interpretation know-how enables smart/autonomous drive systems.
Mechanics
Upgrade to
Electro-
mechanics
Digitize
Information &
Data
New business
models & Digital
solutions
Integrate &
Connect
1 2 3 4 5
RECOLUBE

38
Strong financial profile supporting further growth & dividend payments
Strong financial profile*
Corporate Bond
€75mndue 04/2018
Convertible Bond
€100.2mndue 09/2020
Optimized and diversified financing structure
Access to institutional and private investors with
reduced dependency from banks
Currently unsecured financing
More flexibility with increased financial headroom and
optimized financing costs
Financing of Strategy 2020 targets secured
Dividend policy
Distribution of generally 40 to 50% of available net
earnings on a sustainable base if reported equity ratio
reaches around 40%
Dividend payment of € 0.44 per share (py: € 0.40);
€ 20.0mn (py: € 18.1 mn) distribution in total representing
a 46% (py: 39%) share of FY 2016 available net earnings
Promissory note
(SSD)
€200mn€140mn due in 11/2020
€17mn due in 11/2022
€43mn due in 11/2025
Non-current loan
€50mndue 06/2026
Revolving Credit
lines
€159mndue 10/2020 with
option
of renewal until
10/2022
* as of December 31, 2016

39
Disclaimer
Not for general release, publication or distribution in the United States, Australia, Canada or Japan.
By attending this presentation you agree to be bound by the following limitations:
This presentation has been prepared by SAF-HOLLAND S.A. (“SAF-HOLLAND”) and comprises written materials concerning SAF-HOLLAND. It is furnished to you solely
for your information and may not be reproduced or redistributed, in whole or in part, to any other person. It contains summary information only and does not purport to be
comprehensive and is not intended to be (and should not be used as) the sole basis of any analysis or other evaluation. No representation or warranty, express or implied,
is made as to, and no reliance should be placed on, the fairness, accuracy, completeness or correctness of any information, including projections, estimates, targets and
opinions, contained herein, and no liability whatsoever is accepted as to any errors, omissions or misstatements contained herein, and, accordingly, neither SAF-HOLLAND
nor any of its directors, officers, employees or advisors nor any other person shall have any responsibility or liability whatsoever (for negligence or otherwise) arising,
directly or indirectly, from the use of this presentation, or its contents or otherwise in connection with this presentation.
This presentation contains certain statements related to our future business and financial performance and future events or developments involving SAF-HOLLAND and/or
the industry in which SAF-HOLLAND operates that may constitute forward-looking statements. These statements may be identified by words such as “believes,” “expects,”
“predicts,” “intends,” “projects,” “plans,” “estimates,” “aims,” “foresees,” “anticipates,” “targets,” and similar expressions. Forward-looking statements are not historical facts,
but solely opinions, views and forecasts which are based on current expectations and certain assumptions of SAF-HOLLAND’s management or cited from third party
sources which are uncertain and subject to risks. Actual events may differ significantly from the anticipated developments due to a number of factors, including without
limitation, changes in general economic conditions, changes affecting the fair values of the assets held by SAF-HOLLAND and its subsidiaries, changes affecting interest
rate levels, changes in competition levels, changes in laws and regulations, environmental damages, the potential impact of legal proceedings and actions and the Group’s
ability to achieve operational synergies from past or future acquisitions. Should any of these risks or uncertainties materialize, or should underlying expectations not occur
or assumptions prove to be incorrect, actual results, performance or achievements of SAF-HOLLAND may (negatively or positively) vary materially from those described,
explicitly or implicitly, in the relevant forward-looking statement.
The information contained in this presentation, including any forward-looking statements expressed herein, speaks only as of the date hereof and reflects current legislation
and the business and financial affairs of the SAF-HOLLAND which are subject to change and audit. Neither the delivery of this presentation nor any further discussions of
SAF-HOLLAND with any of the recipients thereof shall, under any circumstances, create any implication that there has been no change in the affairs of SAF-HOLLAND
since such date. Consequently, SAF-HOLLAND neither accepts any responsibility for the future accuracy of the information contained in this presentation, including any
forward-looking statements expressed herein, nor assumes any obligation, to update or revise this information to reflect subsequent events or developments which differ
from those anticipated.
This presentation is not directed to, or intended for distribution to or use by, any person or entity that is a citizen or resident or located in any state, country or other
jurisdiction where such distribution, publication, availability or use would be contrary to law or regulation or which would require any registration or licensing within such
jurisdiction. This presentation is for information purposes only and does neither constitute an offer to sell securities, nor any recommendation of, or solicitation of an offer to
buy, any securities of SAF-HOLLAND in the United States, Germany or any other jurisdiction. In the United States, any securities may not be offered or sold absent
registration or an exemption from registration under the U.S. Securities Act of 1933.

40
Investor Relations
SAF-HOLLAND GmbH
Stephan Haas
Hauptstraße 26
63856 Bessenbach
Phone +49 6095 301-617
Telefax +49 6095 301-102
Mobile +49 170 306 64 97
www.safholland.com