smart mobility in bologne
TRANSCRIPT

MUNICIPALITY OF BOLOGNA
SMART MOBILITY 2016 #Hackthetraffic!
Municipality of Bologna
Paris, 14 June 2016Carlo Michelacci
Smart Mobility 2016
# Hackthetraffic
MUNICIPALITY OF BOLOGNA
SMART MOBILITY 2016 #Hackthetraffic!
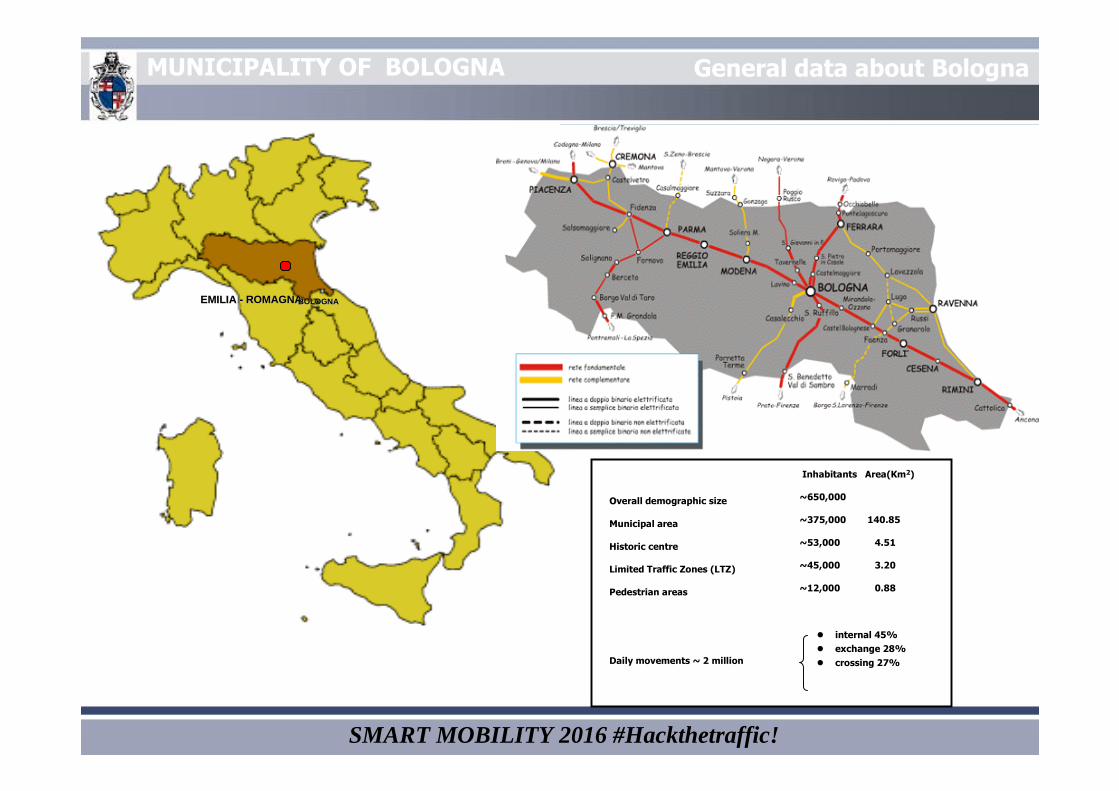
EMILIA - ROMAGNAEMILIA - ROMAGNABOLOGNABOLOGNA
OOverall demographic size
Municipal area
Historic centre
Limited Traffic Zones (LTZ)
Pedestrian areas
Inhabitants Area(Km2)
~650,000
~375,000 140.85
~53,000 4.51
~45,000 3.20
~12,000 0.88
Daily movements ~ 2 million
� internal 45%
� exchange 28%
� crossing 27%
General data about Bologna

MUNICIPALITY OF BOLOGNA
SMART MOBILITY 2016 #Hackthetraffic!
GENERAL MOVEMENTS
0
250000
500000
750000
1000000
INTERNAL EXCHANGE CROSSING
DAILY MOVEMENTSDaily movements Daily movements Daily movements Daily movements ~ 2 million 2 million 2 million 2 million
� internal 45%internal 45%internal 45%internal 45%
� exchange 28%exchange 28%exchange 28%exchange 28%
� crossing 27%crossing 27%crossing 27%crossing 27%
peak times peak times peak times peak times ~ 200.000 200.000 200.000 200.000
Among internal movements theAmong internal movements theAmong internal movements theAmong internal movements the
occasional component exceeds theoccasional component exceeds theoccasional component exceeds theoccasional component exceeds the
regular one. Opposite situation inregular one. Opposite situation inregular one. Opposite situation inregular one. Opposite situation in
exchange and crossing movements.exchange and crossing movements.exchange and crossing movements.exchange and crossing movements.
0
5.000
10.000
15.000
20.000
25.000
30.000
0- 1
1- 2
2- 3
3- 4
4- 5
5- 6
6- 7
7- 8
8- 9
9- 10
10- 11
11- 12
12- 13
13- 14
14- 15
15- 16
16- 17
17- 18
18- 19
19- 20
20- 21
21- 22
22- 23
23- 24
HOURLY DISTRIBUTION OF MOVEMENTS IN AND OUT OF BOLOGNA’S URBAN AREA
NUMBER OF VEHICLES: IN
NUMBER OF VEHICLES: OUT

MUNICIPALITY OF BOLOGNA
SMART MOBILITY 2016 #Hackthetraffic!
INTERNAL MOVEMENTS
INTERNAL DAILY MOVEMENTS ~ 950.000 (45% of total INTERNAL DAILY MOVEMENTS ~ 950.000 (45% of total INTERNAL DAILY MOVEMENTS ~ 950.000 (45% of total INTERNAL DAILY MOVEMENTS ~ 950.000 (45% of total dailydailydailydaily
movementsmovementsmovementsmovements))))
MODAL SPLIT OF INTERNAL COMPONENTMODAL SPLIT OF INTERNAL COMPONENTMODAL SPLIT OF INTERNAL COMPONENTMODAL SPLIT OF INTERNAL COMPONENT
� PT = 242.000PT = 242.000PT = 242.000PT = 242.000
� CAR (CAR (CAR (CAR (passenger+driverpassenger+driverpassenger+driverpassenger+driver)=336.000)=336.000)=336.000)=336.000
� MOTORBIKE =100.000MOTORBIKE =100.000MOTORBIKE =100.000MOTORBIKE =100.000
� BICYCLE =65.000BICYCLE =65.000BICYCLE =65.000BICYCLE =65.000
� PEDESTRIAN =201.000PEDESTRIAN =201.000PEDESTRIAN =201.000PEDESTRIAN =201.000
TOTAL INTERNAL MOVEMENTS
PT26%
CAR (driver)28%
PEDESTRIAN21%
BICYCLE7%
MOTORBIKE11%
CAR (passenger)7%
MUNICIPALITY OF BOLOGNA
SMART MOBILITY 2016 #Hackthetraffic!
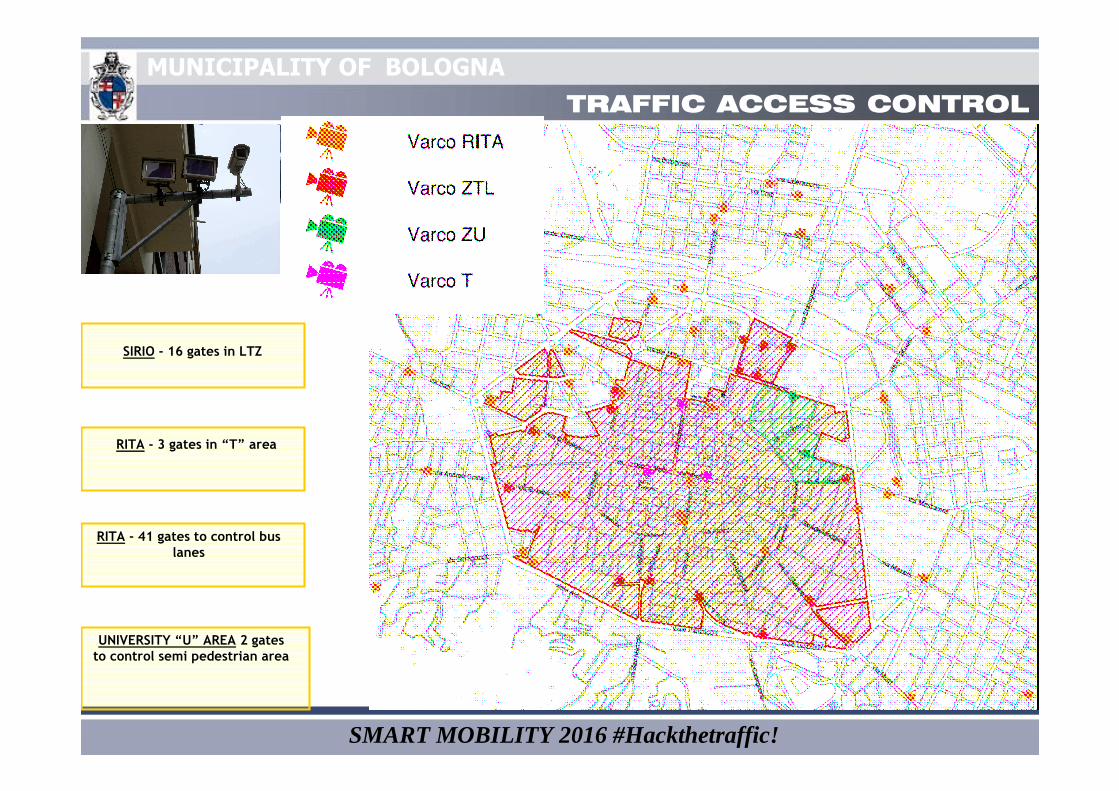
TRAFFIC ACCESS CONTROL
RITA - 3 gates in “T” area
SIRIO - 16 gates in LTZ
RITA - 41 gates to control bus
lanes
UNIVERSITY “U” AREA 2 gates
to control semi pedestrian area
MUNICIPALITY OF BOLOGNA
SMART MOBILITY 2016 #Hackthetraffic!
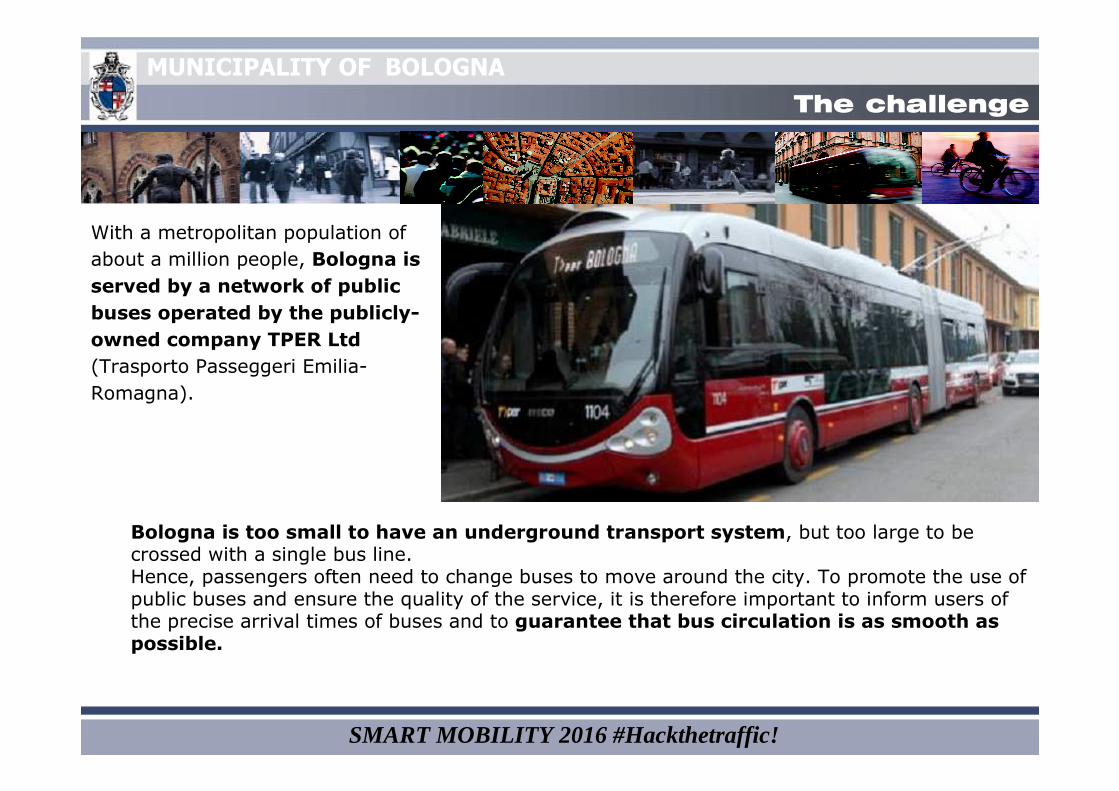
The challenge
Bologna is too small to have an underground transport system, but too large to becrossed with a single bus line.Hence, passengers often need to change buses to move around the city. To promote the use ofpublic buses and ensure the quality of the service, it is therefore important to inform users ofthe precise arrival times of buses and to guarantee that bus circulation is as smooth aspossible.
With a metropolitan population of
about a million people, Bologna is
served by a network of public
buses operated by the publicly-
owned company TPER Ltd
(Trasporto Passeggeri Emilia-
Romagna).

MUNICIPALITY OF BOLOGNA
SMART MOBILITY 2016 #Hackthetraffic!
GOAL
TRAFFIC LIGHTCONTROL SYSTEM
AUTOMATIC VEHICLEMONITORING SYSTEM
GREEN BUS PRIORITY

MUNICIPALITY OF BOLOGNA
SMART MOBILITY 2016 #Hackthetraffic!
THE TRAFFIC LIGHT CONTROL SYSTEM
•About 170
crossroad remote
controlled (70% of
the traffic light
intersections)
•About 1000
inductive loops
•Dynamic
optimisation of the
phases (plan
formation)
•Connection with
AVM Bus centre

MUNICIPALITY OF BOLOGNA
SMART MOBILITY 2016 #Hackthetraffic!
• Every 3 seconds...
– Evaluation of the queue onthe links (road segmentsbetween 2 intersection)
– Update of the bus arrivalprediction
• Every traffic light cycle...
– Evaluation of the saturationrates
– Evaluation of the turningpercentages
– Algorithm of node balance
– Queue evaluation correction
– Local incident detectionalgorithm
Funzioni dell’osservatore locale
UTOPIA - LOCAL OBSERVER SYSTEM

MUNICIPALITY OF BOLOGNA
SMART MOBILITY 2016 #Hackthetraffic!
DETECTOR
n° of vehicles
measuredupstreamflow
steparrivals
estimatedqueue
green light red light
The queue valueincreases withthe trafficmeasured (orestimated)…
…and decreaseswith thesaturation rate
UTOPIA - LOCAL OBSERVER SYSTEM: QUEUE MODEL
MUNICIPALITY OF BOLOGNA
SMART MOBILITY 2016 #Hackthetraffic!
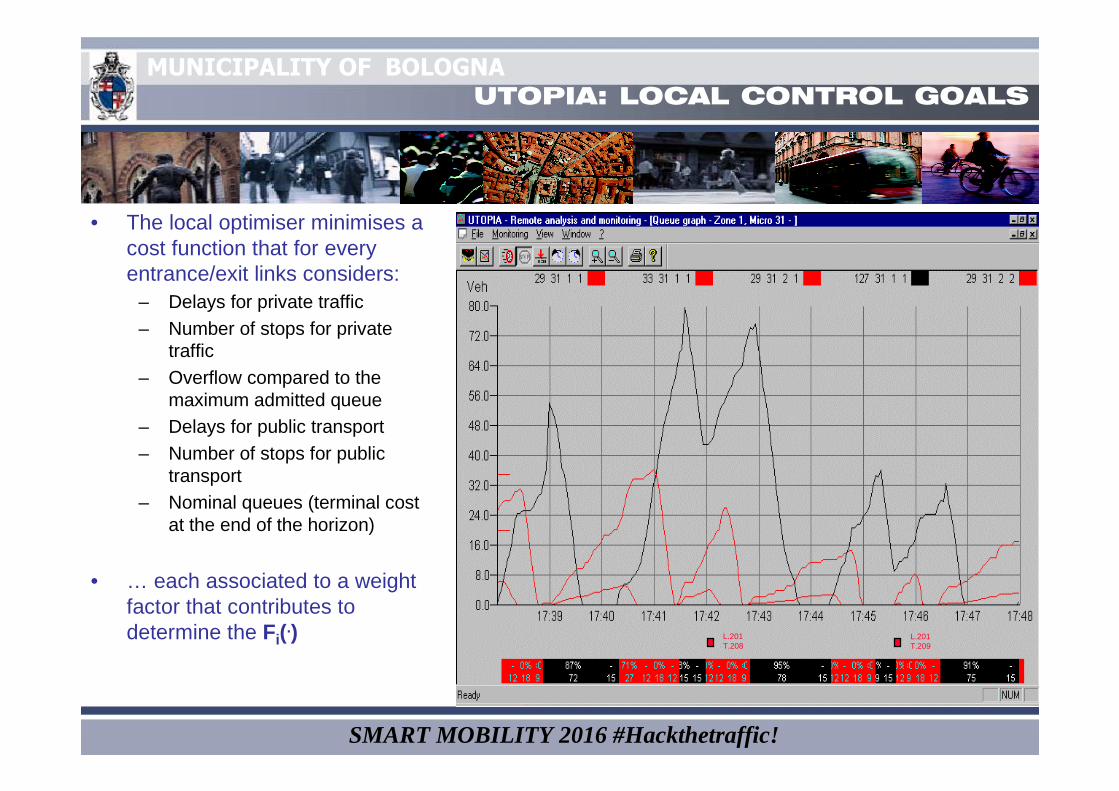
• The local optimiser minimises acost function that for everyentrance/exit links considers:
– Delays for private traffic– Number of stops for private
traffic– Overflow compared to the
maximum admitted queue– Delays for public transport– Number of stops for public
transport– Nominal queues (terminal cost
at the end of the horizon)
• … each associated to a weightfactor that contributes todetermine the Fi(.)
UTOPIA: LOCAL CONTROL GOALS
L.201T.209
L.201T.208

MUNICIPALITY OF BOLOGNA
SMART MOBILITY 2016 #Hackthetraffic!
UTOPIA - Traffic Data Archive
• Red linedescribes thehistorical (daily)archive of theselectedvariable
• Blu line showsits statisticalprofile(according tothe selectedtype of day)

MUNICIPALITY OF BOLOGNA
SMART MOBILITY 2016 #Hackthetraffic!
PASSENGERS 2016Urban service Bologna 94.910.235
Suburban service 9.258.295
Extraurban service 6.216.762
Special services 422.113
TOTAL 110.807.405
KMUrban service Bologna
18.090.577
Suburban service 6.737.743
Extraurban service 11.308.966
Special services 271.592
TOTAL 36.408.878
PUBBLIC TRANSPORT SERVICE
MUNICIPALITY OF BOLOGNA
SMART MOBILITY 2016 #Hackthetraffic!
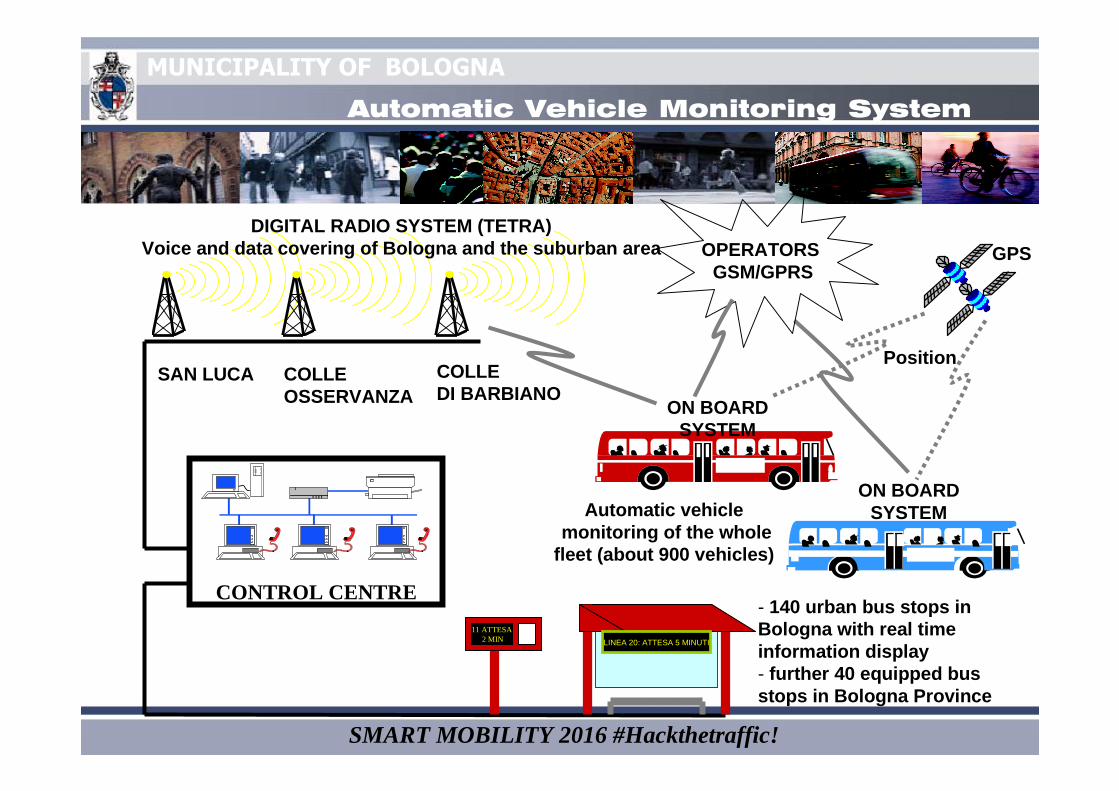
CONTROL CENTRE
SAN LUCA
11 ATTESA 2 MIN
- 140 urban bus stops inBologna with real timeinformation display- further 40 equipped busstops in Bologna Province
Automatic vehicle monitoring of the wholefleet (about 900 vehicles)
LINEA 20: ATTESA 5 MINUTI
DIGITAL RADIO SYSTEM (TETRA)Voice and data covering of Bologna and the suburban area
COLLEOSSERVANZA
COLLE DI BARBIANO
ON BOARDSYSTEM
OPERATORS GSM/GPRS
Position
GPS
ON BOARDSYSTEM
Automatic Vehicle Monitoring System
MUNICIPALITY OF BOLOGNA
SMART MOBILITY 2016 #Hackthetraffic!
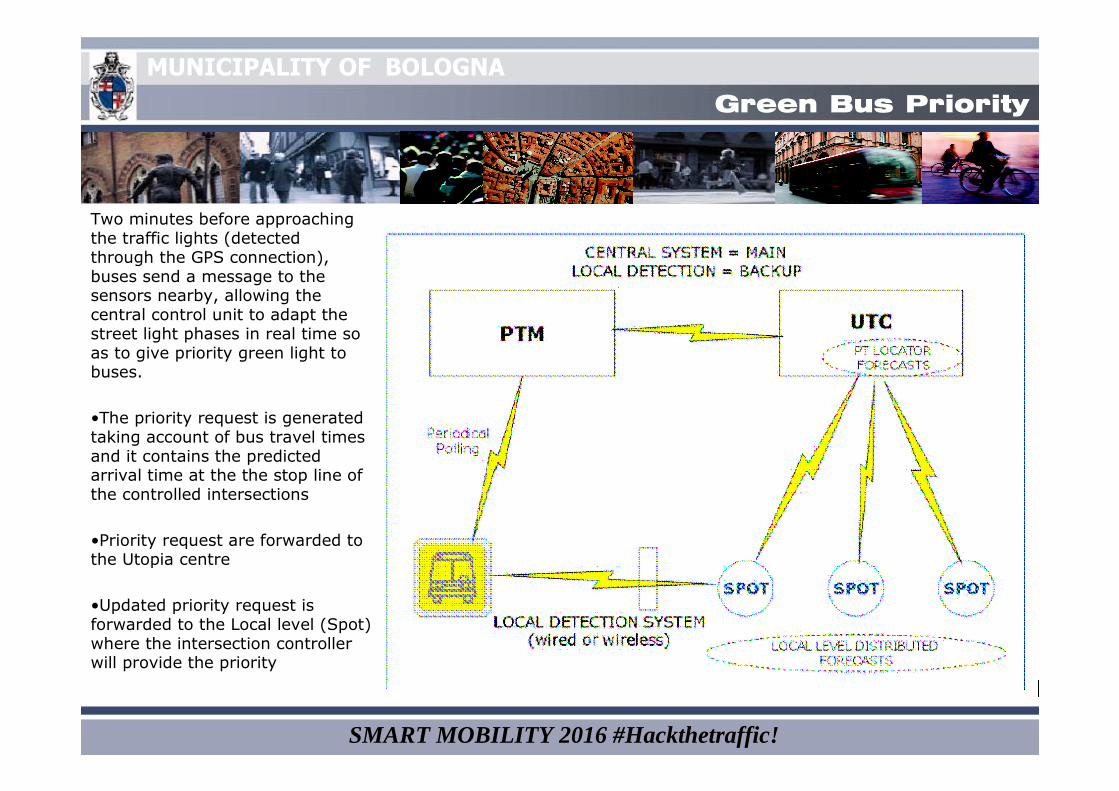
Two minutes before approachingthe traffic lights (detectedthrough the GPS connection),buses send a message to thesensors nearby, allowing thecentral control unit to adapt thestreet light phases in real time soas to give priority green light tobuses.
•The priority request is generatedtaking account of bus travel timesand it contains the predictedarrival time at the the stop line ofthe controlled intersections
•Priority request are forwarded tothe Utopia centre
•Updated priority request isforwarded to the Local level (Spot)where the intersection controllerwill provide the priority
Green Bus Priority

MUNICIPALITY OF BOLOGNA
SMART MOBILITY 2016 #Hackthetraffic!
Green Bus Priority
UTOPIA – The Local Level feedback– The travel time to the downstream junction is extremely important for correction of the forecasts for
the downstream junctions when a SPOT is not able to give the priority to a priority request.
Example:– No way to provide the green for an incoming priority request– The SPOT unit which is delaying the PT vehicle informs the downstream junctions and updates
the predicted arrival time. (predicted release time + travel time to downstream junction)– The same information is also sent to the PT Locator module

MUNICIPALITY OF BOLOGNA
SMART MOBILITY 2016 #Hackthetraffic!
J1 J2 J3
UTOPIA – Local Level feedback visual description• When the PT vehicle enters in the controlled area, PT priority requests are sent to all the intersections
within the optimisation horizon (default=120s).• The priority request contains the travel time to the downstream junction• In case the priority request can not be served by one intersections (e.g. because of local constraints),
the PT vehicle arrival at downstream junctions will be delayed comparing to the predicted arrival timeprepared by the centre.
• The intersection that is delaying the PT vehicle transmit to the downstream intersection the predictedexit time.
• Downstream intersection use travel time to calculate the corrected arrival time
Green Bus Priority

MUNICIPALITY OF BOLOGNA
SMART MOBILITY 2016 #Hackthetraffic!
Tests performed on a one-kilometre route
The system ensures a greaterregularity of buses arrival timesand a considerable decrease oftravel times.
% “Red Event” with priority ON:
7%
% “Red Event” with priority OFF:
17%
Time Battindarno-San Pio V withpriority ON:
387 seconds
Time Battindarno-San Pio V withpriority OFF:
468 seconds
Test Green Bus Priority

MUNICIPALITY OF BOLOGNA
SMART MOBILITY 2016 #Hackthetraffic!
THE RESULT
After this experience greenbus priority was exented tothe most
Important PT line
Direzione Incrocio Preferenziato Mic ro Fa s c ia inte rd izio ne
Do n S turzo /Da ma s io 201Do n S turzo /P o rre tta na 202P o rre tta na /Me lo nc e llo 203S a ra g o zza /Orio li 204S a ra g o zza /Guido tti 205S a ra g o zza /P .ta S a ra g o zza 206 07 -09 / 17 -19
Co s ta /Va le ria ni Co s ta /Cro c e tta
Co s ta /Cro c e ttaCo s ta /Va le ria ni
Emilia /S pe ra nza 228Emilia /Ba ttinda rno 229Emilia /Ca p ra ra 230 07 -09 / 17 -19Emilia /Ma rza bo tto 231Emilia /N ig ris o li 251 (231 )Emilia /P ia ve 232Emilia /Tima vo 250 (232 )Emilia /V.Ve ne to 233 07 -09 / 17 -19Emilia /S .P io V 234P .ta S .Fe lic e 235 07 -09 / 17 -19
21 Ce ntro Bo nins e g na /Cro c e fis s i 21
Ma tte o tti/T iba ld i 320Co rtic e lla /Mite lli 319
T ia rini/Ma tte o tti 321T ia rini/N .da ll'Arc a 324T ia rini/Fio ra va nti 356
S ta ling ra d o /Co s tituzio ne 329S ta ling ra d o /Libe ra zio ne 330Cre ti/Fra nc e s c hini 322
Cre ti/Fra nc e s c hini 322P e rife ria Fra nc e s c hini/Libe ra z io ne 322
S ta ling ra d o /P .zza Co s tituzio ne 329
S .Do na to /S a lg a ri 335S .Do na to /P ira nde llo 336S .Do na to /Ta ng .le No rd 337S .Do na to Ta ng .le S ud 338S .Do na to /Ma c c hia ve lli 339S .Do na to /And re ini 340
S .Do na to /Ra nza ni 349S .Do na to /Ama s e o 346S .Do na to /Ga le o tti 342S .Do na to /Ro t.Ga ra va g lia 341
Pre fe re nzaz io ne Bus Attiva Linea
20 Ce ntro
14 21 Ce ntro 209
14 21 P e rife ria 209
13 Ce ntro
19 35
27 P e rife ria
17 30 Ce ntro
35 Ce ntro
35
20 Ce ntro
20 P e rife ria
Since 2012, the travel times of public buses collected through satellitenavigation are made available as open data, allowing for the development ofnumerous apps to provide arrival times to users directly on their mobiledevices.
Moreover, the AVM data are used to calculate traffic congestion indexeswhich, thanks to an agreement with Google, can be visualised on GoogleTransit to inform users of traffic jams in the Municipality.

MUNICIPALITY OF BOLOGNA
SMART MOBILITY 2016 #Hackthetraffic!
THANK YOU!
Carlo MichelacciMunicipality of Bologna