smart management of heavy traffic urban … · international research journal of engineering and...
TRANSCRIPT

International Research Journal of Engineering and Technology (IRJET) e-ISSN: 2395-0056
Volume: 04 Issue: 08 | Aug -2017 www.irjet.net p-ISSN: 2395-0072
© 2017, IRJET | Impact Factor value: 5.181 | ISO 9001:2008 Certified Journal | Page 840
SMART MANAGEMENT OF HEAVY TRAFFIC URBAN ROADS
Rajeev Kumar1, Dr. Pardeep Kumar Gupta2, Gaurav Gupta3*,
1Ph.D. Research Scholar, Department of Civil Engineering, PEC University of Technology, Chandigarh 2Associate Professor, Civil Engineering Department, PEC University of Technology, Chandigarh
3Ph.D. Research Scholar, Department of Civil Engineering, National Institute of Technical Teachers’ Training and Research, Chandigarh
---------------------------------------------------------------------------***--------------------------------------------------------------------------
ABSTRACT - The growth of traffic in India has been exponential post independence. The specified traffic axle load limit is generally disobeyed with higher axle load vehicles plying over them. This results in severe deterioration of road pavements causing to premature failure of the pavements. Hence determining effective pavement management strategies could result in helpful information to enact cost- effective and compatible decisions for an intact road network.
The pavement deterioration models may turn out to be effective in assisting highway agencies to predict the economical results of possible investment decisions based on the pavements maintenance and management.
Keywords: flexible pavement, economics of pavements, cost analysis, deterioration of pavements, rehabilitation of pavements, maintenance of pavements.
1. INTRODUCTION 1.1 Background Road transport is vital to India’s economy. The roads deteriorate significantly without the timely and proper maintenance which can lead to dwindled reliability of transport system and thereby increasing the number of accidents, increased travel time and increased user cost. The Rehabilitation and reconstruction cost will multiply to a great extent if maintenance work is not given proper heed at right time. Road maintenance is, therefore, such indispensable feature of transportation system, the absence of which will lead to ultimate repair cost, road user cost and a lot of discomfort to the road user.
India has the second largest road network of over 46, 89, 842 km. Up till 2008, 2.1 million km roads in India were paved. Total urban road length recorded in India is about 3,04,327 km. Preservation of existing urban roads has become a major activity for all level of government. Deteriorating urban roads and reduced funding are a major problem for the local government. Funds designated for pavement must, therefore, be used as effectively as possible.
1.2 Inadequacies of present road infrastructure
The growth of road network in India has proven to be disappointing both in terms of quality and capacity so as to cope up with the growing demand for transport in India. That is why the current road infrastructure of India has to cope with serious inadequacies as described below:
1.2.1 Poor Quality of Roads
In spite of having such a big network of roads, the quality of roads is still not up to the mark. The existing road network has aged, leading to appearance of different kind of distresses viz. cracking, raveling and potholing on the surface. Because of the dual impact of traffic and environmental factors these distresses continuously grow to the extent of severity because of the inability to properly upkeep and maintain the road network within budgetary constraints.
1.2.2 Increased traffic and axle loads
Traffic on the Indian roads is increasing, with the annual growth rate estimated to be of the order of 5% [10]. The phenomenal growth in vehicle population and road usage has put a terrific strain on the existing road network. Significant growth in the axle loads carried by freight vehicles has been observed in the past, but the regulations administered of axle weight limitations have not been changed tangibly for many years, thereby putting the negative effect on pavements in terms of fatigue and deterioration. The present spectrum of axle loads plying on the Indian roads shows that as against a prescribed legal limit of 10.2 tonnes axle load, commercial vehicles with much higher axle loads, even to the extent of 20-22 tonnes are plying on the

International Research Journal of Engineering and Technology (IRJET) e-ISSN: 2395-0056
Volume: 04 Issue: 08 | Aug -2017 www.irjet.net p-ISSN: 2395-0072
© 2017, IRJET | Impact Factor value: 5.181 | ISO 9001:2008 Certified Journal | Page 841
roads. As per the ‘Road Damage Formula’, pavement that can last for 10 years without overloading will last only for 6.5 years , if there is 10 percent overloading on an average. With 30 percent overloading, the same pavement will last only for 3.5 years [5]. The situation has led to swift rate of deterioration, which warrants for timely additional maintenance inputs, for preserving and up keeping the roads to the minimum acceptable level of service.
1.3 Road maintenance management
1.3.1 Necessity of road maintenance management
The lack of road maintenance have caused irreparable damage to economic growth rate, since the poorly maintained roads cause delay, road accidents and higher vehicle operating costs. Any neglect of maintenance activity is self defeating as a single rupee paid for maintenance saves 2 to 3 rupees in the operating cost of vehicles (MORT&H 2013e). Also such neglect of maintenance accelerates the process of deterioration leading to the higher cost of rehabilitation and reconstruction.
1.3.2 Consequences of poor maintenance timings
If proper periodic maintenance procedures are not adopted, the pavement situation worsen very rapidly from ‘good’ to ‘poor’ in a very short span of pavement life, causing the requirement of four to five times more expenditure on rehabilitation of the pavement. If rehabilitation and maintenance are carried out through the early period of deterioration more than 75% of the maintenance costs could be eliminated (Shahin 1994).
1.3.3 Scientific approach towards maintenance management of roads
Initially for a few years after construction, the deterioration of road is trivial when it is subjected to gradual weakening process by traffic loading and climatic factors such as rain, temperature changes and solar radiation etc. The speed of deterioration also depends upon the quality and parameters of original construction. The neglect of maintenance is the key factor which accelerates the pace of deterioration and dwindles the design life significantly. The strengthening of pavement is imminent when the road enters the critical stage as the pavement structure loses its ability to withstand the load of traffic. Keeping in view the above scenario, it has been necessitated to formulate the effective strategies for Optimum Maintenance and Rehabilitation works to put the pavement in a best serviceable condition within the constraints of funds.
2.0 Methodology developed for the study
2.1 Identification of Urban Road Network
The identification and selection of different categories of roads of various sectors of Panchkula Distt., Haryana, India has been made. The whole road network comes under the jurisdiction of HUDA (Haryana Urban Development Authority) which can exercise the good control over the whole activities of the study, being the only agency. The following urban road network of Panchkula has been considered for the study:
Bituminous Concrete (BC) surfaced Roads
Road-R0: 9.7m wide road with 40mm BC top layer, between sector 11 and 12, Panchkula. Road-R1: 9.7m wide road with 40mm BC top layer, from BEL factory to Amartex Chowk in sector 15, Panchkula. Road-R2: 9.7m wide road with 40mm BC top layer, between sector 14 and 15, Panchkula. Road-R3: 9.7m wide road with 40mm BC top layer, between sector 9 and 16, Panchkula.
2.2 Type of data collected The process of data collection has been categorized into the following four types:
Data of network of roads Works data of rehabilitation & maintenance Data of cost Data of vehicle fleet

International Research Journal of Engineering and Technology (IRJET) e-ISSN: 2395-0056
Volume: 04 Issue: 08 | Aug -2017 www.irjet.net p-ISSN: 2395-0072
© 2017, IRJET | Impact Factor value: 5.181 | ISO 9001:2008 Certified Journal | Page 842
Table 1 Details of Identified Urban Road Network
Name of Road
Description of Road Soil Type
Terrain Rainfall In mm
(Annual)
Temp. In 0c
Traffic
Road- R0
40mm BC road between sector 11 and 12,PKL
Loamy Sand Soil
Plain 1057 -1to43 High
Road-R1 40mm BC road from BEL factory to Amartex Chowk in
Sector 15,PKL
Loamy Sand Soil
Plain 1057 -1to43 High
Road-R2 40mm BC road between sector 14 and 15,PKL
Loamy Sand Soil
Plain 1057 -1to43 High
Road-R3 40mm BC road between sector 9 and 16,PKL
Loamy Sand Soil
Plain 1057 -1to43 High
2.3 Road network data collection
2.3.1 General
Some of the data has been obtained from the minor sources like the old records of respective division of Haryana Urban Development Authority (HUDA). The other part of data has been gathered by performing the field studies on the pre determined pavement sections. Points related to the type of soil, terrain, traffic (volume and axle load data), pavement composition and climate has also been gathered through field studies.
2.3.1.1 Road network surveys
The road network surveys is categorized into the following two types
Primary Survey -- Field data collection Secondary Survey – Inventory data collected from HUDA offices
The following secondary data has been obtained from various divisional offices of the HUDA in-charge of construction and maintenance of the designated portions of the selected roadway network.
Year of original construction and its specification Crust thickness of each pavement layer Maintenance inputs and its norms Traffic details for the last 5 years Year of strengthening and its specification Year and specifications of last renewal course Temperature and rainfall data for the last 5 years
The collection of in-field road network data collection in the field is categorized as:
Data of inventory Structural capacity and evaluation Functional evaluation Evaluation of materials used in pavements

International Research Journal of Engineering and Technology (IRJET) e-ISSN: 2395-0056
Volume: 04 Issue: 08 | Aug -2017 www.irjet.net p-ISSN: 2395-0072
© 2017, IRJET | Impact Factor value: 5.181 | ISO 9001:2008 Certified Journal | Page 843
2.3.2 Inventory data
The details of Inventory data about the selected pavement section is given below: Name and Category of road Width of carriageway Width of shoulder Surface thickness and type Details of pavement layera The above data has been gathered from the visual inspection of the pavement section and from the in-charge of maintenance and construction records of the concerned division (highway) of HUDA (Haryana Urban Development Authority).
2.3.3 Calculation of adjusted structural number
The Adjusted Structural Number (SNP) for all the pavement section has been calculated from the Benkelman Beam deflection readings with the help of the following equations (Odoki and Kerali 2000).
For granular base courses (WBM/WMM) B.Bdef. = (SNP)-1.6 * 6.5 For bituminous base courses ( BUSG/ BM) B.Bdef. = (SNP)-1.6 * 3.5
2.3.4 Functional evaluation Functional evaluation of pavements pertains to road data collection of surface distresses e.g. pothole area, cracked area, surface roughness and rut depth etc.
2.3.4.1 Surface distress measurements The kind and scope of distress generated at the surface were noticed on the basis of visual judgment. The distresses developed were also measured in quantitative terms.
Measurement of cracked area: The test sections of length 50m were selected for each pavement section to measure the cracked area. In case of interconnected cracks, the influenced area was plotted in the form of rectangle and measured. For the single transverse/ longitudinal cracks, the width of crack area was observed as 50 cm and the consequent area was measured by multiplying it with actual length of crack. The cracked area was denoted as percentage of the net pavement area.
Measurement of pothole area: One pothole Unit = 0.1sq.m. The minimum diameter 150mm and minimum depth of 25mm of pothole has been considered.
Rut depth measurements: The rut depth was measured with at least 2m straight edge under the wheel path. The peak value of rut depth was taken note of for every observation.
2.3.4.2 Roughness measurements The roughness of pavement was observed for every pavement section with the help of ‘Wheel Bump Integrator’ drawn using jeep based on the specified standards. The vehicle ran at a fixed velocity of 30 kmph. The roughness values were attained in terms of Unevenness Index through the following equation (Jain et al 1999). UI. = *25.4 *460* B/W mm/km Where
B = Reading of the bump integrator UI. = Unevenness Index, (mm/km)
W = Number of tyre revolutions The above calculated Unevenness Index (measured in mm/km) was changed into the globally acknowledged International Roughness Index (IRI) by following equation (Odoki and Kerali 2000). UI = IRI1.12 x 630

International Research Journal of Engineering and Technology (IRJET) e-ISSN: 2395-0056
Volume: 04 Issue: 08 | Aug -2017 www.irjet.net p-ISSN: 2395-0072
© 2017, IRJET | Impact Factor value: 5.181 | ISO 9001:2008 Certified Journal | Page 844
2.3.5 Evaluation of pavement materials 2.3.5.1 Field evaluation: The test pits of suitable size were excavated at appropriate sites in all pavement sections. The subsequent tests were carried out.
Thickness of the surfacing courses (new & old) Field dry density of the soil subgrade sub-base and base courses thickness Field moisture content of the soil subgrade
2.3.5.2 Laboratory evaluation: The evaluation of the subgrade soil samples collected from the field was done in laboratory conforming to the Indian Standard specifications.
Table 2 Laboratory Test Results of Collected Sub grade Soil Samples on All Pavement Sections of the Selected Roads
Name Of the Road
Optimum Moisture Content
(%)
Atterberg Limits (%) CBR In (%)
Liquid Limit Plastic Limit
Plasticity Index
Unsoaked Soaked
Road-R0 16.0 17 13 4 6.55 4.38 Road-R1 13.0 15 12 3 6.96 4.66 Road-R2 15.0 17 12 5 6.07 4.09 Road-R3 14.0 14 10 4 5.97 4.01
2.3.6 Road network database
Required data in all form s pertaining to the each of the pavement section are given in the Table 3 and 4
Table 3 Inventory Data of Selected Urban Road Sections
Name of
Road
Description of Road Flow
Type
Carriage
-way
Width
ADT ADT
Year
Length
Of
Road
(km)
Road-R0 40mm BC road between
Sector 11 and 12, Panchkula
One
way
9.7m 16,112 2014 1.200
Road-R1 40mm BC road from BEL factory to Amartex Chowk
In sector 15, Panchkula
One
way
9.7m 17,140 2014 1.550
Road-R2 40mm BC road between
Sector 14 and 15, Panchkula
One
way
9.7m 15,975 2014 1.100
Road-R3 40mm BC road between
Sector 9 and 16, Panchkula
One
way
9.7m 22,253 2014 0.960

International Research Journal of Engineering and Technology (IRJET) e-ISSN: 2395-0056
Volume: 04 Issue: 08 | Aug -2017 www.irjet.net p-ISSN: 2395-0072
© 2017, IRJET | Impact Factor value: 5.181 | ISO 9001:2008 Certified Journal | Page 845
Table 4 Observed Condition Data on All Pavement Sections Of Urban Road Network
Name of the Road
Condition Year
Roughness IRI(m/km)
Cracking Area(%)
Benkelman Beam
Deflection (mm)
Adjusted Structural Number of Pavements
(SNP) Road-R0 2013 2.11 2.76 0.43 3.69 Road-R1 2013 2.23 3.04 0.42 3.76 Road-R2 2013 2.17 2.82 0.41 3.82 Road-R3 2013 2.68 3.56 0.44 3.65
2.4 Vehicle fleet data
2.4.1 Vehicle types A representative traffic flow on every type of urban road in India consists of both Non-Motorized (NMT) and Motorized (MT) vehicles. Both NMT and MT vehicles were taken into account in this study.
2.4.2 Traffic volume counts Traffic surveys have been conducted manually for a period of 24 hours for a week’s duration. An individual count station was setup for each individual road. As a result of which PCU and MSA were calculated for the required pavement sections.
2.4.3 Vehicle growth rate The rate of vehicular growth averaging annually in India has been adopted [10]. T he traffic and vehicle growth data have been supposed to be appropriate for all different roads in the urban road network accounted in this study.
2.5 Maintenance and rehabilitation works
2.5.1 Serviceability Levels for Maintenance
The attempts are being made all over the world to develop standards for maintenance quality level for which roads are to be maintained to achieve the requisite level of expediency, ease and safety to the road users. The maintenance of roads should be kept up to such a level that the vehicle operating costs and accident costs are minimized. Environmental concerns are also being given due consideration to reduce the level of exhausts from road traffic. The measure of maintenance quality levels which have been accepted in most of the developed countries consists of measuring the service conditions of roads in terms of surface defects such as roughness, potholes, cracking and rutting etc. to determine a ‘Serviceability Index’ which varies from country to country. The recommended serviceability and the permissible levels are shown in Table 5 (MoRT&H 2013).
Table 5 Intervention Levels for Urban Roads
Sr.No. Serviceability Indicator
Serviceability Levels
Level-1 (Good)
Level-2 (Average)
Level-3 (Acceptable)
1 Roughness, IRI* 2000 mm/km 2.8m/km
3000mm/km 4.0m/km
4000mm/km 5.2m/km
2 Maximum number of potholes per km. Nil 2 – 3 4 - 8 3 Patching
Area & Cracking (maximum permissible)
5% 10% 10 - 15 %
4 Rutting: 20 mm (max. permissible)
5mm 5-10mm 10-20mm
Source:(MORT&H 2013;Odoki and Kerali 2000)

International Research Journal of Engineering and Technology (IRJET) e-ISSN: 2395-0056
Volume: 04 Issue: 08 | Aug -2017 www.irjet.net p-ISSN: 2395-0072
© 2017, IRJET | Impact Factor value: 5.181 | ISO 9001:2008 Certified Journal | Page 846
Table 6 Grouping of Roads as per Maintenance Serviceability level
Serviceability
Level
Traffic Volume
(AADT)
Name of Roads
High (Level 1) More than 10000 Road-R0,Road-R1,Road-R2,Road-R3
Medium (Level 2) 5,000 – 10,000 **********************
Low (Level 3) Less than 5,000 **********************
2.6 Cost data
2.6.1 Cost of maintenance and rehabilitation works
The cost of various items pertaining to Maintenance and Rehabilitation works has been considered as per HSR Item/Description (Haryana Schedule rates) of HUDA (Haryana Urban Development Authority) as shown in Table 7.
Table 7 Cost Data for Maintenance and Rehabilitation Works
Sr.No. Type of Maintenance & Rehabilitation Work *Cost per sq.m
(2014-15)
1 Tack Coat 14.50
2 Crack sealing 140.00
3 Potholing patching for PC surface 210.00
4 Potholing patching for BC surface 245.00
5 Patch repair for PC surface 210.00
6 Patch repair for BC surface 245.00
7 Rutting and undulation repair 310.00
8 Single Bituminous Surface Dressing(25mmSBSD) 143.00
9 Double Bituminous Surface Dressing(25mmDBSD) 285.00
10 Premix carpet (25mmPC) 211.00
11 Semi Dense Bituminous Concrete (25mmSDBC) 228.20
12 Bituminous Concrete (40mm BC) 340.00
13 Dense Bituminous Macadam (50mmDBM) 392.00
14 Bituminous Macadam (50mmBM) 298.00
15 Mill and Replace with 50mmBM+25mmPC 584.00
16 Mill and Replace with 50mmBM+40mmBC 713.00
*All Costs are in Indian Rupees, Source: (HSR Item/Description)
2.7 Pavement deterioration models
2.7.1 Cracking Initiation Model (BC surfacing) ICA = Kcia [CDS2 * 4.21 E {0.14 SNP. – 17.1 (YE4/SNP2)} + CRT. ICA. = Period to start of every structural cracks (years) CDS. = indicator of defects due to construction for BC surfacing Dry (brittle) = 0.5, Normal = 1.0, Rich (soft) =1.5

International Research Journal of Engineering and Technology (IRJET) e-ISSN: 2395-0056
Volume: 04 Issue: 08 | Aug -2017 www.irjet.net p-ISSN: 2395-0072
© 2017, IRJET | Impact Factor value: 5.181 | ISO 9001:2008 Certified Journal | Page 847
SNP. = Yearly adjusted structural number (average) of pavements YE4 = No. of equivalent standard axles, (average) in millions/lane CRT = Time for crack retardation on account of maintenance (years) (default value = 1.5) Kcia = Calibration factor
2.7.2 Cracking Progression Model (BC surfacing) dAC = Kcp (CRP./CDS.) {(1.84 * 0.45 * tA + SCA0.45)1/0.45 – SCA} where, dAC = Incremental variation in area of every cracking throughout the year, in percent of total carriageway area CRP = Retardation of progression of cracking because of preventive treatment [CRP. = 1 – 0.12CRT.] SCA = Min { ACAa, (100 – ACAa)} ACAa = Area of every cracking at the initiation of the year of analysis (%) tA = Fraction of the analysis year in which every progression pertain CDS = Construction defect indicator for bituminous surfacing Dry (brittle) = 0.5, Normal = 1.0, Rich (soft) =1.5 Kcp = calibration factor 2.7.3 Roughness Progression Model (For BC surfacing) ∆RI = Kgp { 134 * E (m Kg AGE) * ( 1 + SNPKb )-5 YE} + [ 0.0066 * ∆ACRA ] + [ 0.088 * ∆RDS ] + [ 0.00019 ( 2 – FM ) {(( NPTa * TLF ) + (∆NPT * TLF/2))1.5 – (NPTa)1.5}] + [m Kg RIa ] Where, ∆RI = Total incremental change in roughness during analysis year, in m/km IRI m = Environmental co-efficient (default value = 0.025) ( = 0.04 for Indian conditions) Kg = Calibration factor for the environmental component of roughness (default value = 1.0) AGE = Age since last overlay or reconstruction, in years SNPKb = Adjusted structural number due to cracking at the end of the analysis yr. YE= Annual number of equivalent standard axles, in millions/lane ∆RDS = Incremental change in standard deviation of rut depth during analysis yr. in mm FM = Freedom to maneuver index, carriageway width in m and ADT NPTa = No. of potholes per km at the beginning of the analysis year TLF = Time lapse factor depending upon the frequency of pothole patching (default value = 1.0) ∆NPT = Incremental change in number of potholes per km during the analysis yr. RIa = Roughness at the start of the analysis year, in m/km IRI Kgp = Calibration factor Source: (Odoki et al 2000)
2.8 Calibration of pavement deterioration models The calibration of pavement deterioration models has been done with the help of actual field data taken by different methods and equipment used. The number of data sets as given in Table 8 .

International Research Journal of Engineering and Technology (IRJET) e-ISSN: 2395-0056
Volume: 04 Issue: 08 | Aug -2017 www.irjet.net p-ISSN: 2395-0072
© 2017, IRJET | Impact Factor value: 5.181 | ISO 9001:2008 Certified Journal | Page 848
Table 8 Data sets for calibration of pavement deterioration model
Types of
Roads
YAX
(millions)
YE4
(AMSA)
AGE3
(Years)
SNP
NPTa
(potholes)
RIa
(m/km)
HS
(mm)
Road-R0 6.56 0.181 4 3.65 2.31 2.42 40
Road-R1 6.99 0.209 4 3.75 1.85 2.10 40
Road-R2 6.39 0.198 4 3.80 2.27 2.21 40
Road-R3 9.27 0.263 4 3.85 2.1 2.28 40
The following assumptions have been made for calibration purposes
The traffic increase rate was adopted to be 5.0% constant.
Constant SNP for all cases. The pothole area conversion = (1 pothole unit=0.1 m2 pothole area) Because the pothole within 12 months are generally not patched, TLF has been fixed as 1, For a carriageway width of 9.7m, FM = 0. Bearing in mind the regular climatic zone for India as Sub-humid/Sub-tropical hot, the ecological coefficient ‘m’ has
been assumed as 0.025. The ecological aspect for BC pavements is taken to be 0.04. The relationship given by the following equation was used to change the Unevenness Index (UI in mm/km) as per
unanimously up to standard IRI (Odoki and Kerali 2000)
UI. = IRI1.120 x 630
Table 9: Calibration Factors of Obtained for Different models of Pavement Deterioration
Model description Road-R0 Road-R1 Road-R2 Road-R3
Cracking Initiation Model 0.225 0.230 0.214 0.200
Cracking Progression Model 0.54 0.410 0.465 0.490
Roughness Progression
Model
0.756 0.680 1.23 0.710
The calibration factors obtained are: Cracking Initiation (Kcia) = 0.217 (average), Cracking Progression (kcpa) = 0.476 (average), and Roughness Progression (Kgp) = 0.844 (average). It shows that the initiation of cracking begin come into view on the pavement surface a lot before than what is forecasted by the pavement deterioration model. In other words, the initiation of cracking is faster for urban road test stretches. The rate of cracking initiation (Kcia = 0.217) is faster by 78.3% on urban road test stretches. The pace of progression of cracking (Kcpa = 0.476) is slower by 52.4% on urban road test stretches.
2.9 Validation of pavement deterioration models
2.9.1 General
The calibrated pavement deterioration models has been validated to detect the effectiveness of these models. The distresses predicted by the deterioration models were compared with the real time selected pavement sections. The data on every section of the road network pre specified was collected by the starting of the year 2013 with the help of various equipments and methods. The pavement condition data was once again collected in the same time period of the year 2014 with help of same equipment and methods for determining the status of the yearly succession of distresses during the year 2013-14. The two kinds of deterioration models validated are

International Research Journal of Engineering and Technology (IRJET) e-ISSN: 2395-0056
Volume: 04 Issue: 08 | Aug -2017 www.irjet.net p-ISSN: 2395-0072
© 2017, IRJET | Impact Factor value: 5.181 | ISO 9001:2008 Certified Journal | Page 849
The cracking progression model The Roughness progression model
2.9.2 Cracking progression model
The practically determined readings of the area of cracking around the starting of the year 2014 for the selected pavement section were compared to the predicted models of crack propagation as shown in the Table 10 with the co relation drawn in figure 1.
Table 10: Observed and Predicted Cracking Values
Name of the Road Observed Cracking
Area in %
Predicted Cracking
Area in %
% Variability
Road-R0 3.15 3.99 26.7
Road-R1 2.43 2.84 16.8
Road-R2 4.89 5.91 21.0
Road-R3 7.23 8.13 12.5
Figure 1 Observed V/S Predicted Cracking (% Area)
2.9.3 Roughness progression model
The practically determined readings of the area of cracking around the starting of the year 2014 for the selected pavement section were compared to the predicted models of roughness progression as shown in the Table 11 with the co relation drawn in figure 2.
0
1
2
3
4
5
6
7
8
9
0 1 2 3 4 5 6 7 8
PR
EDIC
TED
CR
AC
KIN
G (
%
are
a)
OBSERVED CRACKING (% area)
Y= 0.44 + 1.08X
R2= 0.993

International Research Journal of Engineering and Technology (IRJET) e-ISSN: 2395-0056
Volume: 04 Issue: 08 | Aug -2017 www.irjet.net p-ISSN: 2395-0072
© 2017, IRJET | Impact Factor value: 5.181 | ISO 9001:2008 Certified Journal | Page 850
Table 11 Variability Between Observed and Predicted Roughness Values
Name of the Road Observed Roughness (m/km IRI)
Predicted Roughness (m/km IRI)
% Variability
Road-R0 3.08 3.79 23.1 Road-R1 2.57 2.89 12.4 Road-R2 4.12 4.53 9.9 Road-R3 5.96 6.84 14.7
Figure 2 Observed V/S Predicted Roughness Value (m/km IRI)
2.9.4 The‘t’ Test
The‘t’ test has been performed to find out the significance of difference between the observed and predicted distress values in response to various deterioration models. The calculated‘t’ values (tcal) for all deterioration models were compared with tabulated ‘t’ values for a significance level of 5% (t0.05) as shown in the Table 12. From this test, it is inferred that tcal < t0.05 for both the pavement deterioration models. Therefore, the difference among the predicted and observed distress readings is not significant at 5% level of significance. Hence, it is maintained that both the pavement deterioration models proved successful in predicting distresses and generation of management ideas for maintenance for the urban road network selected in this study.
Table 12 The ‘t’ Test for Observed and Predicted Distress Values
Distress Modeled Calculated ‘t’ Value (tcal)
Degree of Freedom
Tabulated ‘t’ Value (t0.05)
Comparison of tcal v/s t0.05
Cracking 0.586 6 2.447 tcal < t0.05 Roughness 0.593 6 2.447 tcal < t0.05
2.9.5 Conclusion on validation of models
The calibrated pavement deterioration models were validated by evaluating the difference in the results of distresses predicted and the actually observed results in the field. The variations of 12.5 to 26.7 percent for cracking area and 9.9 to 23.1
0
1
2
3
4
5
6
7
8
0 1 2 3 4 5 6 7
PR
EDIC
TED
RO
UG
HN
ESS
(m/k
m,
IRI)
OBSERVED ROUGHNESS (m/km, IRI)
Y = 0.097 + 1.123X R2 = 0.9899

International Research Journal of Engineering and Technology (IRJET) e-ISSN: 2395-0056
Volume: 04 Issue: 08 | Aug -2017 www.irjet.net p-ISSN: 2395-0072
© 2017, IRJET | Impact Factor value: 5.181 | ISO 9001:2008 Certified Journal | Page 851
percent for roughness have been obtained. The above variations are bound to exist for such multifarious phenomena of pavement behaviour under varied conditions of traffic loading, climatic and other conditions.
The regression analysis has been carried out correlation equations has been framed for the given distress parameters. The R2
(coefficient of determination) values for cracking and roughness have been obtained as 0.993 and 0.9899 respectively. Since R2 values depict good agreement between observed and predicted distress values.
The calculated ‘t’ values (tcal) for all models have been compared with tabulated ‘t’ values at 5% level of significance (t0.05). On the basis of comparison, the conclusion has been made that the difference between the observed and predicted distress values is not significant for both the deterioration models.
The above statistical data justifies the efficacy of the calibrated pavement deterioration models for the urban road network.
3.0 Application of methodology
The main purpose of this study is to appraise the economic benefits arising out of investing in maintenance and rehabilitation of the road network at the appropriate time as compared with carrying out minimum routine maintenance annually. This study includes the analysis (economic) of optional rehabilitation and maintenance (M&R) strategies for the heavy traffic urban (bituminous concrete) road. The M&R strategy of optimum nature is finalized on the grounds of economic indicator such as NPV. The time period of analysis is of the duration of 8 years (i.e. 2015-2022).
1.1 Pavement sections of selected roads
The Road-R3 of the identified urban roads network Panchkula has been selected for this present study. The Road-R3 comprises of a bituminous concrete surfaced road and is between sector 9 and 16 of Panchkula. This road is considered as a very heavily trafficked road section and a busy route of Panchkula. The last reconstruction (50mm BM+40mmBC) of the pavement section of Road-R3 was done in Nov, 2009. The total traffic plying on the identified pavement section of the roads is collected in terms of ADT. The selected pavement section of Road-R3 belongs to high serviceability level (Level1).
1.2 Proposed M&R strategies
The maintenance and rehabilitation strategies applicable to the pavement section have to be put forward in advance. The M&R strategies depicted in the Table 13 are accounted for this study. The first strategy i.e. ‘Base Alternative’ makes the provision of minimum routine maintenance till up to the time when the pavement`s reconstruction becomes unavoidable. Four other alternative M&R strategies, namely Alternative 1, Alternative 2, Alternative 3, and Alternative 4, which comprehend resealing, resealing plus overlay, overlay, and mill & replace type of maintenance works respectively, have also been mentioned.
Table 13 Proposed M&R Strategies and Intervention Level of Road-R3
M&R Strategy
Works Standards
Description of Work Intervention Level
Base Alternative
Routine Maintenance
Crack Sealing Scheduled annually Patching Scheduled annually
Alternative 1
Resealing Provide 25mm DBSD Total damaged area > 5% of the total area
Alternative 2
Resealing + Overlay
Provide 25mm DBSD Total damaged area > 5% of the total area
Provide 40 mm BC Roughness > 2.8m/km IRI Alternative 3 Overlay Provide 40 mm BC Roughness > 2.8m/km IRI Alternative 4
Mill and Replace
Remove 90 mm Surfacing and provide 50 mm BM+40 mm BC
Roughness > 5 m/km IRI Carriageway cracked Area > 20% of total area
Total damaged area consists of cracked, raveled and potholed area
International Research Journal of Engineering and Technology (IRJET) e-ISSN: 2395-0056
Volume: 04 Issue: 08 | Aug -2017 www.irjet.net p-ISSN: 2395-0072
© 2017, IRJET | Impact Factor value: 5.181 | ISO 9001:2008 Certified Journal | Page 852
1.3 Project analysis
During the set up of the project analysis, Base Alternative is established with respect to which the economic analysis is to be undertaken and a discount rate of 10% is specified. While doing execution of project analysis, Alternative1, Alternative2, Alternative3 and Alternative4 are compared with the Base Alternative. As a result of this operation, the pavement deterioration reports, and the maintenance & rehabilitation works reports are created for all M&R strategies considered above. These two types of reports are mentioned in the following sections.
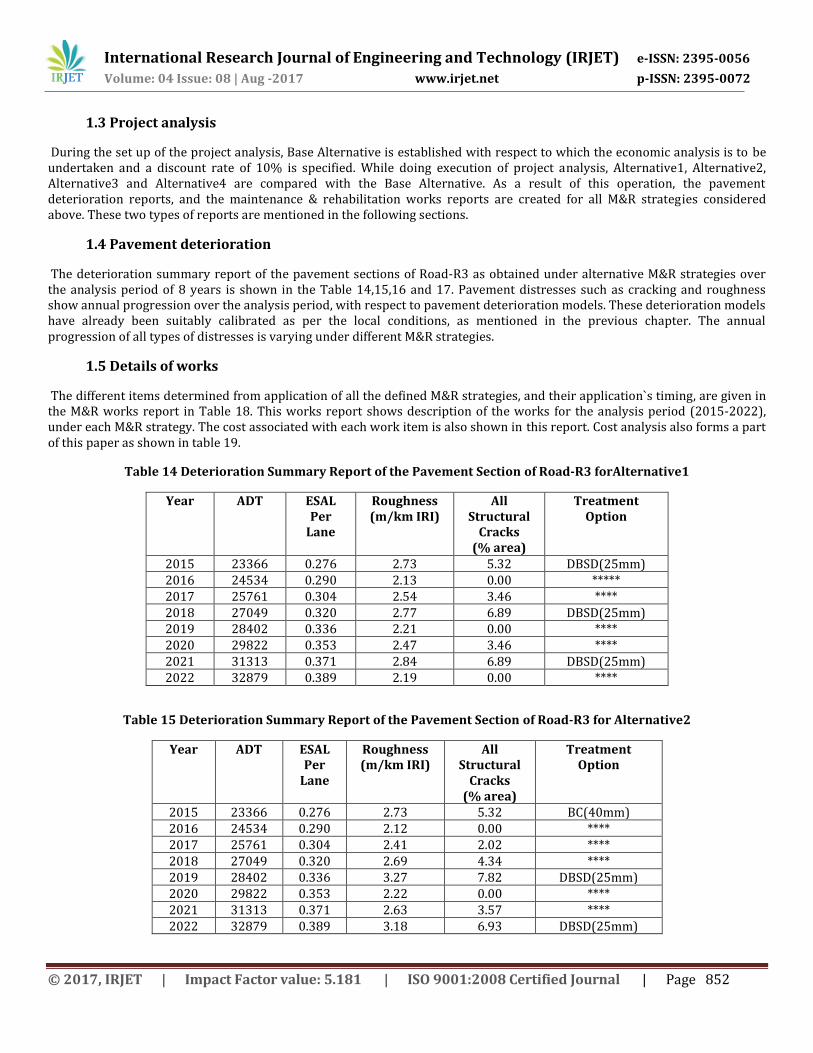
1.4 Pavement deterioration
The deterioration summary report of the pavement sections of Road-R3 as obtained under alternative M&R strategies over the analysis period of 8 years is shown in the Table 14,15,16 and 17. Pavement distresses such as cracking and roughness show annual progression over the analysis period, with respect to pavement deterioration models. These deterioration models have already been suitably calibrated as per the local conditions, as mentioned in the previous chapter. The annual progression of all types of distresses is varying under different M&R strategies.
1.5 Details of works
The different items determined from application of all the defined M&R strategies, and their application`s timing, are given in the M&R works report in Table 18. This works report shows description of the works for the analysis period (2015-2022), under each M&R strategy. The cost associated with each work item is also shown in this report. Cost analysis also forms a part of this paper as shown in table 19.
Table 14 Deterioration Summary Report of the Pavement Section of Road-R3 forAlternative1
Year ADT ESAL Per
Lane
Roughness (m/km IRI)
All Structural
Cracks (% area)
Treatment Option
2015 23366 0.276 2.73 5.32 DBSD(25mm) 2016 24534 0.290 2.13 0.00 ***** 2017 25761 0.304 2.54 3.46 **** 2018 27049 0.320 2.77 6.89 DBSD(25mm) 2019 28402 0.336 2.21 0.00 **** 2020 29822 0.353 2.47 3.46 **** 2021 31313 0.371 2.84 6.89 DBSD(25mm) 2022 32879 0.389 2.19 0.00 ****
Table 15 Deterioration Summary Report of the Pavement Section of Road-R3 for Alternative2
Year ADT ESAL Per
Lane
Roughness (m/km IRI)
All Structural
Cracks (% area)
Treatment Option
2015 23366 0.276 2.73 5.32 BC(40mm) 2016 24534 0.290 2.12 0.00 **** 2017 25761 0.304 2.41 2.02 **** 2018 27049 0.320 2.69 4.34 **** 2019 28402 0.336 3.27 7.82 DBSD(25mm) 2020 29822 0.353 2.22 0.00 **** 2021 31313 0.371 2.63 3.57 **** 2022 32879 0.389 3.18 6.93 DBSD(25mm)

International Research Journal of Engineering and Technology (IRJET) e-ISSN: 2395-0056
Volume: 04 Issue: 08 | Aug -2017 www.irjet.net p-ISSN: 2395-0072
© 2017, IRJET | Impact Factor value: 5.181 | ISO 9001:2008 Certified Journal | Page 853
Table 16 Deterioration Summary Report of the Pavement Section of Road-R3 for Alternative3
Year ADT ESAL Per
Lane
Roughness (m/km IRI)
All Structural
Cracks (% area)
Treatment Option
2015 23366 0.276 2.73 5.32 BC(40mm) 2016 24534 0.290 2.12 0.00 **** 2017 25761 0.304 2.41 2.02 **** 2018 27049 0.320 2.69 4.34 **** 2019 28402 0.336 3.27 7.82 BC(40mm) 2020 29822 0.353 2.05 0.00 **** 2021 31313 0.371 228 1.97 **** 2022 32879 0.389 2.61 4.39 ****
Table 17 Deterioration Summary Report of the Pavement Sectionof Road-R3 for Alternative4
Year ADT ESAL Per
Lane
Roughness (m/km IRI)
All Structural
Cracks (% area)
Treatment Option
2015 23366 0.276 2.73 05.32 **** 2016 24534 0.290 3.44 07.33 **** 2017 25761 0.304 4.05 12.08 **** 2018 27049 0.320 4.81 17.56 **** 2019 28402 0.336 5.98 25.32 Mill&Replace 2020 29822 0.353 1.99 00.00 **** 2021 31313 0.371 2.31 02.03 **** 2022 32879 0.389 2.63 04.36 ****
Table 18 M&R Works Report for Pavement Section of Road-R3
Year M&R Works Base Alt Alt1 Alt2 Alt3 Alt4
2015 Patch & Crack Seal
DBSD 25 mm
BC (40 mm)
BC 40 mm
****
2016 Patch & Crack Seal
**** **** **** ****
2017 Patch & Crack Seal
**** **** **** ****
2018 Patch & Crack Seal
DBSD (25mm)
**** **** ****
2019 Patch & Crack Seal
**** DBSD (25mm)
BC (40mm)
Mill & Replace
2020 Patch & Crack Seal
**** **** **** ****
2021 Patch & Crack Seal
DBSD (25mm)
**** **** ****
2022 Patch & Crack Seal
**** DBSD (25mm)
**** ****

International Research Journal of Engineering and Technology (IRJET) e-ISSN: 2395-0056
Volume: 04 Issue: 08 | Aug -2017 www.irjet.net p-ISSN: 2395-0072
© 2017, IRJET | Impact Factor value: 5.181 | ISO 9001:2008 Certified Journal | Page 854
Table 19 Associated Costs for Pavement Section of Road-R3
Year Cost of Works Base Alt Alt1 Alt2 Alt3 Alt4
2015 0.358 2.652 3.166 3.166 **** 2016 0.358 **** **** **** **** 2017 0.358 **** **** **** **** 2018 0.358 3.530 **** **** **** 2019 0.358 **** 3.883 4.634 9.721 2020 0.358 **** **** **** **** 2021 0.358 4.698 **** **** **** 2022 0.358 **** 5.171 **** ****
Total Cost in Million Indian Rupees
2.870 10.880 12.220 7.800 9.720
1.6 Economic analysis summary for a pavement section of Road-R3
The summary of the economic analysis is undertaken under the ‘Project Analysis’ is shown in the Table 20. This summary shows a cost comparison for each M&R strategy, when evaluated with the Base Alternative. The indicator based on economics NPV is also computed.
Table 20 Summary of Economic Analysis of Road-R3 for Project Analysis’
Alternative Strategies
Total Agency
Costs
Increase In
Agency Costs
Decrease In Road
User Costs
Net Present
Value (NPV)
NPV/Cost
Ratio
Base Alternative
2.870 0.000 0.000 0.000 0.000
Alternative1 10.880 8.540 31.590 23.05 2.12 Alternative2 12.220 9.890 36.090 26.20 2.14 Alternative3 7.800 5.180 24.450 19.27 2.47 Alternative4 9.720 7.240 24.620 17.38 1.79
All Costs are expressed in Million Indian Rupees
3.7. Determining optimum M&R-strategy of a pavement section of Road-R3: The economic analysis summary shown in Table 20 reveals that the alternative no. 3 as the optimum M&R strategy, as it possesses maximum NPV/cost ratio. Therefore, it has been concluded on the basis of above case study that Alternative3, which comprises of application of overlay (40mm Bituminous Concrete) at a pre defined intervention level (triggered when Structural Cracks > 5% of total area), is the optimum M&R strategy for the selected pavement section.
4. Conclusions and recommendations
Conclusions drawn on the basis of this study are.
An operational methodology in this study, aided by adequate indigenous tools is not popular in India for the development of Optimum Maintenance and Rehabilitation strategy urban road network. Therefore, the pavement deterioration models which are internationally recognized have been selected for use in this study. These models have been chosen because of its global acceptance and large applicability in a number of advanced countries.

International Research Journal of Engineering and Technology (IRJET) e-ISSN: 2395-0056
Volume: 04 Issue: 08 | Aug -2017 www.irjet.net p-ISSN: 2395-0072
© 2017, IRJET | Impact Factor value: 5.181 | ISO 9001:2008 Certified Journal | Page 855
The methodology comprehends selection & identification of the urban road network, acquisition of data, and calibration, validation and activation of pavement deterioration models for Indian conditions.
The urban road network selected for the present study consists of four Bituminous Concrete (BC) type roads (Road-R0, Road-R1, Road-R2and Road-R3) located in Panchkula. The BC roads (Road-R0, Road-R1, Road-R2 and Road-R3) are one way type. Since, this urban road network covers different types of traffic and pavement composition, therefore, this network may be considered as the representative for other urban road network in India and abroad.
As per the current norms for maintenance of roads, all the selected pavement section of the roads donot require maintenance of the same serviceability levels due to functional requirements and funds constraints. Therefore, these three pavement sections of different roads have been categorized into High Maintenance Serviceability Levels as per the traffic volume catered by them at present i.e.> 10000ADT.
All the collected data have been utilized for time series prediction of pavement distresses by making use of pavement deterioration models.
The calibration factors obtained in this study for various deterioration models are: Cracking Initiation (Kcia) = 0.217 (average), Cracking Progression (kcpa) = 0.476 (average) and Roughness Progression (Kgp) = 0.844 (average). It shows that the initiation of cracking start showing up at the pavement surface pretty much before than the prediction of the pavement deterioration model. In other words, the initiation of cracking distresses is faster for urban test stretches. The rate of cracking initiation (Kcia = 0.217) is faster by 78.3% on urban test stretches. The rate of progression of cracking (Kcpa = 0.476) is slower by 52.45% on urban test stretches.
The validation has been undertaken through percentage variability in the observed and predicted values, coefficient of determination (R2), and ‘t’ test. Variability of 12.5 to 26.7 percent for cracking area and 9.9 to 23.1 percent for roughness has been obtained. These variations are bound to occur for such complex phenomena of pavement behaviour under different conditions of soil type, pavement composition, traffic loading and climatic conditions. The correlation equations have been developed for these distress values and the regression analysis has been done. The Coefficient of Determination (R2) values for cracking and roughness have been obtained as 0.993, and 0.9899 respectively.
The calculated ‘t’ values for cracking and roughness are 0.586 and 0.593 respectively. The tabulated ‘t’ values for cracking and roughness at 5% level of significance are 2.447, and 2.447 respectively. All the calculated ‘t’ values are less than their corresponding tabulated ‘t’ values. This evinces that the difference in predicted & observed distress readings is not statistically significant at 5% level of significance justifying the auitability of these deterioration models.
Amongst many of the pre-defined M&R strategies, an optimum maintenance and rehabilitation strategy was determined on the grounds of highest NPV/Cost ratio. The M&R strategy consists of application of overlay (40mm Bituminous Concrete) at a defined intervention level (activated when structural cracks > 5%).
Similar kind of Optimum Maintenance and Rehabilitation Strategy may be developed for different categories of urban road network.
5.0 References
1. Abaza, K. (2004), “Deterministic Performance Prediction Model for Rehabilitation & Management of Flexible Pavement”, International Journal of Pavement Engineering 5(2), 111-121.
2. Abja, K. A. (2002). “Optimum Flexible Pavement Life-Cycle Analysis Model”, ASCE Journal of Transportation Engineering, Vol. 128, No. 6, pp 542-549.
3. Antonio, A., Picado-Santos, L., and Ferreira, A. (2002). “Optimization Models for Pavement Management: Past Achievements and Current Trends”, Proceedings, 3rd International Conference on Decision Making in Urban and Civil Engineering, London, U.K.
4. Bennet, C.R., and Greenwood, I.D. (2002). “Modelling Road User and Environmental Effects in HDM-4”, The Highway Development and Management Series, Volume 7, ISOHDM Technical Secretariat, University of Birmingham, U.K.

International Research Journal of Engineering and Technology (IRJET) e-ISSN: 2395-0056
Volume: 04 Issue: 08 | Aug -2017 www.irjet.net p-ISSN: 2395-0072
© 2017, IRJET | Impact Factor value: 5.181 | ISO 9001:2008 Certified Journal | Page 856
5. CRRI (1994). “Pavement Performance Study on Existing Pavement Sections”, Project Sponsored by Ministry of Surface Transport, Government of India, Final Report, Submitted by Central Road Research Institute, New Delhi.
6. Gedafa, D.S. ( 2007), “Performance Prediction and Maintenance of Flexible Pavement “, Proceedings of the 2007 Midcontinent Transportation Research Symposium, Ames, Iowa, 2007.
7. Haas, Ralph, W. Ronald Hudson and Lynne Cowe Falls (2011), “Evolution and Future Challenges for Pavement Management”, Proc., 8th Int. Conf. On Managing Pavement Assets, Santiago, Chile
8. IRC (2009). “Manual on Economic Evaluation of Highway Projects in India”, IRC:SP30, Indian Roads Congress, New Delhi..
9. IRC (1997). “Guidelines for Strengthening of Flexible Road Pavement Using Benkelman Beam Deflection Technique”, IRC:81, Indian Roads Congress, New Delhi.
10. IRC (2012). “Guidelines for the Design of Flexible Pavements”, IRC:37, Indian Roads Congress, New Delhi. 11. Jain, S.S., Parida, M., and Rawat, M.M.S. (1999). “A Rational Approach for Pavement Management System for Urban
Roads”, Highway Research Bulletin, No. 61, Indian Roads Congress, pp 69-99. 12. Martin T (2004), Data Review and Caliberation of HDM-4 Road Deterioration Models ARRBTR Research Report ARR
360 (ARRBTR: Vermont South, Victoria, Australia. 13. MORT&H (2001c). “Road Development Plan Vision: 2021”, Ministry of Road Transport & Highways, Government of
India, New Delhi. 14. MORT&H (2013e). “Updation of Road User Cost Data”, Final Report prepared by Central Road Research Institute, for
Ministry of Road Transport & Highways, Government of India, New Delhi. 15. MORTH&H (2004), “ Guideline for Maintenance of Primary, Secondary and Urban Roads” , Ministry of Road Transport
and Highway, Govt. of India, New Delhi. 16. Odoki, J.B., and Kerali, H.R. (2000). “Analytical Framework and Model Descriptions”, HDM-4 Documentation Series,
Volume-4, The World Road Association (PIARC), Paris, France. 17. Roberts, J.D., and Martin, T.C. (1998). “Pavement Performance Monitoring for Network Management and Life-Cycle
Costing”, Proceedings, 4th International Conference on Managing Pavements”, Durban, South Africa. 18. Zimmerman, K.A (2010), Linda M. Pierce and James Krstulovich. “ Pavement Management Roadmap. Executive
Summary.” Document publ. By Federal Highway Administration, Washington D.C.