smart infrastructure business and policy dialogue 2014:global best practice infrastructure - who...
DESCRIPTION
A presentation conducted by Mr Ross Love, Senior Partner, Boston Consulting Group, Australia and New Zealand. Presented on Wednesday the 13th of August, 2014. Ross Love is a Senior Partner of The Boston Consulting Group (BCG) in Australia and New Zealand, and until July 2014 the Managing Partner of BCG’s Australian and New Zealand Offices,and a member of the firm’s Asia Pacific Management Team. He has over 20 years experience consulting to senior executives and boards in the transport, consumer, industrial goods and public sectors. He has been the global leader of BCG’s Travel and Tourism Practice and is a member of the leadership team for BCG’s Consumer Practice and Business Transformation Practice. He consults on issues of strategy (including acquisitions), operations (including pricing), supply chain effectiveness and workforce productivity, and organisation (including design and change management). Ross is a Director of Jawun – Indigenous Corporate Partnerships, and a Special Advisor to the Wunan Foundation, an Indigenous development organisation in the East Kimberley. He has recently supported the Australian B20 leadership team, and in particular the Infrastructure and Investment Taskforce chaired by David Thodey. Before joining BCG in 1993, Ross was the Chief of Staff to the Premier of Western Australia. This followed four at Harvard University and consulting in California, and three years as an economic policy adviser to the Government of Western Australia. Ross has a Bachelor of Arts with first class honours in Politics from the University of Western Australia, a Masters of Public Administration from Harvard University and has completed further business studies at the London Business School. He was a Harkness Fellow for Australia in 1986. Ross is a Past President of the Harvard Club of Australia.TRANSCRIPT

Monday, 30th September 2013: Business & policy Dialogue
Tuesday 1 October to Thursday, 3rd October: Academic and Policy Dialogue
www.isngi.org
ENDORSING PARTNERS
The following are confirmed contributors to the business and policy dialogue in Sydney:
• Rick Sawers (National Australia Bank)
• Nick Greiner (Chairman (Infrastructure NSW)
smart.uow.edu.au
Global Best Practice Infrastructure – Who Does it Best and What Can Australia Learn?
Presented by: Mr Ross Love, Senior Partner, Boston Consulting Group, Australia and New Zealand

Leading practices in infrastructure Presentation to SMART Infrastructure Business and Policy Dialogue
August 2014

SMART BPD Presentation - Ross Love BCG.pptx 2
Draft—for discussion only
Cop
yrig
ht ©
201
4 by
The
Bos
ton
Con
sulti
ng G
roup
, Inc
. All
right
s re
serv
ed.
Introduction
There is a pressing need to address the growing global infrastructure gap • Under current conditions, up to $25t shortfall in global infrastructure capacity expected by 2030 • Over the long-term, this could be worth 3–5% of global GDP
Closing this gap requires improvements across the infrastructure life-cycle
• Credible infrastructure pipelines that prioritise the right investments • Rigorous preparation and procurement to set them up for success • Ongoing optimisation of operations and maintenance to maximise their value over time • A supportive, predictable and transparent enabling environment
Australia has a strong foundation to build on, but there is clear room for improvement, e.g.
• Ensure IA reforms translate into real improvements in project selection • Make more systemic use of user charging and alternative revenue sources • Promote greater innovation in project delivery and execution • Improve data capture and availability, and enable super funds to take greater responsibility for
long-term capital formation
SMART BPD Presentation - Ross Love BCG.pptx 3
Draft—for discussion only
Cop
yrig
ht ©
201
4 by
The
Bos
ton
Con
sulti
ng G
roup
, Inc
. All
right
s re
serv
ed.
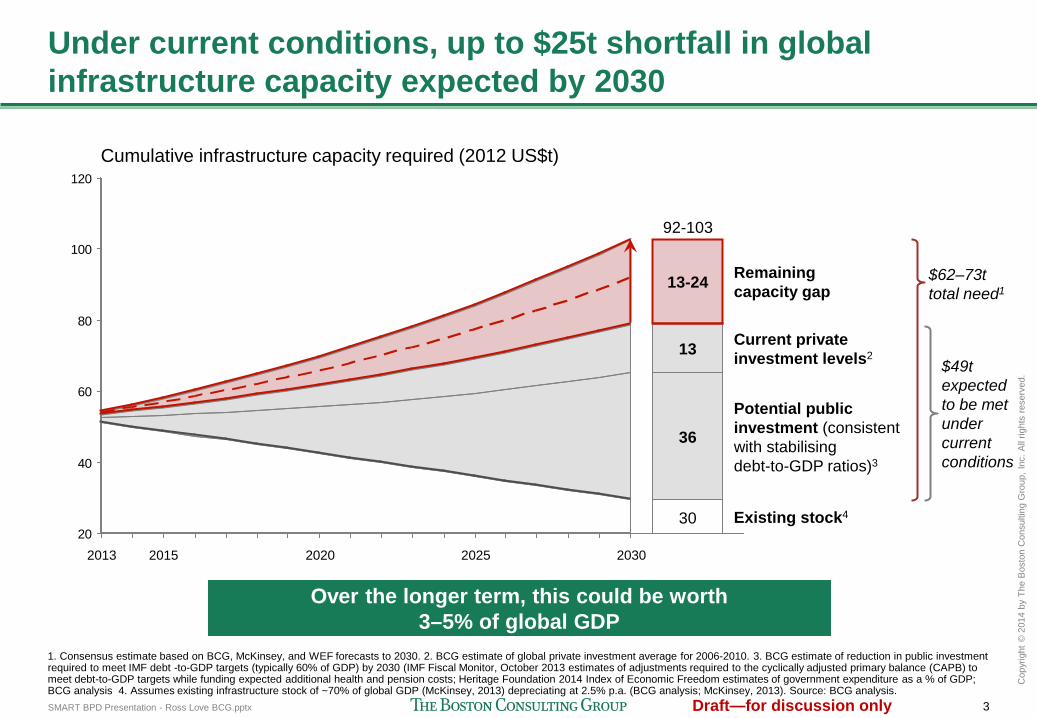
Under current conditions, up to $25t shortfall in global infrastructure capacity expected by 2030
20
40
60
80
100
120
2025 2020 2015 2013 2030
Cumulative infrastructure capacity required (2012 US$t)
92-103
13
Existing stock4
Potential public investment (consistent with stabilising debt-to-GDP ratios)3
13-24
30
36
Remaining capacity gap
Current private investment levels2 $49t
expected to be met under current conditions
$62–73t total need1
1. Consensus estimate based on BCG, McKinsey, and WEF forecasts to 2030. 2. BCG estimate of global private investment average for 2006-2010. 3. BCG estimate of reduction in public investment required to meet IMF debt -to-GDP targets (typically 60% of GDP) by 2030 (IMF Fiscal Monitor, October 2013 estimates of adjustments required to the cyclically adjusted primary balance (CAPB) to meet debt-to-GDP targets while funding expected additional health and pension costs; Heritage Foundation 2014 Index of Economic Freedom estimates of government expenditure as a % of GDP; BCG analysis 4. Assumes existing infrastructure stock of ~70% of global GDP (McKinsey, 2013) depreciating at 2.5% p.a. (BCG analysis; McKinsey, 2013). Source: BCG analysis.
Over the longer term, this could be worth 3–5% of global GDP

SMART BPD Presentation - Ross Love BCG.pptx 4
Draft—for discussion only
Cop
yrig
ht ©
201
4 by
The
Bos
ton
Con
sulti
ng G
roup
, Inc
. All
right
s re
serv
ed.
Closing this gap will require improvements across the infrastructure lifecycle ...
20
40
60
80
100
120
2030 2025 2020 2015 2013
Cumulative infrastructure capacity required (2012 US$t)
Increased availability of financing
Enhanced enabling environment
Improved project execution
Rigorous preparation and procurement
Improved project selection and prioritisation
~15%
10-15%
~30%
~30-35%
~10%
Maximum lever potential
Note: Based on estimates: of the benefits of improved project selection and prioritisation (BCG; McKinsey); the 'privatisable' share of current government non-financial assets (Infrastructure Australia; The Economist; OECD; BCG analysis); increased revenue potential of user charges, land value capture, and ancillary revenue (African Infrastructure Country Diagnostic; IEA; WEF; BCG analysis); cost efficiencies in construction and O&M (WEF; BCG; McKinsey); the impact of improving all countries' regulatory environment to current best practice (World Bank; BCG analysis); and the impact of increasing depth of national financial markets towards world best practice (World Bank; BCG analysis). Source: BCG analysis.

SMART BPD Presentation - Ross Love BCG.pptx 5
Draft—for discussion only
Cop
yrig
ht ©
201
4 by
The
Bos
ton
Con
sulti
ng G
roup
, Inc
. All
right
s re
serv
ed.
Origination Preparation and procurement Execution
Source: BCG; World Economic Forum
... but this is primarily about getting 'the basics' right
Project cycle
Needs-based, long-term infrastructure vision
Bankable feasibility studies that rigorously forecast demand, revenue and cost
Optimised asset value and utilisation
Integrated, evidence-based selection and prioritisation
Clear allocation of risks to parties best able to manage them
Lifecycle-focus in maintenance and investment to increase lifetime value
Rigorous 'value for money' analysis to determine delivery model
Rigorous, standardised project preparation processes
Lean organisation and processes to minimise construction and operating costs
Transparent, competitive, and efficient procurement processes
Enabling environment
Stable, transparent and effective legal & regulatory framework
High quality, widely accessible data and benchmarks
Efficient regulatory and approvals processes
High capability workforce
Adequate access to long-term finance

SMART BPD Presentation - Ross Love BCG.pptx 6
Draft—for discussion only
Cop
yrig
ht ©
201
4 by
The
Bos
ton
Con
sulti
ng G
roup
, Inc
. All
right
s re
serv
ed.
Origination Preparation and procurement Execution
Source: BCG; World Economic Forum
... but this is primarily about getting 'the basics' right
Project cycle
Needs-based, long-term infrastructure vision
Bankable feasibility studies that rigorously forecast demand, revenue and cost
Optimised asset value and utilisation
Integrated, evidence-based selection and prioritisation
Clear allocation of risks to parties best able to manage them
Lifecycle-focus in maintenance and investment to increase lifetime value
Rigorous 'value for money' analysis to determine delivery model
Rigorous, standardised project preparation processes
Lean organisation and processes to minimise construction and operating costs
Transparent, competitive, and efficient procurement processes
Enabling environment
Stable, transparent and effective legal & regulatory framework
High quality, widely accessible data and benchmarks
Efficient regulatory and approvals processes
High capability workforce
Adequate access to long-term finance

SMART BPD Presentation - Ross Love BCG.pptx 7
Draft—for discussion only
Cop
yrig
ht ©
201
4 by
The
Bos
ton
Con
sulti
ng G
roup
, Inc
. All
right
s re
serv
ed.
Origination Preparation and procurement Execution
Source: BCG; World Economic Forum
... but this is primarily about getting 'the basics' right
Project cycle
Needs-based, long-term infrastructure vision
Bankable feasibility studies that rigorously forecast demand, revenue and cost
Optimised asset value and utilisation
Integrated, evidence-based selection and prioritisation
Clear allocation of risks to parties best able to manage them
Lifecycle-focus in maintenance and investment to increase lifetime value
Rigorous 'value for money' analysis to determine delivery model
Rigorous, standardised project preparation processes
Lean organisation and processes to minimise construction and operating costs
Transparent, competitive, and efficient procurement processes
Enabling environment
Stable, transparent and effective legal & regulatory framework
High quality, widely accessible data and benchmarks
Efficient regulatory and approvals processes
High capability workforce
Adequate access to long-term finance

SMART BPD Presentation - Ross Love BCG.pptx 8
Draft—for discussion only
Cop
yrig
ht ©
201
4 by
The
Bos
ton
Con
sulti
ng G
roup
, Inc
. All
right
s re
serv
ed.
Origination Preparation and procurement Execution
Source: BCG; World Economic Forum
... but this is primarily about getting 'the basics' right
Project cycle
Needs-based, long-term infrastructure vision
Bankable feasibility studies that rigorously forecast demand, revenue and cost
Optimised asset value and utilisation
Integrated, evidence-based selection and prioritisation
Clear allocation of risks to parties best able to manage them
Lifecycle-focus in maintenance and investment to increase lifetime value
Rigorous 'value for money' analysis to determine delivery model
Rigorous, standardised project preparation processes
Lean organisation and processes to minimise construction and operating costs
Transparent, competitive, and efficient procurement processes
Enabling environment
Stable, transparent and effective legal & regulatory framework
High quality, widely accessible data and benchmarks
Efficient regulatory and approvals processes
High capability workforce
Adequate access to long-term finance

SMART BPD Presentation - Ross Love BCG.pptx 9
Draft—for discussion only
Cop
yrig
ht ©
201
4 by
The
Bos
ton
Con
sulti
ng G
roup
, Inc
. All
right
s re
serv
ed.
Origination Preparation and procurement Execution
Source: BCG; World Economic Forum
... but this is primarily about getting 'the basics' right
Project cycle
Needs-based, long-term infrastructure vision
Bankable feasibility studies that rigorously forecast demand, revenue and cost
Optimised asset value and utilisation
Integrated, evidence-based selection and prioritisation
Clear allocation of risks to parties best able to manage them
Lifecycle-focus in maintenance and investment to increase lifetime value
Rigorous 'value for money' analysis to determine delivery model
Rigorous, standardised project preparation processes
Lean organisation and processes to minimise construction and operating costs
Transparent, competitive, and efficient procurement processes
Enabling environment
Stable, transparent and effective legal & regulatory framework
High quality, widely accessible data and benchmarks
Efficient regulatory and approvals processes
High capability workforce
Adequate access to long-term finance
Selected examples

SMART BPD Presentation - Ross Love BCG.pptx 10
Draft—for discussion only
Cop
yrig
ht ©
201
4 by
The
Bos
ton
Con
sulti
ng G
roup
, Inc
. All
right
s re
serv
ed.
Institutional set-up is critical to establishing a credible infrastructure pipeline that prioritises the right investments
Needs-based long-term
infrastructure vision
Integrated, evidence-based selection
and prioritisation
Rigorous 'value for money' analysis
Preparation and procurement
Early and effective public involvement E.g. France's National Commission for Public Debate (CNDP) is charged with organising public consultation as early as possible in the project lifecycle
Formal requirement for independent, expert review (incl. ex-post evaluation) and advice E.g. South Korea's PIMAC is required to verify CBA and value-for-money analyses before a project can proceed
Transparency of assessments and decision-making E.g. Infrastructure Ontario ensures value-for-money methodology and assessments are publicly disclosed
Clearly defined stage gates E.g. UK Major Projects Authority is responsible for formal stage gate reviews, including explicit option to halt projects based on updated information
Project selection clearly separated from choice of delivery model
Unfettered choice to review projects, incl. unsolicited proposals
Source: BCG.

SMART BPD Presentation - Ross Love BCG.pptx 11
Draft—for discussion only
Cop
yrig
ht ©
201
4 by
The
Bos
ton
Con
sulti
ng G
roup
, Inc
. All
right
s re
serv
ed.
Sustainable revenue models leverage a broad range of funding sources: not just taxes or user charges
Source: BCG; World Economic Forum.
50% of RDE PPPs rely on user fees vs. few in developed countries
Potential can range from 010% of revenue utilities
to 50% in airports
Metro lines have recovered 50-85% of
required funding
India limits viability gap funding to 20% of total
project cost
User charges
Ensure public buy-in • Clearly link to quality
improvements (e.g. Stockholm congestion charge)
Optimise pricing
• Minimise 'pain' of payment (e.g. e-tolling)
• Diversify service levels to balance cost and revenue (e.g. Manila Water's 'Water for the Poor')
Ancillary revenue
Address user needs holistically
• Satisfy advanced needs in core business (e.g. energy-saving solutions)
• Pursue adjacent services (e.g. sell warehousing at ports)
• Consider unrelated revenue sources (e.g. cabling under roads)
Partner effectively to up the odds of success
Land value capture
Choose an appropriate level of risk
• Tradable development rights (e.g. CEPACs in Brazil)
• Joint-develop land with concessionaire (e.g. MTR in HK)
• Buy and re-sell land before announcement (e.g. Copenhagen metro)
Act quickly to exploit window of opportunity
Government payments
Use to bridge 'viability-gap' where necessary
• Based on rigorous analysis, not by default
Ensure risk allocation incentivises outcomes
• Availability payments reflect service-levels (e.g. UK A1 payments inversely proportional to congestion levels)
• Shadow tolling (e.g. Belras road in Portugal)
Key
suc
cess
fact
ors
Pote
ntia
l

SMART BPD Presentation - Ross Love BCG.pptx 12
Draft—for discussion only
Cop
yrig
ht ©
201
4 by
The
Bos
ton
Con
sulti
ng G
roup
, Inc
. All
right
s re
serv
ed.
Operations control
Maintenance
User self-regulation
Time-based charging
3
2
1
Data-driven technology can drive significant improvements in asset utilisation and maintenance
Impact Leading practice
Ope
rato
rs
Use
rs
Incr
easi
ng in
terv
entio
n w
ith u
ser b
ehav
iour
Provide users with data they
need to change behavior
Impose usage limitations only
when/where necessary
Use social mitigation
measures to ensure public
buy-in
Monitor data to predict
deterioration in asset condition
Example
• SF Smart Parking program uses a smart phone app to broadcast the location of available parking spaces in real-time (including their demand-adjusted parking prices)
• Average time searching for parking has decreased 43%; target occupancy met 31% more often
• NYC system, Midtown in Motion monitors real-time microwave sensors, cameras and e-tolling readers to identify choke points, adjust signals and clear traffic
• Travel speeds improved by 10%
• Proportion of potholes closed within 2 days increased from 48 to 92%
• Boston's pothole-finding app, Street Bump crowdsources asset condition data to locate patches of road that need or will need repair
• Washington State Route 167 dynamically prices HOT (High Occupancy Toll) lanes based on real-time traffic levels updated every 5 minutes
• Vehicle numbers reduced by 5%; collisions down 2% and speeds have increased by 20%
4
Source: BCG; World Economic Forum; San Francisco Municipal Transportation Agency; City of Boston Public Works Department.

SMART BPD Presentation - Ross Love BCG.pptx 13
Draft—for discussion only
Cop
yrig
ht ©
201
4 by
The
Bos
ton
Con
sulti
ng G
roup
, Inc
. All
right
s re
serv
ed.
Dramatic efficiency improvements in approvals possible without compromising the integrity of the process
Source: BCG; European Commission (2011) Permitting procedures for energy infrastructure projects in the EU: evaluation and legal recommendations; Canada MPMO (Major Projects Management Office; OECD (2010) Better regulation in Europe: France; Memorandum of Understanding (2009) Transmission Siting on Federal Lands.
Standardised approval pathways
with a single point of
accountability
Early and effective public
participation
Clear allocation of responsibility
between agencies
Rationalised regulatory objectives
• Legislation enforces strict timeframes for overall approvals
• Responsible agency can take decision in lieu of local authorities if input not provided
Netherlands
• 9 Federal agencies signed an MoU
to speed up approval of transmission lines, reduce duplication and ensure seamless processes
United States Canada
• Created single point of entry for resource projects
• Reduced number of agencies involved from 40 to 3
• Legislation requires public involvement as early as possible in the approval process to improve buy-in and identify areas of tension
France
Clear time limits for overall approvals

SMART BPD Presentation - Ross Love BCG.pptx 14
Draft—for discussion only
Cop
yrig
ht ©
201
4 by
The
Bos
ton
Con
sulti
ng G
roup
, Inc
. All
right
s re
serv
ed.
Origination Preparation and procurement Execution
Source: BCG; World Economic Forum
Australia has a strong foundation to build from, but there is clear room for improvement
Project cycle
Needs-based, long-term infrastructure vision
Bankable feasibility studies that rigorously forecast demand, revenue and cost
Optimised asset value and utilisation
Integrated, evidence-based selection and prioritisation
Clear allocation of risks to parties best able to manage them
Lifecycle-focus in maintenance and investment to increase lifetime value
Rigorous 'value for money' analysis to determine delivery model
Rigorous, standardised project preparation processes
Lean organisation and processes to minimise construction and operating costs
Transparent, competitive, and efficient procurement processes
Enabling environment
Stable, transparent and effective legal & regulatory framework
High quality, widely accessible data and benchmarks
Efficient regulatory and approvals processes
High capability workforce
Adequate access to long-term finance
Ensure Infrastructure Australia reforms translate into real improvements in
practice
Make more systemic use of user charging
and alternative revenue sources
Promote greater innovation in execution
Improve data capture and availability Enable super funds to take greater responsibility for long-term capital formation

SMART BPD Presentation - Ross Love BCG.pptx 15
Draft—for discussion only
Cop
yrig
ht ©
201
4 by
The
Bos
ton
Con
sulti
ng G
roup
, Inc
. All
right
s re
serv
ed.
Direct user charges are a small proportion of Australian road-related revenue
50
100
0
11%
25%
9%
50%
75%
91%
France Switzerland
8%
81%
44%
41%
Australia
41%
Germany UK
19%
2%
98%
US
5%
75%
Norway
% of annual road-related revenue
25%
Note: Direct usage charges comprise tolls; indirect usage charges include fuel and motor vehicle taxes; one-off fees include vehicle registration and licensing fees; unrelated income includes e.g. investment income; for Australia, Fringe Benefits Tax was treated as a one-off fee; for the US, motor-vehicle and other taxes and fees were split among one-off fees and indirect usage charges. Source: Australian Department of Infrastructure and Transport 2011; Comité des Constructeurs Français d'Automobiles 2009; Eidgenössische Finanzverwaltung 2009; Bundesministerium der Finanzen 2009; HM Revenue and Customs 2009; Bråthen & Odeck, 'Funding of Road Construction in Norway' 2006; US Federal Highway Administration 2011.
Unrelated income One-off fees Indirect usage charges Direct user charges
Backup

SMART BPD Presentation - Ross Love BCG.pptx 16
Draft—for discussion only
Cop
yrig
ht ©
201
4 by
The
Bos
ton
Con
sulti
ng G
roup
, Inc
. All
right
s re
serv
ed.
Australian construction firms and infrastructure operators amongst the least innovative sectors of the economy
31 31 3028
25 25 22 2219 18
14 12 11 11 11 11 10
2024
30
19 1814
17 15 1620 18
15
25
1216 16
10
0
10
20
30
40
Agric
ultu
re
Elec
trici
ty, G
as &
W
ater
ser
vice
s
% of Australian businesses introducing innovation, 2012-13
Tran
spor
t &
War
ehou
sing
Con
stru
ctio
n
Rea
l Est
ate
serv
ices
Adm
inis
trativ
e se
rvic
es
Fina
ncia
ll se
rvic
es
Hos
pita
lity
Hea
lth c
are
Rec
reat
ion
serv
ices
Oth
er s
ervi
ces
Prof
essi
onal
se
rvic
es
Med
ia &
Te
leco
Who
lesa
le
Man
ufac
turin
g
Ret
ail
Min
ing
Operational processes Goods or services
Source: ABS, Summary of IT Use and Innovation in Australian Business, 2012-13
Operational processes (Average=18%)
Goods or services (Average=19%)
Backup

SMART BPD Presentation - Ross Love BCG.pptx 17
Draft—for discussion only
Cop
yrig
ht ©
201
4 by
The
Bos
ton
Con
sulti
ng G
roup
, Inc
. All
right
s re
serv
ed.
Australian super funds have relatively high allocations to infrastructure, particularly in unlisted equity
0
5
10
15
20
25
Ende
sa
Au
stra
lianS
uper
Sust
aina
bilit
y Fu
nd
O
MER
S
GEP
F
C
alPE
RS
Prev
i
AFP
Prov
ida
PFZW
ABP
Ø 0.9 Ø 3.3
CG
D P
ensõ
es
AP
3
Ba
nco
BPI
AFP
Hor
izon
te P
eru
OYA
K
Pe
nsio
n Fu
nd
FA
PES
FUN
CEF
Can
ada
PPI B
oard
PFA
Pens
ion
Imm
arin
en
Afor
e X
XI B
anor
te
Fond
itel
PMT
Pension fund infrastructure investments (% of total assets)
Men
ora-
Miv
tach
im
N
Z Su
per F
und
Que
bec
Pens
ion
Plan
AP4
USS
BT P
ensi
on S
chem
e
OTP
P
Fu
ture
Fun
d
Suns
uper
33 selected funds
69 surveyed funds
Debt Unlisted Equity
Listed Equity
Note: Average infrastructure investments shown include debt and unlisted equity as a % of total assets under management for the 69 funds reflects the average of all funds in the OECD Annual Survey of Large Pension Funds (0.9%). The higher 3.3% figure reflects the weighted average of the 33 funds with any infrastructure allocation. Source: OECD, Annual Survey of Large Pension Funds and Public Pension Reserve Funds, October 2013, BCG analysis.
Backup

Thank you
bcg.com | bcgperspectives.com