smart grid and power quality: bane or boon -...
TRANSCRIPT

ON IT
1
Smart Grid and Power Quality: Bane or Boon
June 30, 2009
PQA/ADA Conference, NY
Arshad Mansoor Vice President, Power Delivery & Utilization
2 Copyright © 2009 Electric Power Research Institute, Inc. All rights reserved. PQA/ADA Conference & Exhibition 2009
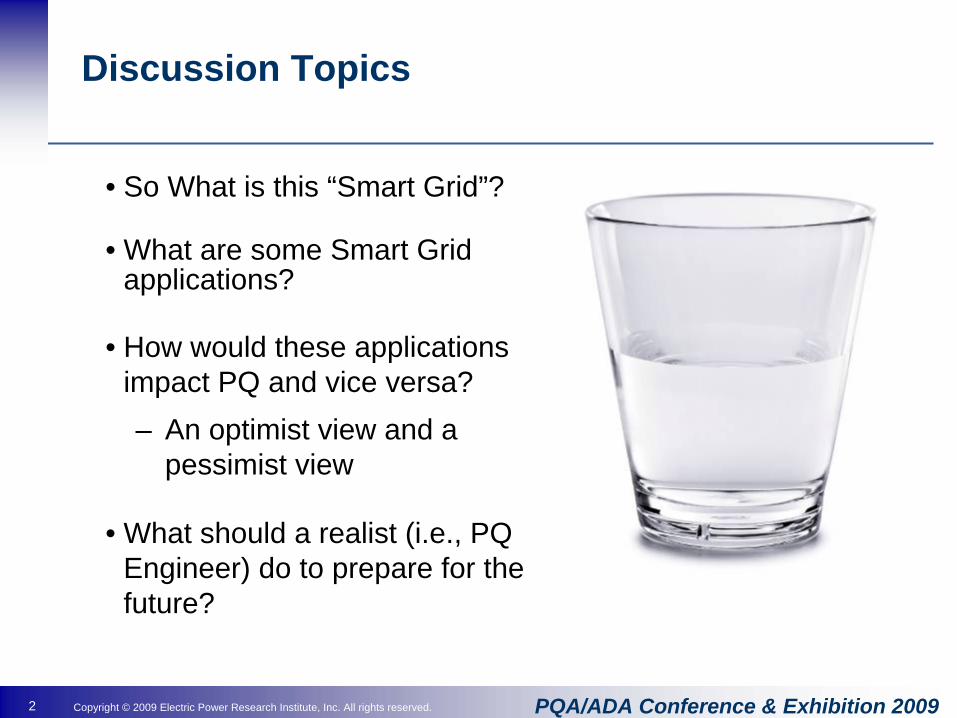
Discussion Topics
• So What is this “Smart Grid”?
• What are some Smart Grid applications?
• How would these applications impact PQ and vice versa? – An optimist view and a
pessimist view
• What should a realist (i.e., PQ Engineer) do to prepare for the future?

3 Copyright © 2009 Electric Power Research Institute, Inc. All rights reserved. PQA/ADA Conference & Exhibition 2009
How to Define “Smart Grid”?
MODERN GRIDS T R A T E G Y
Intelligent Grid Coordination CommitteeFederal SmartGrid Task Force
Many Contributors Have Led to Varied Definitions

4 Copyright © 2009 Electric Power Research Institute, Inc. All rights reserved. PQA/ADA Conference & Exhibition 2009
Highly Instrumented with Advanced
Sensors and Computing
Interconnected by a Communication Fabric
that Reaches Every Device
Engaging ConsumersEnhancing Efficiency & Asset UtilizationEnsuring ReliabilityEnabling Renewables & Electric Transportation
Many Definitions - But One VISION
What is The Smart Grid?
5 Copyright © 2009 Electric Power Research Institute, Inc. All rights reserved. PQA/ADA Conference & Exhibition 2009
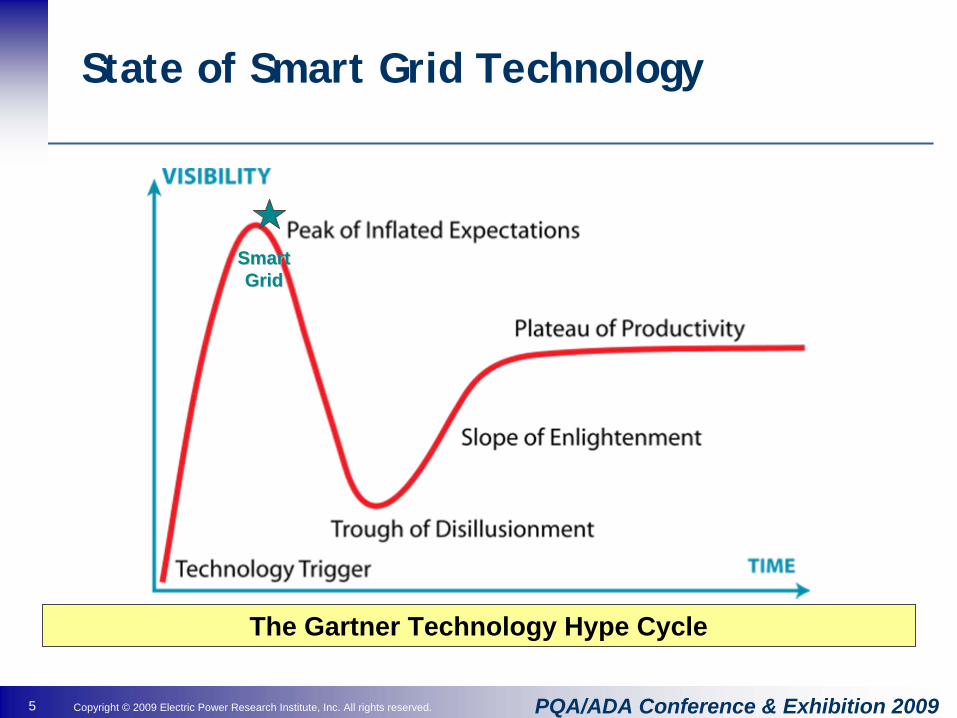
State of Smart Grid Technology
Smart Smart GridGrid
The Gartner Technology Hype Cycle

6 Copyright © 2009 Electric Power Research Institute, Inc. All rights reserved. PQA/ADA Conference & Exhibition 2009
AMI ManagementSystems
WirelessData
Collection
PagingData
Collection
CIS
OMS
WMS
GIS/DPS
Wide AreaNetworks
Meter-SpecificNetworks
Data Collection Systems
Existing UtilitySystems
WebPresentation Regulators and
AgenciesInternet
Public Wireless(Paging,
GPRS, 1XRTT)
TelephoneData
Collection
Smart Meters & Other Devices
Power LineData
Collection
Usage DataRepository
PrivateWireless(WiMAX)
Asset Mgmt
MDM System
Energy Service Provider
CSR
Third Parties
Retailer
Data Exchange
Satellite
BPL
Customer
PSTNPLC/BPL
Mesh RF
Star RF
Advanced Metering Infrastructure

7 Copyright © 2009 Electric Power Research Institute, Inc. All rights reserved. PQA/ADA Conference & Exhibition 2009
Is It a Boon or Bane for PQ?
Optimist View
• Additional sources of data to characterize the system power quality
• Ability to diagnose power quality issues at the extremities of the network
• Improve capability to locate faults
• Use data to assess condition of assets and predict faults
Pessimist View
• Blinded by data
• Proliferation of sensitive electronic loads (Smart Meter = Computer)
• Increasing customer complaints related to Electromagnetic Interference (EMI) from power line carriers
• Added grid complexity = (usually) increased PQ phenomena

8 Copyright © 2009 Electric Power Research Institute, Inc. All rights reserved. PQA/ADA Conference & Exhibition 2009
Distribution Efficiency and Peak Demand Reduction
SectionalizersDistributed Regulators
Substation Regulators
Capacitor Banks
Communication Network
Advanced Distribution Optimization
RealtimeMetering
SectionalizersDistributed Regulators
Substation Regulators
Capacitor Banks
Communication Network
Advanced Distribution Optimization
RealtimeMetering
Progress Energy (Carolinas) Distribution System Demand Response (DSDR) Program Filing
Reduce peak demand - 247MW
Program Cost
O&M: $30.6M
Capital: $229.4M, 5 Years
Volt/Var Devices & Communication & Control Sensors Enabling Feeder Voltage Optimization

9 Copyright © 2009 Electric Power Research Institute, Inc. All rights reserved. PQA/ADA Conference & Exhibition 2009
Is It a Boon or Bane for PQ?
Optimist View
• Reduce voltage fluctuation
• Longer equipment life
• Reduce losses
• Reduce peak demand
• Reduce reactive var requirements
Pessimist View
• More customer complaints due to reduced voltage
• Increased susceptibility to voltage sags
• Increase losses
• Increase reactive var requirements
10 Copyright © 2009 Electric Power Research Institute, Inc. All rights reserved. PQA/ADA Conference & Exhibition 2009
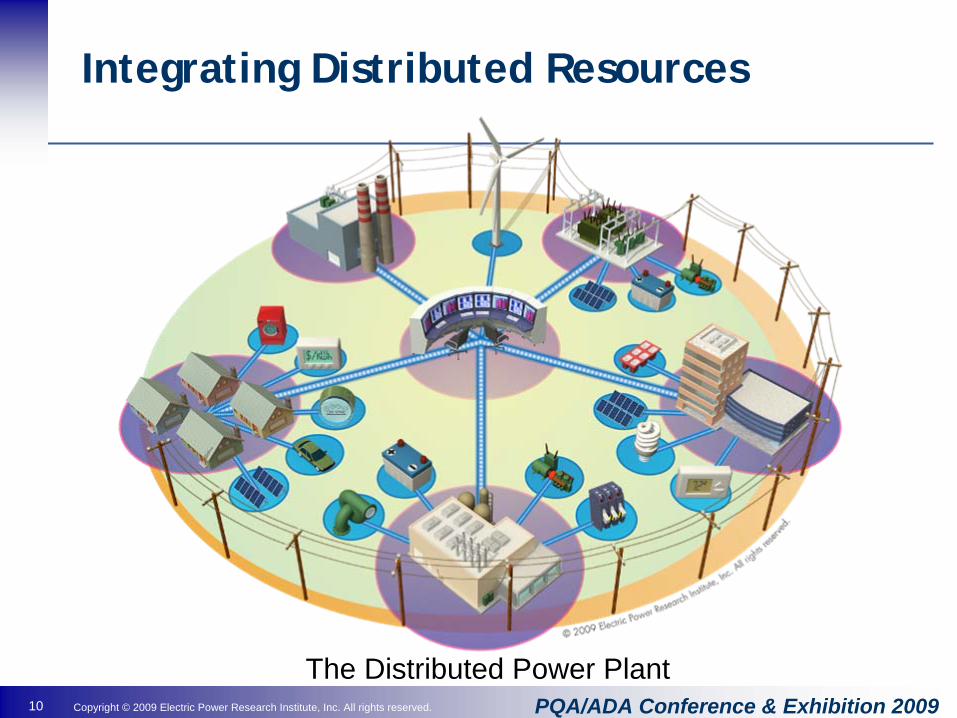
Integrating Distributed Resources
The Distributed Power Plant
11 Copyright © 2009 Electric Power Research Institute, Inc. All rights reserved. PQA/ADA Conference & Exhibition 2009
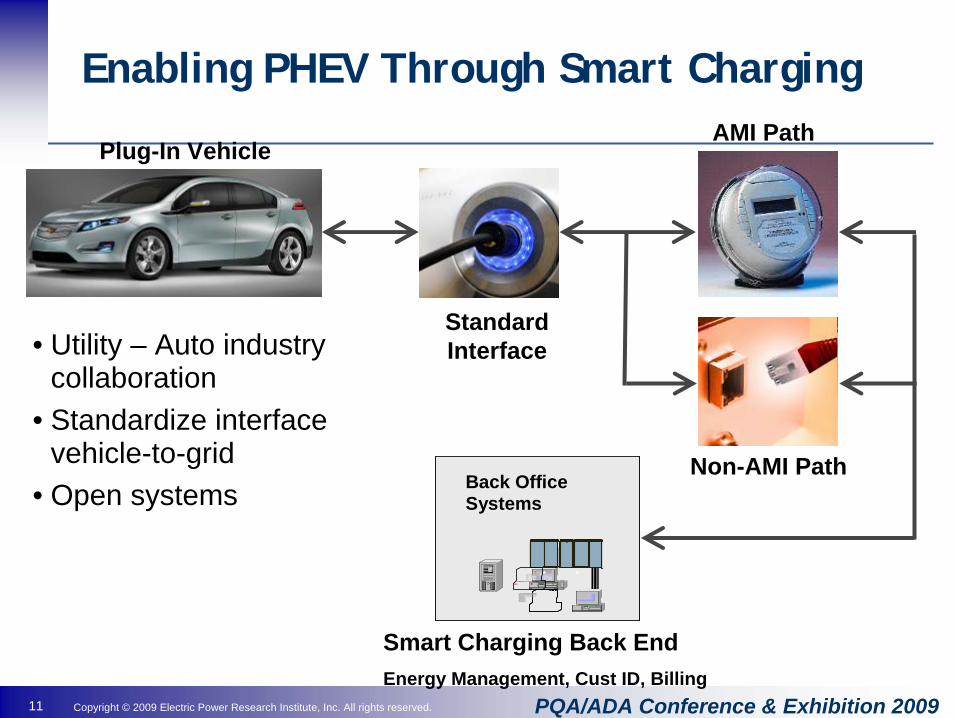
Enabling PHEV Through Smart Charging
MainframeMainframeMainframe
Back Office Systems
MainframeMainframeMainframeMainframeMainframeMainframe
Back Office Systems
Plug-In VehicleAMI Path
Smart Charging Back EndEnergy Management, Cust ID, Billing
Non-AMI Path
Standard Interface• Utility – Auto industry
collaboration• Standardize interface
vehicle-to-grid• Open systems
12 Copyright © 2009 Electric Power Research Institute, Inc. All rights reserved. PQA/ADA Conference & Exhibition 2009
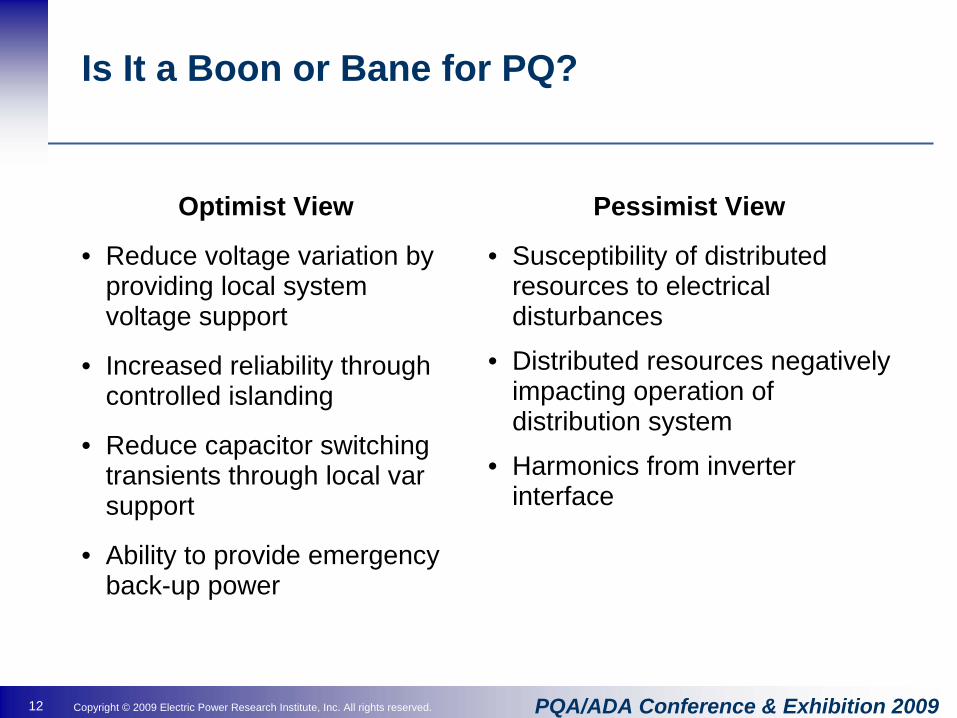
Is It a Boon or Bane for PQ?
Optimist View
• Reduce voltage variation by providing local system voltage support
• Increased reliability through controlled islanding
• Reduce capacitor switching transients through local var support
• Ability to provide emergency back-up power
Pessimist View
• Susceptibility of distributed resources to electrical disturbances
• Distributed resources negatively impacting operation of distribution system
• Harmonics from inverter interface

13 Copyright © 2009 Electric Power Research Institute, Inc. All rights reserved. PQA/ADA Conference & Exhibition 2009
What Should a Realist (i.e., PQ Engineer) Do?
• Get ready for the future through research, development and demonstration (RD&D)– Characterize the immunity and susceptibility of smart meters, PHEV
and other smart grid technologies (remember system compatibility??)
– Educate industry on PQDIF and how large amount of data can be managed to generation actionable information
– Characterize the voltage dependency of end-use loads and develop load modes
– Demonstrate active distribution management to minimize PQ impact of distributed generation and use DG as a system resource
– Realize that added system complexity could negatively impact PQ and do our best to study and mitigate these effects proactively
Together, We Can Turn Challenges into Opportunities

Trending Network Power Quality & Reliability
Peter HofmannConsolidated EdisonJune 30, 2009
EPRI Power Quality Applications (PQA) and Advanced Distribution Automation (ADA)
2009 Conference and Exhibition
2 Copyright © 2009 Electric Power Research Institute, Inc. All rights reserved. PQA/ADA Conference & Exhibition 2009
•Con Edison System Overview•Reliability and Power Quality Programs•Data & Analysis Tools•Power Quality and Reliability Trends•Looking Forward
Trending Network Power Quality & Reliability

3 Copyright © 2009 Electric Power Research Institute, Inc. All rights reserved. PQA/ADA Conference & Exhibition 2009
Trending Network Power Quality & Reliability
System Overview
NY StateArea 47,214 sq mi
Peak Demand 33,939 MW
Load Density 0.72 MW/sq mi
Con EdisonArea 604 sq mi
Peak Demand 13,141 MW
Load Density 21.8 MW/sq mi
ManhattanArea 23 sq mi
Peak Demand 5405 MW
Load Density 235 MW/sq mi
4 Copyright © 2009 Electric Power Research Institute, Inc. All rights reserved. PQA/ADA Conference & Exhibition 2009
Trending Network Power Quality & Reliability
27,13, 4 kV
13 kV
27, 4 kV
33,13, 4 kV
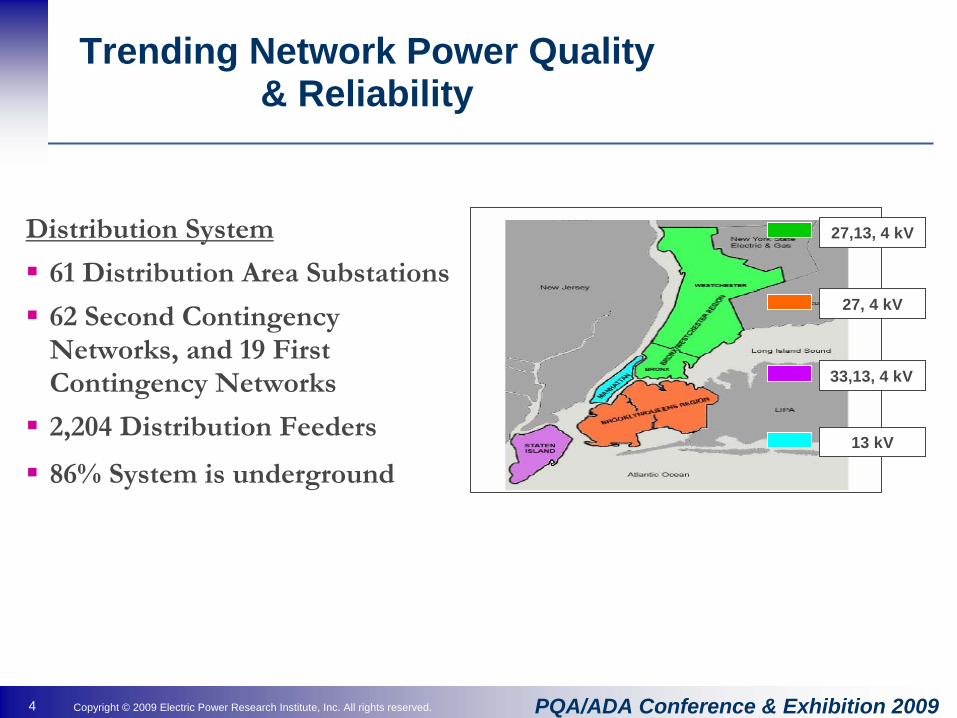
Distribution System
61 Distribution Area Substations
62 Second Contingency Networks, and 19 First Contingency Networks
2,204 Distribution Feeders
86% System is underground
5 Copyright © 2009 Electric Power Research Institute, Inc. All rights reserved. PQA/ADA Conference & Exhibition 2009
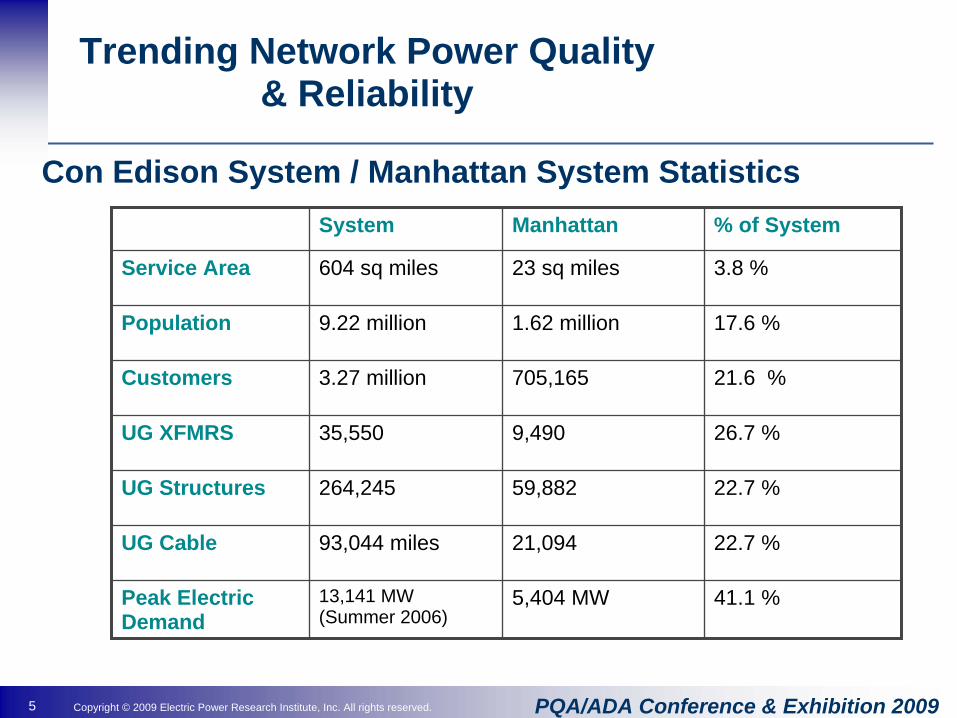
Trending Network Power Quality & Reliability
Con Edison System / Manhattan System StatisticsSystem Manhattan % of System
Service Area 604 sq miles 23 sq miles 3.8 %
Population 9.22 million 1.62 million 17.6 %
Customers 3.27 million 705,165 21.6 %
UG XFMRS 35,550 9,490 26.7 %
UG Structures 264,245 59,882 22.7 %
UG Cable 93,044 miles 21,094 22.7 %
Peak Electric Demand
13,141 MW (Summer 2006)
5,404 MW 41.1 %
6 Copyright © 2009 Electric Power Research Institute, Inc. All rights reserved. PQA/ADA Conference & Exhibition 2009
Trending Network Power Quality & Reliability
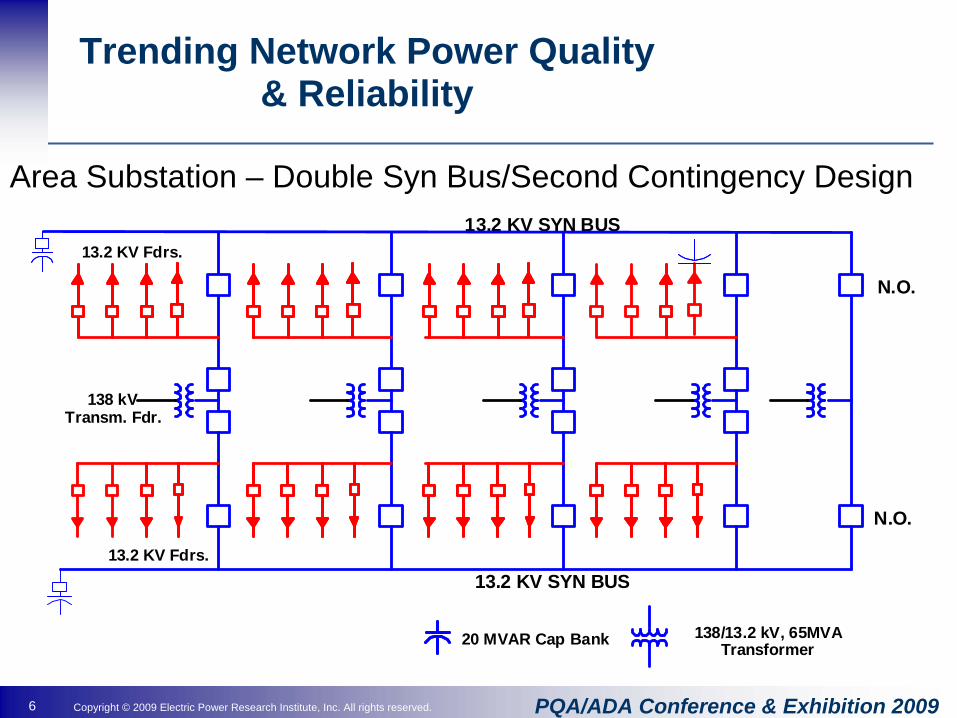
Area Substation – Double Syn Bus/Second Contingency Design
13.2 KV SYN BUS
20 MVAR Cap Bank 138/13.2 kV, 65MVATransformer
N.O.
N.O.
13.2 KV SYN BUS13.2 KV Fdrs.
13.2 KV Fdrs.
138 kVTransm. Fdr.

7 Copyright © 2009 Electric Power Research Institute, Inc. All rights reserved. PQA/ADA Conference & Exhibition 2009
Trending Network Power Quality & Reliability
Area Substation – Network Feeder Interconnection
13.2 KV Feeders to multi- bank spot
network installationsand distributed network
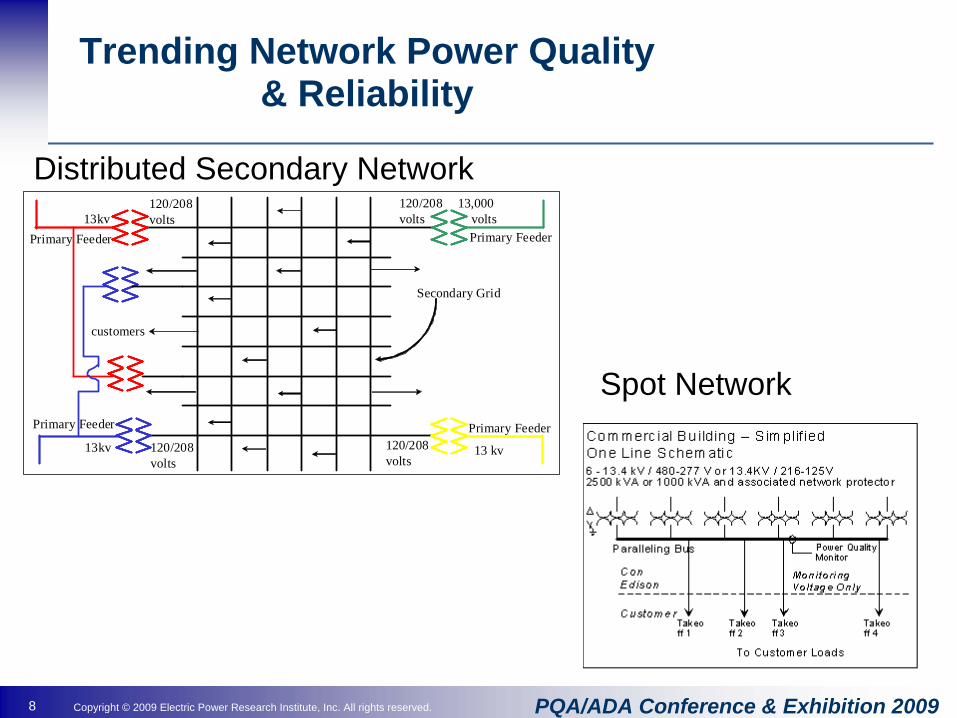
8 Copyright © 2009 Electric Power Research Institute, Inc. All rights reserved. PQA/ADA Conference & Exhibition 2009
13,000voltsPrimary Feeder
120/208volts
Primary Feeder120/208volts
13 kv13kv
13kv120/208volts
120/208volts
Primary Feeder
Primary Feeder
Secondary Grid
customers
Trending Network Power Quality & Reliability
Distributed Secondary Network
Spot Network
9 Copyright © 2009 Electric Power Research Institute, Inc. All rights reserved. PQA/ADA Conference & Exhibition 2009
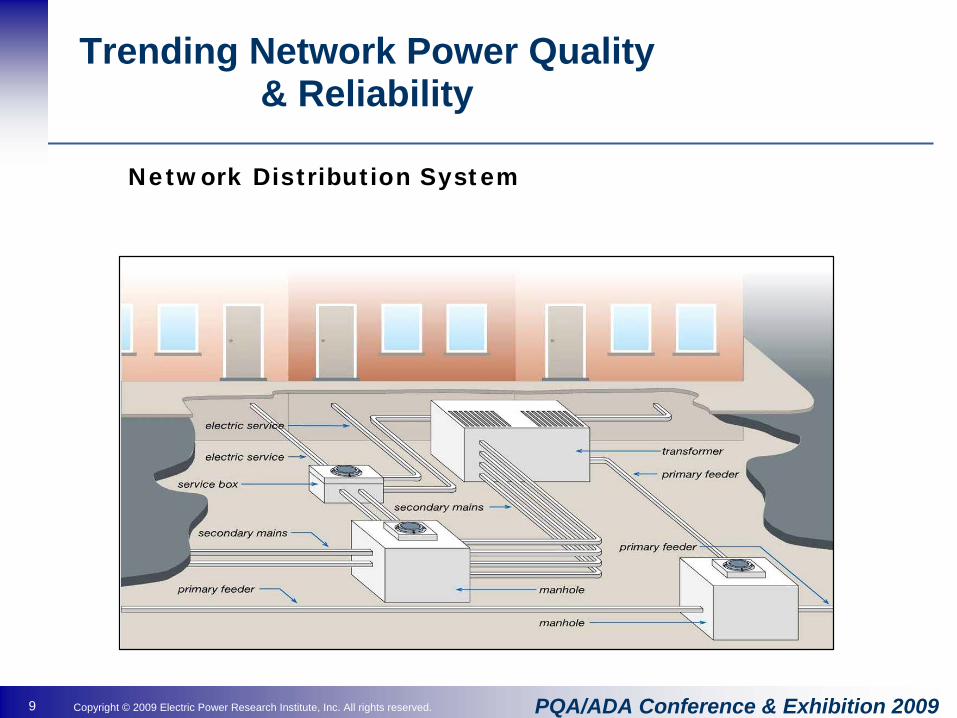
Trending Network Power Quality & Reliability
Network Distribution System
10 Copyright © 2009 Electric Power Research Institute, Inc. All rights reserved. PQA/ADA Conference & Exhibition 2009
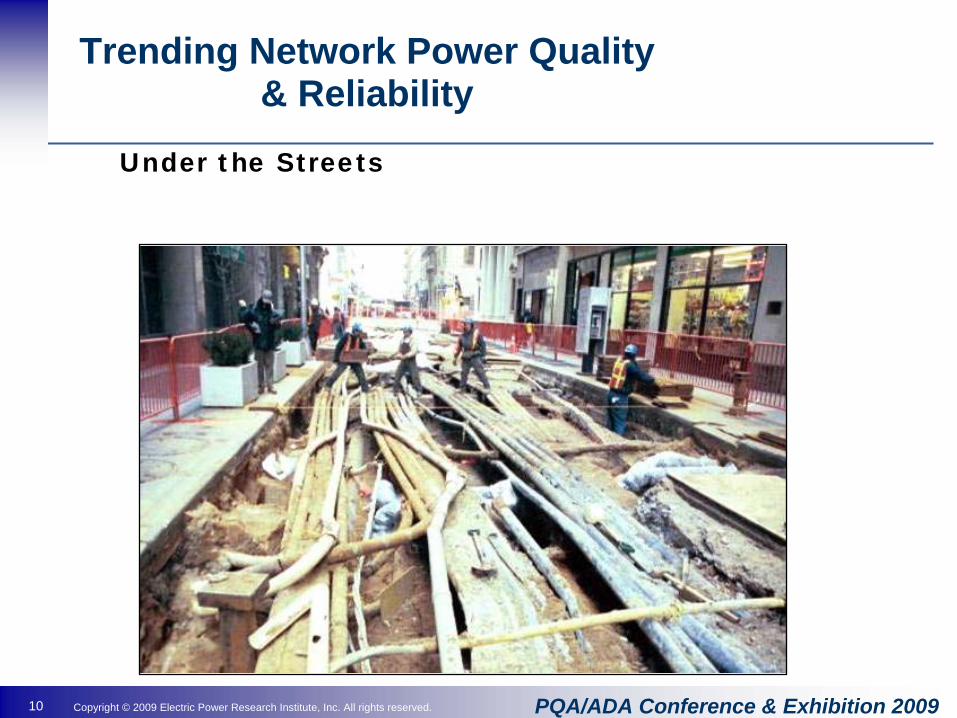
Trending Network Power Quality & Reliability
Under the Streets

11 Copyright © 2009 Electric Power Research Institute, Inc. All rights reserved. PQA/ADA Conference & Exhibition 2009
• Area Substations– Double Syn Bus Design– High Available Short Circuit Current– High Side Circuit Switchers– Capacitors (10 MVAR, 20MVAR and 30MVAR banks)– Neutral Reactor
• Network – Transformers
• Integrated Ground Switch; no disconnect capability• Delta – Wye configuration• Advanced Remote Monitoring Capability
Trending Network Power Quality & Reliability
Some Network Design & Operational Features
12 Copyright © 2009 Electric Power Research Institute, Inc. All rights reserved. PQA/ADA Conference & Exhibition 2009
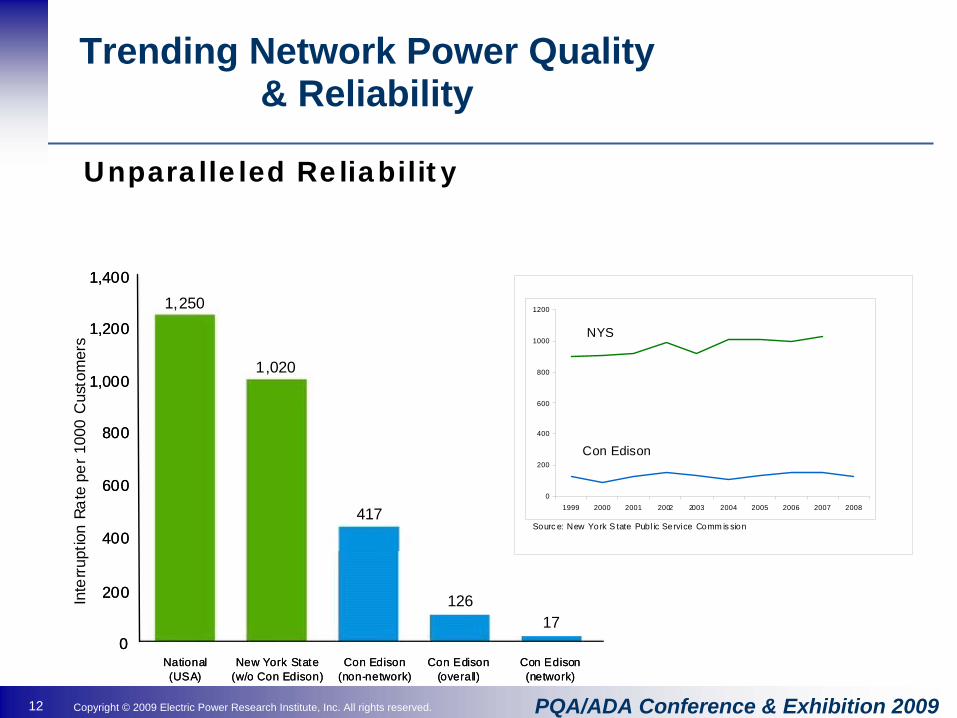
Trending Network Power Quality & Reliability
417
12617
1,400
1,000
200
0
800
600
400
1,250
1,020
National(USA)
New York State(w/o Con Edison)
Con Edison(non-network)
Con Edison(overall)
Con Edison(network)
1,200
417
12617
1,400
1,000
200
0
800
600
400
1,250
1,020
National(USA)
New York State(w/o Con Edison)
Con Edison(non-network)
Con Edison(overall)
Con Edison(network)
1,200
0
200
400
600
800
1000
1200
1999 2000 2001 2002 2003 2004 2005 2006 2007 2008
Unparalleled Reliability
Sourc e: New York S tate Publ ic Service Comm is sion
NYS
Con Edison
Inte
rrupt
ion
Rate
per
100
0 C
usto
mer
s
13 Copyright © 2009 Electric Power Research Institute, Inc. All rights reserved. PQA/ADA Conference & Exhibition 2009
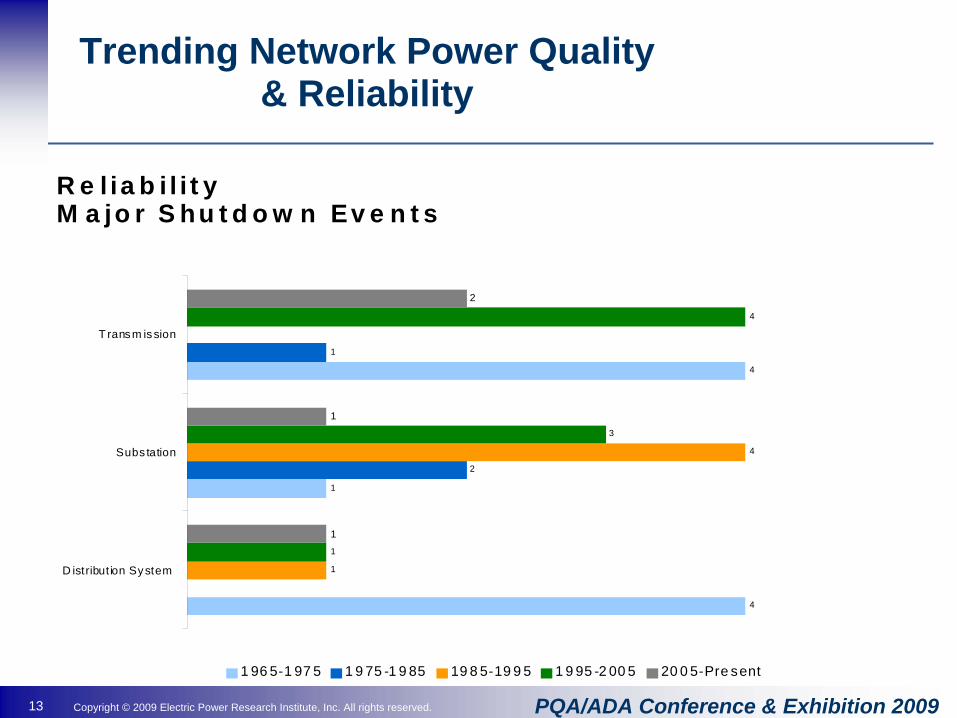
Trending Network Power Quality & Reliability
ReliabilityM ajor Shutdown Events
4
1
4
2
1
1
4
1
3
4
1
1
2
0 0.5 1 1.5 2 2.5 3 3.5 4 4.5
D istribut ion System
Subs tation
T ransm ission
1 96 5-1 97 5 1 9 75 -1 9 85 19 8 5-19 9 5 1 9 95 -2 00 5 20 0 5-Pre sent
14 Copyright © 2009 Electric Power Research Institute, Inc. All rights reserved. PQA/ADA Conference & Exhibition 2009
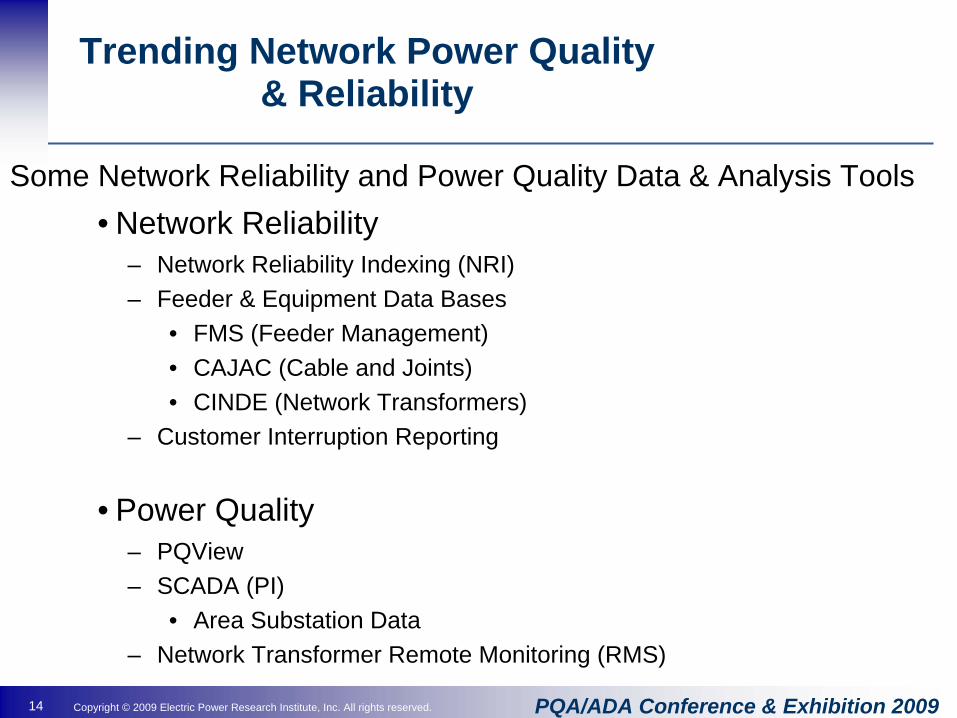
• Network Reliability– Network Reliability Indexing (NRI)– Feeder & Equipment Data Bases
• FMS (Feeder Management)• CAJAC (Cable and Joints)• CINDE (Network Transformers)
– Customer Interruption Reporting
• Power Quality– PQView– SCADA (PI)
• Area Substation Data– Network Transformer Remote Monitoring (RMS)
Trending Network Power Quality & Reliability
Some Network Reliability and Power Quality Data & Analysis Tools
15 Copyright © 2009 Electric Power Research Institute, Inc. All rights reserved. PQA/ADA Conference & Exhibition 2009
• Power Quality Service Center – 1993
• Cable & Splice Center of Excellence - 2003
• Distribution Engineering Equipment Analysis Center - 2007
Trending Network Power Quality & Reliability
Network Reliability and Power Quality Resources
16 Copyright © 2009 Electric Power Research Institute, Inc. All rights reserved. PQA/ADA Conference & Exhibition 2009
Trending Network Power Quality & Reliability
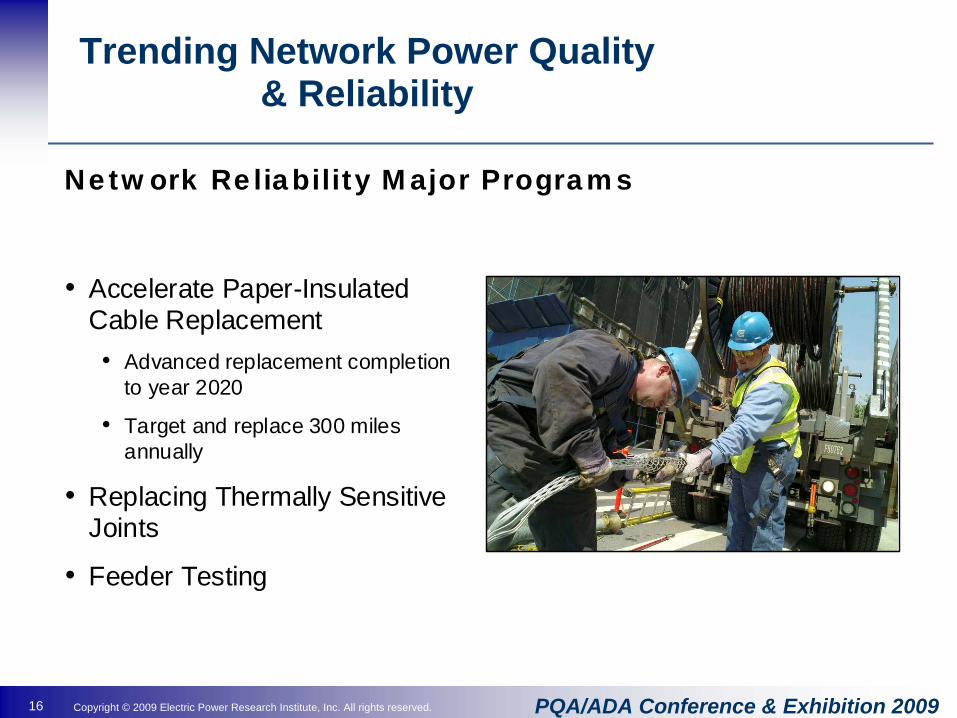
Network Reliability Major Programs
• Accelerate Paper-Insulated Cable Replacement• Advanced replacement completion
to year 2020
• Target and replace 300 miles annually
• Replacing Thermally Sensitive Joints
• Feeder Testing
17 Copyright © 2009 Electric Power Research Institute, Inc. All rights reserved. PQA/ADA Conference & Exhibition 2009
Trending Network Power Quality & Reliability
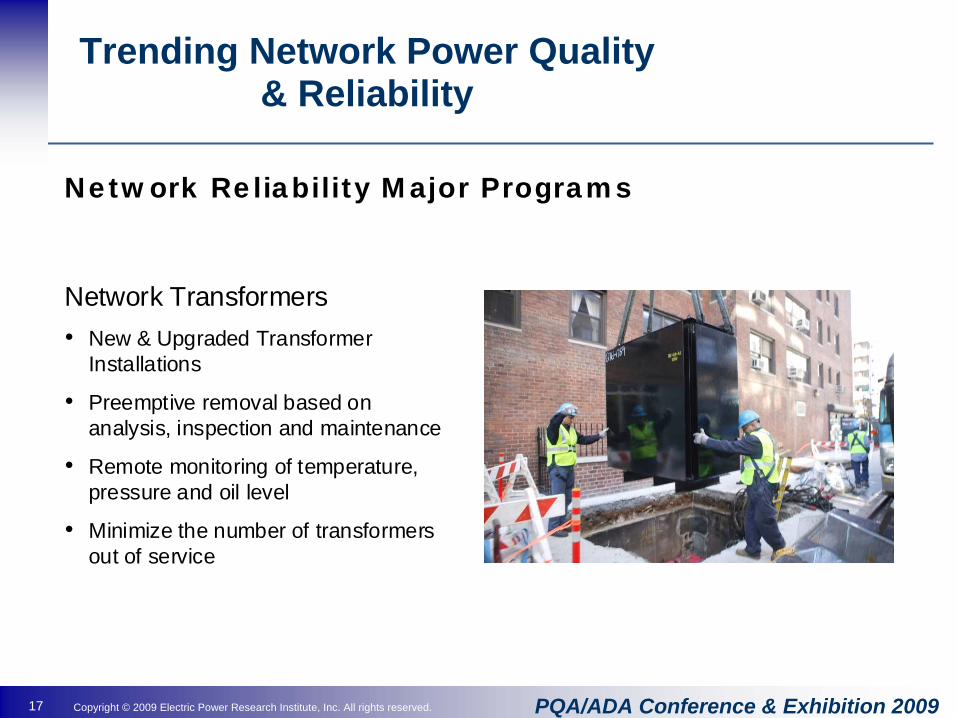
Network Reliability Major Programs
Network Transformers• New & Upgraded Transformer
Installations
• Preemptive removal based on analysis, inspection and maintenance
• Remote monitoring of temperature, pressure and oil level
• Minimize the number of transformers out of service

18 Copyright © 2009 Electric Power Research Institute, Inc. All rights reserved. PQA/ADA Conference & Exhibition 2009
Trending Network Power Quality & Reliability
Network Reliability Major Programs
HARLEM
CENTRALPARK
BRONX
WASHINGTONH EIG HTS
YORKVILLE
TRIBORO
Create New Feeders• Utilize existing spare feeder positions
in substations
• Improve rapid isolation of faulted segments on feeders
• Add approximately 100 new feeders
Long-term: Split Large Networks• When load is transferred or new
substations are constructed: split large networks
• Four (4) networks will be reduced in size from load transfers when new area substations are built (2009 –2017)
19 Copyright © 2009 Electric Power Research Institute, Inc. All rights reserved. PQA/ADA Conference & Exhibition 2009
Trending Network Power Quality & Reliability
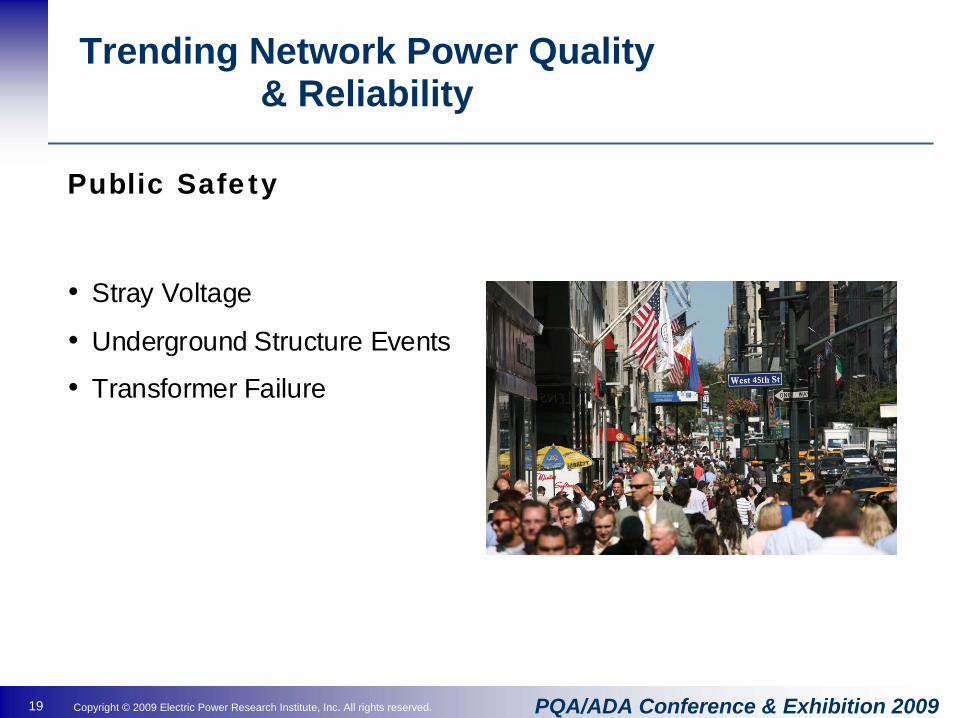
Public Safety
• Stray Voltage
• Underground Structure Events
• Transformer Failure
20 Copyright © 2009 Electric Power Research Institute, Inc. All rights reserved. PQA/ADA Conference & Exhibition 2009
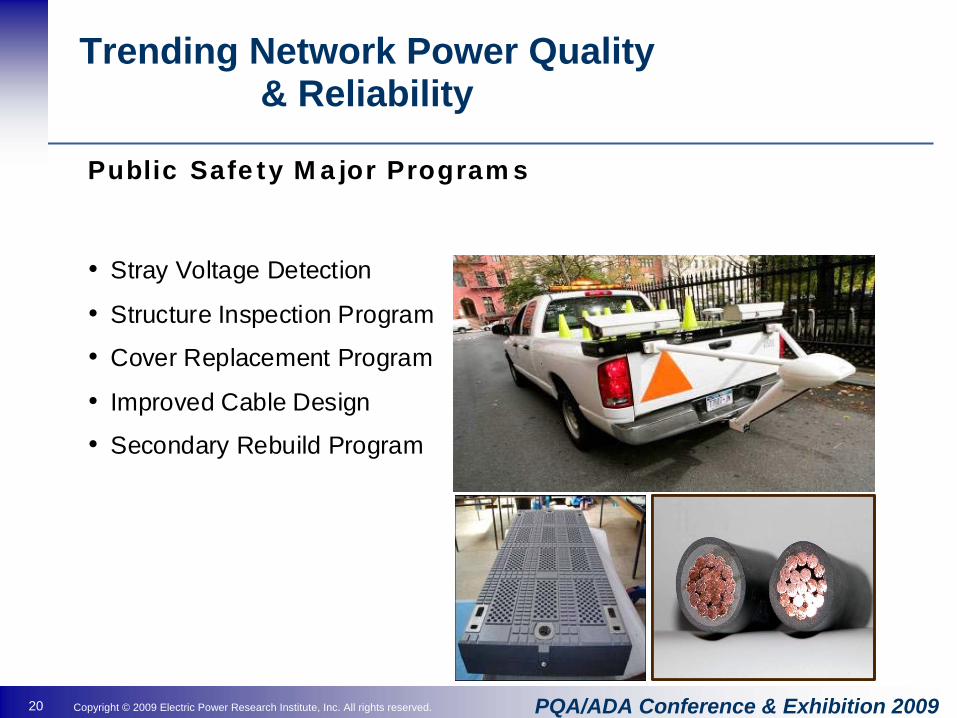
Trending Network Power Quality & Reliability
Public Safety Major Programs
• Stray Voltage Detection
• Structure Inspection Program
• Cover Replacement Program
• Improved Cable Design
• Secondary Rebuild Program
21 Copyright © 2009 Electric Power Research Institute, Inc. All rights reserved. PQA/ADA Conference & Exhibition 2009
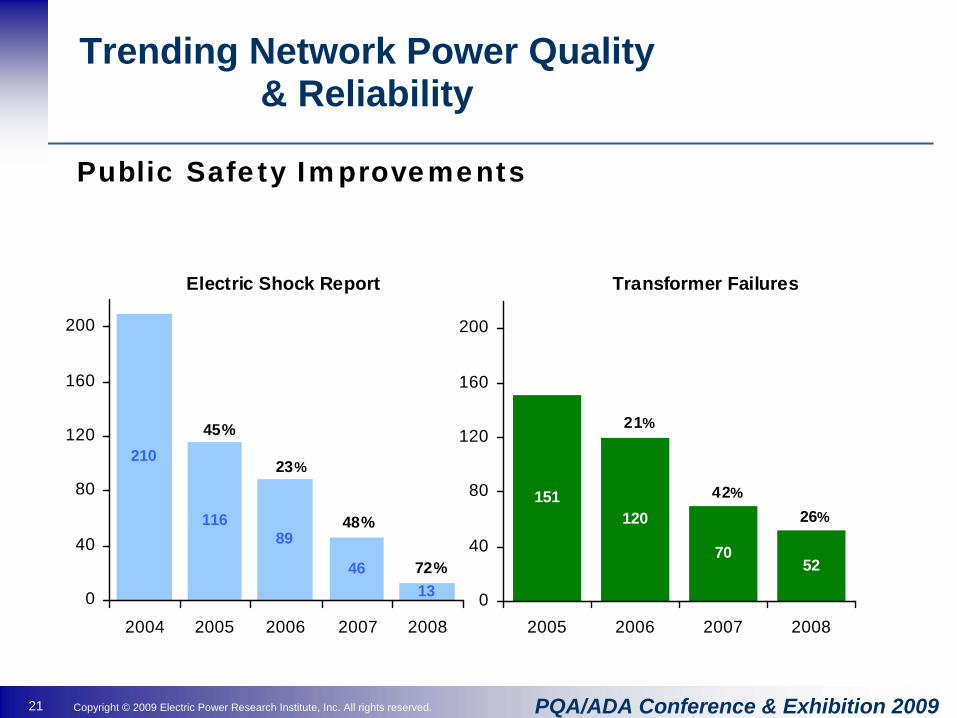
Trending Network Power Quality & Reliability
Electric Shock Reports
151120
7052
0
40
80
120
160
200
2005 2006 2007 2008
Electric Shock Reports
210
11689
46130
40
80
120
160
200
2004 2005 2006 2007 2008
Public Safety Improvements
Transformer FailuresElectric Shock Report
45%
23%
48%
21%
42%
72%
26%
22 Copyright © 2009 Electric Power Research Institute, Inc. All rights reserved. PQA/ADA Conference & Exhibition 2009
Trending Network Power Quality & Reliability
Electric Shock Reports
2494 24602033 2139
1348
0
500
1000
1500
2000
2500
2 004 2005 2006 2007 2008
Public Safety Improvements
Underground Structure Events

23 Copyright © 2009 Electric Power Research Institute, Inc. All rights reserved. PQA/ADA Conference & Exhibition 2009
Trending Network Power Quality & Reliability
Network Distribution Transformer – Internal Failure Trending
24 Copyright © 2009 Electric Power Research Institute, Inc. All rights reserved. PQA/ADA Conference & Exhibition 2009
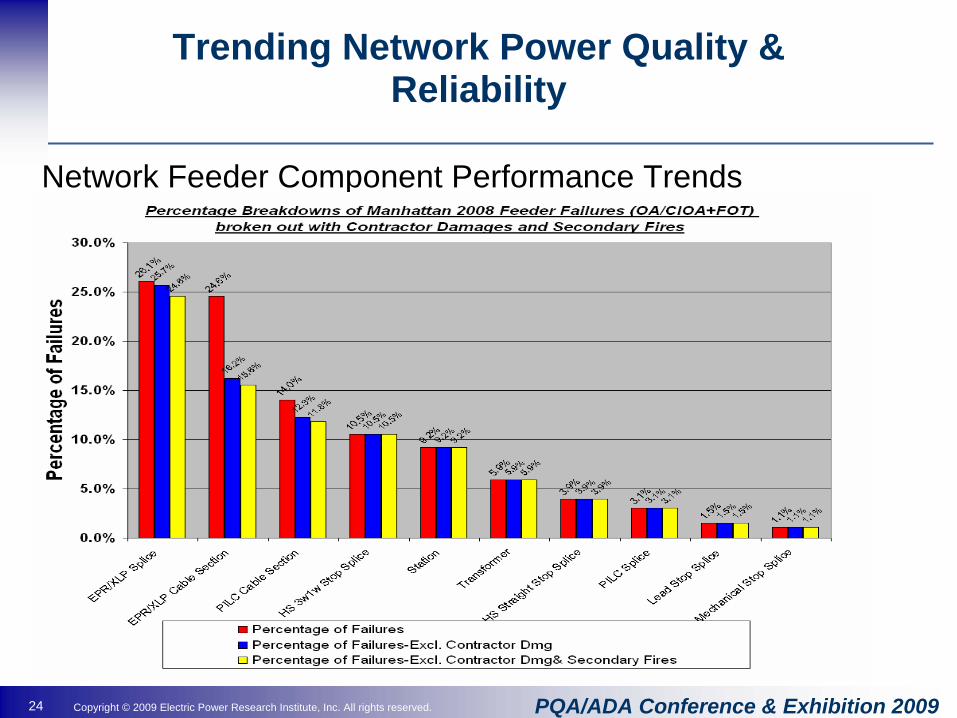
Trending Network Power Quality & Reliability
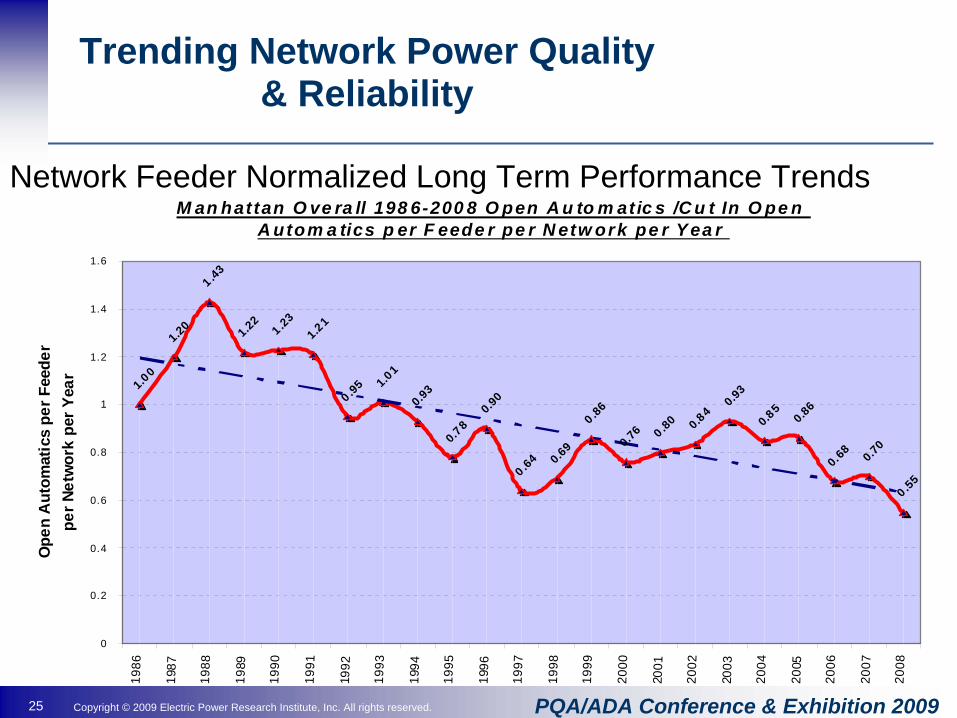
Network Feeder Component Performance Trends
25 Copyright © 2009 Electric Power Research Institute, Inc. All rights reserved. PQA/ADA Conference & Exhibition 2009
M an hattan O ve ra ll 198 6-200 8 O pen A u to m atic s /C u t In O pe n A utom a tics p er F eede r pe r N etw ork pe r Y ea r
1.00
1.20
1 .43
1.22
1 .23
1.21
0 .95 1.01
0.93
0.78
0.90
0 .64 0.69
0 .86
0.76 0 .80 0.84
0.93
0.85
0.86
0.68 0.70
0 .55
0
0.2
0.4
0.6
0.8
1
1.2
1.4
1.6
1986
1987
198 8
1989
1990
1991
1992
1993
1994
1995
1996
1997
1998
1999
2000
2001
2002
2003
2004
2005
2006
200 7
2008
Ope
n A
utom
atic
s pe
r Fee
der
per N
etw
ork
per Y
ear
Trending Network Power Quality & Reliability
Network Feeder Normalized Long Term Performance Trends

26 Copyright © 2009 Electric Power Research Institute, Inc. All rights reserved. PQA/ADA Conference & Exhibition 2009
Trending Network Power Quality & Reliability
• Increased Utilization of the “modified” high potential test for feeder serviceability – Reduce occurrence of “Cut In Open Automatics – CIOA”
• Increased focus on network feeder processing and restoration times during high load periods– Maintain balanced loading among feeders and prevent potential
cascading failures
Operational Enhancements to Improve Power Quality and Reliability
27 Copyright © 2009 Electric Power Research Institute, Inc. All rights reserved. PQA/ADA Conference & Exhibition 2009
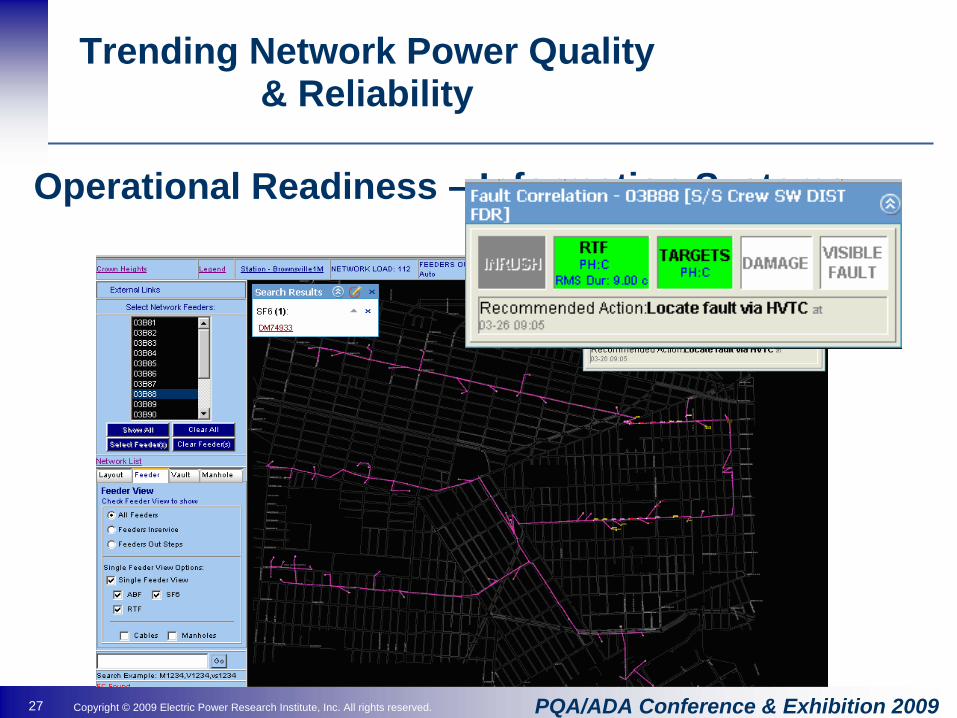
Operational Readiness – Information Systems
Trending Network Power Quality & Reliability
28 Copyright © 2009 Electric Power Research Institute, Inc. All rights reserved. PQA/ADA Conference & Exhibition 2009
Trending Network Power Quality & Reliability
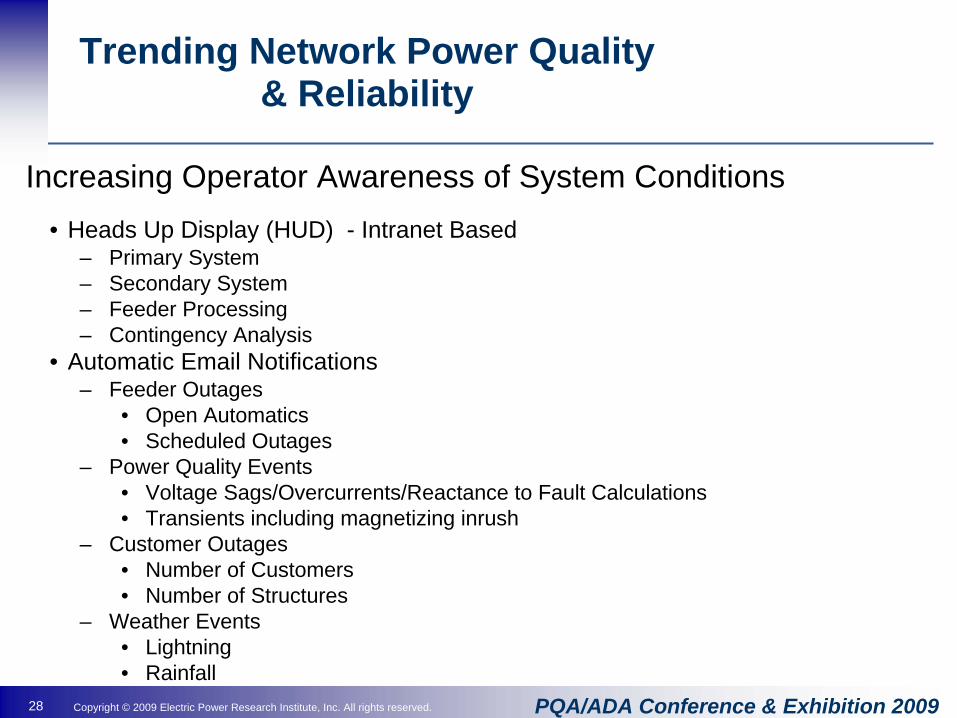
• Heads Up Display (HUD) - Intranet Based– Primary System– Secondary System– Feeder Processing– Contingency Analysis
• Automatic Email Notifications– Feeder Outages
• Open Automatics• Scheduled Outages
– Power Quality Events• Voltage Sags/Overcurrents/Reactance to Fault Calculations• Transients including magnetizing inrush
– Customer Outages• Number of Customers• Number of Structures
– Weather Events• Lightning• Rainfall
Increasing Operator Awareness of System Conditions
29 Copyright © 2009 Electric Power Research Institute, Inc. All rights reserved. PQA/ADA Conference & Exhibition 2009
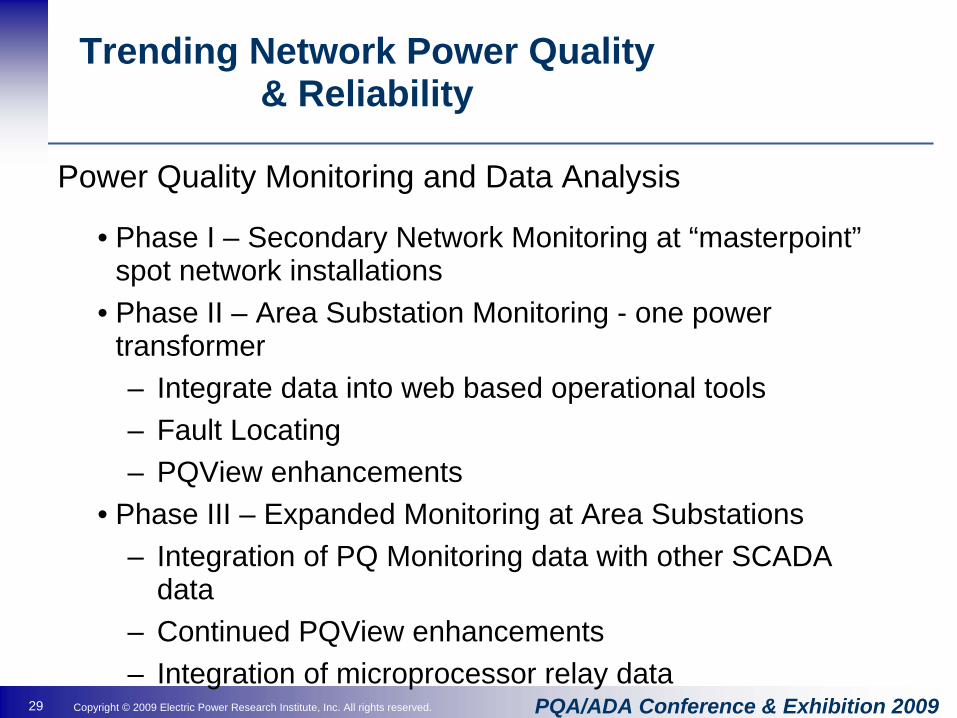
• Phase I – Secondary Network Monitoring at “masterpoint” spot network installations
• Phase II – Area Substation Monitoring - one power transformer– Integrate data into web based operational tools– Fault Locating– PQView enhancements
• Phase III – Expanded Monitoring at Area Substations– Integration of PQ Monitoring data with other SCADA
data– Continued PQView enhancements– Integration of microprocessor relay data
Trending Network Power Quality & Reliability
Power Quality Monitoring and Data Analysis

30 Copyright © 2009 Electric Power Research Institute, Inc. All rights reserved. PQA/ADA Conference & Exhibition 2009
Trending Network Power Quality & Reliability
Phase I – Secondary Network Monitoring at “masterpoint” spot network installations

31 Copyright © 2009 Electric Power Research Institute, Inc. All rights reserved. PQA/ADA Conference & Exhibition 2009
Trending Network Power Quality & Reliability
Phase II – Area Substation Monitoring - one power transformer
32 Copyright © 2009 Electric Power Research Institute, Inc. All rights reserved. PQA/ADA Conference & Exhibition 2009
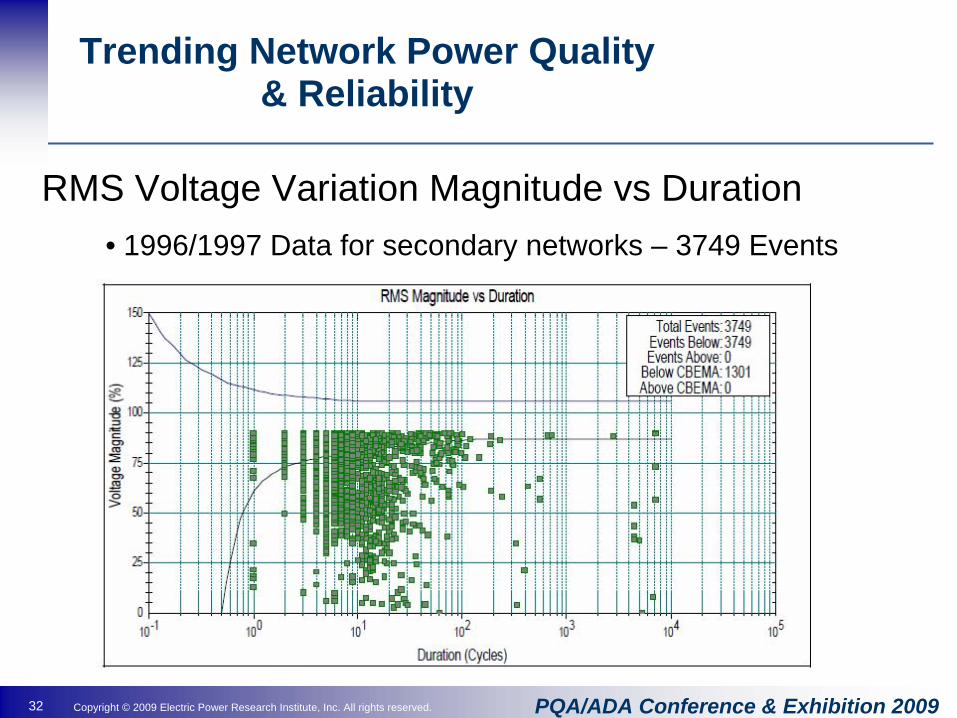
Trending Network Power Quality & Reliability
RMS Voltage Variation Magnitude vs Duration• 1996/1997 Data for secondary networks – 3749 Events
33 Copyright © 2009 Electric Power Research Institute, Inc. All rights reserved. PQA/ADA Conference & Exhibition 2009
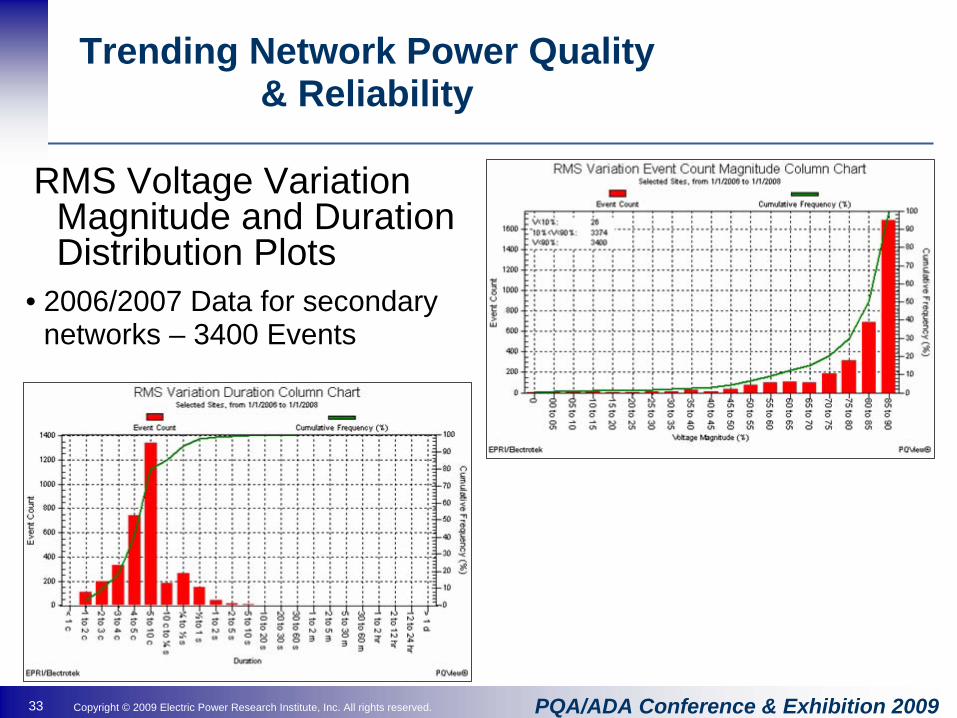
Trending Network Power Quality & Reliability
RMS Voltage Variation Magnitude and Duration Distribution Plots
• 2006/2007 Data for secondary networks – 3400 Events

34 Copyright © 2009 Electric Power Research Institute, Inc. All rights reserved. PQA/ADA Conference & Exhibition 2009
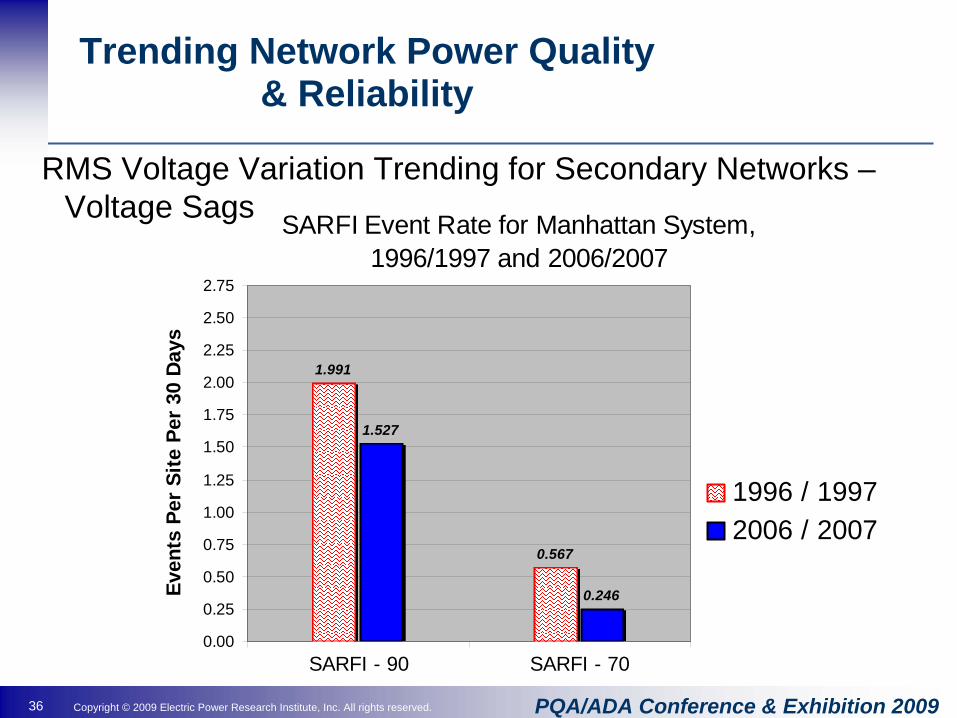
• System Average RMS (Variation) Frequency Index– SARFI - 90– SARFI - 70
• Average frequency of specified RMS variations per site
RMS Voltage Variation Trending for Secondary Networks – Voltage Sags
SARFIN
Nxi
T= ∑
Trending Network Power Quality & Reliability

35 Copyright © 2009 Electric Power Research Institute, Inc. All rights reserved. PQA/ADA Conference & Exhibition 2009
SARFI Event Rate for Con Edison System, 1996/1997 and 2006/2007
2.485
0.576
2.271
0.338
0.00
0.25
0.50
0.75
1.00
1.25
1.50
1.75
2.00
2.25
2.50
2.75
SARFI - 90 SARFI - 70
Even
ts P
er S
ite P
er 3
0 D
ays
1996 / 19972006 / 2007
Trending Network Power Quality & Reliability
RMS Voltage Variation Trending for Secondary Networks – Voltage Sags
36 Copyright © 2009 Electric Power Research Institute, Inc. All rights reserved. PQA/ADA Conference & Exhibition 2009
SARFI Event Rate for Manhattan System, 1996/1997 and 2006/2007
1.991
0.567
1.527
0.246
0.00
0.25
0.50
0.75
1.00
1.25
1.50
1.75
2.00
2.25
2.50
2.75
SARFI - 90 SARFI - 70
Even
ts P
er S
ite P
er 3
0 D
ays
1996 / 19972006 / 2007
Trending Network Power Quality & Reliability
RMS Voltage Variation Trending for Secondary Networks – Voltage Sags
37 Copyright © 2009 Electric Power Research Institute, Inc. All rights reserved. PQA/ADA Conference & Exhibition 2009
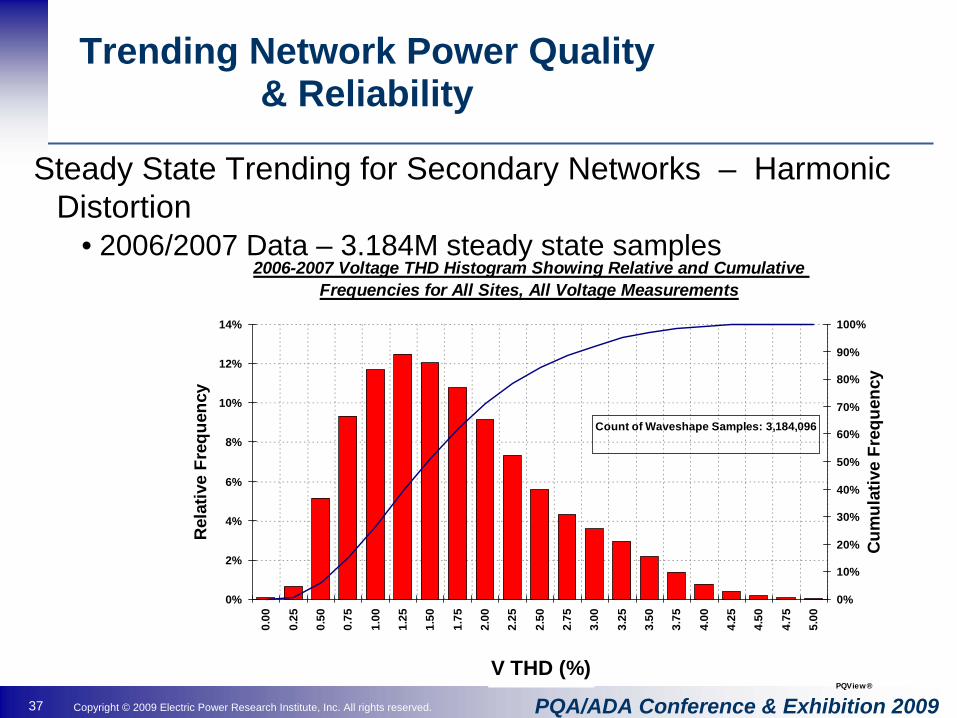
Trending Network Power Quality & Reliability
2006-2007 Voltage THD Histogram Showing Relative and Cumulative Frequencies for All Sites, All Voltage Measurements
0%
2%
4%
6%
8%
10%
12%
14%
0.00
0.25
0.50
0.75
1.00
1.25
1.50
1.75
2.00
2.25
2.50
2.75
3.00
3.25
3.50
3.75
4.00
4.25
4.50
4.75
5.00
V THD (%)
Rel
ativ
e Fr
eque
ncy
0%
10%
20%
30%
40%
50%
60%
70%
80%
90%
100%
Count of Waveshape Samples: 3,184,096
Cum
ulat
ive
Freq
uenc
y
PQView®
Steady State Trending for Secondary Networks – Harmonic Distortion
• 2006/2007 Data – 3.184M steady state samples

38 Copyright © 2009 Electric Power Research Institute, Inc. All rights reserved. PQA/ADA Conference & Exhibition 2009
• System Voltage Harmonic Distortion Mean, CP95 and CP99 Indices– System Average Total Harmonic Distortion – SATHD
• Weighted average of individual circuit segment voltage THD mean values
– System Total Harmonic Distortion CP95 - STHD95– System Total Harmonic Distortion CP99 - STHD99
• CP95 and CP99 value of weighted distribution of individual circuit segment voltage THD CP95 and CP99 values
SATHDL MEANTHD
L
s ss
k
T=
⋅=∑
1 MEANTHDTHD
Ns
ii
N
mw
mw
= =∑
1
f CP L
f CP L
t s sSTHD
t s s
( )
( ).
95
950 95
95×
×=−∞
−∞
∞
∑
∑
f x
f x
s i
CP
s i
s
( )
( ).−∞
−∞
∞
∑
∑=
95
0 95
Trending Network Power Quality & Reliability
Steady State Trending for Secondary Networks – Harmonic Distortion
39 Copyright © 2009 Electric Power Research Institute, Inc. All rights reserved. PQA/ADA Conference & Exhibition 2009
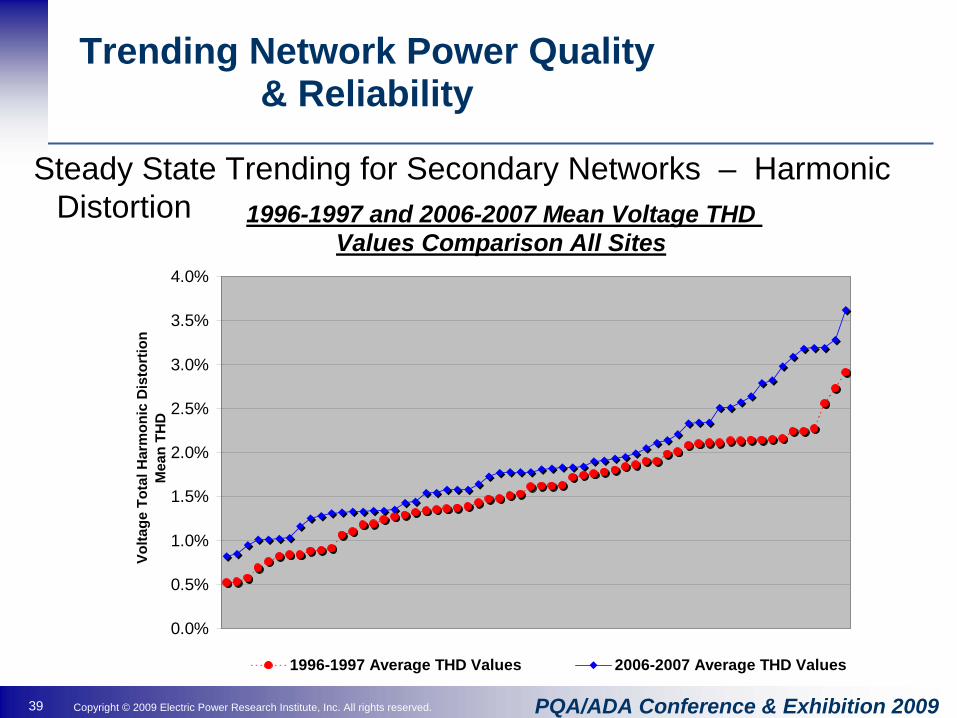
Steady State Trending for Secondary Networks – Harmonic Distortion 1996-1997 and 2006-2007 Mean Voltage THD
Values Comparison All Sites
0.0%
0.5%
1.0%
1.5%
2.0%
2.5%
3.0%
3.5%
4.0%
Volta
ge T
otal
Har
mon
ic D
isto
rtio
n M
ean
THD
1996-1997 Average THD Values 2006-2007 Average THD Values
Trending Network Power Quality & Reliability
40 Copyright © 2009 Electric Power Research Institute, Inc. All rights reserved. PQA/ADA Conference & Exhibition 2009
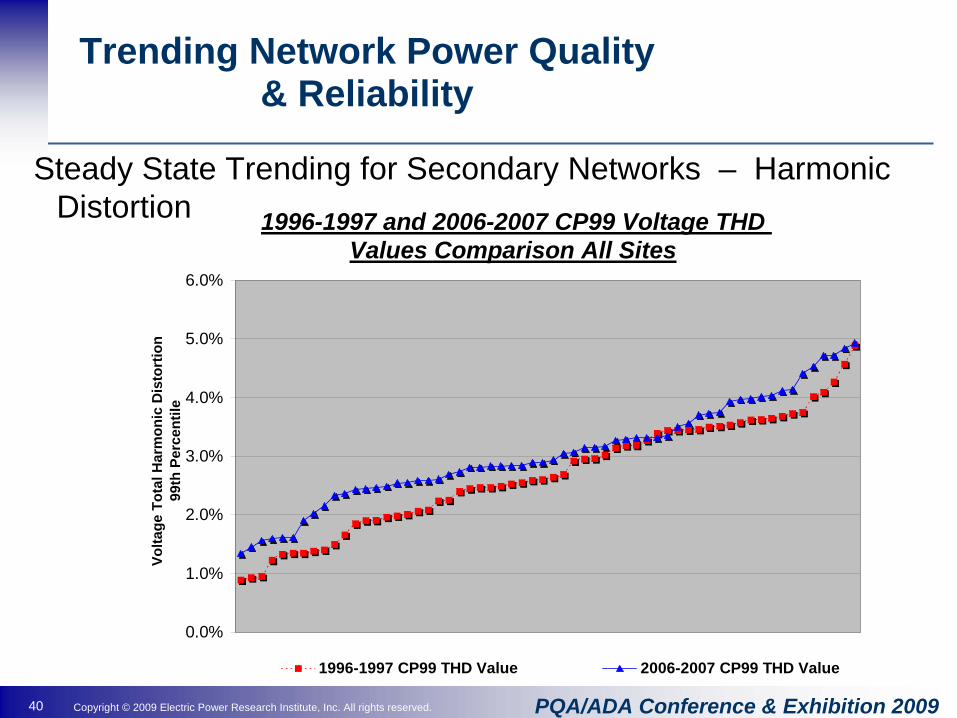
Steady State Trending for Secondary Networks – Harmonic Distortion
Trending Network Power Quality & Reliability
1996-1997 and 2006-2007 CP99 Voltage THD Values Comparison All Sites
0.0%
1.0%
2.0%
3.0%
4.0%
5.0%
6.0%
Volta
ge T
otal
Har
mon
ic D
isto
rtio
n 99
th P
erce
ntile
1996-1997 CP99 THD Value 2006-2007 CP99 THD Value
41 Copyright © 2009 Electric Power Research Institute, Inc. All rights reserved. PQA/ADA Conference & Exhibition 2009
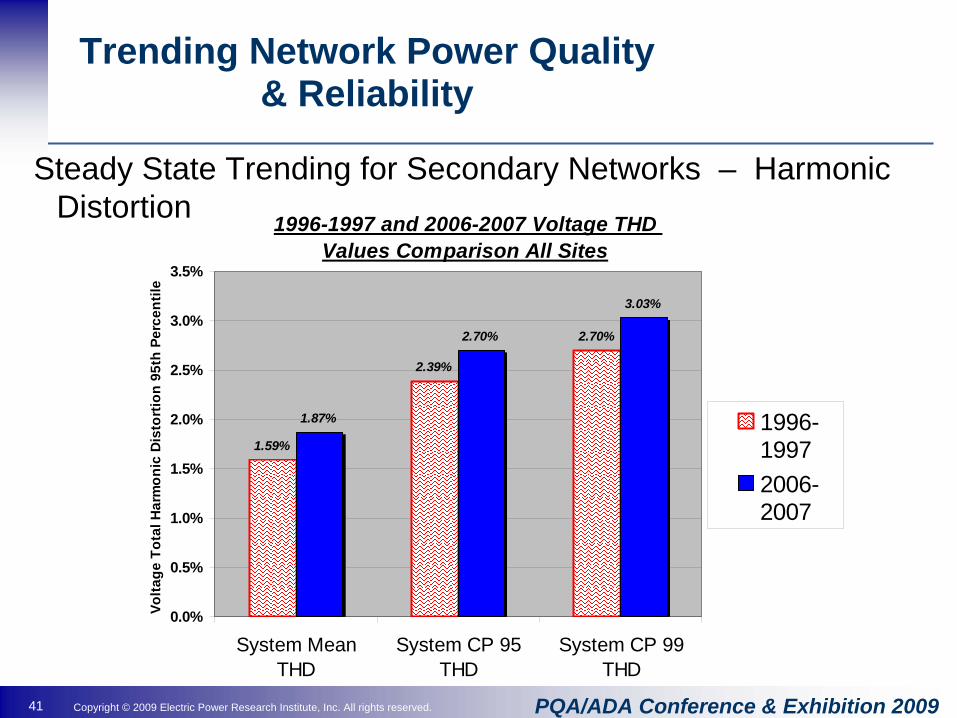
1996-1997 and 2006-2007 Voltage THD Values Comparison All Sites
1.59%
2.39%
2.70%
1.87%
2.70%
3.03%
0.0%
0.5%
1.0%
1.5%
2.0%
2.5%
3.0%
3.5%
System MeanTHD
System CP 95THD
System CP 99THD
Volta
ge T
otal
Har
mon
ic D
isto
rtio
n 95
th P
erce
ntile
1996-19972006-2007
Trending Network Power Quality & Reliability
Steady State Trending for Secondary Networks – Harmonic Distortion

42 Copyright © 2009 Electric Power Research Institute, Inc. All rights reserved. PQA/ADA Conference & Exhibition 2009
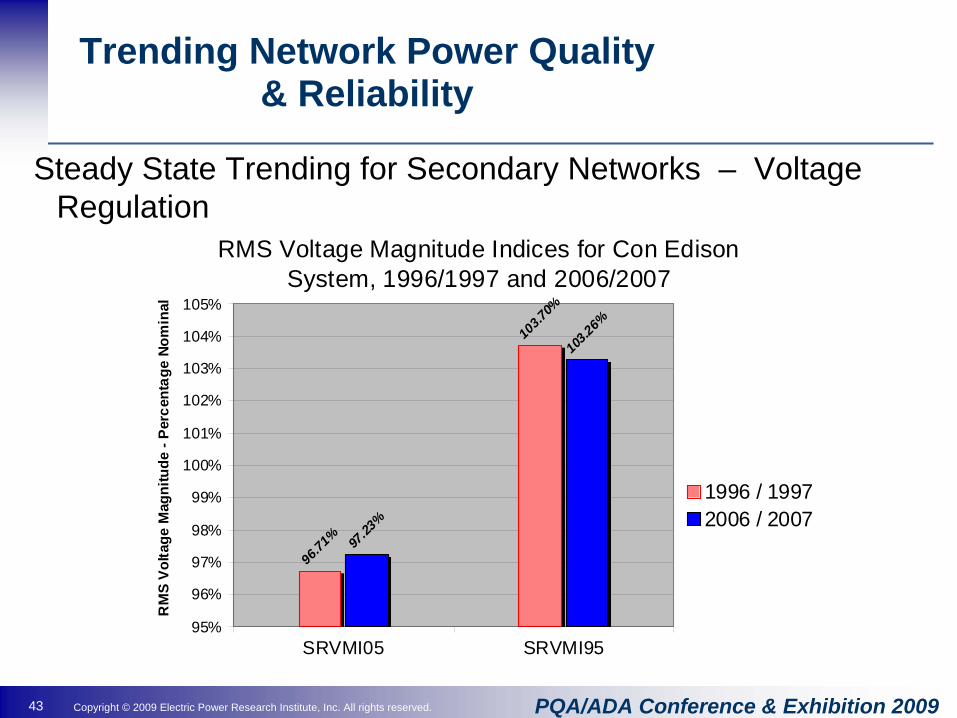
• System RMS Voltage Magnitude CP05 and CP95 Indices– SRVMI05– SRVMI95
• Weighted average of the RMS voltage magnitude recorded measured across system during monitoring period -- low and high end of range.
05.0)05(
)05(05
=×
×
∑
∑∞
∞−
∞−
sst
SRVMI
sst
LCPf
LCPf05.0
)(
)(05
=
∑
∑∞
∞−
∞−
is
CP
is
xf
xfs
Trending Network Power Quality & Reliability
Steady State Trending for Secondary Networks – Voltage Regulation
43 Copyright © 2009 Electric Power Research Institute, Inc. All rights reserved. PQA/ADA Conference & Exhibition 2009
Trending Network Power Quality & Reliability
RMS Voltage Magnitude Indices for Con Edison System, 1996/1997 and 2006/2007
96.71
%
103.7
0%
97.23
%
103.2
6%
95%
96%
97%
98%
99%
100%
101%
102%
103%
104%
105%
SRVMI05 SRVMI95
RM
S Vo
ltage
Mag
nitu
de -
Per
cent
age
Nom
inal
1996 / 19972006 / 2007
Steady State Trending for Secondary Networks – Voltage Regulation

44 Copyright © 2009 Electric Power Research Institute, Inc. All rights reserved. PQA/ADA Conference & Exhibition 2009
Trending Network Power Quality & Reliability
260235
365340
323 322
422 420
474
434
281
176
0
50
100
150
200
250
300
350
400
450
500
1997 1998 1999 2000 2001 2002 2003 2004 2005 2006 2007 2008
Customer Calls per 100,000 Customers
Customer Calls per 100,000 Customers
Customer Trends Related to Power Quality and Reliability

45 Copyright © 2009 Electric Power Research Institute, Inc. All rights reserved. PQA/ADA Conference & Exhibition 2009
Trending Network Power Quality & Reliability
Customer Contacts
40
25 25
10 82 3 3 2 0 0
43
31
73
43
66
4843
28
13 1215
46
62
93
77
97
110114 115
65
82
55
0
20
40
60
80
100
120
1998 1999 2000 2001 2002 2003 2004 2005 2006 2007 2008
EMF visits PQ Visits Off-site Assistance
Customer Trends Related to Power Quality and Reliability

46 Copyright © 2009 Electric Power Research Institute, Inc. All rights reserved. PQA/ADA Conference & Exhibition 2009
• Continued focused on reliability improvements and other initiatives– Third Generation (3G) Network and Substation Design – Smart Grid– Asset Sharing
• Continued focus on Power Quality Measurement and Analysis Capability– Expand substation monitoring capabilities– Integrate microprocessor relays and other measurement devices– Integration of Power Quality data with other SCADA data
Trending Network Power Quality & Reliability
Looking Forward