smallholder-based oil palm and rubber production in the
TRANSCRIPT
agriculture
Article
Smallholder-Based Oil Palm and Rubber Productionin the Forest Region of Guinea: An ExploratoryAnalysis of Household Food Security Outcomes
Boubacar Siddighi Balde 1,*, Mamady Diawara 2, Cristiano M. Rossignoli 3 andAlexandros Gasparatos 1
1 Integrated Research System for Sustainability Sciences (IR3S), The University of Tokyo Institutes forAdvanced Studies (UTIAS), The University of Tokyo, Tokyo 113-8654, Japan; [email protected]
2 Département de Technologie et Contrôle des Produits Alimentaires (TCPA), Institut Supérieur des Scienceset Médecine Vétérinaire (ISSMV), Tangama 2, Dalaba BP 09, Guinea; [email protected]
3 WorldFish, Jalan Batu Maung, Batu Maung, 11960 Bayan Lepas, Penang, Malaysia, P.O. Box 500 GPO,Penang 10670, Malaysia; [email protected]
* Correspondence: [email protected]; Tel.: +81-90-8119-2890
Received: 31 January 2019; Accepted: 19 February 2019; Published: 22 February 2019�����������������
Abstract: The Guinean government has promoted the large-scale production of industrial cropssuch as oil palm and rubber through the Guinean Oil Palm and Rubber Company (SOGUIPAH).Smallholder-based production of these crops has also been promoted to boost rural developmentbut the food security outcomes are unclear. This exploratory study assesses the food securityoutcomes of smallholder-based oil palm and rubber production at the household level using sixstandardized metrics of food security. We compare households involved in industrial crop productionand households that only grow food crops under subsistence conditions through statistical toolssuch as Propensity Score Matching (PSM) and Endogenous Treatment Effect Regression (ETER).Overall, results suggest that oil palm and rubber smallholders perform better than subsistencefarmers on metrics that capture perceptions of hunger and coping behaviors but perform worse forfood diversity metrics. We hypothesize that this discrepancy can possibly be explained by the strongsense of security that steady income provides across time, which outweighs the shortcomings ofdiet diversity. The results of this exploratory study can inform the development of more detailedassessments of the food security outcomes of interventions implemented by SOGUIPAH in the area(and the mechanism through which these impacts emerge).
Keywords: food consumption score (FCS); household food insecurity access scale (HFIAS);coping strategy index (CSI); industrial crops; Sub-Sahara Africa
1. Introduction
Industrial crops such as oil palm, rubber, sugarcane, cotton and jatropha, among others, have beenpromoted in several countries of Sub-Saharan Africa (SSA) [1–3]. Often these crops are promoted toboost rural development and alleviate poverty [2,4]. The recent surge in large-scale land acquisitionsfor industrial crops in SSA [5] has raised concerns about the effects of large-scale industrial cropexpansion on local food security and rural livelihoods [6,7]. However, it is not always clear as towhat extent (and under which conditions) industrial crop production improves or compromises rurallivelihoods and household food security in SSA [8–10].
Wiggins et al. [1] have identified many mechanisms through which industrial crop productioninteracts with the different pillars of food security—namely food availability, access, stability,
Agriculture 2019, 9, 41; doi:10.3390/agriculture9020041 www.mdpi.com/journal/agriculture

Agriculture 2019, 9, 41 2 of 19
utilization. For example, agricultural projects that have commercialized industrial crops, such assugarcane, oil palm, rubber and jatropha, have claimed extensive areas in many countries inSSA [11,12]. Such projects have often converted agricultural land and reduced the available landfor food production [13–15]. Furthermore, involvement in industrial crop value chains has beenshown to divert labor from family farms and food crop production, sometimes compromising localfood availability [1,16]. On the other hand, waged employment in industrial crop plantations orsmallholder-based industrial crop production can generate employment and income opportunities inrural areas of SSA [10,17,18]. Households can invest the obtained income to purchase food or improvefarm productivity increasing the yields of food crops (e.g., [9]. However, plantation wages can be low,often marginally higher than the national minimum wage level [19]. Furthermore, some paymentschemes and loan arrangements can reduce substantially the income that eventually reaches industrialcrops smallholders (e.g., [20,21]. The above suggest the rather entangled nature of the mechanismsthat link industrial crop production and household food security in SSA.
Guinea, like many other countries in SSA, has experienced a declining and re-surging interestin industrial crop production. Following the establishment of the Second Republic (in 1984) andthe liberalization of the economic system (in 1985), there have been several attempts to promote theexpansion of industrial crops such as coffee, rubber and oil palm [22,23]. In particular, since 1986the national agricultural policy has emphasized the development of large export-oriented rubberand oil palm plantations. Currently the Guinean Oil Palm and Rubber Company (SOGUIPAH) isthe largest rubber and oil palm producer in the country accounting for significant employment andincome generation at the national and the local level (see Section 2.1). However, despite these economicbenefits SOGUIPAH operations have been linked to substantial local environmental and socioeconomicimpacts [24]. Although SOGUIPAH has used in its plantations (and promoted among its smallholders)improved oil palm varieties, most of the smallholder-based oil palm production in the country comesfrom natural oil palm groves of the Dura variety [25]. In fact, even tough such natural oil palm varietiesand artisanal processing techniques have low productivity (and are considered antiquated), they stillaccount for 80% of the total national production [22,25,26]. Rubber is another major industrial cropin the country and is produced both in large plantations (e.g., SOGUIPAH) and smallholders linkedto large estates (Section 2.1) [27]. There is also a renewed interest in coffee and cocoa production inYomou area but the production is still low compared to oil palm and rubber production.
At the same time, the government of Guinea as incorporated food security is a key policy goalin various national strategies and programs. These include the National Agricultural DevelopmentPlan (PNDA), the National Agriculture Investment and Food Security Plan (PNIASA) and the PovertyReduction Strategy (PRS), among others. However, these policies do not explicitly make provisionson how to reduce any possible negative trade-offs between industrial crop production and foodsecurity. Currently there is no study in Guinea that attempts to capture the interactions betweensmallholder-based industrial crop production and household food security. The few existing studies onthe impact of oil palm and rubber production have focused on some environmental and socioeconomicimpacts (e.g., [24], rather than food security. It is important to establish a knowledge base in order tounderstand whether there is a competition between industrial crop production in the country andhousehold food security.
This article aims to provide an exploratory assessment of the food security outcomes ofinvolvement in smallholder-based rubber and oil palm production in Guinea. For this exploratoryassessment we focus on a small sample of smallholders from communities around the SOGUIPAHestate in the Diecke sub-prefecture, Yomou prefecture. Considering the many industrial crop-relatedmechanisms that affect household food security, our rapid assessment employs complementarystandardized metrics of food security [28–30], to compare the food security status of oil palm andrubber smallholders and smallholders not involved in industrial crop production. The selected metricselucidate different aspects of food security related to diet diversity, perceptions of hunger and copingbehaviors in the face of food scarcity [28–30]. Considering the relatively little literature empirically
Agriculture 2019, 9, 41 3 of 19
documenting the food security outcomes of involvement in industrial crop production, our exploratorystudy fills a major gap for Western Africa (and Guinea in particular). As such it can be used to informthe development of in-depth studies.
Section 2 outlines the methodology and study areas. Section 3 highlights the main results ofthe study focusing on the food security outcomes of involvement in industrial crop production.Section 4 puts the main findings into perspective and discusses the implications for Guinea and thelimitations of this study.
2. Methodology
2.1. Study Site
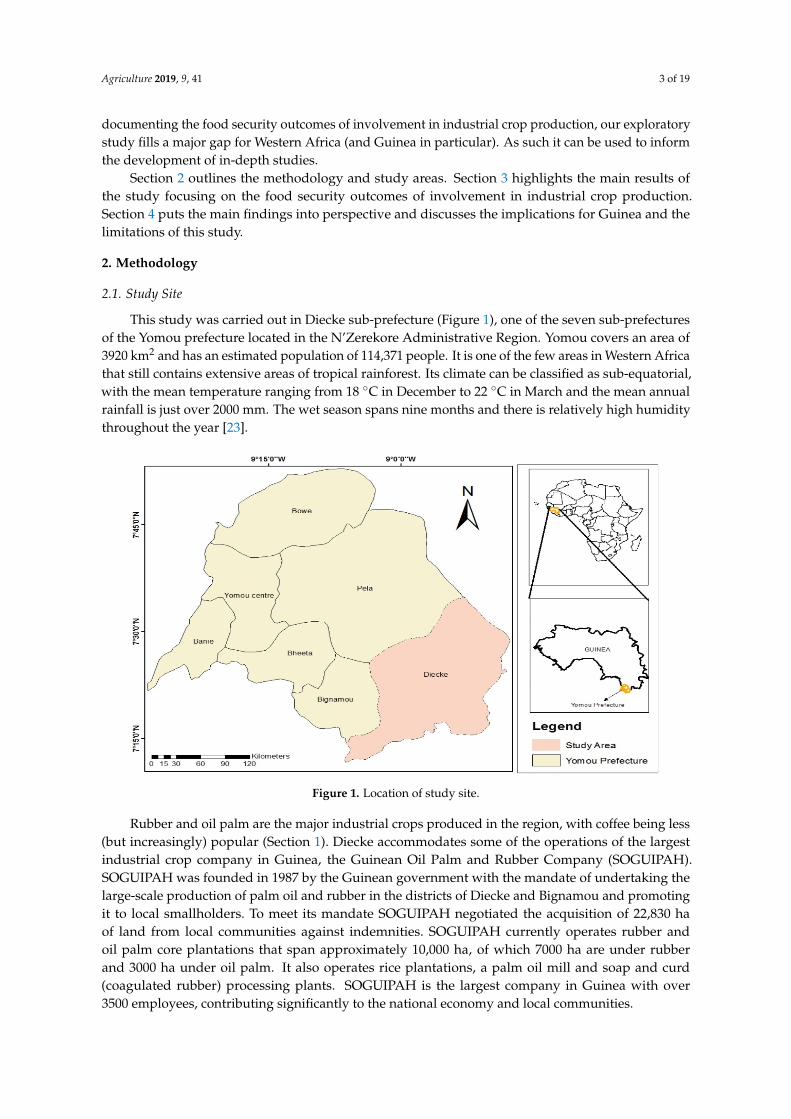
This study was carried out in Diecke sub-prefecture (Figure 1), one of the seven sub-prefecturesof the Yomou prefecture located in the N’Zerekore Administrative Region. Yomou covers an area of3920 km2 and has an estimated population of 114,371 people. It is one of the few areas in Western Africathat still contains extensive areas of tropical rainforest. Its climate can be classified as sub-equatorial,with the mean temperature ranging from 18 ◦C in December to 22 ◦C in March and the mean annualrainfall is just over 2000 mm. The wet season spans nine months and there is relatively high humiditythroughout the year [23].
Agriculture 2019, 9, x FOR PEER REVIEW 3 of 19
our exploratory study fills a major gap for Western Africa (and Guinea in particular). As such it can be used to inform the development of in-depth studies.
Section 2 outlines the methodology and study areas. Section 3 highlights the main results of the study focusing on the food security outcomes of involvement in industrial crop production. Section 4 puts the main findings into perspective and discusses the implications for Guinea and the limitations of this study.
2. Methodology
2.1. Study Site
This study was carried out in Diecke sub-prefecture (Figure 1), one of the seven sub-prefectures of the Yomou prefecture located in the N’Zerekore Administrative Region. Yomou covers an area of 3920 km2 and has an estimated population of 114,371 people. It is one of the few areas in Western Africa that still contains extensive areas of tropical rainforest. Its climate can be classified as sub-equatorial, with the mean temperature ranging from 18 °C in December to 22 °C in March and the mean annual rainfall is just over 2000 mm. The wet season spans nine months and there is relatively high humidity throughout the year [23].
Figure 1. Location of study site.
Rubber and oil palm are the major industrial crops produced in the region, with coffee being less (but increasingly) popular (Section 1). Diecke accommodates some of the operations of the largest industrial crop company in Guinea, the Guinean Oil Palm and Rubber Company (SOGUIPAH). SOGUIPAH was founded in 1987 by the Guinean government with the mandate of undertaking the large-scale production of palm oil and rubber in the districts of Diecke and Bignamou and promoting it to local smallholders. To meet its mandate SOGUIPAH negotiated the acquisition of 22,830 ha of land from local communities against indemnities. SOGUIPAH currently operates rubber and oil palm core plantations that span approximately 10,000 ha, of which 7000 ha are under rubber and 3000 ha under oil palm. It also operates rice plantations, a palm oil mill and soap and curd (coagulated rubber) processing plants. SOGUIPAH is the largest company in Guinea with over 3500 employees, contributing significantly to the national economy and local communities.
Figure 1. Location of study site.
Rubber and oil palm are the major industrial crops produced in the region, with coffee being less(but increasingly) popular (Section 1). Diecke accommodates some of the operations of the largestindustrial crop company in Guinea, the Guinean Oil Palm and Rubber Company (SOGUIPAH).SOGUIPAH was founded in 1987 by the Guinean government with the mandate of undertaking thelarge-scale production of palm oil and rubber in the districts of Diecke and Bignamou and promotingit to local smallholders. To meet its mandate SOGUIPAH negotiated the acquisition of 22,830 haof land from local communities against indemnities. SOGUIPAH currently operates rubber andoil palm core plantations that span approximately 10,000 ha, of which 7000 ha are under rubberand 3000 ha under oil palm. It also operates rice plantations, a palm oil mill and soap and curd(coagulated rubber) processing plants. SOGUIPAH is the largest company in Guinea with over3500 employees, contributing significantly to the national economy and local communities.

Agriculture 2019, 9, 41 4 of 19
Between 1989 and 2002 through the support of several external donors, a contract-based farmingscheme for oil palm and rubber production on family farms was developed in areas around the coreplantations. At the same time lowland areas for irrigated rice production were developed. Farmers thatagreed to produce irrigated rice for their own consumption were prioritized for inclusion to theseschemes. In a sense this was to encourage local communities to abandon slash-and-burn practicesresponsible for deforestation in the area. Accordingly, the plots that were no longer used for rainfedrice production were planted with oil palm and rubber trees.
SOGUIPAH played a leading role in developing local capacity and infrastructure forsmallholder-based oil palm and rubber production in the area. In particular SOGUIPAH provided theplanting material (i.e., hybrid oil palm of the tenera variety, grafted rubber plants from various clones),organized the upstream aspects of the value chain (e.g., supply of agricultural inputs) and providedfarmers with technical support. SOGUIPAH also provided training and advice for the appropriatemaintenance and management of the smallholder plantations. At the same time, SOGUIPAH developedthe lowland areas for rice cultivation and provided training, improved rice varieties and fertilizers forthe first three years. SOGUIPAH also opened and maintains feeder roads for the collection of oil palmand rubber. The core plantations and factories are also significant employment options for many localcommunities, with some locals receiving middle-management positions.
SOGUIPAH chose the areas for the smallholder schemes based on two criteria: (a) clear landownership/tenure and (b) favorable agro-ecological conditions. However, accessibility eventuallybecame an important third criterion, with inclusion priority given to plots alongside the existingfeeder roads. In order to develop the lowland rice areas, it was necessary for landowners to abandontheir land. This land then redistributed between several farmers, including the original landowners.SOGUIPAH undertook plantation development and the plots were subsequently allocated to farmerson credit.
Contractual agreements between SOGUIPAH and smallholder farmers bind the latter to sell theirentire oil palm and rubber production to SOGUIPAH. Smallholders are required to prepare the plot attheir own expense but SOGUIPAH can provide loans for the planting material and agricultural inputs.Smallholders can also receive monetary compensation for the labor required to maintain the familyrubber and oil palm plots.
Overall, approximately 1866 ha and 1760 ha were developed for smallholder-based oil palm andrubber production, respectively. An additional 1298 ha were developed for lowland irrigated riceproduction. About 4200 smallholders were linked with the different SOGUIPAH schemes in 2002but due to the lack of public information it is not clear how many farmers are currently linked tothese schemes.
2.2. Data Collection
To assess the food security outcomes of involvement in industrial crop production we conductedhousehold surveys in the vicinity of SOGUIPAH estate in Diecke sub-prefecture. In particular weconducted household surveys in March 2016 with smallholders that cultivate rubber, oil palm andfood crops (subsistence farmers).
The survey followed a multi-stage sampling approach. Firstly, based on expert interviews weselected three districts within Diecke, where the main livelihoods relate to subsistence crop cultivation(Baala district), rubber cultivation (Baghei district) and oil palm cultivation (Gbeipah district).Within each district we identified communities involved in the production of each crop and weselected randomly households through transect walks in the study communities. We used transectwalks to identify responding households as it was not possible to secure lists of households engaging inthese activities. In total we conducted 180 household surveys, of which 67 surveys targeted subsistencefarmers, 76 rubber smallholders and 37 oil palm growers. Household interviews targeted either thehousehold head or the spouse, whoever was available during the visit. Interviews were conductedin the local language using trained enumerators and were captured in hard copy questionnaires that

Agriculture 2019, 9, 41 5 of 19
were subsequently digitized after the end of the survey in the capital Conakry. In order to minimizenon-sampling errors (and thus to improve the quality of the captured data) we followed the samequality-assurance procedures as other similar surveys conducted by members of the research team inother industrial crop settings of SSA [2].
To assess the food security levels of the respondent households we employed a series ofstandardized metrics, namely the Food Consumption Score (FCS), Household Food Insecurity AccessScale (HFIAS), Household Hunger Scale (HHS), Coping Strategies Index (CSI), Reduced CopingStrategies Index (rCSI) and the Months of Inadequate Household Food Provisioning (MIHFP) (Table 1).The selected metrics elucidate different aspects of food security related to diet diversity, perceptionsof hunger and coping behaviors in the face of food scarcity [28–30] (see Table 1 for more details).Thus, they can allow for a rapid and robust assessment of different aspects of food security aspectsat the household level [28]. Relying on multiple metrics is essential for multi-dimensional conceptssuch as food security [31], with such standardized metrics being increasingly used to assess foodsecurity impacts in industrial crop settings of SSA (e.g., [32–35]). Essentially such approaches canreduce the complexity (and increase the consistency) of food security assessments considering themultiple interacting mechanisms that that are often at play in such industrial crop settings of SSA,for example, [1,8,9,36].
The household survey also included various independent variables that were used to describethe study groups and to explain the determinants of food security at the group level (Table 1).These variables were selected based on existing literature focusing on the multiple socioeconomicfactors affecting rural household food security such as the gender of household head, family size,household income, household livelihoods, dependency ratio, (cultivated) land size and livestockownership among others, for example, [33,37–39] among several other studies.
2.3. Data Analysis
Data was analyzed in four stages (Step 1–4), using a series of statistical tools. Step 1 comparesthe three study groups across the main household characteristics outlined in Table 1. We use anindependent t-test for the continuous variables as a means of comparing the different characteristics ofthe surveyed groups (Table 1). Step 2 assesses the household food security status using the standardizedmetrics described in Section 2.2. We provide both the mean value for each study group, as well asthe distribution of respondents across the different levels of food security. Considering that the HHSand rCSI are derivatives of the HFIAS and CSI respectively (Table 1), we report their results in theSupplementary Electronic Material.
Table 1. Analytical variables and their definition.
Variables Definition and Measurement
Household Food Security Indicators
Food consumption score (FCS)
Composite measure of diet diversity. Includesquestions about the different food groups (and theirnutritional value) consumed by the household in the7 days prior to the survey [40,41].
Household food insecurity access scale (HFIAS)
Composite measure of perceptions of hunger.Includes questions about the prevalence, acceptabilityand anxiety over insecure access to food in the fourweeks prior to the survey [30,42,43].
Household hunger scale (HHS)
Composite measure of perceptions of hunger. Itcomprises the final three questions of the HFIAS, allof which pertain to the consequences of severe foodinsecurity [29].

Agriculture 2019, 9, 41 6 of 19
Table 1. Cont.
Variables Definition and Measurement
Coping strategy index (CSI)
Composite measure of coping attitudes duringperiods of food insecurity. It contains questions aboutthe frequency and severity of behaviors in whichhouseholds engage when not having enough food orenough money to buy food [44,45].
Reduced coping strategy index (rCSI)
Composite measure of coping attitudes duringperiods of food insecurity. It aggregates the five(pre-weighted) coping strategies employed inresponse to food shortages [44].
Months of inadequate household foodprovisioning (MIHFP)
Number of months in the past year that a householdwas not able to provide itself with enough food [46].
Household Characteristics
Household size Number of persons living in the household
Gender of household head 1 = female-headed household, 0 = otherwise
Origin of respondent 1 = born in the community, 0 = otherwise
Dependency ratioPercentage: Ratio of dependent household members(i.e., members younger than 15 or older than 65) tohousehold members of working age (i.e., 15–65 years)
Off-farm income USD: Income related to off-farm activities, such ascasual work or selling woodland products
Child mortality ratio Percentage: Ratio of children deceased, to the totalnumber of deceased members in the household
Livestock ownership
Tropical Livestock Unit (TLU): Aggregate measure oflivestock ownership calculated based on the numberof livestock species using conversion factors forlivestock in Sub-Sahara Africa countries.
Total household income USD: includes off-farm and farm income
Monthly food expenditure USD
Amount borrowed to purchase food USD
Agricultural Characteristics
Ratio of land given to SOGUIPAH to current land (%)Percentage: Ratio of the household cultivated landthat was given to SOGUIPAH to the currentcultivated land
Size of cultivated land haSize of natural palm groves ha
Note: 1 USD = 8900 GNF (Guinean Francs) as per exchange rate during data collection.
Step 3 uses the propensity score matching (PSM) approach in a binary treatment variable [47],to estimate the food security outcomes of involvement in smallholder-based rubber or oil palmproduction. Several recent studies have used the PSM approach to assess the impact of differentagricultural interventions in Africa (e.g., see [38,48–51]. We use the three most commonly adoptedmatching methods, that is, neighbor matching (NNM), caliper-based matching (CBM) and thekernel-based matching (KBM) [52,53] (see Supplementary Electronic Material for more details).Due to unobservable differences between the participants and non-participants in industrial cropproduction, the PSM approach alone cannot conclusively elicit the impact of participation [52]. As allbiases have not been controlled for, it is possible to overestimate or underestimate the food securityoutcomes of involvement in industrial crop production, eliciting erroneous conclusions. To avoidsuch complications, we perform the test of balancing [52]. Matching quality is checked throughthe examination of the standardized bias and t-Test. The standardized bias is a suitable indicator
Agriculture 2019, 9, 41 7 of 19
for assessing the distance in marginal distributions of the X-variables [54]. For each covariate X,the standardized bias is defined as the difference of sample means in the treated and not treatedsubsamples, as a percentage of the square root of the average of sample variances in both groups.One possible problem with the standardized bias approach is that it is not possible to obtain a clearindication of the success of the matching procedure, even though in most empirical studies a biasreduction below 3% or 5% is considered sufficient [53]. A similar approach uses a two-sample t-Test tocheck whether there are significant differences in covariate means for both groups [54]. Before matchingdifferences are expected but after matching the covariates should be balanced in both groups and henceno significant differences should be found. The t-Test might be preferred if the analyst is concernedwith the statistical significance of the results but bias reduction before and after matching is not clearlyvisible [53].
Step 4 uses the endogenous treatment effects regression (ETER) model to provide a consistentestimate of the outcomes of engagement in industrial crop production on the standardized metricsof food security. We estimate the Average Treatment Effect (ATE) of growing oil palm or rubber onfood security using the “etregress” function at the Stata software. This function estimates an averagetreatment effect (ATE) and the other parameters of a linear regression model, augmented with anendogenous binary-treatment variable. Estimation is by either full maximum likelihood or a two-stepconsistent estimator. When there are no interactions between the treatment variable and the outcomecovariates, the etregress function directly estimates the ATE and the ATET. The ATET is the same as theATE in this case because the treatment indicator variable has not interacted with any of the outcomecovariates. More details about the endogenous treatment effect regression (ETER) model are includedin the Supplementary Electronic Material.
2.4. Ethical Considerations
The research protocol was developed as part of large study funded by the Belmont Forum and wasbased on a similar protocol that elicited the impact of industrial crops in southern Africa [2]. Similarly,for the development of the protocol of this study, we adopted the good practice recommendations ofthe UK Economic and Social Science Research Council (ESRC). The research protocol was reviewedand approved by the ethical review committee of the University of Tokyo (identification number15-186). Approval was granted in December 2015, before fieldwork commencement.
To ensure smooth community entry, we undertook meetings with traditional authorities priorto initiating the household survey. This was necessary as local chiefs are influential members oflocal communities in Guinea. We sought oral informed consent from all respondents before eachinterview, as it was deemed as the most appropriate approach considering the high illiteracy ratesin the local communities. We ensured that all respondents were fully aware about what theirparticipation in this study entailed and explained any concerns related to anonymity and disclosure ofpersonal information.
3. Results
3.1. Household Characteristicss
Table 2 compares the main household characteristics of the different study groups, that is, rubbersmallholders, oil palm smallholders and subsistence farmers. Households that grow oil palm tend tobe significantly larger than rubber growers and subsistence farmers. Both groups of industrial cropproducers tend to have substantially lower child mortality than subsistence farmers.

Agriculture 2019, 9, 41 8 of 19
Table 2. Key household characteristics and differences between the study groups.
Household CharacteristicsRubber
Growers(Group 1)
Oil PalmGrowers
(Group 2)
SubsistenceFarmers
(Group 3)
Group 1 vs.Group 2
Group 2 vs.Group 3
Group 1 vs.Group 2
Mean score (Standard deviation) (Mean difference) p-value
Household size (number) 8.20 (5.96) 10.84 (8.39) 6.34 (4.30) (1.85) 0.037 ** (4.49) 0.000 *** (−2.64) 0.057 *Dependency ratio (%) 7.80 (22.09) 12.01 (24.09) 16.68 (55.64) (−8.88) 0.202 (−4.67) 0.629 (−4.21) 0.358
Off-farm income (USD) 64.95 (165.63) 75.13 (201.6) 28.07 (62.45) (36.88) 0.088 * (47.06) 0.080 * (−10.18) 0.776Adult mortality (number) 2.28 (1.76) 1.82 (1.29) 2.68 (1.91) (−0.40) 0.211 (−0.86) 0.022 ** (0.46) 0.176Child mortality (number) 0.65 (0.87) 0.58 (0.85) 1.12 (1.24) (−0.46) 0.019 ** (−0.54) 0.037 ** (0.07) 0.706Child mortality ratio (%) 22.96 (34.92) 30.45 (58.23) 23.83 (31.84) (−0.87) 0.877 (6.62) 0.455 (−7.49) 0.396
Cultivated land (ha) 7.17 (12.11) 7.51 (7.84) 5.07 (6.94) (2.10) 0.213 (2.43) 0.105 * (−0.33) 0.879Land given to SOGUIPAH (ha) 17.50 (39.63) 28.95 (97.66) 23.79 (44.26) (−6.29) 0.371 (5.15) 0.712 (−11.45) 0.378
Ratio of land given to SOGUIPAHto current land (%) 446 (1378) 732.6 (2469) 1262 (2557) (−815.67) 0.017 ** (−529) 0.309 (−286.4) 0.430
Home garden area (ha) 3.25 (6.98) 4.56 (9.48) 3.31 (3.48) (−0.05) 0.957 (1.25) 0.332 (−1.31) 0.410Natural palm grove area (ha) 2.53 (3.10) 1.45 (2.01) 0.81 (1.74) (1.72) 0.000 *** (0.64) 0.092 * (1.08) 0.056 *
Livestock (TLU) 1.16 (5.85) 0.28 (0.88) 0.65 (1.56) (0.513) 0.488 (−0.37) 0.189 (0.88) 0.365Income (USD) 754.30 (1075) 1406 (1429) 421.58 (1156) (332.7) 0.077 * (984.55) 0.000 *** (−651.8) 0.008 ***
Monthly food expenditure (USD) 69.39 (112.10) 68.56 (111.8) 38.22 (54.95) (31.17) 0.041 ** (30.34) 0.066 * (0.83) 0.971
Amount borrowed for food (USD) 52.33 (90.54) 34.16 (76.44) 66.68(155.19) (−14.35) 0.495 (32.51) 0.235) (18.16) 0.296
Note: *** p <0.01; ** p < 0.05; * p < 0.1.
Oil palm growers have slightly larger cultivated land areas compared to rubber growers(7.51 vs. 7.17 ha), with the cultivated land of both groups of industrial crop growers being significantlylarger than that of subsistence farmers. Oil palm growers have given on average more land toSOGUIPAH (28.95 ha), followed by subsistence farmers (23.79 ha) and rubber growers (17.50 ha).Both groups of industrial crop growers tend to have access to larger areas of semi-wild oil palm grovescompared to subsistence farmers.
All groups derive most of their income from farming activities, with some minor income comingfrom off-farm activities such as casual work. Oil palm growers have the highest overall income (USD1406), followed by rubber growers (USD 754) and subsistence farmers (USD 422). Both groups ofindustrial crop growers tend to spend more money to buy food but at the same time they borrow lessfor food purchases compared to subsistence farmers. The above suggest the large importance of oilpalm and rubber production for rural in the study areas.
3.2. Food Security Status
Both groups of industrial crop smallholders have significantly lower FCS (p < 0.01) (and hencelower food security) compared to irrigated farmers (Table 3). Patterns for the HFIAS are quite different,with both industrial crop smallholder groups registering lower HFIAS (and hence higher food security)compared to subsistence farmers but this difference is statistically significant only for oil palm growers(p < 0.01) but all three groups have very similar levels of CSI, with no statistically significant differencesbetween them (Table 3). Interestingly there is some variation in the levels of the reduced versions ofthe HFIAS and CSI (HHS and rCSI respectively). HHS levels improve for subsistence farmers andbecome very similar to those of oil palm and rubber growers but rCSI levels do not change comparedto the patterns observed for the full version of the metric (see Table S1 and Figure S1, SupplementaryElectronic Material). On average subsistence farmers experience the fewest months of inadequate foodprovisioning (2.24 months), compared to rubber (2.64 months) and oil palm growers (3.30 months).However, these differences are only statistically significant between the subsistence farmers and oilpalm growers (p < 0.05).

Agriculture 2019, 9, 41 9 of 19
Table 3. Mean food security indicator scores and differences between study groups.
MetricsRubber
Growers(Group 1)
Oil PalmGrowers
(Group 2)
SubsistenceFarmers
(Group 3)
Group 1 vs.Group 2
Group 2 vs.Group 3
Group 1 vs.Group 2
Mean score (Standard deviation) (Mean difference) p-value
FCS 35.03 (21.42) 34.43 (22.51) 45.18 (19.83) (−10.15) 0.004 *** (−10.75) 0.013 *** (0.59) 0.892HFIAS 10.53 (6.68) 7.78 (5.61) 11.37 (6.02) (−0.85) 0.430 (−3.59) 0.004 *** (2.74) 0.033 **
CSI 30.53 (33.12) 40.51 (38.07) 32.75 (32.18) (−2.22) 0.686 (7.77) 0.273 (−9.99) 0.115MIHFP 2.64 (2.51) 3.30 (2.63) 2.24 (1.83) (0.41) 0.277 (1.06) 0.018 ** (−0.65) 0.204
Note: ***: p < 0.01; **: p < 0.05.
Figure 2 provides a more disaggregated view for the different food security metrics (see alsoTable S1/Figure S1, Supplementary Electronic Material). In particular, they outline the proportion ofrespondents who are food secure and food insecure within each study group. In terms of the FCS,29.7% of oil palm growers, 46.6% of rubber growers and 59.7% of subsistence farmers are food secure(i.e., falling within the “Acceptable” category) (Figure 2). Thus, in terms of diet diversity 53.4% ofrubber growers and a whopping 70.3% of oil palm growers are food insecure (i.e., “Borderline” and“Poor”). In terms of HFIAS, only 4.3% and 9.0% of rubber growers and the subsistence farmers arefood secure (either “Secure” or “Mildly Food Insecure”). No oil palm grower falls in the food secureand mildly food insecure categories, suggesting the widespread perceptions of hunger for this group(Figure 2). When using the CSI only 43.4%, 37.8% and 38.8% of rubber growers, oil palm growers andsubsistence farmers respectively are food secure (i.e., fall in the “Secure” and “Mildly Food Insecure”categories). Similar patterns also emerged for the reduced versions of these metrics (i.e., HHS, rCSI)(see Table S2, Supplementary Electronic Material).
Agriculture 2019, 9, x FOR PEER REVIEW 9 of 19
subsistence farmers are food secure (either “Secure” or “Mildly Food Insecure”). No oil palm grower falls in the food secure and mildly food insecure categories, suggesting the widespread perceptions of hunger for this group (Figure 2). When using the CSI only 43.4%, 37.8% and 38.8% of rubber growers, oil palm growers and subsistence farmers respectively are food secure (i.e., fall in the “Secure” and “Mildly Food Insecure” categories). Similar patterns also emerged for the reduced versions of these metrics (i.e., HHS, rCSI) (see Table S2, Supplementary Electronic Material).
Figure 2. Respondent distribution across food security thresholds for the different metrics.
The above suggests that with only a few exceptions, most of the surveyed households can be classified as food insecure for most food security metrics. Overall for the FCS and HFIAS fewer subsistence farmers are classified as food insecure, compared to rubber and oil palm growers. On the contrary for CSI a higher proportion of subsistence farmers are food insecure, compared to both groups of industrial crop growers. This suggests that regardless of involvement in industrial crop production, the local communities experience extensive food insecurity.
3.3. Food Security Outcomes of Involvement in Industrial Crop Production
3.3.1. Propensity Score Matching
To understand the food security outcomes of involvement in oil palm and rubber production, we estimate the average difference of the Average Treatment Effect on the Treated (ATT). First we identify the determinants of involvement in industrial crop production (Table S3, Supplementary Electronic Material) and then use the NNM, CBM and KBM matching methods for the different food security metrics (Section 2.3) related to dietary diversity (FCS), perceptions of food insecurity (i.e., HFIAS) and coping behaviors (i.e., CSI) (Table 4).
For the FCS, the ATT difference of involvement in rubber production is: 15.8, −19.13 and −6.99 points for the NNM, CBM and KBM methods, respectively. The CBM matching method gives the only statistically significant difference (p < 0.05) (Table 4). The ATT difference for involvement in oil palm production is 21.49, −7.60 and 27.82 points for the NNM, CBM and KBM methods respectively, with the NNM and KBM estimating statistically significant differences (p < 0.1) (Table 4). The above suggests that participation in rubber production could reduce diet diversity (and as extent food security), while involvement in oil palm production has the opposite effect. However, in the latter
Figure 2. Respondent distribution across food security thresholds for the different metrics.
The above suggests that with only a few exceptions, most of the surveyed households can beclassified as food insecure for most food security metrics. Overall for the FCS and HFIAS fewersubsistence farmers are classified as food insecure, compared to rubber and oil palm growers. On thecontrary for CSI a higher proportion of subsistence farmers are food insecure, compared to both groupsof industrial crop growers. This suggests that regardless of involvement in industrial crop production,the local communities experience extensive food insecurity.

Agriculture 2019, 9, 41 10 of 19
3.3. Food Security Outcomes of Involvement in Industrial Crop Production
3.3.1. Propensity Score Matching
To understand the food security outcomes of involvement in oil palm and rubber production,we estimate the average difference of the Average Treatment Effect on the Treated (ATT). First weidentify the determinants of involvement in industrial crop production (Table S3, SupplementaryElectronic Material) and then use the NNM, CBM and KBM matching methods for the different foodsecurity metrics (Section 2.3) related to dietary diversity (FCS), perceptions of food insecurity (i.e.,HFIAS) and coping behaviors (i.e., CSI) (Table 4).
For the FCS, the ATT difference of involvement in rubber production is: 15.8, −19.13 and−6.99 points for the NNM, CBM and KBM methods, respectively. The CBM matching method givesthe only statistically significant difference (p < 0.05) (Table 4). The ATT difference for involvement in oilpalm production is 21.49, −7.60 and 27.82 points for the NNM, CBM and KBM methods respectively,with the NNM and KBM estimating statistically significant differences (p < 0.1) (Table 4). The abovesuggests that participation in rubber production could reduce diet diversity (and as extent foodsecurity), while involvement in oil palm production has the opposite effect. However, in the latter casethe statistical significance is quite low, so caution needs to be exercised when considering this finding.
For the HFIAS the ATT difference of involvement in rubber production is −6.01, −0.95 and−2.28 points for the NNM, CBM and KBM methods, respectively. Of these ATT differences estimatedthrough NNM and KBM are statistically significant (p < 0.1) (Table 4). When it comes to involvement inoil palm production, the ATT difference for all matching methods indicates a negative and significanteffect for both the HFIAS (p < 0.05).
The above findings suggest that involvement in rubber and oil palm smallholder production leadsto a decrease of the food insecurity related experiential measures (HFIAS), which means a subsequentincrease in food security. However, the outcomes for oil palm are stronger, more significant and moreconsistent between the matching techniques, compared to rubber growers.
For the coping strategies measure, most matching tests suggest that involvement in rubber andoil palm production reduces the CSI, which implies an increase in food security. However, in almostall cases the ATT differences are either not statistically significant or have a low level of significance(Table 4).
Table 4. Impact of participation in industrial crop production on food security metrics.
Rubber Growers vs. Subsistence Farmers Oil Palm Growers vs. Subsistence Farmers
Parameters Treated Untreated Difference (S.E) T-stat Treated Untreated Difference (S.E) T-stat
NNM
Unmatched 35.03 45.18 −10.15 (3.47) −2.93 34.43 45.18 −10.75 (4.26) −2.52
ATT 35.03 19.22 15.80 (14.41) 1.10 34.43 12.95 21.49 (13.48) 1.59 *
CBM
Unmatched 35.03 45.18 −10.15 (3.47) −2.93 34.43 45.18 −10.75 (4.26) −2.52
ATT 33.68 52.80 −19.13 (8.07) −2.37 ** 22.80 30.40 −7.60 (14.95) −0.51
KBM
Unmatched 35.03 45.18 −10.15 (3.47) −2.93 34.43 45.18 −10.75 (4.26) −2.52
ATT 32.78 39.77 −6.99 (5.98) −1.17 37.19 9.37 27.82 (17.43) 1.60 *
HFIASNNM
Unmatched 10.53 11.37 −0.85 (1.07) −0.79 7.78 11.37 −3.59 (1.20) −2.98
ATT 10.53 16.54 −6.01 (4.15) −1.45 * 7.78 16.62 −8.84 (4.39) −2.01 **

Agriculture 2019, 9, 41 11 of 19
Table 4. Cont.
Rubber Growers vs. Subsistence Farmers Oil Palm Growers vs. Subsistence Farmers
Parameters Treated Untreated Difference (S.E) T-stat Treated Untreated Difference (S.E) T-stat
CBM
Unmatched 10.53 11.37 −0.85 (1.07) −0.79 7.78 11.37 −3.59 (1.20) −2.98
ATT 10.40 11.35 −0.95 (2.27) −0.42 4.60 11.60 −7.00 (3.14) −2.23 **
KBM
Unmatched 10.53 11.37 −0.85 (1.07) −0.79 7.78 11.37 −3.59 (1.20) −2.98
ATT 10.25 12.53 −2.28 (1.70) −1.34 * 8.32 17.52 −9.20 (5.24) −1.75 **
CSINNM
Unmatched 30.53 32.75 −2.22 (5.48) −0.41 40.51 32.75 7.77 (7.04) 1.10
ATT 30.53 59.38 −28.86 (18.14) −1.59 * 40.51 60.73 −20.22 (29.42) −0.69
CBM
Unmatched 30.53 32.75 −2.22 (5.48) −0.41 40.51 32.75 7.77 (7.04) 1.10
ATT 28.00 25.60 2.40 (10.16) 0.24 56.00 32.60 23.40 (30.50) 0.77
KBM
Unmatched 30.53 32.75 −2.22 (5.48) −0.41 40.51 32.75 7.77 (7.04) 1.10
ATT 27.72 33.11 −5.39 (9.38) −0.57 39.68 69.42 −29.74 (28.31) −1.05
Note: ** = p < 0.05; * = p < 0.1; NNM = Nearest neighbor matching; CBM = Caliper-based matching;KBM = Kernel-based matching. Results for HHS and rCSI are included in Table S4, SupplementaryElectronic Material.
As outlined in Section 2.3 matching quality can be checked through the examination of thestandardized bias (SB) and t-Test. Both approaches and particularly the latter, suggest good matchingquality for the rubber and subsistence farmers (Table S5, Supplementary Electronic Material). For allcomparison (i.e., rubber growers vs. subsistence farmers and palm oil growers vs. irrigated subsistencefarmers) our results indicate that the matching quality obeys to the rules with the covariate income.Furthermore, a visual inspection of the density distributions of the estimated propensity scores for thecompared groups indicates that the common support condition is satisfied, that is, there is a substantialoverlap in the distribution of the propensity scores of both groups of industrial crop producers andsubsistence farmers (Figures S2–S3, Supplementary Electronic Material).
3.3.2. Endogenous Treatment Regression Model
The estimated ATE of involvement in smallholder-based rubber production is −32.97 points forthe measure of dietary diversity (i.e., the FCS). This implies that involvement in rubber productionsignificantly reduces the FCS, having a substantial negative effect on food security. On the other hand,participation in rubber production reduces the experiential measure of food insecurity (i.e., HFIAS by−9.61 points) and the measure of coping behaviors (i.e., CSI by −52.65 points) (Table 5).
The estimated ATE of involvement in oil palm production is −22.04 points for the dietary diversitymetric (i.e., FCS), suggesting a statistically significant decrease in this metric of food security (Table 6).Involvement in oil palm production reduces the experiential measures of food insecurity (HFIAS by−9.77 points) and consumption behaviors (CSI by −0.95 points). However, only the results for HFIASare statistically significant (Table 6).

Agriculture 2019, 9, 41 12 of 19
Table 5. Linear Regression with Endogenous Treatment Effects for participation in rubber production.
Outcome Equation FCS HFIAS CSI
Coefficient (Standard Error)
Household size 0.99 *** (0.30) 0.21 ** (0.10) −0.46 (0.53)Dependency ratio −0.09 ** (0.04) 0.02 * (0.01) −0.07 (0.06)
Ratio of land given to SOGUIPAH to current land 0.0002 (0.001) 7E-05 (0.0003) −0.002 (0.001)Home garden area 0.09 (0.27) 0.08 (0.09) −0.05 (0.47)
Natural palm grove area 2.70 *** (0.61) 0.28 (0.20) 1.73 * (1.03)Livestock −0.29 (0.34) −0.04 (0.11) 1.11 * (0.59)
Monthly food expenditure 0.004 (0.02) −0.002 (0.006) 0.05 * (0.03)Annual food expenditure 0.003 ** (0.002) 0.0001 (0.001) 0.001 (0.003)
Amount borrowed for food −0.02 (0.01) 0.01 **(0.004) −0.01 (0.02)Origin of respondent −0.24 (5.09) −0.03 (1.89) 10.50 (9.82)
Gender of household head 2.64 (3.76) −0.03 (1.40) 1.40 (7.27)Participation in industrial crop production (1 = Rubber, 0 = Subsistence) −32.97 *** (9.18) −9.61 *** (3.50) −52.65 *** (11.87)
Constant 44.73 *** (6.07) 13.03 *** (2.29) 49.14 *** (10.59)
Treatment Equation
Off-farm income 0.002 (0.001) 0.002 * (0.001) 0.003 ** (0.001)MIHFP 0.09 ** (0.05) 0.06 (0.04) 0.07 (0.04)Income 0.0002 **(9E-05) 0.0002 *** (8E-05) 0.0002 *** (8E-05)
Origin of respondent 0.50 (0.33) 0.47 (0.32) 0.49 (0.31)Gender of household head 0.02 (0.25) 0.06 (0.25) −0.03 (0.24)
Constant −0.81 ** (0.35) −0.73 ** (0.34) −0.71 ** (0.33)/athrho 0.59 * (0.33) 1.01 ** (0.44) 0.995 *** (0.27)
/lnsigma 2.96 *** (0.11) 1.98 (0.15) 3.63 *** (0.11)rho 0.53 (0.24) 0.77 (0.18) 0.76 (0.12)
sigma 19.35 (2.12) 7.27 (1.09) 37.83 (4.04)lambda 10.23 (5.59) 5.58 (2.11) 28.74 (7.13)
Number of observations 143 143 143Wald chi2(12) 55.73 *** 31.67 *** 30.48 ***Log likelihood −706.41 −784.44
Notes: *** p <0.01; ** p < 0.05; * p < 0.1. Results for HHS and rCSI are included in Table S6, SupplementaryElectronic Material.
Table 6. Linear Regression with Endogenous Treatment Effects for participation in oil palm production.
Outcome Equation FCS HFIAS CSI
Coefficient (Standard Error)
Household size 0.17 (0.34) 0.05 (0.09) −1.45 *** (0.55)Dependency ratio −0.07 * (0.04) 0.02 (0.01) −0.02 (0.06)
Ratio of land given to SOGUIPAH to current land −0.0002 (0.001) −6E-05 (0.0002) −0.001 (0.001)Home garden area 0.53 * (0.31) 0.33 *** (0.09) 1.43 *** (0.52)
Natural palm grove area 3.62 *** (1.03) 0.39 (0.29) 2.58 (1.71)Livestock −2.12 (1.39) −0.24 (0.41) −0.97 (2.29)
Monthly food expenditure −0.04 (0.02) −0.004 (0.007) 0.04 (0.04)Annual food expenditure −0.0005 (0.002) −0.001 ** (0.0006) −0.002 (0.003)
Amount borrowed for food −0.02 (0.02) 0.01 ** (0.004) −0.02 (0.03)Origin of respondent 12.27 ** (5.60) 3.49 ** (1.74) −1.47 (9.16)
Gender of household head −6.59 (4.32) −0.87 (1.35) 8.82 (7.11)Participation in industrial crop production (1 = oil palm, 0 =
subsistence) −22.04 *** (8.16) −9.77 *** (2.74) −0.95 (11.94)
Constant 38.84 *** (6.43) 8.84 *** (2.02) 40.51 *** (10.40)
Treatment Equation
Off-farm income 0.002 (0.002) 0.003 * (0.002) 0.002 (0.002)MIHFP 0.22 *** (0.06) 0.21 *** (0.06) 0.19 *** (0.07)Income 0.0004 *** (0.0001) 0.0003 *** (0.0001) 0.0004 ***(0.0001)
Origin of respondent 0.94 ** (0.45) 0.64 (0.45) 0.91 ** (0.46)Gender of household head −0.002 (0.32) −0.03 (0.31) −0.04 (0.31)
Constant −2.16 *** (0.53) −1.95 *** (0.55) −2.08 *** (0.55)/athrho 0.26 (0.32) 0.88 * (0.46) 0.23 (0.26)
/lnsigma 2.91 *** (0.08) 1.75 *** (0.13) 3.41 *** (0.07)rho 0.25 (0.30) 0.70 (0.23) 0.22 (0.25)
sigma 18.44 (1.43) 5.78 (0.74) 30.35 (2.25)lambda 4.63 (5.65) 4.07 (1.79) 6.81 (7.69)
Number of observations 104 104 104Wald chi2(12) 34.69 *** 41.49 *** 29.99 ***Log likelihood −503.57 −369.88 −555.67
Notes: *** p < 0.01; ** p < 0.05; * p < 0.1. Results for HHS and rCSI are included in Table S7, SupplementaryElectronic Material.

Agriculture 2019, 9, 41 13 of 19
4. Discussion
The studied local communities experience high levels of food insecurity, as consistently suggestedby: (a) the mean scores of each food security metric (Table 3) and (b) the distribution of respondentsacross food security thresholds (Figure 2). However, the involvement in smallholder-based rubberand oil palm cultivation generates significantly higher on-farm income and allows industrial cropsmallholders spend on average more money to purchase food (Section 3.1). Yet, the relatively largerfamily sizes of industrial crop grower households can possibly negatively affect their food security,as study groups with smaller average family size (e.g., subsistence farmers) report fewer months ofinadequate household food provisioning (MIHFP) (Section 3.1). This finding reflects other studies inSSA, which have found that household size negatively affects some food security aspects [55–59].
Overall the food security status of study groups varies among the different metrics (Table 3).Both oil palm and rubber smallholders have significantly lower levels of diet diversity (FCS) thansubsistence farmers (Table 3). On the other hand, industrial crop smallholders have lower levelsof perceptions of hunger (HFIAS) compared to subsistence farmers, with oil palm growers havingsignificantly better HFIAS levels than the other study groups. When it comes to coping behaviorsin periods of food scarcity (e.g., CSI) there are mixed results between groups. In particular groupdifferences are not statistically significant (Table 3). When looking at the distribution patterns acrossindicator thresholds (Table S1, Figure 2), subsistence farmers have the lowest proportion of respondentsin the highest food insecurity thresholds for FCS and HFIAS and the second lowest for CSI (only behindrubber growers). Oil palm growers consistently have the highest proportion of respondents in thehighest food insecurity thresholds for all indicators.
Both the PSM and ETER analyses suggest that involvement in industrial crop production decreasesfood security in terms of diet diversity (i.e., FCS) (Table 7). When it comes to perceptions of hunger(HFIAS), the involvement in oil palm production improves food security as indicated by both the PSMand ETER methods (Table 7). The PSM analysis reports similar findings and for rubber producers,albeit with lower (or no) statistical significance (Table 7).
On the other hand, it is not possible to conclusively deduce the effect of involvement in industrialcrop production on coping behaviors (CSI). Although involvement in oil palm and rubber productionseems to improve the CSI across most of the techniques, there are some contradictions in the results(i.e., when using the CBM matching technique or comparing the results of the PSM and the ETERmethods) (Table 7). Hence, it is not easy to establish a causal relationship between involvement inindustrial crop production and CSI improvement. It is worth mentioning, however, that the resultsof the ETER are statistically significant and suggest that involvement in industrial crop productionimproves the CSI and thus enhances food security.
Overall, Table 7 suggests that involvement in rubber and oil palm production largely enhancesthe levels of food security metrics that have longer time scales and entail a subjective awareness offood security, such as perceptions of hunger (HFIAS) and coping behaviors (CSI). On the other hand,involvement in oil palm and rubber production reduces the levels of food security metrics that useshorter time scales and measure food diversity (FCS). In this sense involvement in industrial cropproduction does not enhance consistently food security across all metrics. This effect can possiblybe explained by the strong sense of security that steady and higher income provides across time(food stability), that outweighs the shortcomings on diet diversity (food utilization).

Agriculture 2019, 9, 41 14 of 19
Table 7. Food security outcomes of involvement in industrial crop cultivation for all metrics and tests.
Analysis Metric/TestRubber Grower vs. Subsistence Farmers Oil palm Growers vs. Subsistence Farmers
PSM
Effect on Metric Comment Effect on Metric Comment
FCS
NNM (ATT) 15.80 (14.41) Positive effect on foodsecurity (not significant) 21.49 * (13.48) Positive effect on food
security (low significance)
CBM (ATT) −19.13 ** (8.07) Negative effect on foodsecurity (significant) −7.60 (14.95) Negative effect on food
security (not significant)
KBM (ATT) −6.99 (5.98) Negative effect on foodsecurity (not significant) 27.82 * (17.43) Positive effect on food
security (low significance)
HFIAS
NNM (ATT) −6.01 * (4.15) Positive effect on foodsecurity (low significance) −8.84 ** (4.39) Positive effect on food
security (significant)
CBM (ATT) −0.95 (2.27) Positive effect on foodsecurity (not significant) −7.00 ** (3.14) Positive effect on food
security (significant)
KBM (ATT) −2.28 * (1.70) Positive effect on foodsecurity (low significance) −9.20 ** (5.24) Positive effect on food
security (significant)
CSI
NNM (ATT) −28.86 * (18.14) Positive effect on foodsecurity (low significance) −20.22 (29.42) Positive effect on food
security (not significant)
CBM (ATT) 2.40 (10.16) Negative effect on foodsecurity (not significant) 23.40 (30.50) Negative effect on food
security (not significant)
KBM (ATT) −5.39 (9.38) Positive effect on foodsecurity (not significant) −29.74 (28.31) Positive effect on food
security (not significant)
ETER
FCS
ATE −32.97 ***(9.18) Negative effect on foodsecurity (significant) −22.04 *** (8.16) Negative effect on food
security (significant)
HFIAS
ATE −9.61 *** (3.50) Positive effect on foodsecurity (significant) −9.77 *** (2.74) Positive effect on food
security (significant)
CSI
ATE −52.65 *** (11.87) Positive effect on foodsecurity (significant) −0.95 (11.94) Positive effect on food
security (not significant)
Notes: *** = p < 0.01, ** = p < 0.05, * = p < 0.1; NNM = Nearest neighbor matching; CBM = Caliper-based matching;KBM = Kernel-based matching.
However, this income can be precarious due to various reasons. For example, informal interviewswith community members during this survey suggest that smallholders are contractually obliged tosell all their produce to SOGUIPAH. However, the company imposes its own pricing system, excludingthe opinions of rubber and oil palm smallholders in price negotiations. Moreover, SOGUIPAH does notalways respect signed agreements with smallholders or offer the agreed price. It is worth mentioningthat international commodity prices have fluctuated widely in the past years but even during timesof favorable international prices, SOGUIPAH has declined to increase the price offered for rubbercoagulum and fresh fruit bunches (FFB). Many of the interviewed oil palm and especially rubbersmallholders stated that their income has declined substantially in the past years due to this situation.This has brewed a growing dissatisfaction to rubber and oil palm smallholders in the wider study area.
Due to this situation, some community members and key stakeholders initiated the RegionalFederation of Oil Palm and Rubber Producers (FEREPPAH). FEREPPAH is a farmer-led organizationfounded in 2006 in Diecke. Its main goal is to facilitate access to quality planting material, defend theinterests of rubber and oil palm smallholders and strengthen their technical capability. FEREPPAHis managed directly by smallholders and, among others, it defends the rights of producers to selltheir product in whatever market channel they chose, even if it is not SOGUIPAH. This has causedsome conflicts with SOGUIPAH (which is essentially a for-profit entity) that can possibly affect thefuture stability of the oil palm/rubber market and the income that eventually reaches industrialcrop smallholders.

Agriculture 2019, 9, 41 15 of 19
Such issues have been raised and in other studies in Guinea and the wider region. For example,the Famine Early Warning Systems Network (FEWS Net) has found that rubber remains an importantcash crop in Guinea, despite the current production decline, low world market price and the lack ofproper maintenance in many rubber plantations [60]. Actually, many rubber-producing householdshave diverted much of their effort and resources on food crop production in order to compensate forthe lower incomes obtained through the rubber production [60]. The declining global rubber pricesduring the past few years have become a major obstacle to the expansion of smallholder-based rubberproduction in some parts of Guinea [61]. Even the rally in global rubber prices in the first half of 2016(from 2000 GNF per kg in early 2016, to 2500 GNF per kg in July 2016) was not much of an incentiveto further invest in rubber production and/or the maintenance of rubber farms [61]. Similar reportsfrom Liberia have indicated that the steady decline in international rubber prices has influenced manyrubber-producing households to turn to charcoal production, migration, remittances and borrowing,to meet their basic non-food expenditure [62].
As noted above involvement in industrial crop production has different effects for the differentmetrics used in this study. For example, subsistence farmers seem to be more food secure in terms of dietdiversity (FCS), while rubber and oil palm smallholders to be better off in terms of perceptions of hunger(HFIAS) and coping behaviors (CSI), however, with the latter two less pronounced. This discrepancybetween metrics suggests that they capture different aspects of food security and reflects severalother studies that have raised issues of comparability between the different metrics (e.g., [30,31,39,63].Our study also reflects some of the studies that have shown variability between standardized metricsof food security in industrial crop settings depending on the crop and type of involvement, (e.g.,Thornhill et al., 2016; Anderman et al., 2014; Johnson et al., 2018). Considering this lack of consensus, itis important to continue building this current evidence base in SSA countries [1], especially in countriessuch as Guinea that experience both a renewed interest in industrial crop production and extensivefood insecurity.
However, it is important to point some shortcoming of this study. First, as this is an exploratoryrapid assessment, we used small samples for each study group. Even though we randomized to theextent possible sample selection, the fact remains that the small sample might have caused some of theinconclusive or contradictory results between some groups and tests. Future studies should aim toincrease sample sizes in order to achieve a more robust statistical analysis. Second, our study includedsubsistence farmers as a non-intervention group. Even though the households in this group were nottreated in terms of industrial crop adoption, there is a likelihood of interaction with other SOGUIPAHactivities such as irrigation systems (for rice production) and road infrastructure. These are large-scaleinterventions that might have had some effect to the subsistence farmers. In this respect subsistencefarmers might not have been a control group in the very strict sense of the term (this is why we donot use this term in this study). Even though this does not affect the main focus of the analysis (i.e.,food security outcomes of involvement in industrial crop production), future studies should seek toinclude control groups that did not have any interaction with SOGUIPAH. This would possibly requirelocating control groups in faraway communities to ensure that SOGUIPAH activities did not haveany effect on them. In such studies caution should be paid to find communities that have exactlythe same characteristics (or shared the exact circumstances) of the industrial crop growers prior tointeraction with SOGUIPAH. This would add more nuanced information about the actual food securityoutcomes of involvement in industrial crop production in the region. Finally, our study employsstandardized metrics of food security. Even though such metrics can offer very powerful informationabout the impacts of industrial crop production [1], there is a possibility that the obtained resultsmight be affected by the time of the year the survey has been conducted. Future studies should seek toundertake data collection during multiple periods of the year and/or capture “ultimate” measures offood security such as child stunting [1].

Agriculture 2019, 9, 41 16 of 19
5. Conclusions
This paper assesses the food security outcomes of the involvement in smallholder-based rubberand oil palm production in the Forest Region of Guinea. We have conducted an exploratory rapidassessment that has used multiple standardized metrics of food security to compare the food securitystatus of industrial crop smallholders and subsistence farmers. Our results suggest that subsistencefarmers have better food security levels in terms of diet diversity (FCS) but worse levels in terms ofperception of hunger (HFIAS). Results for coping behaviors (CSI) are mixed, without any clear patternor statistically significant differences between groups.
Propensity Score Matching (PSM) and Endogenous Treatment Effect Regression (ETER) analysesindicate that involvement in industrial crop production has different food security outcomes dependingon the metric and the crop. Both PSM and ETER converge to reveal that involvement in rubber andoil palm production has a positive effect on food security in terms of perceptions of hunger (HFIAS)and coping behaviors (i.e., CSI). Both models also agree that involvement in rubber production fails toimprove dietary diversity (FCS).
Overall, our results suggest that involvement in rubber and oil palm production has different foodsecurity outcomes for the different metrics. In particular involvement in industrial crop productionlargely improves food security outcomes for metrics that entail a subjective awareness of food securitybut have the opposite effect for measures that entail an objective assessment of food diversity patterns.In this sense involvement in industrial crop production does not enhance consistently food securityacross all metrics. This can possibly be explained by the strong sense of security that steady andhigher income provides across time (food stability), that outweighs the shortcomings of diet diversity(food utilization).
However, caution should be used in interpreting these findings as the tests for some indicatorsand groups are not statistically significant, possibly due to the small sample sizes used in this study.Future studies should aim to build on this study by (a) increasing sample sizes, (b) including controlgroups that properly reflect the situation prior to SOGUIPAH interventions, (c) conducting surveysduring different times of the year and/or including ultimate measures of food security such aschild stunting.
Supplementary Materials: The following are available online at http://www.mdpi.com/2077-0472/9/2/41/s1,Figure S1: Distribution of respondents across food security thresholds for the HHS and rCSI metrics, Figure S2:Propensity score distribution and common support for propensity score estimation for rubber growers andsubsistence farmers, Figure S3: Propensity score distribution and common support for propensity score estimationof oil palm growers and subsistence farmers, Table S1: Mean score and distribution across food securitythresholds for each study group, Table S2. Mean food security scores for HHS and rCSI and differences betweenstudy groups, Table S3. Determinants of participation in industrial crop production, Table S4. Impacts ofparticipation in industrial crop production on HFIAS and HHS, Table S5. Test of balancing for confounders,Table S6. Linear Regression with Endogenous Treatment Effects for participation in rubber production (HHS andrCSI metrics), Table S7. Linear Regression with Endogenous Treatment Effects for participation in oil palmproduction (HHS and rCSI metrics).
Author Contributions: Conceptualization, B.S.B and A.G.; Methodology, B.S.B, C.R. and A.G.; Formal analysis,B.S.B; Investigation, B.S.B. and M.D.; Data curation, B.S.B. and M.D.; Writing—original draft preparation, B.S.Band A.G.; Writing—review and editing, B.S.B., M.D., C.R. and A.G.; Visualization, B.S.B. and A.G.; Supervision,B.S.B. and A.G.; Project administration, B.S.B. and A.G.; Funding acquisition, A.G.
Funding: This research was funded by Japan Science and Technology Agency (JST) under the Belmont Forumproject FICESSA (Food Security Impacts of Industrial Crop Expansion in Sub-Sahara Africa).
Acknowledgments: Authors acknowledge the support of the Japan Science and Technology Agency (JST) forthe Belmont Forum project FICESSA (Food Security Impacts of Industrial Crop Expansion in Sub-Sahara Africa).Marcin Jarzebski created Figure 2 and Figure S1, Rodolfo Dam Lam provided comments in a previous version ofthis paper and Ei Thwe assisted in the editing of this manuscript.
Conflicts of Interest: The authors declare no conflict of interest.

Agriculture 2019, 9, 41 17 of 19
References
1. Wiggins, S.; Henley, G.; Keats, S. Competitive or Complementary? Industrial Crops and Food Security inSub-Saharan Africa; Research Reports and Studies; Overseas Development Institute (ODI): London, UK, 2015.
2. Gasparatos, A.; von Maltitz, G.; Johnson, F.X.; Lee, L.; Mathai, M.; Puppim de Oliveira, J.; Willis, K. Biofuels inAfrica: Drivers, impacts and priority policy areas. Renew. Sustain. Energy Rev. 2015, 45, 879–901. [CrossRef]
3. Boafo, Y.A.; Balde, B.S.; Saito, O.; Gasparatos, A.; Lam, R.D.; Ouedraogo, N.; Chamba, E.; Moussa, Z.P.Stakeholder perceptions of the outcomes of reforms on the performance and sustainability of the cottonsector in Ghana and Burkina Faso: A tale of two countries. Cogent Food Agric. 2018, 4, 1477541. [CrossRef]
4. Jones, S.; Gibbon, P. Developing agricultural markets in Sub-Saharan Africa: Organic cocoa in rural Uganda.J. Dev. Stud. 2011, 47, 1595–1618. [CrossRef]
5. Schoneveld, G.C. The geographic and sectoral patterns of large-scale farmland investments in sub-SaharanAfrica. Food Policy 2014, 48, 34–50. [CrossRef]
6. Yengoh, G.T.; Armah, F.A. Effects of large-scale acquisition on food insecurity in Sierra Leone. Sustainability2015, 7, 9505–9539. [CrossRef]
7. Yaro, J.A.; Teye, J.K.; Torvikey, G.D. Agricultural commercialisation models, agrarian dynamics and localdevelopment in Ghana. J. Peasant Stud. 2017, 44, 538–554. [CrossRef]
8. Lam, R.D.; Boafo, Y.A.; Degefa, S.; Gasparatos, A.; Saito, O. Assessing the food security outcomes of industrialcrop expansion in smallholder settings: Insights from cotton production in Northern Ghana and sugarcaneproduction in Central Ethiopia. Sustain. Sci. 2017, 12, 677–693. [CrossRef]
9. Herrmann, R.; Jumbe, C.; Bruentrup, M.; Osabuohien, E. Competition between biofuel feedstock and foodproduction: Empirical evidence from sugarcane outgrower settings in Malawi. Biomass Bioenergy 2018, 114,100–111. [CrossRef]
10. Mudombi, S.; von Maltitz, G.P.; Gasparatos, A.; Romeu-Dalmau, C.; Johnson, F.X.; Jumbe, C.; Ochieng, C.;Luhanga, D.; Lopes, P.; Balde, B.S.; et al. Multi-dimensional poverty effects around operational biofuelprojects in Malawi, Mozambique and Swaziland. Biomass Bioenergy 2018, 114, 41–54. [CrossRef]
11. White, B.; Borras, S.M.; Hall, R.; Scoones, I.; Wolford, W. The new enclosures: Critical perspectives oncorporate land deals. J. Peasant Stud. 2012, 39, 619–647. [CrossRef]
12. Hall, R.; Scoones, I.; Tsikata, D. Plantations, outgrowers and commercial farming in Africa:Agricultural commercialisation and implications for agrarian change. J. Peasant Stud. 2017, 44, 515–537.[CrossRef]
13. World Rainforest Movement (WRM). Oil Palm and Rubber Plantations in Western and Central Africa:An Overview; World Rainforest Movement (WRM): Montevideo, Uruguay, 2008.
14. Romeu-Dalmau, C.; Gasparatos, A.; von Maltitz, G.; Graham, A.; Almagro-Garcia, J.; Wilebore, B.; Willis, K.J.Impacts of land use change due to biofuel crops on climate regulation services: Five case studies in Malawi,Mozambique and Swaziland. Biomass Bioenergy 2018, 114, 30–40. [CrossRef]
15. Ahmed, A.; Kuusaana, E.D.; Gasparatos, A. The role of chiefs in the political economy of large-scale landacquisitions in Ghana: Insights from the jatropha sector. Land Use Policy 2018, 75, 570–582. [CrossRef]
16. Ndjimbi, F. Étude sur l’impact des plantations agro-industrielles de palmiers à huile et d’hévéas sur les populations duGabon; World Rainforest Movement (WRM): Montevideo, Uruguay, 2013.
17. Achterbosch, T.; Van Berkum, S.; Meijerink, G. Cash Crops and Food Security: Contributions to Income,Livelihood Risk and Agricultural Innovation; LEI Wageningen UR: Wageningen, The Netherlands, 2014.
18. Negash, M.; Swinnen, J.F.M. Biofuels and Food Security: Micro-evidence from Ethiopia. Energy Policy 2013,61, 963–976. [CrossRef]
19. German, L.; Schoneveld, G.C.; Pacheco, P. The social and environmental impacts of biofuel feedstockcultivation: Evidence from multi-site research in the forest frontier. Ecol. Soc. 2011, 16, 24. [CrossRef]
20. Chinsinga, B. The Green Belt Initiative, Politics and Sugar Production in Malawi. J. South. Afr. Stud. 2017, 43,501–515. [CrossRef]
21. Matenga, C.R.; Hichaambwa, M. Impacts of land and agricultural commercialisation on local livelihoods inZambia: Evidence from three models. J. Peasant Stud. 2017, 44, 574–593. [CrossRef]
22. Madelaine, C.; Malezieux, E.; Sibelet, N.; Manlay, R.J. Semi-wild pal groves reveal agricultural change in theforest region of Guinea. Agrofor. Syst. 2008, 73, 189–204. [CrossRef]

Agriculture 2019, 9, 41 18 of 19
23. Black, R.; Sessay, M. Forced migration, land-use change and political economy in the Forest Region of Guinea.Afr. Aff. 1997, 96, 587–605. [CrossRef]
24. Delarue, J.; Cochet, H. Systemic Impact Evaluation: A Methodology for Complex Agricultural DevelopmentProjects. The Case of a Contract Farming Project in Guinea. Eur. J. Dev. Res. 2013, 25, 778–796. [CrossRef]
25. Carrere, R. Oil Palm in Africa: Past, Present and Future Scenarios; World Rainforest Movement (WRM):Montevideo, Uruguay, 2010.
26. Sy, M.A. Étude sur la filière artisanale de l’huile de palme en Guinée; MAE/BCEPA—PASAL: Conakry, Guinea, 2002.27. Agence Française de Développement (AFD). Developing Smallholder Rubber Production: Lessons from AFD’s
Experience; Agence Française de Développement (AFD): Paris, France, 2008.28. Carletto, C.; Zezza, A.; Banerjee, R. Towards better measurement of household food security:
Harmonizing Indicators and the role of household surveys. Glob. Food Secur. 2013, 2, 30–40. [CrossRef]29. Jones, A.D.; Ngure, F.M.; Pelto, G.; Young, S.L. What are we assessing when we measure food security?
A compendium and review of current metrics. Adv. Nutr. 2013, 4, 481–505. [CrossRef] [PubMed]30. Maxwell, D.; Vaitla, B.; Coates, J. How do indicators of household food insecurity measure up? An empirical
comparison from Ethiopia. Food Policy 2014, 47, 107–116. [CrossRef]31. Vaitla, B.; Coates, J.; Glaeser, L.; Hillbruner, C.; Biswal, P.; Maxwell, D. The measurement of household food
security: Correlation and latent variable analysis of alternative indicators in a large multi-country dataset.Food Policy 2017, 68, 193–205. [CrossRef]
32. Johnson, F.X.; Nyambane, A.; von Maltitz, G.; Luhanga, D.; Jarzebski, M.; Balde, B.S.; Gasparatos, A. Impacts ofBiofuel Crop Production in Southern Africa: Land Use Change, Ecosystem Services, Poverty Alleviation and FoodSecurity; Ecosystem Services for Poverty Alleviation (ESPA): Edinburg, UK, 2018.
33. Thornhill, S.; Vargyas, E.; Fitzgerald, T.; Chisholm, N. Household food security and biofuel feedstockproduction in rural Mozambique and Tanzania. Food Secur. 2016, 8, 953–971. [CrossRef]
34. Anderman, T.L.; Remans, R.; Wood, S.A.; DeRosa, K.; DeFries, R.S. Synergies and tradeoffs between cashcrop production and food security: A case study in rural Ghana. Food Secur. 2014, 6, 541–554. [CrossRef]
35. Hassen, K.; Zinab, B.; Belachew, T. Gender and education as predictors of food insecurity among coffeefarming households of the Jimma zone, Southwest of Ethiopia. BMC Nutr. 2016, 2, 75. [CrossRef]
36. Von Maltitz, G.; Gasparatos, A.; Fabricius, C.; Morris, A.; Willis, K.J. Jatropha cultivation in Malawi andMozambique: Impact on ecosystem services, local human wellbeing and poverty alleviation. Ecol. Soc.2016, 21, 3. [CrossRef]
37. De Cock, N.; D’Haese, M.; Vink, N.; van Rooyen, C.J.; Staelens, L.; Schonfeldt, H.C.; D’Haese, L. Food securityin rural areas of Limpopo province, South Africa. Food Secur. 2013, 5, 269–282. [CrossRef]
38. Baiyegunhi, L.J.S.; Oppong, B.B.; Senyolo, G.M. Mopane worn (Imbrasia belina) and rural household foodsecurity in Limpopo province, South Africa. Food Secur. 2016, 8, 153–165. [CrossRef]
39. Kissoly, L.; Fabe, A.; Grote, U. The integration of smallholders in agricultural value chain activities and foodsecurity: Evidence from rural Tanzania. Food Secur. 2017, 9, 1219–1235. [CrossRef]
40. World Food Programme (WFP). Comprehensive Food Security and Vulnerability Analysis Guidelines; World FoodProgramme (WFP): Rome, Italy, 2009.
41. World Food Programme (WFP). Food Consumption Analysis: Calculation and Use of the Food Consumption Scorein Food Consumption and Food Security Analysis; World Food Programme (WFP): Rome, Italy, 2007.
42. Dietchler, M.; Ballard, T.; Swindale, A.; Coates, J. Validation of a Measure of Household Hunger for Cross CulturalUse; United States Agency for International Development (USAID): Washington, DC, USA, 2010.
43. Coates, J.; Swindale, A.; Bilinsk, P. Household Food Insecurity Access Scale (HFIAS) for Measurement of Food Access:Indicator Guide; United States Agency for International Development (USAID): Washington, DC, USA, 2007.
44. Maxwell, D.; Caldwell, R. The Coping Strategies Index: Field Methods Manual, 3rd ed.; United States Agency forInternational Development (USAID): Washington, DC, USA, 2008.
45. Maxwell, D.; Watkins, B.; Wheeler, R.; Collins, G. The Coping Strategies Index: Field Methods Manual, 1st ed.;United States Agency for International Development (USAID): Washington, DC, USA, 2003.
46. Swindale, A.; Bilinsky, P. Months of Adequate Household Food Provisioning (MAHFP) for Measurement of HouseholdFood Access; United States Agency for International Development (USAID): Washington, DC, USA, 2007.
47. Rosenbaum, P.R.; Rubin, D.B. The central role of the propensity score in observational studies for causaleffects. Biometrika 1983, 70, 41–55. [CrossRef]

Agriculture 2019, 9, 41 19 of 19
48. Chiputwa, B.; Spielman, D.J.; Qaim, M. Food Standards, Certification and Poverty among Coffee Farmers inUganda. World Dev. 2015, 66, 400–412. [CrossRef]
49. Mwangi, J.K.; Crewett, W. The impact of irrigation on small-scale African indigenous vegetable Growers’market access in peri-urban Kenya. Agric. Water Manag. 2019, 212, 295–305. [CrossRef]
50. Gitonga, Z.M.; De Groote, H.; Kassie, M.; Tefera, T. Impact of metal silos on households’ maize storage,storage losses and food security: An application of a propensity score matching. Food Policy 2013, 43, 44–55.[CrossRef]
51. Mitiku, F.; de Mey, Y.; Nyssen, J.; Maertens, M. Do Private Sustainability Standards Contribute to IncomeGrowth and Poverty Alleviation? A Comparison of Different Coffee Certification Schemes in Ethiopia.Sustainability 2017, 9, 246. [CrossRef]
52. Awotide, B.A.; Alene, A.D.; Abdoulaye, T.; Manyong, V.M. Impact of agricultural technology adoptionon asset ownership: The case of improved cassava varieties in Nigeria. Food Secur. 2015, 7, 1239–1258.[CrossRef]
53. Caliendo, M.; Kopeinig, S. Some practical guidance for the implementation of propensity score matching.J. Econ. Surv. 2008, 22, 31–72. [CrossRef]
54. Rosenbaum, P.R.; Rubin, D.B. Constructing a control group using multivariate matched sampling methodsthat incorporate the propensity score. Am. Stat. 1985, 39, 33–38.
55. Mathiassen, A.; Hollema, S. What is the effect of physical activity level on food consumption,energy deficiency and dietary diversity? Food Nutr. Bull. 2014, 35, 351–360. [CrossRef]
56. Feleke, S.; Kilmer, R.L.; Gladwin, C. Determinants of food security in Southern Ethiopia. Agric. Econ. 2005,33, 351–363. [CrossRef]
57. Kaloi, E.; Tayebwa, B.; Bashaasha, B. Food security status of households in Mwingi district, Kenya. Afr. CropSci. Conf. Proc. 2005, 7, 867–873.
58. Turyahabwe, N.; Kakuru, W.; Tweheyo, M.; Tumusiime, D.M. Contribution of wetland resources to householdfood security in Uganda. Agric. Food Secur. 2013, 2, 5. [CrossRef]
59. Silvestri, S.; Sabine, D.; Patti, K.; Wiebke, F.; Maren, R.; Ianetta, M.; Carlos, Q.F.; Mario, H.; Anthony, N.;Nicolas, N.; et al. Households and food security: Lessons from food secure households in East Africa.Agric. Food Secur. 2015, 4, 23. [CrossRef]
60. Famine Early Warning Systems Network (FEWS NET). Guinea. Food Security Outlook: October 2016 throughMay 2017; Famine Early Warning Systems Network (FEWS NET): Washington, DC, USA, 2017.
61. Famine Early Warning Systems Network (FEWS NET). Guinea Food Security Outlook: February throughSeptember 2017; Famine Early Warning Systems Network (FEWS NET): Washington, DC, USA, 2017.
62. Famine Early Warning Systems Network (FEWS NET). Liberia Food Security Outlook: February to September2016; Famine Early Warning Systems Network (FEWS NET): Washington, DC, USA, 2017.
63. Manda, J.; Gardebroek, C.; Khonje, M.G.; Alene, A.D.; Mutenje, M.; Kassie, M. Determinants of childnutritional status in the eastern province of Zambia: The role of improved maize varieties. Food Secur. 2016,8, 239–253. [CrossRef]
© 2019 by the authors. Licensee MDPI, Basel, Switzerland. This article is an open accessarticle distributed under the terms and conditions of the Creative Commons Attribution(CC BY) license (http://creativecommons.org/licenses/by/4.0/).