small- to large-scale geographical patterns within the macrobenthic abra alba community
TRANSCRIPT

Estuarine, Coastal and Shelf Science 64 (2005) 751e763
www.elsevier.com/locate/ECSS
Small- to large-scale geographical patterns within themacrobenthic Abra alba community
Gert Van Hoey*, Magda Vincx, Steven Degraer
Marine Biology Section, Department of Biology, Ghent University, Krijgslaan 281/S8, B-9000 Gent, Belgium
Received 29 November 2004; accepted 18 March 2005
Available online 27 June 2005
Abstract
The Abra alba community is widely spread in the coastal zone of the English Channel and the Southern Bight of the North Sea.The community is located on shallow, fine muddy sands. Its spatial distribution can be broken up into a number of isolated patches(Atlantic French, British and German coast) and one large continuous distribution area (northern France up to the Netherlands).
The aim of this study is to investigate the geographical patterns within the macrobenthic A. alba community at different scales: thecommunity’s full distribution range (i.e. large scale) and a selected area with a continuous distribution of the A. alba community (i.e.small scale) in relation to structuring environmental variables. Therefore, an analysis of newly collected samples along the Belgiancoastal zone was combined with available information on the A. alba community throughout its distribution range. Although the
community structure shows a high similarity across the full distribution range of the A. alba community, large- as well as small-scalechanges in community composition were observed: the Belgian Continental Shelf (BCS) should be considered as a major transitionfrom the rich southern to the relatively poorer northern distribution area of the A. alba community. At a large scale (i.e. full
distribution range), the differences in community structure are expected to result from (1) the specific hydrodynamic conditions inthe English Channel (Atlantic ocean waters) and the Southern Bight of the North Sea, with a consequent differential connectivitybetween the different areas and (2) the climatological and related faunal shift from temperate (English Channel) to boreal conditions
(German Bight). At a small scale (i.e. within the continuous distribution area), structural and functional community aspects mayresult from geographic differences in (1) detrital food availability, related to riverine input and pelagic productivity, along and acrossthe coastline and (2) the amount of suspended matter, impoverishing the A. alba community when excessively available.
� 2005 Elsevier Ltd. All rights reserved.
Keywords: Abra alba community; large-scale; small-scale patterns; diversity; English Channel; Southern Bight of the North Sea
1. Introduction
Nowadays, human activities are considered to be theprimary cause of changes to marine biological diversity(biodiversity), especially in coastal areas. The present rateof habitat degradation in marine ecosystems is alarming(Gray, 1997; Snelgrove et al., 1997), and conservation ofbiodiversity is of critical importance. There is also an
* Corresponding author.
E-mail address: [email protected] (G. Van Hoey).
0272-7714/$ - see front matter � 2005 Elsevier Ltd. All rights reserved.
doi:10.1016/j.ecss.2005.03.022
increasing concern amongst managers and policy-makersabout the potential effects of biodiversity loss on the‘functioning’ of ecological systems, in particular thegoods and services, which they provide (Daily, 1997).There are indications that biodiversity can have significanteffects on ecosystem processes, although these effectstend to be mediated through functional traits, ratherthan species richness per se (Raffaelli et al., 2003). Themeasurement and assessment of biodiversity howeverdepend on spatial scale, and a comparison of onlya few sites between areas is insufficient (Ellingsen, 2001).A detailed knowledge of community diversity and

752 G. Van Hoey et al. / Estuarine, Coastal and Shelf Science 64 (2005) 751e763
differences within a single habitat type is needed todifferentiate among habitats (Ellingsen, 2001) and toinvestigate its naturalness.
One of the ecologically most important soft-sedimentmacrobenthic communities along the coastal areas of theEnglish Channel and Southern Bight of the North Sea isthe Abra alba community, which is characterized bya high diversity, abundance and biomass and typicallyoccurs in muddy fine sandy sediments (Jones, 1950;Glemarec, 1973; Cabioch and Glacon, 1975; Souplet andDewarumez, 1980; Kingston and Rachor, 1982; Prygielet al., 1988; Duineveld et al., 1991; Dewarumez et al.,1992; Kunitzer et al., 1992; Fromentin et al., 1996;Holtmann et al., 1996; Olivier et al., 1996; Sanvicente-Anorve et al., 1996; Fromentin et al., 1997; Thiebautet al., 1997; Dauvin, 1998; Degraer et al., 1999; Reeset al., 1999; Dauvin, 2000; Konstantinos et al., 2000,2001; Budd, 2002; Desroy et al., 2002; Sanvicente-Anorve et al., 2002; Dauvin et al., 2004; Van Hoeyet al., 2004). This type of habitat typically occurs in lowenergy zones nearby the coast (Larsonneur et al., 1982).
Several descriptions of the Abra alba community inthe European seas were made in the past three quartersof a century. From a limited assemblage of speciesdescribed by Petersen (1911, 1913, 1918), to differentspecific traits of the A. alba community at differentplaces have lead to several adopted characterizations ofthe community: ‘Echinocardium cordatumeVenus gallinacommunity (Ford, 1923), ‘boreal offshore muddy sandassociation’ (Jones, 1950), ‘A. alba community (Stripp,1969), associations ‘P’ and ‘M’ (Eagle, 1973, 1975), etc.
The Abra alba community is dominated by specieshaving a pelagic larval phase and shows importantannual changes in the pattern of recruitment of thedominant species (Dewarumez et al., 1986). Consequent-ly, it is characterized by short lived and fast growingspecies with a strong seasonal reproduction and bya high year-to-year variability (Gray et al., 1980; Arntzand Rumohr, 1986; Essink and Beukema, 1986; Beukemaet al., 1993; Turner et al., 1995). The most importantspecies are A. alba, Fabulina fabula, Lanice conchilega,Nephtys hombergii and Pectinaria koreni (Prygiel et al.,1988; Desroy et al., 2002; Van Hoey et al., 2004).
The Abra alba community is found in the EnglishChannel and Southern Bight of the North Sea, mostly inbays, estuaries and in a narrow zone along the coastline(Fromentin et al., 1997; Thiebaut et al., 1997; Rees et al.,1999; Konstantinos et al., 2000; Desroy et al., 2002;Dauvin et al., 2004). However, there is one largecontinuous distribution area of the A. alba community:the coastal area, from Cap Griz-Nez (France) overBelgium north to the Dutch coast (Vanosmael et al.,1982; Vermeulen and Govaere, 1983; Prygiel et al., 1988;Fromentin et al., 1997; Desroy et al., 2002). In thiscontinuous area gradual changes of the species compo-sition, abundance and diversity within the A. alba
community, related to the changing environment, aredocumented (Holtmann et al., 1996; Fromentin et al.,1996, 1997; Desroy et al., 2002; Van Hoey et al., 2004).
The Belgian part of this continuous area is verysuitable for investigating small-scale spatial changeswithin the Abra alba community characteristics, because(1) it is the central part of the continuous distributionarea, (2) the community has an aberrant distributionpattern along the Belgian coast compared to the otherareas, (3) a large dataset is available, and (4) a lot ofenvironmental factors (hydro-sedimentology, river out-flows, human pressure) influence the area.
The aim of this study is to investigate the geographicalpatterns (structural and functional level) within themacrobenthicAbra alba community at different scales: thecommunity’s distribution range in the English Channeland North Sea (i.e. large scale) and a selected area witha continuous distribution of the A. alba community (i.e.small scale) in relation to structuring environmentalvariables. This information will form a baseline forfuture comparisons and it will be contribute to a well-considered conservation of marine biodiversity in thecoastal areas.
2. Materials and methods
2.1. Study area
The study area covers the full Belgian ContinentalShelf (BCS) (2600 km2) situated in the Southern Bight ofthe North Sea. The BCS is characterized by the presenceof several sandbank systems: (1) Coastal Banks, parallelto the coastline, (2) Flemish Banks, about 10e30 kmoffshore of the western Belgian coast, (3) ZeelandBanks, some 15e30 km offshore of the eastern Belgiancoast, and (4) Hinder banks, about 35e60 km offshore(Degraer et al., 1999). Because of the presence of thesesandbank systems a high geomorphologic and sedimen-tological diversity is found (Degraer et al., 1999). Thephysical, chemical and biological characteristics of theBCS are responsible for a gradient from turbulent,nutrient rich inshore-waters to more transparent andless productive offshore-waters.
2.2. Data origin
Within the framework of several studies a total of1161 macrobenthos samples were collected at the BCSbetween 1994 and 2003. After analyzing this datasetwith different multivariate methods (Twinspan, ordina-tion, Cluster-analysis), as described in Van Hoey et al.(2004), 204 samples belonging to the same speciesassemblage, catalogued as the Abra albaeMysellabidentata community (further called the A. alba com-munity), were selected for this study. A species

753G. Van Hoey et al. / Estuarine, Coastal and Shelf Science 64 (2005) 751e763
assemblage was considered to represent a communitybecause of (1) their extreme position along the habitatgradient (depth, mud content and median grain size)and, consequently, (2) the absence of overlap betweenthe habitat of each species assemblage, based on theresults of the multivariate analyses (Van Hoey et al.,2004). This community description is based on twoapproaches to delineate communities (Morin, 1999):(1) physically, by discrete habitat boundaries, and (2)statistically, by patterns of assemblages among species.The discrimination of communities however is a merelyarbitrary abstraction of biological gradients: gradualtransitions between macrobenthic communities exist(Gray, 1981). Even within a single habitat type thereare small differences (Ellingsen, 2001), as will beinvestigated in this study for the A. alba community.The set of 204 samples (120 stations) retained bymultivariate analyses were accepted as representativefor the A. alba community. To avoid outbalancing ofstations that were sampled more than once between1994 and 2003 (i.e. temporal series), these stations wererepresented by one randomly selected sample. The finalreduced dataset, used for all analyses, thus containsinformation of 120 samples from 120 different stationsdistributed along the Belgian Coast and sampled overa 9-year period (Fig. 1). The mid-coastal area and thesouthwestern coastal area were sampled during the full9 years, whereas the northeastern coastal area was onlyrecently sampled (2000e2003).
The samples were taken with a Van Veen grab(sampling surface area: 0.1 m2) and sieved alive overa 1 mm mesh-sized sieve. Water depth at each samplingstation was recorded in situ and standardized to themean low water spring level (MLWS) using the M2reduction model (Coastal Waterways Division, FlemishCommunity). The grain size distribution of a sub-samplewas measured with a LS Coulter particle size analyzer:median grain size of the fraction 2e850 mm and mud
SCZ
MCZ
NCZ
01993 1994 1995 1996 1997
Sampling years1998 1999 2000 2001 2002 2003
10000
20000
30000
40000
Dis
tanc
e al
ong
the
coas
tline
(met
ers)
50000
60000
Fig. 1. The sampling years in function of the distance along the coast
(meters).
content (volume percentage !64 mm) were used asgranulometric variables.
After exclusion of species that were not sampledquantitatively (e.g. hyperbenthic and extremely raretaxa) and lumping taxa, because of inconsistentidentification throughout the different studies (e.g. genuslevel: Bathyporeia, Ensis, Spio and Harmothoe; familylevel: Cirratulidae), a set of 104 taxa (further referred toas species) was used for biological analyses.
2.3. Data analysis
2.3.1. MappingThe map of the BCS is rotated (angle a, parallel with
the coastline) to investigate the distribution gradient ofthe Abra alba community on the BCS on all the figures.The original calibration (UTM: Easting (m) between451408 and 520000 and Northing (m) between 5659860and 5728240) of the map was transformed as follows:the x-coordinates are recalculated by x#Zx cos aCy sina; the y-coordinates are recalculated by y#Z�x sin aCycos a. The recalculated x-coordinates (x#) now show thedistance along the coastline (0 m, FrencheBelgian border;65000 m, DutcheBelgian border), while the recalculatedy-coordinates ( y#) show the distance from the coastline(transformed into nautical miles, 0e38 miles).
2.3.2. DiversityThe different diversity patterns within the Abra alba
community were investigated by interpreting thek-dominance plots (Patil and Taillie, 1977; Lambsheadet al., 1983) and species-area plots (Connor and McCoy,1979).
Univariate measures of diversity were species rich-ness (S ), the exponential form of the ShannoneWienerindex (exp H#) (log base 2) and the reciprocal ofSimpson’s index (1/Simpson) (Whittaker, 1972; Magur-ran, 1988). Hill (1973) labeled these diversity measuresN0, N1 and N2, respectively. S is the number of allspecies regardless of abundance. exp H# is most affectedby species in the middle of the species rank sequence,whereas 1/Simpson is primarily a measure of dominance(Whittaker, 1972).
2.3.3. Functional diversityFunctional diversity along the distribution gradients
was examined by comparing distribution patterns offeeding guilds (obligatory deposit feeders, facultativedeposit-filter feeders, obligatory filter feeders, predatorsand omnivores) and mobility classes (non tube-buildingsedentary, tube-building sedentary and mobile species)of the species (Table 1).

754 G. Van Hoey et al. / Estuarine, Coastal and Shelf Science 64 (2005) 751e763
3. Results
3.1. Distribution of the Abra albacommunity at the BCS
The Abra alba community was found in muddy, finesandy sediments with an average median grain size of227 mm (G47 mm (SD)). The sediment composition wascharacterized by the dominance of the fine sand fraction(average 49%, Fig. 2a) combined with a low, thoughsignificant, mud fraction (9% clay and silt) and coarsesand fraction had much lower contributions (!5%).The community could be found at depths between 4 mand 29 m (average depth of 15 m).
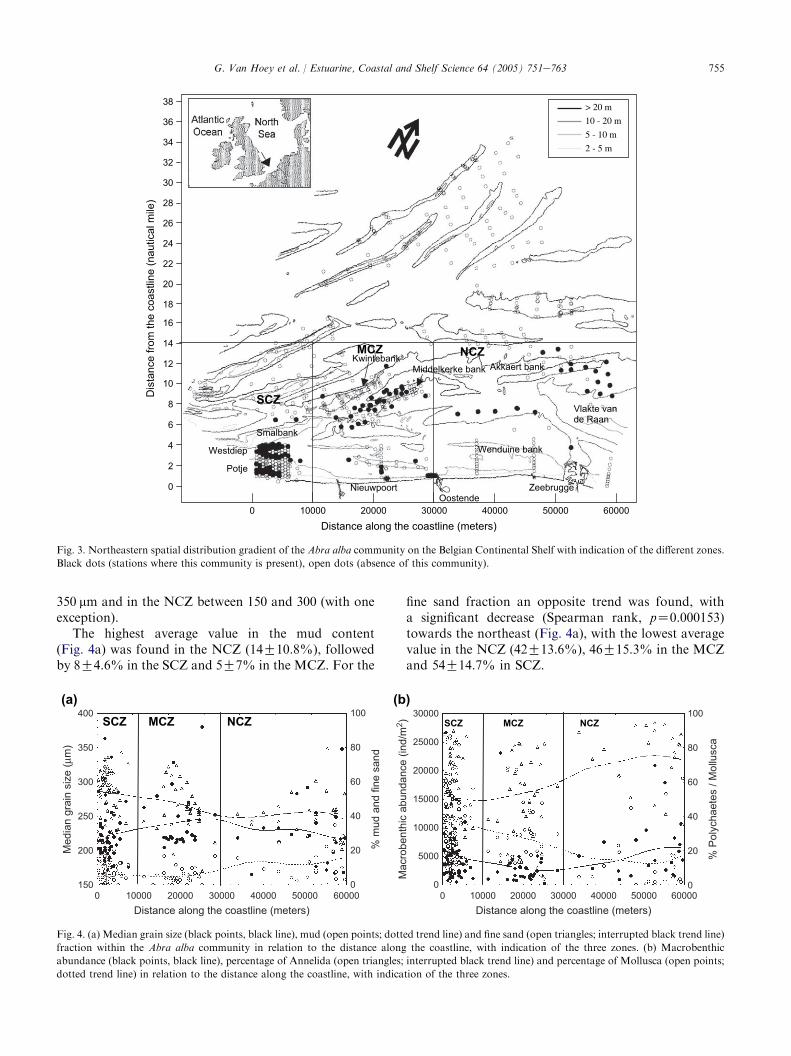
These sedimentological characteristics and the associatedAbra alba community could be found in the sandbankgullies along the whole Belgian coastal zone, with a moreoffshore distribution towards the northeast (Fig. 3).Southwest of Nieuwpoort, the community was foundclose to the coastline, especially in theWestdiep and Potjegullies as well as on two spots in the Smalbank gully (thesouthwestern coastal zone; hereafter abbreviated asSCZ). The mid-coastal zone (hereafter abbreviated as
Table 1
Feeding-classes and their abbreviations (Holtmann et al., 1996;
Fauchald and Jumars, 1979; Hartmann-Schroder, 1996) and the
mobility classes and their abbreviations (Hartmann-Schroder, 1996;
Hayward and Ryland, 1995)
Feeding guilds Mobility
Abbreviation Description Abbreviation Description
D Deposit feeder S Non-tube-building
sedentary species
DF Deposit feederC
filter feeder
M Mobile species
P Predator T Tube-building
sedentary species
O Omnivor
F Filter feeder
MCZ) contained stations situated in the gully betweenthe Middelkerke bank and Kwintebank, as well asstations on the southwestern part of the Middelkerkebank. More to the northeast (the northeastern coastalzone; hereafter abbreviated as NCZ), the community hada more offshore distribution along the gullies of the‘Wenduine bank’ and the ‘Akkaert bank’ and at the northof the ‘Vlakte van de Raan’. The A. alba communitywas not detected beyond the 14-mile zone on the BCS.The community was also found at five stations nearby thecoastline at the northeast of Nieuwpoort (around theStroombank and at the border of the gully of Zeebrugge).
On the BCS the Abra alba community was character-ized by an abundance fluctuating between 129 and 26697ind/m2 (average of 4727 ind/m2) and a species richnessfluctuating between 9 and 52 sp./0.1 m2 (average of 28sp./0.1 m2). There were no species spanning the wholesampling area (Fig. 2b). Only eight species (Spiophanesbombyx, Nephtys hombergii, Phyllodoce mucosa, A. alba,Scoloplos armiger,Mysella bidentata andFabulina fabula)were represented in more than 75% of the samples, withS. bombyx themost commonly found (91%of the samples).Conversely, 66 species, or 54% of the total number ofspecies (122), were restricted to less than 10% of thesamples, with 18 species restricted to one site. These 18species were excluded from further analysis, as describedabove.
3.2. Geographical patterns in communitystructure at the BCS
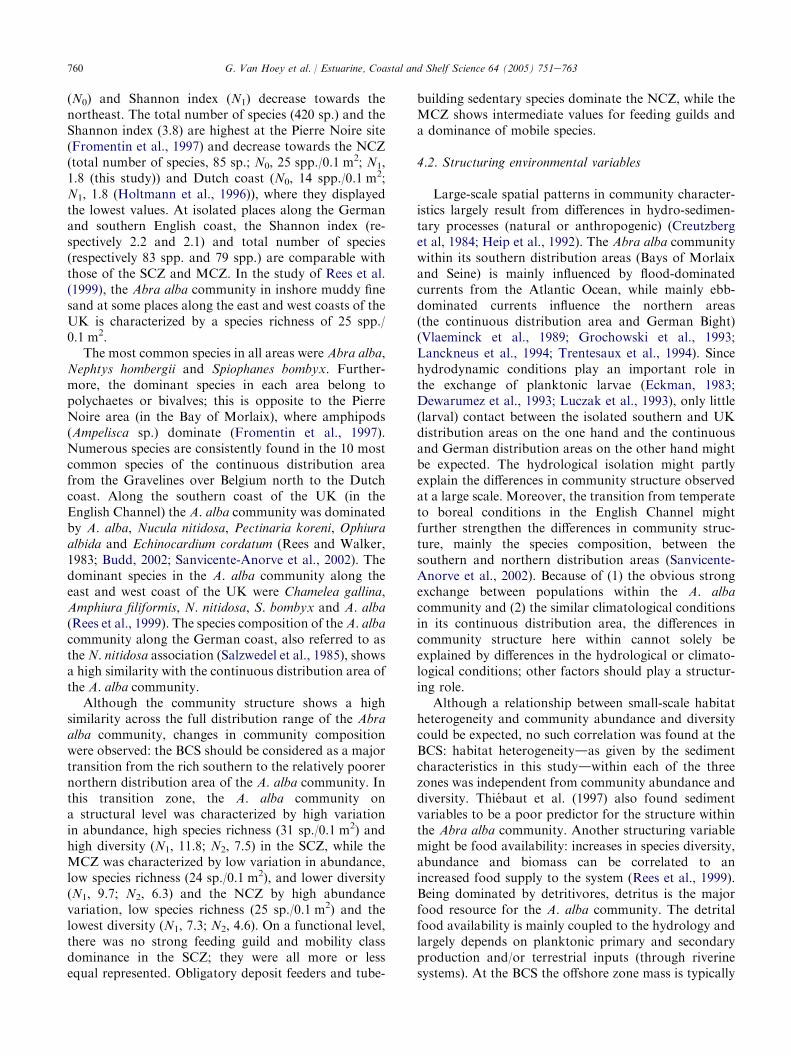
3.2.1. Sedimentological characteristicsThe average median grain size was highest at the
MCZ (249G38 mm (SD)) compared to the SCZ(219G43 mm) and the NCZ (222G45 mm) (Fig. 4a). Inthe SCZ the median grain size range was situatedbetween 150 and 350 mm, in the MCZ between 200 and
silt
clay
100 350
med
ian
grai
n si
ze (µ
m)
300
250
200
150
100
50
0
sedi
men
t fra
ctio
n (%
) 80
60
40
20
0
veryfinesand
finesand
mediumsand
coarsesand
median grain size
0
20
40
60
80
100
120
140
1 15 22 29 36 43 50 57 64 71 78 85 92 99 106113120number of sites
num
ber o
f spe
cies
10%
25%
50%75%
8
Fig. 2. (a) The sediment fraction (left) and the median grain size (right) of the Abra alba community. Median (symbol)Gpercentiles (25e75%)
(Boxes) and non-outlier range (minemax) (Whiskers). (b) Distribution of species range size, which is the number of stations occupied by a species out
of a total of 120 sites, with indication of the points representing 10, 25, 50 and 75% of the total stations.
755G. Van Hoey et al. / Estuarine, Coastal and Shelf Science 64 (2005) 751e763
0 10000 40000 50000 6000020000 30000
0
4
8
6
2
10
32
30
28
26
24
22
20
18
16
14
12
38
36
34D
ista
nce
from
the
coas
tline
(nau
tical
mile
)
Distance along the coastline (meters)
SCZ
NCZMCZ
OostendeNieuwpoort Zeebrugge
> 20 m
10 - 20 m
5 - 10 m
2 - 5 m
Westdiep
Potje
Smalbank
KwintebankMiddelkerke bank
Wenduine bank
Vlakte vande Raan
Akkaert bank
Fig. 3. Northeastern spatial distribution gradient of the Abra alba community on the Belgian Continental Shelf with indication of the different zones.
Black dots (stations where this community is present), open dots (absence of this community).
350 mm and in the NCZ between 150 and 300 (with oneexception).
The highest average value in the mud content(Fig. 4a) was found in the NCZ (14G10.8%), followedby 8G4.6% in the SCZ and 5G7% in the MCZ. For the
fine sand fraction an opposite trend was found, witha significant decrease (Spearman rank, pZ0.000153)towards the northeast (Fig. 4a), with the lowest averagevalue in the NCZ (42G13.6%), 46G15.3% in the MCZand 54G14.7% in SCZ.
SCZ MCZ NCZ
(a)
400
350
300
250
Med
ian
grai
n si
ze (µ
m)
% m
ud a
nd fi
ne s
and
200
1500
100
80
60
40
20
010000 20000 30000
Distance along the coastline (meters)40000 50000 60000
SCZ MCZ NCZ
(b)
Mac
robe
nthi
c ab
unda
nce
(ind/
m2 )
% P
olyc
haet
es /
Mol
lusc
a30000 100
80
60
40
20
0
25000
20000
15000
10000
5000
00 10000 20000
Distance along the coastline (meters)30000 40000 50000 60000
Fig. 4. (a) Median grain size (black points, black line), mud (open points; dotted trend line) and fine sand (open triangles; interrupted black trend line)
fraction within the Abra alba community in relation to the distance along the coastline, with indication of the three zones. (b) Macrobenthic
abundance (black points, black line), percentage of Annelida (open triangles; interrupted black trend line) and percentage of Mollusca (open points;
dotted trend line) in relation to the distance along the coastline, with indication of the three zones.

756 G. Van Hoey et al. / Estuarine, Coastal and Shelf Science 64 (2005) 751e763
3.2.2. Biological characteristics
3.2.2.1. Multivariate analysis. Multivariate analysis (de-trended correspondence analyses, DCA) clearly visual-izes the differences in community organization along thegradient, with minor overlap between the areas SCZ,MCZ and NCZ (Fig. 5).
3.2.2.2. Abundance, higher taxa, species dominance. Themacrobenthic density across the three zones was highestin SCZ (average of 5181 ind/m2) and NCZ (5941ind/m2), with a drop in MCZ (average of 3010 ind/m2)(Fig. 4b). The variation in macrobenthic density ishigher in the SCZ and NCZ, than in the MCZ.
In SCZ, molluscs and annelids were equally dominantin the macrobenthos (Fig. 4b). The molluscs, mainlybivalves, strongly decline (Spearman rank, pZ0.000006)in relative abundance towards the northeast, whileannelids (mainly polychaetes) strongly increase (Spear-man rank, pZ0.01) in dominance. This was also visiblein the list of the ten most abundant species (Table 2),where bivalves were missing in the NCZ.
When comparing the lists of the ten most commonspecies (Table 2), a shift in species composition fromsouthwest to northeast could be observed. There wereonly four species (Spiophanes bombyx,Nephtys hombergii,Scoloplos armiger and Phyllodoce mucosa) in common inthe top ten species list of the three areas, which werepresent in more than 80% (SCZ and MCZ) or 90%(NCZ) of the samples within each area. Additionally, theSCZ had another four dominant species (Abra alba,Cirratulidae spp., Mysella bidentata and Fabulina fabula)in common with MCZ. These species were also present inNCZ but in much lower abundances. MCZ had only oneother species (Actinaria spp.) in common with NCZ. Thetube building polychaete Lanice conchilega was present inalmost all samples at SCZ (Table 2). NCZ was alsocharacterized by five dominant species, which were notcommon in the other areas (Eteone longa, Pariambustypicus, Eumida sanguinea, Owenia fusiformis and Pecti-naria koreni). In terms of species composition, SCZ
0
40
80
120
160
200
0 40 80 120 160 200 240
Fig. 5. DCA ordination plot along the first two axes. The
discrimination of the three zones (triangle, SCZ; open points, MCZ;
black points, NCZ) is made.
showed more similarity with MCZ and NCZ differs fromthe SCZ and MCZ.
3.2.2.3. Diversity. The species dominance curve identi-fied NCZ to be strongly different from the two otherzones (Fig. 6a), indicating a lower diversity and a strongdominance of one species, in this case Spiophanes bombyx.The species dominance plots for the two other zones weremore or less similar, with a similar ranking of speciescontribution to the abundance. The species area plots(Fig. 6b) of the NCZ and MCZ were similar, whereasthe plot of the SCZ was clearly different, indicatinghigher species richness for the same sampling area.
The number of species per sample (N0) was highest atSCZ (31 spp./0.1 m2), compared to the NCZ and MCZwith respectively 24 and 25 spp./0.1 m2 (Fig. 7a). N1 andN2 both follow the same pattern, with a decline(Spearman rank: p!0.01 for both) towards the NCZ,especially in the most northeastern part of it, caused bystrong species dominance in this area (Fig. 7b). N1 washighest in the SCZ (average 11.8) and lowest in the NCZ(average 7.3), with an intermediate value at the MCZ(average 9.7). N2 was also highest in the SCZ (average7.5) and lowest in the NCZ (average 4.6), with anintermediate value at the MCZ (average 6.3).
3.2.2.4. Functional biodiversity. The obligatory depositfeeders were the dominating feeding guild in the NCZ(61%), followed by predators (16%) (Fig. 8a,b). Theobligatory deposit and filter feeders as well as thefacultative deposit-filter feeders were almost equallydominating in the SCZ and MCZ, with respectively 38%and 37% for obligatory deposit feeders, 21% and 26%for obligatory filter feeders and 28% and 17% forfacultative deposit-filter feeders.
In the NCZ there was a strong dominance of tube-building sedentary polychaetes (61%), such as Spiophanesbombyx, Owenia fusiformis, Lanice conchilega andPectinaria koreni (Fig. 7b). This mobility class was lessrepresented in the MCZ (17%), where the mobile specieswere dominating (46%). In the SCZ the non tube-building sedentary polychaetes formed the dominatinggroup (44%).
3.2.2.5. Habitat heterogeneity. Within the habitat of theAbra alba community at the three zones on the BCS therewas no correlation between community structure (mac-robenthic species richness and density) and granulometry(sedimentmedian grain size andmud content) (SpearmanR: pO0.1) (Fig. 9).
4. Discussion
The Abra alba community forms a well-establishedfaunal unity in coastal areas of the North Sea(Dewarumez et al., 1986), where it is mostly found in

sh Channel and Southern North Sea, where the Abra alba
; the species in brackets are present in both the MCZ and
Dutch coast German coast English coast
English channel
.1 m2) - - - - - - - - - - - - - - - - - - - - - - - - - Rallier-du-Baty
dredge
194 14 10
- - - - - - - - - - - - - - - - - Isolated Isolated
196.7 G 54.8 Muddy fine
sand
Muddy fine
sand
7.2 G 12
12 G 4.5 13-45 !10
2556 G 3458 3828 6304
83 79
14 G 7 37
1.84 2.2 2.1 G 0.46
Mean
abundance
Mean
abundance
% of total
abundance
Spisula
subtruncata
Nucula nitidosa Abra alba
Magelona
johnstoni
Spiophanes
bombyx
Nucula nitidosa
Spiophanes
bombyx
Ophiura albida Melinna
palmata
Urothoe
poseidonis
Mysella
bidentata
Mysella
bidentata
Macoma
balthica
Nephtys
hombergii
Notomastus
latericeus
Fabulina fabula Phoronis sp. Nephtys
hombergii
Mysella
bidentata
Ophiura
ophiura
Euclymene
oerstedii
Scoloplos
armiger
Scoloplos
armiger
Magelona alleni
.] Nepthys
hombergii
Abra alba
Nepthys cirrosa Pectinaria
koreni
Holtmann
et al., 1996
Salzwedel et al.,
1985
Sanvicente-
Anorve et al.,
2002
Table 2
Overview of the community parameters (abundance, diversity, species top 10), sedimentology and sampling method of different areas in the Engli
community occurs. Species in bold occur in the top 10 of the three zones on the BCS. The underlined species are present in both the SCZ and MCZ
the NCZ.
French coast Belgian coast
Pierre Noire Riviere de
Morlaix
Baie de Seine Gravelines SCZ MCZ NCZ
Sampling method - - - - - - - - - - - - - - - - - - -Smith-McIntyre grab (0.1 m2)- - - - - - - - - - - - - - - - - - - - - - - - - - - - - - - - - - - - - - - - - - - -Van Veen Grab (0
No of samples 117 77 38 81 61 32 22
Type of area Isolated Isolated Isolated - - - - - - - - - - - - - - - - - - - - - - - - - - - - - - -One continuous area- - - - - - - - -
Median grain size
(mm)
148e184 77e122 80e120 100e150 219 G 43 249 G 38 222 G 45
Mud content (%) 8 G 6 5 G 4 14 G 11
Depth (m) 17 10 10.5 10 11.5 17.7 10.8
Density (ind/m2) 7545 G 1641 3320 G 402 5380 G 848 5080 G 1965 5181 G 4542 3010 G 3909 5941 G 5254
Total no of sp. 420 308 130 154 118 89 85
Diversity (No) 32 31 G 8 24 G 7 25 G 6
Diversity (N1) 3.8 2.9 3.2 2.4 2.4 2.17 1.83
Species top 10
based on
% of total
abundance
% of total
abundance
% of total
abundance
% of total
abundance
Mean
abundance
Mean
abundance
Mean
abundance
Species top 10
(ind/m2)
Ampelisca
armoricana
Chaetozone
setosa
Owenia
fusiformis
Lanice
conchilega
Abra alba Mysella
bidentata
Spiophanes
bombyx
Ampelisca
sarsi
Melinna
palmata
Acrocnida
brachiata
Abra alba Spiophanes
bombyx
[Actiniaria sp.] Nephtys
hombergii
Polydora
pulchra
Polydora
pulchra
Pectinaria
koreni
Spiophanes
bombyx
Lanice
conchilega
Phyllodoce
mucosa
Phyllodoce
mucosa
Spio decoratus Nephtys
hombergii
Mysella
bidentata
Fabulina fabula Cirratulidae sp. Nephtys
hombergii
Scoloplos
armiger
Paradoneis
armata
Mediomastus
fragilis
Aphelochaeta
marioni
Eumida
sanguinea
Mysella
bidentata
Abra alba Eteone longa
Chaetozone
setosa
Tharyx
marioni
Abra alba Phyllodoce
mucosa
Nephtys
hombergii
Fabulina fabula Pariambus
typicus
Marphysa
bellii
Euclymene
oerstedii
Cultellus
pellucidus
Nephtys
hombergii
Scoloplos
armiger
Scoloplos
armiger
Eumida
sanguinea
Urothoe
pulchella
Lanice
conchilega
Pholoe minuta Pectinaria
koreni
Phyllodoce
mucosa
Spiophanes
bombyx
Owenia
fusiformis
Aricidea fragilis Thyasira
flexuosa
Magelona
mirabilis
Notomastus
latericeus
Fabulina fabula Capitella
capitata
[Actiniaria sp
Nephtys
hombergii
Abra alba Nephtys
hombergii
Macoma
balthica
Oligochaeta
spp.
Cirratulidae
spp.
Pectinaria
koreni
Literature Fromentin
et al., 1997
Fromentin
et al., 1997
Fromentin
et al., 1997
Fromentin
et al., 1997;
Dewarumez
et al., 1992

758 G. Van Hoey et al. / Estuarine, Coastal and Shelf Science 64 (2005) 751e763
(a)
100
Cum
ulat
ive
Dom
inan
ce % 80
60
40
20
01 10
Species rank100
0102030405060708090
100
0 2
Area (m2)
Cum
ulat
ive
num
ber o
f spe
cies
(b)
1 3 4 5 6
Fig. 6. (a) Species dominance plot at the three zones (SCZ, black triangle; MCZ, open circles; NCZ, black points). (b) Species area plot for the three
zones (similar symbols as (a)).
bays, estuaries and in a narrow zone along the coastline,mostly between 0 and 10 m depth (Souplet andDewarumez, 1980; Konstantinos et al., 2000) and thusstrongly influenced by terrestrial organic matter inputs(Sanvicente-Anorve et al., 2002).
The largest continuous distribution area of the Abraalba community is situated along the northeastern coastof France (Gravelines) over Belgium north to the Dutchcoast (Kingston and Rachor, 1982; Vanosmael et al.,1982; Vermeulen and Govaere, 1983; Prygiel et al., 1988;Holtmann et al., 1996; Fromentin et al., 1997; Desroyet al., 2002; Van Hoey et al., 2004). Next to thiscontinuous distribution area, there are a lot of isolateddistribution areas in the English Channel, such as theBay of Morlaix with two small (6 and 2 km2) spots,respectively Pierre Noire and Riviere de Morlaix, theBay of the Seine (Cabioch and Glacon, 1975; Soupletand Dewarumez, 1980; Fromentin et al., 1997; Thiebaut
et al., 1997), some bays (Eagle, 1975; Rees and Walker,1983) and coastal areas near the UK coast (St Andrewsand Aberdeenshire, Cumberland coast, South-WestEngland and some locations in the Irish Sea) (Reeset al., 1999; Sanvicente-Anorve, 2002) and a small areain the German Bight of the North Sea, seaward of therivers Elbe and Weser (area of 1000 km2) (Stripp, 1969;Kingston and Rachor, 1982; Salzwedel et al., 1985). TheA. alba community is further present along the Atlanticcoast of France, Spain and Portugal, and in theMediterranean Sea. Yet, the community structurewithin these areas falls out the scope of this study.
4.1. Geographical patterns in community structure
Although the community’s habitat is characterizedby fine, muddy sands throughout its distributionrange (Table 2), it is clear that minor differences in
SCZ MCZ NCZ
(a)
6024
20
16
12
8
4
0
spec
ies
richn
ess
50
40
30
20
10
0
N1;
N2
0 10000 20000 30000 40000 50000Distance along the coastline (meters)
60000
SCZ MCZ NCZ
(b)
100
%
80
60
40
20
00 10000 20000 30000 40000 50000
Distance along the coastline (meters)60000
Fig. 7. (a) The distribution of the different diversity indices in relation to the distance along the coastline: Species richness: N0, black circles, solid
trend line; exponential form of H#: N1, open circles, dotted trend line; the reciprocal of the Simpson’s index: N2, open triangles, interrupted black
trend line. (b) The relative abundance of the different mobility classes: sedentary species (S): black points, black trend line; mobile species (M): open
triangles, interrupted black trend line; tube-building species (T): open circles, dotted trend line.

759G. Van Hoey et al. / Estuarine, Coastal and Shelf Science 64 (2005) 751e763
SCZ MCZ NCZ SCZ MCZ NCZ
(a) (b)
100
%
80
60
40
20
0
60
%
50
40
30
20
10
00 10000 20000 30000 40000 50000
Distance along the coastline (meters)60000 0 10000 20000 30000 40000 50000 60000
Distance along the coastline (meters)
Fig. 8. (a) The distribution of the relative abundance of different feeding guilds: facultative deposit-filter feeders (DF): open triangles, interrupted
black trend line; obligatory filter feeders (F): black circles, solid trend line; obligatory deposit feeders (D): open circles, dotted trend line. (b) The
distribution of the relative abundance of different feeding guilds: predators (P): black circles, black trend line; and omnivores (O): open circles, dotted
trend line.
sedimentological characteristics occur (Salzwedel et al.,1985; Holtmann et al., 1995; Fromentin et al., 1997;Sanvicente-Anorve et al., 2002). The Abra alba com-munity is mostly found at depths of 0e20 m; the deepestare found along the German coast (45 m) (Salzwedelet al., 1985), MCZ (18 m) and the Pierre Noire site(17 m) (Fromentin et al., 1997).
The highest mean abundance was found at the PierreNoire area (7545 ind/m2) (Fromentin et al., 1997) andthe lowest at the Dutch coast (2556 ind/m2) (Holtmannet al., 1996) (Table 2). Abundance, however, is a strongly
varying community parameter, depending on meteoro-logical conditions (wind) and currents, which can induceunpredictable year-to-year changes in the abundance ofsome species. Moreover, new recruits are able to formpatches of high abundances after a disturbance (Desroyet al., 2002). High variations in abundance characterizemost areas only the Bay of the Seine shows a great temporalstability in abundances, due to the high larval retentioncapacity of the bay (Thiebaut et al., 1992, 1996).
There is a clear pattern in the diversity between thedifferent sites: total number of species, species richness
(a) (b)
150 200 250 300 350 400 150 200 250 300 350 400
0
5
10
15
20
25
30
35
40
Mud
con
tent
(%)
Median grain size (µm)
Fig. 9. The species richness (N0) and abundance (ind/m2) in relation to the sedimentological characteristics (median grain size (mm) and mud content
(%)), with indication of the three zones: SCZ, black triangles; MCZ, open circles; NCZ, black circles. (a) Species richness (species/0.1 m2): 9e23;
23e29; 29e36; 36e53, (b) Abundance (ind/m2); !2000; 2000e5000; 5000e10000; 10000e27000.
760 G. Van Hoey et al. / Estuarine, Coastal and Shelf Science 64 (2005) 751e763
(N0) and Shannon index (N1) decrease towards thenortheast. The total number of species (420 sp.) and theShannon index (3.8) are highest at the Pierre Noire site(Fromentin et al., 1997) and decrease towards the NCZ(total number of species, 85 sp.; N0, 25 spp./0.1 m2; N1,1.8 (this study)) and Dutch coast (N0, 14 spp./0.1 m2;N1, 1.8 (Holtmann et al., 1996)), where they displayedthe lowest values. At isolated places along the Germanand southern English coast, the Shannon index (re-spectively 2.2 and 2.1) and total number of species(respectively 83 spp. and 79 spp.) are comparable withthose of the SCZ and MCZ. In the study of Rees et al.(1999), the Abra alba community in inshore muddy finesand at some places along the east and west coasts of theUK is characterized by a species richness of 25 spp./0.1 m2.
The most common species in all areas were Abra alba,Nephtys hombergii and Spiophanes bombyx. Further-more, the dominant species in each area belong topolychaetes or bivalves; this is opposite to the PierreNoire area (in the Bay of Morlaix), where amphipods(Ampelisca sp.) dominate (Fromentin et al., 1997).Numerous species are consistently found in the 10 mostcommon species of the continuous distribution areafrom the Gravelines over Belgium north to the Dutchcoast. Along the southern coast of the UK (in theEnglish Channel) the A. alba community was dominatedby A. alba, Nucula nitidosa, Pectinaria koreni, Ophiuraalbida and Echinocardium cordatum (Rees and Walker,1983; Budd, 2002; Sanvicente-Anorve et al., 2002). Thedominant species in the A. alba community along theeast and west coast of the UK were Chamelea gallina,Amphiura filiformis, N. nitidosa, S. bombyx and A. alba(Rees et al., 1999). The species composition of theA. albacommunity along the German coast, also referred to asthe N. nitidosa association (Salzwedel et al., 1985), showsa high similarity with the continuous distribution area ofthe A. alba community.
Although the community structure shows a highsimilarity across the full distribution range of the Abraalba community, changes in community compositionwere observed: the BCS should be considered as a majortransition from the rich southern to the relatively poorernorthern distribution area of the A. alba community. Inthis transition zone, the A. alba community ona structural level was characterized by high variationin abundance, high species richness (31 sp./0.1 m2) andhigh diversity (N1, 11.8; N2, 7.5) in the SCZ, while theMCZ was characterized by low variation in abundance,low species richness (24 sp./0.1 m2), and lower diversity(N1, 9.7; N2, 6.3) and the NCZ by high abundancevariation, low species richness (25 sp./0.1 m2) and thelowest diversity (N1, 7.3; N2, 4.6). On a functional level,there was no strong feeding guild and mobility classdominance in the SCZ; they were all more or lessequal represented. Obligatory deposit feeders and tube-
building sedentary species dominate the NCZ, while theMCZ shows intermediate values for feeding guilds anda dominance of mobile species.
4.2. Structuring environmental variables
Large-scale spatial patterns in community character-istics largely result from differences in hydro-sedimen-tary processes (natural or anthropogenic) (Creutzberget al, 1984; Heip et al., 1992). The Abra alba communitywithin its southern distribution areas (Bays of Morlaixand Seine) is mainly influenced by flood-dominatedcurrents from the Atlantic Ocean, while mainly ebb-dominated currents influence the northern areas(the continuous distribution area and German Bight)(Vlaeminck et al., 1989; Grochowski et al., 1993;Lanckneus et al., 1994; Trentesaux et al., 1994). Sincehydrodynamic conditions play an important role inthe exchange of planktonic larvae (Eckman, 1983;Dewarumez et al., 1993; Luczak et al., 1993), only little(larval) contact between the isolated southern and UKdistribution areas on the one hand and the continuousand German distribution areas on the other hand mightbe expected. The hydrological isolation might partlyexplain the differences in community structure observedat a large scale. Moreover, the transition from temperateto boreal conditions in the English Channel mightfurther strengthen the differences in community struc-ture, mainly the species composition, between thesouthern and northern distribution areas (Sanvicente-Anorve et al., 2002). Because of (1) the obvious strongexchange between populations within the A. albacommunity and (2) the similar climatological conditionsin its continuous distribution area, the differences incommunity structure here within cannot solely beexplained by differences in the hydrological or climato-logical conditions; other factors should play a structur-ing role.
Although a relationship between small-scale habitatheterogeneity and community abundance and diversitycould be expected, no such correlation was found at theBCS: habitat heterogeneitydas given by the sedimentcharacteristics in this studydwithin each of the threezones was independent from community abundance anddiversity. Thiebaut et al. (1997) also found sedimentvariables to be a poor predictor for the structure withinthe Abra alba community. Another structuring variablemight be food availability: increases in species diversity,abundance and biomass can be correlated to anincreased food supply to the system (Rees et al., 1999).Being dominated by detritivores, detritus is the majorfood resource for the A. alba community. The detritalfood availability is mainly coupled to the hydrology andlargely depends on planktonic primary and secondaryproduction and/or terrestrial inputs (through riverinesystems). At the BCS the offshore zone mass is typically

761G. Van Hoey et al. / Estuarine, Coastal and Shelf Science 64 (2005) 751e763
characterized by low productive and more transparentwaters, whereas turbid, highly productive waters char-acterize the coastal zone (Lancelot et al., 1986). The highturbidity and productivity of the coastal zone mainlyresult from the strong terrestrial input of suspendedmatter and nutrients from the rivers Westerscheldt andYzer. The turbidity plume of the Westerscheldt can,depending on the wind direction, intensity and duration,reach as far as the Cap Gris Nez (northern France)(Cabioch and Glacon, 1975), thus influencing the wholesouthern part of the continuous distribution area of theA. alba community. Smaller rivers, such as the Yzer,have lower riverine inputs in the coastal zone, but maybe locally significant in structuring the A. alba commu-nity: higher diversity, abundance and biomass wereobserved in the vicinity of river outflows (Seine, Somme,Authie, Canche) (Desroy et al., 2002). The increasedfood availability in the coastal zone, due to riverineinputs of suspended matter and nutrients might thus beresponsible for the high diversity and abundance of theA. alba community in the southern part of itscontinuous distribution area (Graveline north to SCZ)in contrast to the lower diversity and abundance in moreoffshore areas (e.g. MCZ).
Despite the general positive influence of river out-flows on the Abra alba community, a clear decrease indiversity was observed in the NCZ, offshore of theWesterscheldt estuary. This decrease in diversity co-incides with a functional community shift towardsa dominance of deposit feeders, an increase in predatorsand the expense of filter feeders. It is hypothesized thatthis decrease in diversity and functional community shiftmight be due to the outflow of suspended matter fromlarger rivers being too high to support rich populationsof filter feeding species, as already demonstrated bySnelgrove and Butman (1994). The excess in suspendedmatter input from the Westerscheldt might also explainthe (near) absence of the A. alba community in theBelgian inshore waters south of the river mouth(NieuwpoorteZeebrugge; less than four nautical milesoffshore). This area is dominated by the Macomabalthica community (less diverse), where A. alba is alsopresent, but in much lower abundance (Van Hoey et al.,2004). More offshore the distribution of the A. albacommunity was limited by the occurrence of coarsersediments (due to strong offshore currents) in the gulliesfurther than ten nautical miles to the southwest and 14nautical miles to the northeast of the coastline (VanHoey et al., 2004). Since the A. alba community alongthe Dutch and German coast is also confronted withlarge rivers, such as Rhine, Meuse, Elbe and Weser, itmight also explain the relatively low diversity andabundance in the whole northern part of the continuousdistribution area. Yet, also other factors, such as salinityand pollution can have an effect on the communitystructure in the proximity of a river (Thiebaut et al.,
1997; Ysebaert et al., 2003). An inshoreeoffshoregradient of salinity can significantly affect the distribu-tion of species, which are commonly considered to bestenohaline (Strickle and Diehl, 1987), but the absenceof such species was (e.g. Echinoderms) not observed inthis study. The study of Lacroix et al. (2004) confirmsthat the impact of the Westerscheldt on the salinity inthe Belgian coastal area is minimal. Although pollutionis known to impact the distribution of some species inthe Westerscheldt (Ysebaert et al., 2003), such effectswere not yet investigated further offshore.
Acknowledgements
The major part of the data was obtained throughdifferent research projects: (1) ‘Structural and FunctionalBiodiversity of North Sea ecosystems’ funded by OSTC(Federal Office for Scientific, Technical and CulturalAffairs, Belgium; project number: MN/DD40), (2)‘Intensive evaluation of the evolution of a protectedbenthic habitat (HABITAT)’ funded by OSTC (projectnumber: MN/02/89) and AWK (Coastal WaterwaysDivision; dossier numbers: 99380 and 200.455), (3)‘Ecological adjustment of a coastal defense project’funded by AMINAL (Flemish administration responsi-ble for environment, nature, land and water manage-ment, department Nature; project number: AN/1995/nr3) and AWK (dossier number: 97190) and (4) ‘Thespatial-temporal variability and population dynamics ofthe Abra albaeMysella bidentata community on theBCS’ funded by IWT (Institute for the Promotion ofInnovation by Science and Technology in Flanders,project number SB-011400).
The authors want to thank everybody who assisted inanalyzing the macrobenthos samples (e.g., Klaas De-neudt, Mercedes Erdey, Katlijn Taveniers, JohanCoenjaerts, Annick Van Kenhove) and the sedimento-logical samples (e.g., Danielle Schram, Annick VanKenhove, Dirk Vangansbeke, Myriam Beghyn).
References
Arntz, W.E., Rumohr, H., 1986. Fluctuations of benthic macrofauna
during succession and in an established community. Meeresfor-
schungen 31, 97e114.Beukema, J.J., Essink, K., Michaelis, H., Zwarts, L., 1993. Year-to-
year variability in the biomass of macrobenthic animals on tidal
flats of the Wadden Sea: How predictable is this food source for
birds? Netherlands Journal of Sea Research 31, 319e330.
Budd, G.C., 2002. Abra alba, Nucula nitida and Corbula gibba in
cricalittoral muddy sand or slightly mixed sediment. Marine Life
information network: Biology and Sensitivity Key Information
Sub-Programme (on-line). Marine Biological Association of the
United Kingdom, Plymouth (cited 29/11/02). Available from:
http://www.marlin.ac.uk.
Cabioch, L., Glacon, R., 1975. Distribution des peuplements benthi-
ques en Manche orientale de la Baie de Somme au Pas-de-Calais.

762 G. Van Hoey et al. / Estuarine, Coastal and Shelf Science 64 (2005) 751e763
Comptes Rendus Hebdomadaires des Seances de l’Academie des
Sciences Serie D 280, 491e494.
Connor, E.F., McCoy, E.D., 1979. The statistics and biology of
the species-area relationship. The American Naturalist 113,
791e833.
Creutzberg, F., Wapenaar, P., Duineveld, G., Lopez Lopez, N., 1984.
Distribution and density of benthic fauna in the southern North
Sea in relation to bottom characteristics and hydrographic
conditions. Journal du Conseil International pour l’Exploration
de la Mer 183, 101e110.
Daily, G.C., 1997. Nature’s Services: Societal Dependence on Natural
Ecosystems. Island Press, Washington, DC, 392 pp.
Dauvin, J.C., 1998. The fine sand Abra alba community of the Bay of
Morlaix twenty years after the Amoco Cadiz oil spill. Marine
Pollution Bulletin 36 (9), 669e676.Dauvin, J.C., 2000. The muddy fine sand Abra albaeMelinna palmata
community of the Bay of Morlaix twenty years after the Amoco
Cadiz oil spill. Marine Pollution Bulletin 40 (6), 528e536.
Dauvin, J.-C., Thiebaut, E., Gesteira, J.L.G., Ghertsos, K., Gentil, F.,
Ropert, M., Sylvant, B., 2004. Spatial structure of a subtidal
macrobenhic community in the Bay of Veys (western Bay of Seine,
English Channel). Journal of Experimental Marine Biology and
Ecology 307, 217e235.Degraer, S., Vincx, M., Meire, P., Offringa, H., 1999. The macro-
zoobenthos of an important wintering area of the common scooter
(Melanitta nigra). Journal of the Marine Biological Association of
the United Kingdom 79, 243e251.
Desroy, N., Warembourg, C., Dewarumez, J.M., Dauvin, J.C., 2002.
Macrobenthic resources of the shallow soft-bottom sediments in
the eastern English Channel and southern North Sea. ICES Journal
of Marine Science 60, 120e131.
Dewarumez, J.M., Quisthoudt, C., Richard, A., 1986. Suivi pluri-
annuel du peuplement a Abra alba dans la partie meridionale de la
Mer du Nord (region de Dunkerque-France). Hydrobiologia 142,
187e197.
Dewarumez, J.M., Davoult, D., Sanvicente-Anorve, L.E., Frontier, S.,
1992. Is the ‘muddy heterogenous sediment assemblage’ an ecotone
between the pebbles community and the Abra alba community in
the southern Bight of the North Sea? Netherlands Journal of Sea
Research 30, 229e238.
Dewarumez, J.-M., Belgrano, A., Craeymeersch, J.A., Duquesne, S.,
Heip, C., Hilde, D., Vincx, M., 1993. Influence de la circulation des
masses d’eaux dans la dynamique du peuplement a Abra alba de la
baie sud de la Mer du Nord. Journal de Recherche Ocean-
ographique 18, 1e4.
Duineveld, G.C.A., Kunitzer, A., Niermann, U., De Wilde, P.A.W.,
Oray, J.S., 1991. The macrobenthos of the North Sea. Netherlands
Journal of Sea Research 28, 53e65.
Eagle, R.A., 1973. Benthic studies in the southeast of Liverpool bay.
Estuarine, Coastal and Marine Science 1, 285e299.
Eagle, R.A., 1975. Natural fluctuations in a soft bottom benthic
community. Journal of the Marine Biological Association of the
United Kingdom 55, 865e878.Eckman, J.E., 1983. Hydrodynamic processes affecting benthic
recruitment. Limnology and Oceanography 28, 241e257.
Ellingsen, K.E., 2001. Biodiversity of a continental shelf soft-sediment
macrobenthos community. Marine Ecology Progress Series 218, 1e15.
Essink, K., Beukema, J.J., 1986. Long-term changes in intertidal flat
macrozoobenthos as an indicator of stress by organic pollution.
Hydrobiologia 142, 209e215.Fauchald, K., Jumars, P.A., 1979. The diet of worms a study of
polychaete feeding guilds. Oceanography and Marine Biology
Annual Review 17, 193e284.
Ford, E., 1923. Animal communities of the level sea-bottom in the
waters adjacent to Plymouth. Journal of the Marine Biological
Association of the United Kingdom 13, 164e224.
Fromentin, J.-M., Dauvin, J.-C., Ibanez, F., Dewarumez, J.M.,
Elkaim, B., 1996. Long-term variations of four macrobenthic
community structures. Oceanologica Acta 20 (1), 43e53.
Fromentin, J.-M., Ibanez, F., Dauvin, J.-C., Dewarumez, J.M.,
Elkaim, B., 1997. Long-term changes of four macrobenthic
assemblages from 1978 to 1992. Journal of the Marine Biological
Association of the United Kingdom 77, 287e310.
Glemarec, M., 1973. The benthic communities of the European North
Atlantic continental shelf. Oceanography and Marine Biology
Annual Review 11, 263e289.
Gray, J.S., Boesch, D., Heip, C., Jones, A.M., Lassig, J.,
Vanderhorst, R., Wolfe, D., 1980. The role of ecology in marine
pollution monitoring. Journal du Conseil International pour
l’Exploration de la Mer 179, 237e252.
Gray, J.S., 1981. The Ecology of Marine Sediments. Cambridge
Studies in Modern Biology 2. Cambridge University Press,
Cambridge, 185 pp.
Gray, J.S., 1997. Marine biodiversity: patterns, treats and conservation
needs. Biodiversity Conservation 6, 153e175.Grochowski, N.T.L., Collins, M.B., Boxall, S.R., Salomon, J.-C.,
Breton, M., Lafite, R., 1993. Sediment transport pathways in the
eastern English Channel. Oceanologica Acta 16, 531e537.
Hartmann-Schroder, G., 1996. Annelida. Borstenwurmer, PolychaetaeTierwelt Deutschlands Teil 58. Gustav Fischer Verlag, Jena,
648 pp.
Hayward, P.J., Ryland, J.S., 1995. Handbook of the Marine Fauna of
North-West Europe. Oxford University Press, Oxford, 800 pp.
Heip, C., Basford, D., Craeymeersch, J.A., Dewarumez, J.-M.,
Dorjes, J., de Wilde, P., Duineveld, G., Eleftheriou, A.,
Herman, P.M.J., Niermann, U., Kingston, P., Kunitzer, A.,
Rachor, E., Rumohr, H., Soetaert, K., Soltwedel, T., 1992. Trends
in biomass, density and diversity of North Sea macrofauna. ICES
Journal of Marine Science 49, 13e22.
Hill, M.O., 1973. Diversity and evenness: a unifying notation and its
consequences. Ecology 54, 427e432.
Holtmann, S.E., Groenewold, A., Schrader, K.H.M., Asjes, J.,
Craymeersch, J.A., Duineveld, G.C.A., van Bostelen, A.J., van
der Meer, J., 1996. Atlas of the Zoobenthos of the Dutch
Continental Shelf. Ministry of Transport, Public Works and Water
Management, North Sea Directorate, Rijswijk, 244 pp.
Jones, N.S., 1950. Marine bottom communities. Biological Review 25,
283e313.
Kingston, P.F., Rachor, E., 1982. North Sea level bottom communi-
ties. ICES CM Papers 1982/L 41, 1e16.
Konstantinos, G., Luczak, C., Dewarumez, J.M., Dauvin, J.-C., 2000.
Influence of spatial scales of observation on temporal change in
diversity and trophic structure of fine-sand communities form the
English Channel and the southern North Sea. ICES Journal of
Marine Science 57, 1481e1487.Konstantinos, G., Luczak, C., Dauvin, J.-C., 2001. Identification of
global and local components of spatial structure of marine benthic
communities: example from the Bay of Seine (Eastern English
Channel). Journal of Sea Research 45, 63e77.Kunitzer, A., Duineveld, G.C.A., Basford, D., Dewarumez, J.M.,
Dorjes, J., Eleftheriou, A., Heip, C., Herman, P.M.J., Kingston, P.,
Niermann, U., Rumohr, H., de Wilde, P.A.W.J., 1992. The benthic
infauna of the North Sea: species distribution and assemblages.
ICES Journal of Marine Science 49, 127e143.
Lacroix, G., Ruddick, K., Ozer, J., Lancelot, C., 2004. Modelling the
impact of the Scheldt and Rhine/Meuse plumes on the salinity
distribution in Belgian water (southern North Sea). Journal of Sea
Research 52, 149e163.
Lambshead, P.J.D., Platt, H.M., Shaw, K.M., 1983. The detection of
differences among assemblages of marine benthic species based on
an assessment of dominance and diversity. Journal of Natural
History 17, 859e874.

763G. Van Hoey et al. / Estuarine, Coastal and Shelf Science 64 (2005) 751e763
Lancelot, C., Mathot, S., Owens, N.J.P., 1986. Modeling protein
synthesis, a step to an accurate estimate of net primary production:
a case of Phaeocystis pouchetti colonies in Belgian coastal waters.
Marine Ecology Progress Series 32, 193e202.
Lanckneus, J., De Moor, G., Stolk, A., 1994. Environmental setting,
morphology and volumetric evolution of the Middelkerke Bank
(southern North Sea). Marine Geology 121, 1e21.
Larsonneur, C., Bouysse, P., Auffret, J.P., 1982. The surficial
sediments of the English Channel and its western approaches.
Sedimentology 29, 851e864.
Luczak, C., Dewarumez, J.-M., Essink, K., 1993. First record of the
American jack knife clam Ensis directus on the French coast of
the North Sea. Journal of the Marine Biological Association of the
United Kingdom 73, 233e235.
Magurran, A.E., 1988. Ecological Diversity and its Measurement.
Princeton University Press, 179 pp.
Morin, P.J., 1999. Community Ecology. Blackwell Science Ltd.,
England, 424 pp.
Olivier, F., Vallet, C., Dauvin, J.-C., Retiere, C., 1996. Drifting in
post-larvae and juveniles in an Abra alba (Wood) community of the
eastern part of the Bay of Seine (English Channel). Journal of
Experimental Marine Biology and Ecology 199, 89e109.
Patil, G.P., Taillie, C., 1977. Diversity as a concept and its implications
for random communities. Bulletin International Statistic, Inst.
XLVII, 497e515.
Petersen, J., 1911. Valuation of the Sea I. Animal life on the sea
bottom, its food and quantity. Report of the Danish Biological
Station to the Board of Agriculture 20, 1e81.
Petersen, J., 1913. Valuation of the Sea II. The animal communities of
the sea bottom and their importance for marine zoogeography.
Report of the Danish Biological Station to the Board of
Agriculture 21, 1e41.
Petersen, J., 1918. The sea bottom and its production of fish food.
Report of the Danish Biological Station to the Board of
Agriculture 25, 1e62.
Prygiel, G., Davoult, D., Dewarumez, J.-M., Glacon, R., Richard, A.,
1988. Description et richesse des peuplements benthiques de la
partie francaise de la Mer du Nord. Comptes Rendus Hebdomad-
aires de l’ Academie des Sciences 306, 5e10.
Raffaelli, D., Emmerson, M., Solan, M., Biles, C., Paterson, D., 2003.
Biodiversity and ecosystem processes in shallow coastal waters: an
experimental approach. Journal of Sea Research 49, 133e141.
Rees, E.L.S., Walker, A.J.M., 1983. Annual and spatial variation
in Abra community in Liverpool bay. Oceanologica Acta 1983,
165e169.Rees, H.L., Pendle, M.A., Waldock, R., Limpenny, D.S., Boyd, S.E.,
1999. A comparison of benthic biodiversity in the North Sea,
English Channel and Celtic Seas. ICES Journal of Marine Science
56, 228e246.Salzwedel, H., Rachor, E., Gerdes, D., 1985. Benthic macrofauna
communities in the German Bight. Veroeffentlichungen des
Instituts fuer Meeresforschung in Bremerhaven 20, 199e267.
Sanvicente-Anorve, L., Lepretre, A., Davoult, D., 1996. Large-scale
spatial pattern of the macrobenthic diversity in the eastern English
Channel. Journal of the Marine Biological Association of the
United Kingdom 76, 153e160.Sanvicente-Anorve, L., Lepretre, A., Davoult, D., 2002. Diversity of
benthic macrofauna in the eastern English Channel: comparison
among and within communities. Biodiversity and Conservation 11,
265e282.
Snelgrove, P.V.R., Butman, C.A., 1994. Animal-sediment relationships
revisited: cause versus effect. Oceanography and Marine Biology
Annual Review 32, 111e177.Snelgrove, P.V.R., Blackburn, T.H., Hutchings, P.A., Alongi, D.M.,
Grassle, J.F., Hummel, H., King, G., Koike, I.,
Lambshead, P.J.D., Ramsing, N.B., Solis-Weiss, V., 1997. The
importance of marine sediment diversity in ecosystem processes.
Ambio 26, 578e583.
Souplet, A., Dewarumez, J.-M., 1980. Les peuplements benthiques du
littoral de la region de Dunkerque. Cahiers de Biologie Marine 21,
23e39.
Strickle, W.B., Diehl, W.J., 1987. Effects of salinity on echinoderms.
In: Jangoux, M., Lawrence, J.M. (Eds.), Echinoderms Studies, vol.
2. A.A. Balkema, Rotterdam, pp. 235e285.Stripp, K., 1969. Die Assoziationen des Benthos in der Hegolander
Bucht. Veroeffentlichungen des Instituts fuer Meeresforschung in
Bremerhaven 12, 95e142.Thiebaut, E., Dauvin, J.-C., Lagadeuc, Y., 1992. Transport of Owenia
fusiformis larvae (Annelida: polychaeta) in theBayofSeine. I.Vertical
distribution in relation to water column stratification and ontogenic
vertical migration. Marine Ecology Progress Series 80, 29e39.Thiebaut, E., Dauvin, J.-C., Zixian, W., 1996. Tidal transport of
Pectinaria koreni post-larvae (Annelida: Polychaeta) in the Bay of
Seine (eastern English Channel). Marine Ecology Progress Series
138, 63e70.
Thiebaut, E., Cabioch, L., Dauvin, J.-C., Retiere, C., Gentil, F., 1997.
Spatio-temporal persistence of the Abra albaePectinaria koreni
muddy-fine sand community of the eastern Bay of Seine. Journal of
the Marine Biological Association of the United Kingdom 77,
1165e1185.
Trentesaux, A., Stolk, A., Tessier, B., Chamley, H., 1994. Surficial
sedimentology of the Middelkerke Bank (southern North Sea).
Marine Geology 121, 43e55.
Turner, S.J., Thrush, S.F., Pridmore, R.D., Hewitt, J.E.,
Cummings, V.J., Maskery, M., 1995. Are soft-sediment communi-
ties stable? An example from a windy harbour. Marine Ecology
Progress Series 115, 93e102.
Van Hoey, G., Degraer, S., Vincx, M., 2004. Macrobenthic community
structure of soft-bottom sediments at the Belgian Continental
Shelf. Estuarine. Coastal and Shelf Science 59, 599e613.
Vanosmael, C., Willems, K.A., Claeys, D., Vincx, M., Heip, C., 1982.
Macrobenthos of a sublittoral sandbank in the Southern Bight of
the North Sea. Journal of the Marine Biological Association of the
United Kingdom 62, 521e534.
Vermeulen, Y.M., Govaere, J., 1983. Distribution of benthic macro-
fauna in the Western Schelde Estuary. Cahier de Biologie Marine
24, 297e308.
Vlaeminck, I., Houhuys, R., Gullentops, F., 1989. A morphological
study of sandbanks off the Belgian coast. Progress in Belgian
Oceanographic Research, 179e195.
Whittaker, R.H., 1972. Evolution and measurement of species
diversity. Taxon 21, 213e251.
Ysebaert, T., Herman, P.M.J.,Meire, P., Craeymeersch, J., Verbeek,H.,
Heip, C., 2003. Large-scale spatial patterns in estuaries: estuarine
macrobenthic communities in the Schelde Estuary, NW Europe.
Estuarine, Coastal and Shelf Science 57, 335e355.