small high schools and student achievement
TRANSCRIPT

NBER WORKING PAPER SERIES
SMALL HIGH SCHOOLS AND STUDENT ACHIEVEMENT:LOTTERY-BASED EVIDENCE FROM NEW YORK CITY
Atila Abdulkadiro ğluWeiwei Hu
Parag A. Pathak
Working Paper 19576http://www.nber.org/papers/w19576
NATIONAL BUREAU OF ECONOMIC RESEARCH1050 Massachusetts Avenue
Cambridge, MA 02138October 2013
We thank Jennifer Bell-Ellwanger, Neil Dorosin, Stacey Gillett, Saskia Levy-Thompson, Jesse Margolis,Michelle Paladino, and officials at the New York City Department of Education for providing accessto the data used in this study. We are grateful to Elizabeth Kelly and school officials at The UrbanAssembly and MAK Mitchell for helpful discussions. A special thanks to Dick Murnane for encouragingus to pursue this work. Josh Angrist, Annice Correira, Sameer H. Doshi, Esther Duflo, and Peter Hullprovided helpful comments. Pathak is grateful for the hospitality of Graduate School of Business atStanford University where parts of this work were completed and the National Science Foundationfor research support. The views expressed herein are those of the authors and do not necessarily reflectthe views of the National Bureau of Economic Research.
At least one co-author has disclosed a financial relationship of potential relevance for this research.Further information is available online at http://www.nber.org/papers/w19576.ack
NBER working papers are circulated for discussion and comment purposes. They have not been peer-reviewed or been subject to the review by the NBER Board of Directors that accompanies officialNBER publications.
© 2013 by Atila Abdulkadiro ğlu, Weiwei Hu, and Parag A. Pathak. All rights reserved. Short sectionsof text, not to exceed two paragraphs, may be quoted without explicit permission provided that fullcredit, including © notice, is given to the source.

Small High Schools and Student Achievement: Lottery-Based Evidence from New York CityAtila Abdulkadiro ğlu, Weiwei Hu, and Parag A. PathakNBER Working Paper No. 19576October 2013JEL No. H52,I21,I28,J24
ABSTRACT
One of the most wide-ranging reforms in public education in the last decade has been the reorganizationof large comprehensive high schools into small schools with roughly 100 students per grade. We useassignment lotteries embedded in New York City's high school match to estimate the effects of attendanceat a new small high school on student achievement. More than 150 unselective small high schoolscreated between 2002 and 2008 have enhanced autonomy, but operate within-district with traditionalpublic school teachers, principals, and collectively-bargained work rules. Lottery estimates show positivescore gains in Mathematics, English, Science, and History, more credit accumulation, and higher graduationrates. Small school attendance causes a substantial increase in college enrollment, with a marked shiftto CUNY institutions. Students are also less likely to require remediation in reading and writing whenat college. Detailed school surveys indicate that students at small schools are more engaged and closelymonitored, despite fewer course offerings and activities. Teachers report greater feedback, increasedsafety, and improved collaboration. The results show that school size is an important factor in educationproduction and highlight the potential for within-district reform strategies to substantially improvestudent achievement.
Atila Abdulkadiro ğluDuke UniversityDepartment of EconomicsDurham, NC [email protected]
Weiwei HuDepartment of EconomicsDuke University, NC 27708, [email protected]
Parag A. PathakDepartment of Economics, E17-240MIT77 Massachusetts AvenueCambridge, MA 02139and [email protected]

I Introduction
One of the most significant trends in US public education in the last half-century has been the
emergence of large comprehensive high schools, which teach a range of students a wide variety
of curricula. In 1950, there were about 24,500 high schools educating 5.7 million students
across the United States. Even though the total high school population increased more than
2.3 times, by 2000 there were only about 1,900 more high schools, implying that average high
school size increased from about 230 to just over 500. In the past fifty years, the percent of
high schools enrolling more than 1,000 students grew from 7 to 25 percent and from 1990 to
2000, the number with more than 1,500 students doubled (Lawrence, 2002; NCES, 2010). The
postwar consolidation and growth in high school size represents the culmination of aggressive
efforts by advocates including Harvard University’s President James Conant who called for the
“elimination of the small high school” and for the extension of the high school curriculum beyond
traditional academic areas (Conant, 1959; Toch, 2003).
Proponents of school consolidation see large comprehensive high schools as realizing scale
economies by educating more students with the same facilities, staff, and resources. They also
point to a greater diversity of curricular and extra-curricular offerings and the potential for in-
teraction across a range of socioeconomic groups. At the same time, in large schools, there may
be challenges in monitoring students. Resources spent maintaining order and discipline could
otherwise be used to educate students. Moreover, teachers may face difficulties providing per-
sonalized instruction and developing long-term relationships with students. More individualized
attention and frequent interaction may improve students’ sense of belonging and provide focus
in schools’ curricula and culture (Toch, 2003; Iatarola, Schwartz, Stiefel and Chellman, 2008).
In the last decade, perhaps the most wide-ranging reform in public K-12 education involved
the restructuring of large, underperforming high schools into small schools. Since the 2001-
02 school year, about 1,600 new small schools have been created in the United States (Toch,
2010). More than half of the nation’s largest urban school districts have transformed some
large high schools into smaller ones and the Gates Foundation has pushed small school efforts
in 275 districts nationwide (Brynes, 2003; Robelen, 2005). Some are entirely new schools, while
others involve the conversion of formerly large high schools into several small schools. The most
significant changes have taken place in New York City (NYC), the nation’s largest school district
where more than 150 new unselective small high schools with 9th grade have opened since 2002.
The purpose of this paper is to assess the causal effects of attendance at new small high
schools in New York City on student achievement, graduation, and college. Aside from size,
the common features of NYC’s small schools are “academic rigor, personalized learning environ-
ments, and partnerships with non-profit organizations, cultural institutions, and businesses that
2

bring additional resources to enhance learning” (Klein, 2005). Schools formed as part of the New
Century High School Initiative commit to educational principals, but are free to make choices
about curricula and principals operate with more autonomy (Hemphill and Nauer, 2009). Many
have specific themes or career focus, including science and technology, arts and humanities, ca-
reer and professional training, or leadership and service. A unique feature of the New York City’s
small school initiative is that it has been implemented in partnership with the NYC’s Depart-
ment of Education (DOE), the United Federation of Teachers, and the Council of Supervisors
and Administrators (NVPS, 2006). In particular, teachers and principals at small schools have
their salaries and benefits set based on district-wide collective bargaining agreements. Therefore,
our study not only provides evidence of the role of school size in education production, but also
whether effective secondary school reform can take place within the existing traditional public
school system.
The evaluation of small schools is made difficult by the fact that the schools may select
motivated students with involved parents, by giving preference to those who attend information
sessions or open houses (see, e.g., Gootman (2006b)). As a result, just as in any study of
school models, selection bias is the major empirical challenge in studying the effects of the
new small high schools. To obtain a seat at a small high school a student must apply via the
New York City high school match, a centralized process that assigns all entering high school
students to city schools (Abdulkadiroglu, Pathak and Roth, 2005; Abdulkadiroglu, Pathak and
Roth, 2009). Unlike other NYC public high schools (many of which screen applicants), if there
are more applicants than seats, then assignment to an unselective small school involves a random
component. If two students rank a particular school as their most preferred choice and are in
the same school priority group, then the student with the more favorable lottery number will
be offered the seat before the student with a less favorable lottery number. Using this random
variation, we are able estimate causal effects free of selection bias for 108 out of 151 new, small
unselective high school programs.
Students who attend the schools in our study would otherwise attend traditional New York
City public high schools, though predominantly in the Bronx and Brooklyn neighborhoods where
small schools were created. NYC public schools serve a disproportionately black and Hispanic
student population. Like many urban school districts, NYC students have lower test scores
and high school graduation rates, and are less likely to go to college than students from nearby
districts. Relative to this group, NYC small schools serve an even higher fraction of black
and Hispanic students, with below-average baseline scores. Though our paper focuses on more
than 70% of oversubscribed schools, it’s worth noting that we cannot use our methodology to
study schools that are not oversubscribed. We therefore see our lottery estimates as providing
unusually clean evidence about possibilities for urban small schools reform, rather than an
3

overall small school treatment effect. The effects of small schools in urban populations are of
special interest given the paucity of examples of successful interventions for this population, in
particular for outcomes related to college choice and enrollment.1
Lottery-based estimates show large and consistent score gains for students who attend a
small high school on New York State Regents tests, statewide high-stakes exams required for
graduation. Students score higher on all five of the major Regents tests: Mathematics, English,
Living Environment, Global History, and United States History. Small school attendance causes
an increase in credit accumulation, attendance, and graduation rates. Though small school
students perform no better on the PSAT or SAT, they are considerably more likely to enroll in
college and are less likely to require remediation in reading and writing. A significant fraction
of small school students are pushed to four-year public institutions and those within the City
University of New York (CUNY) system. The evidence, so far, indicates that they are more
likely to matriculate for at least two academic semesters.
New York City’s Department of Education enlisted the support of several intermediary orga-
nizations in designing and supporting new small schools. Although they were established around
a common set of principals set by the Gates Foundation, the intermediaries differed in their im-
plementation of those principals. Seven out of the 18 intermediaries – New Visions, Replications,
Urban Assembly, NYC Academies, Institute for Student Achievement, College Board, and Out-
ward Bound – established more than 90 percent of the schools during the time of our study.
We also report on an investigation of achievement differences across these intermediaries. With
a few exceptions, we find broadly consistent effects for the main outcomes though usually with
reduced statistical precision. This pattern suggests that idiosyncratic implementation details in-
troduced by intermediaries are trumped by larger changes associated with significantly smaller
school size.
After documenting small school effects, we turn to an investigation of school practices using
detailed information from the NYC Learning Environment Survey, the nation’s largest annual
school survey. This survey has unusually widespread coverage; it is completed by roughly three-
quarters of students and teachers, and upwards of 45% of eligible parents during our time period.
Following other studies that use survey information to complement quasi-experimental school
evaluations (see, e.g., Angrist, Pathak and Walters (2013a), Dobbie and Fryer (2013a), Pop-
Eleches and Urquiola (2013)), we utilize survey responses to investigate mechanisms for the
small school effects. Students in our small schools experiment are at schools associated with
1Cullen, Levitt, Robertson and Sadoff (2013) provide a recent review of high school reform. Although lauding
the effects of high-performing “No Excuses” charter schools studied by Abdulkadiroglu, Angrist, Dynarski, Kane
and Pathak (2011b) and Dobbie and Fryer (2011), they remain skeptical that such “Herculean” (quoted in original)
efforts can be scaled.
4

higher levels of engagement, safety and respect, academic expectations, and communications
compared to those who do not obtain offers. In particular, students report that they are more
closely monitored and have more frequent interactions with teachers. On the other hand, small
schools have substantially fewer activities and course offerings. Teachers report greater feedback,
increased safety, and improved collaboration at the schools in our experiment.
New York City’s experience with small schools stands out not only because it was a signature
part of Bloomberg-era reforms, but also because it involved the largest number of new small
high schools created in any district. Between 2002 and 2008, the number of high schools in
NYC increased from just over 250 to nearly 450 (shown in Figure 1). Gates Foundation-funded
policy reports and briefs by MDRC (Bloom, Thompson and Unterman (2010), Bloom and
Unterman (2012), and Bloom and Unterman (2013)) also study the effects of small high schools
on progression towards graduation and high school graduation using the high school match,
though with a different econometric approach and sample.2 Other studies of small school efforts
that do not use lotteries in NYC and elsewhere generally find positive results. Foley and Reisner
(2009) present an observational analysis of the New Century High Schools, while Schwartz,
Stiefel and Wiswall (2013) use an instrumental variables strategy based on proximity. Both
papers report positive graduation results for new small schools. Similarly, Barrow, Claessens
and Schanzenbach (2013) also use distance as an instrument to study Chicago’s new small
high schools and find that students are more likely to graduate. Kuziemko (2006) uses shocks
to school enrollment to study Indiana’s small schools and finds positive math and attendance
effects.3 This paper also contributes to a growing literature exploiting random variation in
student assignment processes to study school effects (see, e.g., Angrist, Dynarski, Kane, Pathak
and Walters (2012), Angrist et al. (2013a), Cullen, Jacob and Levitt (2006), Deming, Hastings,
Kane and Staiger (2011)), though lottery-based studies tracking student to college choice and
enrollment are still relatively rare.4
The next section describes New York City’s small schools in more detail and schools in our
study. Section III describes our lottery-based estimation framework based on the centralized
2Other reports that study NYC’s small high schools include Hemphill and Nauer (2009), which provides a
descriptive account of the expansion of small schools and choice in NYC, Foley, Arcaira, Coleman, Reisner, Scott,
Turner andWoods (2010), which describes intermediary organizations, and Shear, Means, Mitchell, House, Gorges,
Joshi, Smerdon and Shkolnik (2008), which reports on surveys of implementation issues with Gates Foundation
supported small schools.3While small schools have fewer students per grade, they do not necessarily have smaller class sizes. Studies
of class size reductions generally report positive achievement effects (Angrist and Lavy, 1999; Krueger, 1999;
Dynarski, Hyman and Schanzenbach, 2011; Fredriksson, Ockert and Oosterbeek, 2013).4Deming et al. (2011) show that attending a higher value-added school in Charlotte increases college enrollment
for girls, while Angrist, Cohodes, Dynarski, Pathak and Walters (2013b) and Dobbie and Fryer (2013b) find that
high-performing charter schools significantly increase college enrollment.
5

high school match, while Section IV presents data and descriptive statistics. Section V presents
the lottery estimates for Regents, credits, attendance, and high school graduation. Section
VI presents results for college enrollment and choice. Section VII reports on results split by
student groups and by school intermediaries, while Section VIII contains further information on
differences in the small school learning environment. Section IX examines what can be learned
more generally about the role of school size in education production from our analysis. The
paper concludes in Section X.
II Small Schools in New York City
II.1 Background
There has been experimentation with small high schools in New York City for a number of
decades. An important antecedent to the large-scale changes in the 2000s that we study here
took place in the 1980s, when Chancellor Anthony Alvarado reorganized East Harlem’s District
4 and empowered Deborah Meier, an education reformer often described as the founder of the
modern small schools movement, to establish 15 small schools in New York City (Toch, 2003).
In 1994, the Annenberg Foundation gave a $25 million grant to encourage small school creation,
but these schools were not seen as central to Chancellor Rudy Crew’s reform agenda (UFT,
2005; Gootman, 2006a). Small school reform rose to the top of the reform agenda with the 2001
election of Michael Bloomberg as Mayor of New York City, the imposition of mayoral control,
and the subsequent appointment of Joel Klein as Chancellor in 2002. The DOE, together with
the United Federation of Teachers and Council of Supervisors and Administrators, launched
the New Century High School Initiative with $31 million in financial support from the Bill and
Melinda Gates Foundation, Carnegie Corporation, and the Open Society Institute.
At the beginning, there was a fertile landscape for school development with the DOE hosting
workshops on school design, budgeting, hiring, and building partnerships with local organiza-
tions. Intermediary organizations submitted applications to the DOE to start new schools
describing their vision, curriculum and instructional model, teacher evaluation practices, lead-
ership and governance structure, and proposed budget. The Gates Foundation identified rigor,
relevance, and relationships (“the three Rs”) as the key to high school reform. They envisioned
small schools as allowing teachers and staff to create an environment where students could be
more easily monitored and feel safer; this would in turn increase motivation and attendance,
and ultimately high school graduation and college enrollment rates. Underserved low-income
and minority students, in particular, were expected to benefit from the personalized academic
and social support at small schools (Gates, 2005). The New Visions for Public Schools, an edu-
cation reform organization in NYC, played a major role in directing new school creation. They
6

identified ten principles of school design: a rigorous instructional program, personalized instruc-
tional relationships, a clear focus on teaching and learning, instructional leadership, school-based
teacher-driven professional development and collaboration, meaningful continuous assessment,
community partners, family/caregiver involvement, youth participation and development, and
the effective use of technology (Foley et al., 2010).
To supervise new school creation, the DOE established a designated development/advocacy
office with direct reporting to the chancellor (Bloomfield, 2006; Foley and Reisner, 2009). The
strongest proposals were granted, and Gates distributed planning grants to new school organizers
of $400,000 over four years and $200,000 to assist with school implementation (Foley et al.,
2010). Approved schools typically started in 9th grade with 100 students and grades were
added as classes were promoted. To focus on struggling students, many small schools opened in
economically disadvantaged areas of New York City. Figure 2 shows that Bronx and Brooklyn
were home to the greatest number of new small high schools. A total of 61 new small high
schools with 9th grade entry opened in the Bronx, 44 in Brooklyn, 22 in Manhattan, 15 in
Queens, and 1 in Staten Island.
By 2003, the Gates Foundation granted an additional $58 million to New Visions and other
intermediary organizations. Mayor Bloomberg and the DOE announced ambitious plans to
expand the New Century initiative and create numerous additional small schools. The new
centralized high school admissions process also allowed students to access the increased number
of school options (Abdulkadiroglu et al., 2005). The peak year of Gates-supported small high
school creation was 2004, when 49 new unselective small high schools opened, with 18 in the
Bronx and 17 in Brooklyn. Figure 3 shows that new small school creation tapered afterwards.
In 2007, there were 12 newly created small schools, while in 2008, there were only 4. At least
60,000 students enrolled in a new small high school in our study between school years 2004-05
through 2009-10.
After jumpstarting small school creation in New York City, the Gates Foundation has since
turned its attention away from small schools. Foundation president Bill Gates concluded that
small schools did not have the effect on college readiness and graduation rates that he expected
(Gates, 2009). However, since high small school creation peaked in 2004, it has only recently
become possible to systematically examine these outcomes in NYC. Even without the Gates
Foundation’s on-going support, New York’s dramatic and unprecedented small school reform
continues to leave a large imprint throughout city’s public schools. As of 2013, 13 new high
small school programs have been closed and the new small schools continue to be an integral
part of the district’s school portfolio strategy (DOE, 2012a).
Aside from initial foundation support, another important ingredient for small school ex-
pansion was a collaborative partnership between the DOE, the United Federation of Teachers
7

(UFT), the union representing most NYC teachers, and the Council of School Supervisors, a
collective bargaining unit for school administrators. For instance, a 2005 UFT Taskforce report
expressed support for the creation of small schools, seeing them as a “chance for innovation
and experimentation” and way to provide “opportunities for teacher voice in a personalized,
collegial, collaborative and professional work space” (UFT, 2005).
The UFT also played a role in hiring teachers by serving on personnel committees at all
new or redesigned schools (DOE, 2007b). Labor agreements required that if new school creation
impacted another school, then 50% of the teaching staff at the impacted school should be
selected among the “appropriately licensed most senior applicants from the impacted school staff
who meet the new school’s qualifications” (DOE, 2007b). To be hired, small school principals
asked teachers to present teaching portfolios, demonstrate lessons, and often have small school
teaching experience. Given each school’s unique requirements, the definition of qualified staff
set by personnel committees could differ by school, and the 50% requirement did not imply that
half of the phased-out school’s staff was necessarily rehired at the new school. As soon as a
phase-out was completed, teachers were hired in the same way as at all other NYC public high
schools using the “Open Market System.” Throughout, teacher work schedules and salaries were
determined according to the collective bargaining agreement.
The growth in New York City’s small schools took place during a period of system-wide
changes in governance at the DOE. All schools could elect for a “school-based option” in their
labor agreement, which involved deviations from UFT requirements on staffing, class sizes, and
rotations; these proposals must be approved by 55% of the staff and predominantly were used
to increase learning time for students. Goertz, Loeb and Wyckoff (2011) state that from 2004 to
2006, 35% of all schools adopted a school-based option. In 2005, the DOE launched the Empow-
erment Zone, where schools (small or not) signed contracts exchanging deviation from city-wide
curriculum requirements and rules governing the allotment of some district-level funding for
performance-based accountability (Nadelstern, 2005). As of September 2005, 30 schools joined
the zone, 14 of which were new small schools and by the following year, 331 schools throughout
the district became empowerment schools (Nadelstern, 2005; Klein, 2006). While maintaining
union contracts, principals had more authority over educational decisions and budgets, greater
voice in the selection and evaluation of administrative teams, and fewer reporting requirements
(DOE, 2007a). Around this time, progress reports with letter grades began playing an impor-
tant role in accountability decisions and lower performing schools could be subject to leadership
changes or closure. By 2007-08, principals were able to chose among three classes of school
support organization and empowerment zones were the most popular choice (Hemphill and
Nauer, 2010). Even with these district-wide changes in governance, the auxiliary organizations
mostly provided instructional support and oversight. All employment decisions remained with
8

the DOE and the collective bargaining agreement, which was renegotiated for 2007, continued
to apply (DOE, 2009).
II.2 Small Schools Studied
We compile the list of new small high schools created between 2002-2008 from several sources.
First, we use NYC’s Supplementary High School Directory for New Schools. Second, we append
any schools listed in the 2005 DOE Guide to NYC’s Small Schools. Third, we add any schools
listed in New Visions from Public Schools reports. Fourth, we use the list of small school
intermediary organizations contained in Foley et al. (2010) and collect the names of small schools
from intermediary websites. Finally, we include any small schools listed in Bloom et al. (2010).
Our sample of small schools includes all new unselective small high schools created between
2002 and 2008 with 9th grade entry. The data appendix provides additional details on the
construction of the eligible small high school list.
Table 1 shows that 151 high school programs meet our eligibility criteria. To be in our lottery
study, a school must be oversubscribed for at least one year between application years 2003-04
and 2007-08, and there must be a set of applicants who are subject to a lottery in New York
City’s high school match. Of the 151 eligible school programs, 108 are in our lottery sample.
Occasionally, there is more than one program at a high school. For example, at the Bronx
Theatre High School, a New Visions performing arts school, there is a separate theatre design
and technology program and a performance and production program, each of which is ranked
separately by applicants. The 151 eligible school programs correspond to 143 eligible schools, of
which 101 schools are in the lottery sample.
Table 1 also reports the coverage of school programs by intermediary organizations, where
a school may be placed into more than one category if it supported by multiple groups. New
Visions affiliated schools represent 62% of eligible small schools, with Institute for Student
Achievement, Urban Assembly, and Replications forming the three next largest intermediaries.
We have near complete coverage for Urban Assembly and NYC Academies in our lottery study,
and we cover more than half of the schools for all other intermediaries except for the Institute
for Student Achievement. 13 newly created small high school programs eligible for our study
have been closed, and among those currently open, 72% are in the lottery study. Table A1
provides a complete list of school programs, schools, intermediaries, years in the lottery sample
for the eligible schools in study. Table A2 reports the breakdown of applicants by application
cohort and the grades we can observe. Variation in coverage reflects year-to-year fluctuations in
student demand and school capacities.
9

III Empirical Framework
III.1 Estimating Equations
We are interested in the causal effect of attending a new small high school on student achieve-
ment. We fit equations for educational outcomes, yigt, of student i in grade g, tested in year t,
of the following form:
yigt = αt + βg +∑
j
δjdij + γ′Xi + ρSigt + εigt, (1)
where Sigt is our measure of exposure to small schools. The terms αt and βg are year-of-
test and grade-of-test effects, Xi is a vector of demographic controls such as gender and race
indicators and baseline test scores with coefficient γ, and εigt is an error term that reflects
random fluctuation in test scores. We cluster standard errors by school-test year for Regents test
outcomes. For outcomes involving repeat observations per student like credits and attendance,
we additionally cluster by student. The dummies dij are indicators for lottery-specific “risk
sets,” which will be described in Section III.2. The coefficient of interest is ρ.
For Regents test outcomes, the variable Sigt is the years spent in a small school as of test
date, counting any repeat grades and any time in a small school listed in Table A1 (not just
those subject to lottery). This means if a student transferred to another small school after an
initial assignment, we count time spent at both schools. For each test, we compute the implied
years of small school attendance based on the test date and enrollment status. We assume the
enrollment date is September 1st of each year and count how many days students stay in a small
school from the application date to the test date. Since students can determine when they take
a Regents exam, scaling small school exposure by years allows us to interpret estimates as per-
year effects. For outcomes such as graduation and college attendance, we measure small school
exposure by whether a student attends a small school following application in 9th grade. We
focus on attendance as the endogenous variable for these outcomes to avoid confronting issues
related to timing and reverse causality.
Ordinary least squares (OLS) estimates of equation (1) would capture the average causal
effect of years or enrollment at a small school in the sample if Sigt were randomly assigned.
However, students selectively choose schools, and their choices may be related to unobserved
variables such as family characteristics and motivation, which potentially bias OLS estimates.
Our econometric approach is based on an instrumental variables (IV) strategy that exploits the
partial random assignment of Sigt embedded in the NYC high school match.
The first stage equation for the IV estimation of ρ is given by
Sigt = λt + κg +∑
j
μjdij + Γ′Xi + πZi + υigt,
10

where λt and κg are year-of-test and grade effects. The excluded instrument is the random
offer indicator Zi. The coefficient π captures the effect of the instrument on either time spent or
enrollment at an eligible small high school. IV estimates of ρ in equation (1) adjust for differences
between offers and enrollments for those offered and not, and capture the causal effect for those
who comply with (that is, enroll in a small school) with an offer (Imbens and Angrist, 1994).
For Regents outcomes, the IV estimates of ρ can be interpreted as the weighted-average causal
response of each year at a small school.
In practice, the use of a lottery instrument is complicated by the fact that students obtain
school offers through a centralized mechanism where their choices interact with their school
priority and the choices of other students. To implement our IV strategy, it is necessary to
determine how random offers are generated by the high school match.
III.2 Extracting Assignment Lotteries from the High School Match
Admissions to New York City high schools are administered centrally by the NYC DOE. Ev-
ery eighth-grader submits up to 12 schools in order of preferences. At schools, students can
also be explicitly ranked in a strict order or ranked within coarser priority groups where a
lottery number breaks ties. The student-proposing deferred acceptance algorithm (DA) then
computes assignments taking student preferences, school priorities, and lottery numbers into
account (Abdulkadiroglu et al., 2005; Abdulkadiroglu et al., 2009). When two students apply to
a school program for which they are in the same priority group, the lottery number determines
which student is offered. After DA has been run, if a student prefers another school to her
assignment, it must be the case that all of the seats at the other school are assigned to students
with higher priority or with the same priority, but better lottery numbers. Therefore, whether
a student is rationed by lottery at school s is determined by whether she ranks school s above
or below the school she is assigned, her priority at school s, where other applicants rank school
s compared to their assignments, and other applicants’ priorities at school s. To operational-
ize our econometric strategy, it is necessary to identify groups of students who, conditional on
information contained in their preferences and priorities, face the same risk of assignment.
Figure 4 illustrates the steps we use to identify applicants subject to lottery at a given school
program. We first identify students who rank a small high school program anywhere on their
preference form. For many of these students, the decision to rank a small school does not play
any role in the assignment under the student-proposing deferred acceptance algorithm. For
instance, a student who ranks a small school second, but has a guaranteed priority at her first
choice will not be considered for her second choice because she’ll obtain an offer at her first
choice. To focus on students for whom the small school choice is relevant, we identify applicants
who did not receive an assignment more preferred to the highest ranked small school on their
11

preference list. Applicants who are admitted at schools preferred to their highest ranked small
school (shaded in Figure 4) do not contribute to the lottery sample.
The remaining marginal applicants can differ in the priority group they receive at the school.
Many small schools give priority to students who live in particular geographic regions or who
express interest by visiting high school fairs or open houses. The random number orders the
marginal applicants students within these priority groups lexicographically. For instance, at the
Bronx Theatre High School, there are four priority groups:
1) Priority to Bronx students or residents who attend an information session,
2) Then to New York City residents who attend an information session,
3) Then to Bronx students or residents,
4) Then to New York City residents,
and the random number orders students within each priority group. Among the marginal ap-
plicants, we identify the lowest priority group for which some students are offered and other
students are not. In the Figure 4 example, every marginal applicant in the first priority group is
admitted and no applicant in third priority group is admitted. Lottery-based rationing therefore
takes place only among applicants in the second priority group. If there is no priority group
where marginal applicants are offered and others are not, then the school is not oversubscribed.
An oversubscribed school contributes applicants to our lottery study in a given year if there are
marginal applicants and among the marginal applicants in the lowest priority group, some are
offered and some are not.5 The random offer indicator Zi is 1 for students who are offered a
seat at that small school program choice, and 0 otherwise.
The assignment of a student to a small school not ranked first depends on the student
preferences and priorities at higher-ranked schools in a complex way.6 For this reason, we focus
only on students who rank a small school as their top choice, as in other studies using data
5In principle, every marginal applicant with a priority higher than the lowest priority to obtain an offer should
obtain an offer. There are some school program-years where this property does not hold, and we do not include
these school program-years in the lottery sample. Based on conversations with the NYC DOE, some of these
schools may have slot-specific priorities, where priorities apply for a certain fraction of school seats. For more on
slot-specific priorities, see Kominers and Sonmez (2012) and Dur, Kominers, Pathak and Sonmez (2013).6Bloom et al. (2010) consider all preferences ranked by students, and for their sample, 24 percent of students
are in more than one lottery. They acknowledge that the possibility a student could face non-zero probability of
assignment at a higher choice school creates complications, and therefore pursue an alternative approach. They
state that “the probability of prior assignment can vary from just above 0 to just below 1, and this variation can
pose a threat to randomization” (italics in original, page 76), but later argue that this may not be an issue in their
setting. Abdulkadiroglu, Angrist, Narita and Pathak (2013) analyze econometric issues associated with efficiently
extracting random assignment from centralized matching mechanisms.
12

from centralized assignment mechanisms (Abdulkadiroglu et al., 2011b; Deming et al., 2011).
Small school risk sets are defined by the identity of the first choice small school program and
the application year. The restriction to first choices creates two possible drawbacks. First, if a
student ranks multiple small schools and is assigned to a lower ranked small school, we’d code the
instrument as zero, since the student did not obtain an offer at her first choice. This potentially
weakens the power of the instrument, but does not compromise our research design.7 Second,
the exclusion of students who do not rank a small school first, but rank it second or lower results
in a potentially smaller lottery sample size, though the number of possible additional students
in our application is relatively small.8
IV Data and Descriptive Statistics
IV.1 Sources
We obtained registration and demographic information for New York City from 2002-03 through
2009-10. Registration data are used to determine whether and for how many years a student is
enrolled at a small high school. Demographic information in the NYC file includes borough of
residence, race, sex, subsidized lunch, limited English proficiency, and special education status.
Baseline (i.e., pre-treatment) test scores are based on 8th grade standardized exams in Math
and English Language Arts. Baseline scores are normalized by grade and year to have mean
zero and unit variance in the population of New York City students.
NYC demographic and registration information were merged with Regents test scores us-
ing student identification numbers. Regents exams are mandatory state examinations where
performance determines whether a student is eligible for a high school diploma in New York.
There are Regents examinations in English, Global History, US History, and multiple exams in
Mathematics and Science.9 A Regents exam typically has a multiple choice section and a long
7In contrast, in the context of DA without school priorities, Abdulkadiroglu, Angrist and Pathak (2011a)
identify a “sharp sample” where offers are a deterministic function of preferences and school rankings.8Among students who did not rank a small school first, but ranked an oversubscribed school second, if we
require that students have the same choices and priorities at their first choice, we’d add at most 1,404 students
in 326 additional risk sets, for an average about 4.3 students per risk set. Among students who only rank an
oversubscribed small school third, the requirement that students have the same first and second choice with the
same priorities results in 99 additional students in 40 additional risk sets. Virtually no students are added if we
continue further down rank order lists with these restrictions.9Starting in 2005, the Board of Regents started to modify the Mathematics exams. At the beginning of
our sample, the two Mathematics examinations were Elementary Algebra and Planar Geometry (Math A) and
Intermediate Algebra and Trigonometry (Math B). Two new mathematics examinations, Integrated Algebra I
(Math E) and Geometry (Math G), have since been phased in. Since students typically either take Math A or
Math E, we focus on the score on the test taken first, taking the Math A score when both are contemporaneous.
13

answer or essay components and each exam usually lasts for three hours. The English exam,
however, consists of two three-hour pieces over two days. Regents scores are standardized to the
city score distribution by grade, test-date, year, and subject.
Most Regents exams are offered in January, June, and August, and June is the most common
test date. Our file only indicates the term of test taking, and not the exact month. Using the
DOE’s translation of terms to dates, we compute years assuming the exam date is January 31st
or June 1st. Some students retake Regents tests, and in those cases, we use the first-time score.
Table B2 presents the number of students who take each exam more than once among the lottery
sample as well as the fraction of tests taken on the most common test date.
Other outcomes including credits, grade progression, attendance, and high school graduation
are all provided by the DOE. Data on Preliminary SAT (PSAT), SAT Reasoning, and Advanced
Placement (AP) tests come from the College Board via the DOE. Data on college enrollment
come from the National Student Clearinghouse, as reported to the DOE for their students.
Different outcomes generate different follow-up horizons, depending on the point at which they
are collected for students. Table B3 provides a complete account.
Our analysis file combines student registration, test scores, credit, attendance, and gradua-
tion outcomes, and college outcome files with the NYC small school applicant file. The small
school applicant file records grade, year, applicants’ preference ranking in the high school match,
and each student’s priority at each ranked school. Our analysis sample includes students who
applied for small school seats in one of the five school years between 2003-04 through 2007-08
for fall 9th grade enrollment. We focus on applicants enrolled in NYC at the time of applica-
tion because we’re interested in how an small high school education compares to a NYC public
fallback.
IV.2 Student Characteristics
Table 2 reports descriptive statistics for New York City 8th graders and for students enrolled at
small schools. Small school students are more likely to be black or Hispanic and somewhat more
likely to qualify for a subsidized school lunch than NYC’s 8th graders. The fraction of students
at small schools in the Bronx is higher than the fraction of NYC 8th graders from the Bronx.
There are relatively fewer students from Queens and Staten Island. Small school students have
significantly lower baseline scores than New York City students. The difference is roughly one
quarter of a standard deviation (hereafter, σ).
Since our research design is based on the high school match, we also tabulate student at-
There are Regents science exams in Earth Science, Living Environment, Chemistry, and Physics. The science
outcome we focus on is Living Environment because it is the most common Regents science exam taken by
students.
14

tributes based on their preferences. Table 2 reports on students who apply to small schools
by ranking them anywhere on their preference form, students who rank small schools and were
not offered a higher choice, students who rank a small school as a first choice, and students
subject to lottery at a small school. Across these columns, the make-up of applicants expressing
a preference for small schools is more similar to those enrolled at small schools than to the NYC
8th grade population. Comparing the lotteried applicants to students enrolled at small schools,
there is a higher fraction from the Bronx and relatively more black and Hispanic students (more
than 90% of the students we study). The baseline scores of lottery applicants are also lower,
averaging about 0.19σ below the city population for Math and 0.10σ below for English. The
baseline score difference between lotteried applicants and enrolled students emerges when we
compare those ranking small schools first to applicants subject to lottery (in column (5) and
(6)), and may be due to the fact that higher priority is given to students who attend small school
open houses or information sessions.
Because small high schools did not have resources needed to serve special education students
requiring self-contained classes and English-language learners adequately, they were allowed to
be added over a three-year time span when the new small schools opened (Bloomfield, 2006;
Gewertz, 2006b; Gewertz, 2006a). Students who were special education and limited English
proficient were manually placed into programs that could accommodate them and were therefore
not always subject to assignment based on lotteries. As a result, no students who are special
education and limited English proficient are in the lottery sample.
As a measure of our ability to construct randomly generated offers, in columns (7) and (8),
we report on differences in demographic characteristics and baseline scores between students
who were offered and not offered a seat. If offers are randomly generated, then they should be
independent of student demographics or baseline scores within risk sets. The numbers reported
are regression-adjusted differences by offer status within risk set. The regressions only control
for application year-first choice dummies. If we are able to successfully extract random assign-
ment, offers should be randomly assigned conditional on these covariates. The differences across
demographic characteristics and baseline scores are small and none are statistically significant.
This conclusion is supported by high p-values in a joint test of the hypothesis that all differ-
ences in demographic characteristics and baseline scores are equal to zero. These findings give
us confidence that we have successfully isolated the random variation embedded in the NYC
high school match.
IV.3 Small School Environment
Before presenting our main estimates, we first present an investigation of objective measures
of the school environment experienced by students who are in our experiment. Section VIII
15

contains additional information about school environments based on reports of students, parents,
and teachers from New York City’s Learning Environment Surveys.
Table 3 reports estimates of school enrollment rates by borough, per-pupil expenditure from
city-level school budget data, school and teacher characteristics from New York State school
report cards, and peer characteristics for the relevant group of compliers. Loosely speaking,
compliers are the subpopulation of students who are induced to enroll in a small school given
the random offer. More formally, let D1i denote small school enrollment status when the in-
strument Zi is switched on and D0i denote small school enrollment status when the instrument
Zi is switched off. Compliers are defined as those where D1i = 1 and D0i = 0. Although the
compliant population cannot be enumerated, their characteristics are non-parametrically iden-
tified, and estimated using the IV strategy described in Abadie (2003). We focus on differences
as experienced by compliers to precisely describe the variation induced by our experiment.
Offered and non-offered compliers are similar along many dimensions, and in many cases
their differences are swamped by differences with non-enrollees. Panel A shows that only 15%
of students not enrolled in a small school are at other Bronx high schools, while roughly 40%
of the students in our experiment enroll in a Bronx school. This fact is consistent with fallback
schools being located in neighborhoods similar to those where new small schools were created.
Panel B shows that the level and composition of average per-pupil expenditure for both offered
and non-offered compliers is similar. The absence of expenditure differences may be somewhat
surprising given that small schools had access to additional funds in start up years. Start up
grants on the order of $400,000 are relatively small compared to the total expenditure on direct
services of $6.2 million at schools attended by offered compliers. It’s also worth noting that some
aspects of school resources are not captured by information in school budgets, such as auxiliary
support donated by outside organizations.
Panel C illustrates important differences in school size and teacher characteristics between
offered and non-offered compliers. Non-offered compliers attend schools with 863 9th grade
classmates and 2,249 students across all high school grades. These numbers are similar to those
not enrolled at small schools, suggesting that in terms of size, the counterfactual fallback for
those in our experiment is like a typical NYC high school. Offered small school compliers are at
considerably smaller schools, with just over 161 9th grade classmates and 443 students across
all high school grades. That is, small school compliers attend schools that have five times fewer
classmates both in 9th grade and across all high school grades. This sharp difference in school
size motivates the analysis in Section IX, which uses our experiment to estimate the role of
school size in education production. Consistent with reduced school size, fewer core classes are
taught at small schools. However, the class sizes experienced by the two complier groups are
similar to one another and to those faced by non-enrollees.
16

Small school size is also associated with fewer teachers, assistant principals, and non-teaching
staff. DOE officials encouraged the new small schools to create cross-functional interdisciplinary
teams responsible for cohorts of students, rather than the traditional high school with teachers
organized into subject area departments (Nadelstern, 2005). Goertz et al. (2011) report that
in 2003-04, 34% of NYC’s newly hired teachers were from the New York City Teaching Fellows
program, an alternative certification program where teachers take graduate classes at night, and
about 5% were Teach for America (TFA) members. Hemphill and Nauer (2009) state that many
teachers at the new small high schools came from these two sources. Consistent with these
claims, offered compliers’ teachers have less experience and are less likely to be highly educated,
as measured by having a master’s degree plus 30 hours or a doctorate. Small school teachers often
had to take on administrative roles given the reduced staffing at small schools, and additional
work requirements may have lead to higher turnover rates (Hemphill and Nauer, 2009). The
estimate in Table 3 implies that 28% of teachers were not teaching at schools attended by offered
complies in the following year, while 19% of teachers were not teaching at schools attended by
non-offered compliers in the following year.
Panel D shows that the study body for those offered and not in our small school experiment
is similar in terms of minority status, subsidized lunch eligibility, and gender. Both non-offered
and offered compliers attend schools with more minorities than students who are not at small
schools. The proportion of peers who are special education or limited English proficient is
somewhat lower for offered compliers, but the differences are relatively small given what might
have been expected with the discretion associated with enrolling these two groups in small
school start-up years. For instance, the proportion special education at schools attended by
offered compliers is 0.08, for non-offered compliers it is 0.11, and for non-enrollees it is 0.10.
The fallback peer environment as measured by achievement for those in our experiment
is well below the typical NYC high school. Non-offered compliers attend schools where the
average baseline peer math score is −0.28σ, while non-enrollees are at schools with average peer
baseline math score of 0.11σ, a difference of 0.39σ. The differential when we compare the peer
environment for those in our experiment is not as large. Offered compliers attend school where
the average peer math baseline score is −0.07σ, which is a difference of 0.21σ compared to non-
offered compliers. Given that small schools were established to replace underperforming high
schools in disadvantaged areas of New York City, it is perhaps not surprising that both offered
and non-offered compliers attend schools with weaker peers than those at other NYC schools.
The difference in peer baseline scores among the two groups of compliers may also be related to
school closure efforts and the consequent shifts of remaining students to the extant high schools
in neighborhoods where small schools were established.
17

V Lottery Estimates
V.1 Regents
Applicants spend 0.46 years longer in a small school if they were randomly offered a seat than
those who do not before taking Regents Math, an exam typically taken in 9th or 10th grade.
This fact can be seen in column (1) of Table 4, which shows the “first stage.” The first stage
indicates the relationship between lottery offers and years at a small school before test-taking.
The size of the first stage depends in part on whether offered applicants accept their offer or opt
for other schools. Moreover, some students who do not receive an offer end up at small schools
either by re-applying in 9th grade or via the Appeals round of the HS match, which occasionally
allowed unassigned students to transfer to small schools after the main round. Regents Living
Environment is typically taken around the same time as Regents Math and therefore has a similar
first stage size. English and US History are usually taken in 11th grade and have correspondingly
larger first stage estimates. The size of the first stage is similar to those reported for other urban
high school populations participating in school lotteries, such as Abdulkadiroglu et al. (2011b)’s
study of Boston’s charter high schools.10
The reduced form effects of winning an offer at a small high school, reported in column (2),
indicate that those randomly offered score higher in all major subject areas: 0.06σ in Math,
0.08σ in English, 0.08σ in Living Environment, 0.07σ for Global History and 0.07σ for US
History. The two-stage least squares (2SLS) estimate of the effect of an incremental year in a
small school, in column (3), is the ratio of the reduced form estimate to the first stage estimate.
The 2SLS estimates show per-year gains on the order of 0.14σ for Math, 0.11σ for English, 0.18σ
for Living Environment, 0.11σ for Global History, and 0.09σ for US History. The addition of
controls for demographic characteristics and baseline scores does little to change the estimates,
as can be seen in columns (4) and (5), except for some small changes in precision.
Though these estimates are based on randomized lotteries, a potential threat to our study
design is that we are more likely to observe follow-up scores for some students than others. In
our sample, over 70% of students take Regents Math, and the follow-up rates hover around 65%
for the other Regents exams, shown in Table A4. However, if the tendency to drop out differs
by lottery status, it is possible that selective attrition biases our estimates. Table A4 reports on
follow-up differentials by offer status estimated using regression models that parallel the reduced
form estimates in Table 4. Positive estimates indicate that lottery winners are more likely to
10For example, in Table IV of Abdulkadiroglu et al. (2011b), the first stage estimate on the 10th grade math-
ematics examination is 0.54. In general, the size of first stages must be judged relative to the fact that the
urban high school population is highly mobile. See Angrist et al. (2013b) for further discussion of these issues for
Boston’s charter high schools.
18

have valid outcome test scores post-assignment. The estimates in column (2) show that there
are no statistically significant differences in Regents Math follow up. There are some statistically
significant, but small differences, on the order of 2.3-4.6 percentage points for the other Regents
test outcomes. The addition of controls for demographic characteristics and baseline scores does
little to change on these estimates.
Motivated by concerns on differential attrition, we report on a simple approach to see whether
selective attrition is responsible for the positive Regents estimates in Table 4. Since we have
pre-treatment test scores for applicants, we simply treat the baseline score as the outcome score
for students for whom it is missing. The baseline tests are taken in 8th grade statewide, like
the Regents, and are used to decide in middle school grade promotion decisions. This approach
assumes that the test score for both missing treated and untreated students is unaffected by
school assignment. While likely unrealistic, it provides a convenient benchmark to investigate
the role of attrition. As expected, the estimates are somewhat smaller in column (6) than in
column (5), but are similar overall.
Regents is a focal outcome for New York City’s high schoolers because it is taken widely and
is required for graduation. However, the Regents outcome is not necessarily ideal because of
allegations that it may have been compromised by selective re-grading at certain schools. Dee,
Jacob, McCrary and Rockoff (2011), for instance, identify clumping of Regents test scores at
65, with very few students scoring just below 65. These issues led to recent system-wide data
audits across schools, including a report by the Auditor General (Fleischer, 2012). This report
examined academic data for 460 high schools and identified 60 with the most troubling patterns
on Regents scoring and credits. Table A1 shows that 19 of the high schools in our eligible school
list were on the audit list, and 12 of these schools are part of the lottery sample. To identify
whether selective regrading is driving our results, in Table A6, we report on Regents Math
and English estimates excluding these audited schools. The Regents Math estimate remains
statistically significant at 0.11σ, while the English result is an insignificant 0.05σ.11
V.2 Credits, Grade Repetition, and Attendance
To graduate, students must meet credit requirements in addition to passing Regents thresholds.
Credits can be earned from either Regents course-taking or from courses without Regents assess-
ments such as Economics, Participation in Government, Visual Art, Music, Dance and Theatre,
and Health and Physical Education. Students entering 9th grade in our sample period must
earn at least 44 credits to graduate (NYSED, 2010; DOE, 2012c).
Small school attendance causes students to earn more credits and progress more rapidly
11Although not reported in the table, the Living Environment estimate is 0.165σ (with se=0.057), the Global
History estimate is 0.076σ (with se=0.049), and the US History estimate is 0.059σ (with se=0.030).
19
through high school. The estimates in Panel A of Table 5 show that small school students earn
an additional 1.37 credits per year. Students are considered “on track” for graduation if they
earn at least 10 credits per year or “on track for four-year graduation” if they earn at least 11
credits per year. 56% of non-offered students earn 10 or more credits per year, while 50% earn
11 or more credits per year. On-time progression, measured either way, increases due to small
school attendance. Students are 10 percentage points more likely to either earn 10 or more or
11 or more credits per year. Another way to measure on-time progression is by grade repetition.
Panel B reports on the effects of small schools on starting grade 10, 11, and 12 on time. For
each measure, small schools substantially increase the proportion of students who start their
sophomore, junior, or senior years on time.
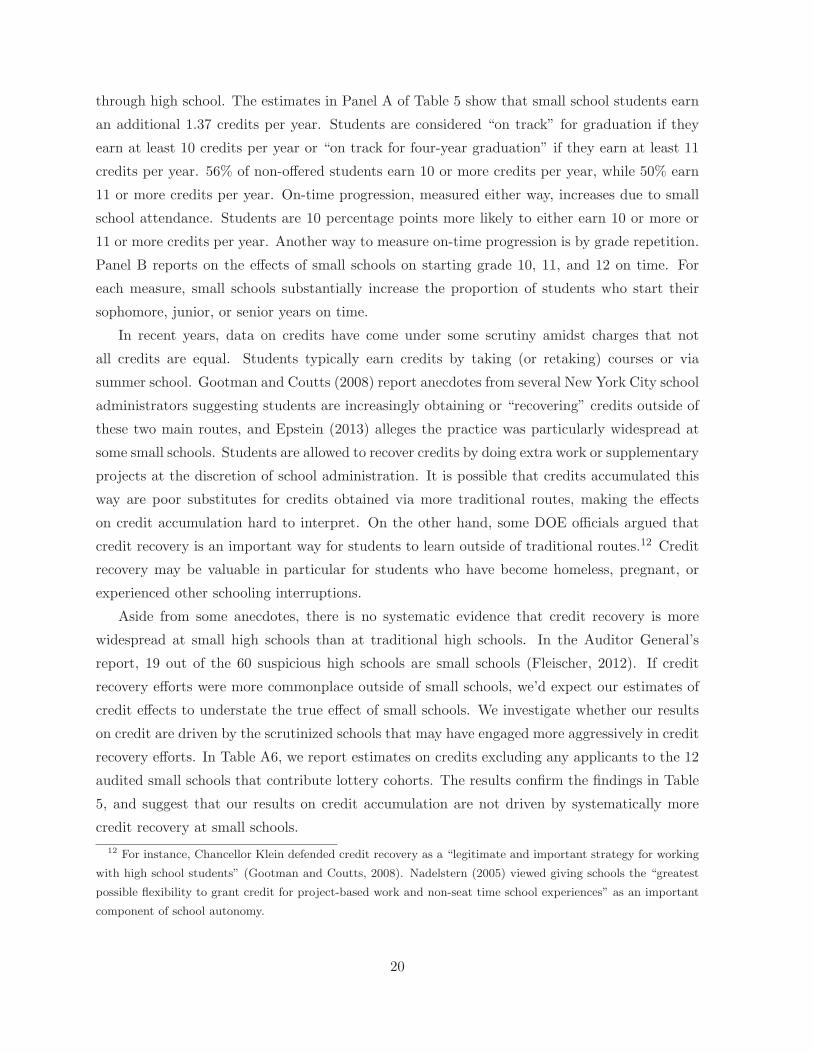
In recent years, data on credits have come under some scrutiny amidst charges that not
all credits are equal. Students typically earn credits by taking (or retaking) courses or via
summer school. Gootman and Coutts (2008) report anecdotes from several New York City school
administrators suggesting students are increasingly obtaining or “recovering” credits outside of
these two main routes, and Epstein (2013) alleges the practice was particularly widespread at
some small schools. Students are allowed to recover credits by doing extra work or supplementary
projects at the discretion of school administration. It is possible that credits accumulated this
way are poor substitutes for credits obtained via more traditional routes, making the effects
on credit accumulation hard to interpret. On the other hand, some DOE officials argued that
credit recovery is an important way for students to learn outside of traditional routes.12 Credit
recovery may be valuable in particular for students who have become homeless, pregnant, or
experienced other schooling interruptions.
Aside from some anecdotes, there is no systematic evidence that credit recovery is more
widespread at small high schools than at traditional high schools. In the Auditor General’s
report, 19 out of the 60 suspicious high schools are small schools (Fleischer, 2012). If credit
recovery efforts were more commonplace outside of small schools, we’d expect our estimates of
credit effects to understate the true effect of small schools. We investigate whether our results
on credit are driven by the scrutinized schools that may have engaged more aggressively in credit
recovery efforts. In Table A6, we report estimates on credits excluding any applicants to the 12
audited small schools that contribute lottery cohorts. The results confirm the findings in Table
5, and suggest that our results on credit accumulation are not driven by systematically more
credit recovery at small schools.
12 For instance, Chancellor Klein defended credit recovery as a “legitimate and important strategy for working
with high school students” (Gootman and Coutts, 2008). Nadelstern (2005) viewed giving schools the “greatest
possible flexibility to grant credit for project-based work and non-seat time school experiences” as an important
component of school autonomy.
20

Small school proponents argued that increased interaction and engagement at school would
reduce truancy. Panel C of Table 5 reports on the effect of small schools on absenteeism. The
number of days a student is absent is relatively high for this population. Students who are not
offered miss a total of 27 days on average. Consistent with the engagement hypothesis, small
schools decrease days absent by a statistically significant 4 days.
Finally, we report on PSAT and SAT outcomes from the College Board in Appendix Table
A4. Though these outcomes are often important college yardsticks nationwide, students in
our population can meet admissions requirements for many of New York City’s local colleges,
including those in the CUNY system, without taking the SAT. Nearly two-thirds of New York
high schoolers in our sample take the PSAT, and small school attendance increases this rate by
significant 13 points. However, there is relatively little evidence that PSAT scores increase among
test-takers, though this result may reflect a change in the composition of test-takers. About a
third of NYC’s high schoolers take the SAT, but small schools neither increase taking rates,
nor do they increase SAT scores among test-takers. Roughly 9% of students take an Advanced
Placement exam, which are supposed to allow students exposure to college-level material courses
and even earn college credit. Here, too, small school attendance has little effect on AP test-
taking. However, it’s worth noting that the taking rate on SATs and APs is relatively small for
students in our sample. By comparison, in the Angrist et al. (2013b) sample of Boston charter
high schools, nearly two-thirds of students take the SAT and more than a quarter of students
take an AP exam.
V.3 Graduation
Creators of small schools emphasized a college-preparatory curriculum for all students, which
most interpreted as meeting high school diploma requirements (Foley et al., 2010). Given that
small schools increase Regents scores and credit accumulation, we’d expect that small schools
increase high school graduation rates. However, this is not immediate because during our sample
period credit requirements for graduation stayed the same, but Regents requirements did not.
For students entering 9th grade in 2004, the minimum graduation requirement was to score 55
or higher on at least five Regents exams. Each year, the Regents requirements became more
stringent. For entering 9th graders in 2007, students needed to score 65 or higher on four Regents
exams and also score 55 or higher on another Regents test (DOE, 2012b).
In Table 6, we consider the effects of small school attendance on high school graduation.
Just over half of the students in our study receive a high school diploma. During our sample
period, students in New York City were eligible for three different levels of diplomas. Local
21

diplomas are offered for students who do not pass Regents diploma requirements.13 Regents
diplomas require passing at least five Regents exams, while Advanced Regents require passing
at least eight Regents exams (DOE, 2012c). The Regents diploma is the most common diploma
type for students in our sample.
Table 6 shows that small schools increase the high school graduation rate by over 9 percentage
points, an effect almost entirely driven by an increase in the fraction of students awarded Regents
diplomas for which the effect is 10 percentage points. Relative to the mean proportion for non-
offered, the 10 point increase in Regents diplomas represents nearly a 30% increase. Small
schools do not have any effect on the awarding of either local or Advanced Regents diplomas.
When we exclude audited high schools in Table A6, the effects on graduation are, if anything,
higher. The overall graduation rate increases by 10 percentage points and the fraction who
obtain Regents diplomas increases by 12 percentage points.
Though the Table 6 estimates show that small schools caused graduation rates to increase,
the overall graduation rate in New York City also increased during our study’s time period.
As a result, there is a concern that increased graduation does not mean students are in fact
college-ready. In particular, the city’s local colleges have seen increases in the size of their
remedial classes and some view this as a consequence of a relaxation of graduation requirements
(Foderaro, 2011). A criticism like this would impact all high schools, and not necessarily only
the new small high schools. However, we can employ our lottery design to study whether small
school students are meeting the requirements to avoid remediation once they arrive at college
Our definition of remediation is based on requirements at CUNY institutions, which enroll
the largest fraction of students in our study. CUNY students can avoid remedial coursework
either by taking the CUNY Assessment Test (CAT) or by scoring above certain thresholds on the
SAT, ACT, or Regents exams. These requirements differ across CUNY campuses. For instance,
at CUNY Baruch, a student who scores 510 or higher on SAT Math, 21 or higher on the ACT, or
75 or higher on Regents Math to skip mathematics remediation, while at CUNY Queensborough
a student needs a 480 on the SAT, 20 on the ACT, or 75 or higher on Regents Math. There are
similar thresholds for reading and writing. During our sample period, the CUNY remediation
thresholds have changed over time.14
Even though we do not have access to either CAT or ACT scores, we code a student as not
remedial if they score above a 75 on the Regents or above a 510 on the SAT portion. We use
Regents English for both reading and writing. If students do not take either exam, then under
13Local diplomas have since been phased out by the New York State Department of Education.14Starting in Fall 2012, students are required to score at least 80 on any of the new Regents examinations
and for Mathematics, they must complete Algebra 2 & Trigonometry or a higher-level course. These thresholds
do not apply to our sample period. For additional details, see http://www.cuny.edu/academics/testing/cuny-
assessment-tests/faqs.html, last accessed: September 2013.
22

this definition, they are coded as remedial. Table 6 shows that in our sample, only about 20%
of students are not remedial for Math while about 30% of students are not remedial for English.
These numbers are low partly because they include students for whom we do not have either
Regents or SAT outcomes. Even absent this consideration, the low numbers are perhaps not
surprising given that small school students enter high school with substantially lower baseline
scores than other NYC 8th graders. Small schools do reduce remediation for writing and reading,
but not for math. The effect size is a statistically significant 9 percentage points, which is
relatively large compared to the 31 percentage point mean for non-offered students.
VI College Enrollment and Choice
Small school advocates conjectured that personalized attention and frequent interaction would
increase student motivation, encouraging them to stay in school, and ultimately graduate and go
to college. Increasing college attendance was an explicit goal of the Gates Foundation, and this
was reflected in intermediaries’ intense focus on college-going expectations and supplementary
student advising (Foley et al., 2010). Even though more than half of the students in our sample
graduate high school, 28% of our non-offered applicants enroll in college four years after starting
9th grade and about 37% enroll within six years.15
Small schools have a large and significant effect on college enrollment. Table 7 shows that
students are 7 percentage points more likely to attend college, which represents nearly a 20%
increase relative to the attendance rate for non-offered students. Some interventions which
successfully reduce dropout rates no longer have significant effects when outcomes are measured
over a longer window (see, e.g., Rodriguez-Planas (2012)). Here, the effect on college attendance
within four years after starting high school is similar to the estimate for attendance within
six years, suggesting that non-offered students are not simply delaying college enrollment and
catching up to offered students. Table 7 also reports estimates on attendance at two- or four-year
colleges, using the classifications in the National Student Clearinghouse. It’s worth noting that
attending a four-year college does not necessarily imply that a student is in a four-year degree
program, because schools which offer both two- and four-year degrees are coded as four-year
institutions. In our sample, the fraction who attend a two-year college is about the same as
the fraction who attend a four-year college (if a student attends both a two-year college and a
four-year college, they are counted twice in this calculation).
Small schools boost attendance at four-year institutions by a statistically significant 6 per-
centage points, while leaving the effect on two-year colleges unchanged. Gains at four-year
15The six-year enrollment rate is greater than the fraction who ever attend college reported in the first row of
Table 7 because we only report on attendance within six years for cohorts we can follow six years post-assignment.
23

colleges are almost entirely driven by gains at four-year public colleges. Moreover, the largest
college gains come from a shift of the fraction of students attending CUNY institutions. The
most commonly attended CUNY colleges are Borough of Manhattan, Bronx Community College,
New York City College of Technology, and Lehman College. There is no evidence of increases
at four-year private colleges.
Data from the National Student Clearinghouse also allow us to investigate college persistence.
Persistence is measured by the likelihood of attempting at least 2 or 4 academic semesters in
college.16 Looking further out in a student’s schooling career reduces the size of the persistence
sample compared to the sample use to study college enrollment. Small school attendance in-
creases the fraction of students who attempt college for at least 2 academic years by 5 percentage
points, an effect which is marginally significant. The estimates for at least academic 4 semesters
are positive, but not precise enough to rule out a zero effect.
VII Other Results
VII.1 Subgroups
The new small schools were launched with the goal of serving struggling students across all
demographic groups (Foley et al., 2010). While the students who enroll are more likely to belong
to a minority group, are poorer, and have lower baseline scores than typical NYC 8th graders,
the fact that applicants obtain priority for some small schools by attending high school fairs
generates some important differences between small school enrollees and the lottery applicants,
as shown in Table 2. Therefore, it is natural to study whether certain student subgroups benefit
more or less from small school attendance.
Table 8 reports estimates for subgroups based on student demographic characteristics and
baseline achievement levels for several of our key outcomes of interest. Test score results tend
to be higher for girls than boys, but graduation and college results are similar for both groups.
The similar effects by sex on four-year college enrollment are noteworthy given evidence that
girls usually outperform boys in other related studies (Anderson, 2008; Deming et al., 2011).
Across racial groups, there is a large 0.34σ effect on Regents Math for black students, which
is much larger than the corresponding estimate for Hispanics. On the other hand, there is no
difference in the estimates between blacks and Hispanics for Regents English, both of which are
positive but relatively imprecise. The effects for high school graduation, Regents diplomas, and
college attendance are similar in magnitude for blacks and Hispanics, though as expected given
smaller sample sizes, the estimates are no longer statistically significant in many cases. One
16We treat an academic semester as enrollment in January-May or August-December.
24

interesting pattern is that black students are 8 percentage points more likely to attend four-year
public colleges; this effect is larger than our overall effect and has the same significance level.
The effects for students who obtain a subsidized lunch are similar to the effects from our
overall population, which is perhaps unsurprising given than more than 70% of our sample is
eligible. However, small schools push these students to attend four-year public colleges, a notable
finding given evidence that poor students often do not matriculate at four-year institutions
(Deming and Dynarski, 2010; Bowen, Chingos and McPherson, 2009; Hoxby and Avery, 2012).
Small school critics allege that the new schools did not serve students who were harder to
educate (see, e.g., Bloomfield (2006)). They point to the fact that some small schools were
allowed to exclude some special education and limited English proficient students for their first
three years. To investigate differences by students’ prior levels of achievement, we split our
sample into two groups based on having a baseline score above or below the median among
lottery applicants, which is already a lower-scoring population. For Regents outcomes and
graduation, there is no evidence that small schools were less effective with low baseline students.
The high school graduation effect for low baseline students is 7 percentage points, it is not
statistically significant, while the effect for high baseline students is a significant 11 percentage
points. However, we cannot reject that these two estimates are different given our precision
levels. Small schools cause high baseline students to earn more Regents diplomas, but not low
baseline students. The difference here is statistically significant.
The flip side of the argument that small schools are ineffective for hard-to-educate students
is that their focus on these students detracts from those entering with higher achievement levels.
For instance, Hemphill and Nauer (2009) write that “small schools, by pouring resources into
helping needy students catch up, may shortchange students who have stronger academic skills.”
At least for outcomes related to college, Table 8 presents evidence for the exact opposite pattern
since the effects are larger for students with higher baseline scores. High-baseline students are 9
percentage points more likely to attend college and 10 percentage points more likely to attend
four-year public colleges. The effects on college enrollment outcomes for low-baseline students
are positive, but are not precise enough to rule out zero effects.
VII.2 Schools Over Time and Closed Schools
Given changes in the school landscape after the initial big push for small school creation, it is
natural to ask whether schools opened after the last pledge of major support from the Gates
foundation in 2005 perform differently than schools opened beforehand. In particular, some have
worried that after small schools became more established, their student population changed and
this reduced achievement levels (Ravitch, 2011). In Table A6, we report estimates where we
sample into two groups: schools opened between 2002-05 and those opened between 2006-08.
25

Our lottery design allows us to consider 95 our of 118 programs opened from 2002-2005 and 13
out of 33 programs opened from 2006-2008. We see a consistent pattern of effects across these
two groups of schools, and in many cases the effects are larger for schools opened in 2006-2008,
even though the coverage of the lottery sample is considerably smaller for 2006-2008, so it’s
possible that new undersubscribed schools fare differently.
While establishing new schools, the NYC DOE also phased out or closed schools during our
time period citing lackluster performance. Through 2012, 13 small high school programs eligible
for our study have been closed, 9 of which are in the lottery sample. In Table A6, we also report
our main estimates excluding these schools. Each point estimate for Regents, graduation, and
college is larger when we exclude closed schools, though given that only a handful of schools have
been closed, we do not have the precision to confidently assert these estimates are statistically
different from those including the closed schools.
VII.3 Intermediaries
Each small school model can be seen as a set of preferred practices and features that affect
school performance. Intermediaries, typically nonprofit organizations that operate between pol-
icymakers, funders, and entities charged with implementing new programs and practices, played
an important and continuing role in small school development. Intermediaries often distributed
grant funds to schools and provide advice on creating, incubating, and operating small schools
(Foley et al., 2010). Eight intermediaries– New Visions, Urban Assembly, Replications, NYC
Academies, Institute for Student Achievement, College Board, Outward Bound – were involved
in creating and supporting more than 90% of the schools in our study. The customization
provided by these intermediaries is at the heart of the small school reform idea.
To provide examples of the heterogeneity across intermediaries, we describe a few patterns.
New Visions supports the largest number of schools, each of which focuses on college-readiness
and support for individualized instruction. Urban Assembly’s themes range from law and govern-
ment, media, and the arts to wildlife conservation, maritime studies and green careers. Repli-
cations scales up small schools, by identifying the essential features of successful schools and
supporting new school leaders during start up. NYC Academies are career academies supported
by the National Academy Foundation. These schools train students for careers in industries with
strong growth and employment potential. The Institute for Student Achievement specializes in
turnaround efforts in New York City and elsewhere. They have their own college preparatory
program, which features a trademarked “distributed counseling” system of personalized instruc-
tion. College Board has a proprietary curriculum aimed at increasing diversity of students in
Advanced Placement courses that focus on inquiry, problem solving, collaboration and persua-
sive writing. NYC Outward Bound schools emphasize hands-on activities and expeditions; all
26

students go on a weeklong wilderness trip intended to teach teamwork and perseverance. The
schools also have a “crew” system where a group of students have daily meetings with one
teacher throughout high school.
Another motivation for studying effects by intermediaries is to examine whether some small
school models are more effective than others. Cullen et al. (2013) conjecture that career and
technically-focused high schools may be more successful than other thematic schools. It is also
worth noting that the trajectory of expansion and contraction has differed by intermediary.
For instance, 3 new Urban Assembly high schools were opened between 2006-08, while only 1
school in the Replications and NYC Academies network opened during the same time period.
In 2011, the NYC DOE terminated their contract with Replications, stating that while they
were successful in launching schools, they were not as successful in managing them afterwards
(Phillips, 2011).
While small school operators have been seen as pursuing a diverse array of school visions,
some expressed skepticism about the resulting heterogeneity in the small school portfolio. For
instance, Ravitch (2011, p. 81) writes:
“Most of the new small schools were theme schools, centered on a specific profession
or speciality. This produced some offbeat results, such as a high school for future
firefighters; a school for the hospitality industry; a school for urban planners; a
school for architecture; a school for the business of sports; a school for the violin;
several schools for social justice, peace, and diversity; and other schools for the health
professions, writers, leaders, the arts, law, technology, communications, journalism,
and media. Adults like the idea of themes, but few children starting ninth grade are
prepared to select a profession or career speciality.”
On the other hand, the Department of Education did not place firm requirements on how themes
were fulfilled, and adherence to theme does not seem to have played a role in accountability
decisions (Gootman, 2005).
The non-offered and offered complier school environments, for the variables examined in
Table 3, are similar on many dimensions when split by intermediary. Table A5 shows that
offered small school compliers face significant differences in school sizes relative to the untreated.
Teachers at their schools are also somewhat less experienced and less highly educated, while
baseline peer achievement is higher.
Table 9 reports on lottery estimates by intermediaries. The estimates come from models like
equation (1), but estimated separately for schools classified by intermediary. (Table A2 presents
information on application patterns by intermediary.) With this approach, some students who
are not treated at a particular intermediary nonetheless enroll in a small high school in our study.
27

This can be seen in Table A5, which shows complier small school enrollment rates for each of the
intermediaries. For instance, 46% of non-offered Urban Assembly compliers enroll at another
small school outside the Urban Assembly family. That table also shows that this exercise not only
captures the effect of different intermediaries, but it also captures the consequence of different
fallback positions. For instance, non-offered compliers at schools supported by Replications
attend schools with peer achievement levels about 0.2σ below New York City’s average in math,
while students who attend schools supported by the NYC Academies attend schools more than
0.4σ below. Finally, the sample size shrinks, especially at Institute for Student Achievement,
College Board, and Outward Bound, making any conclusions for these intermediaries tentative.
There are large and significant effects on Regents Math for five intermediaries: New Visions,
Urban Assembly, Replications, NYC Academies, and College Board. The effect on obtaining a
Regents Diploma is also large and positive for New Visions and Urban Assembly; though it is not
negative for any other intermediary, the significance levels vary and most effects are not precise
enough to be useful. Urban Assembly schools increase PSAT taking and scores, SAT taking,
and AP test taking (shown in Table A4). Effects on college, measured either by attendance,
four-year college attendance, or four-year public college attendance are mostly positive, with the
most consistent pattern for New Visions schools.
It bears emphasis that the sample of applicants from New Visions is the largest, and the
absence of significant results for other intermediaries may simply reflect the small sample sizes.
Still, none of the estimates on four-year college are negative, though some are too imprecise to
be meaningful. Given the fact that differences in effects across intermediaries may be due to
differences in fallback options, differences in students, and differences in school practices, it is
hard to draw firm conclusions about the relative performance of particular intermediaries from
this analysis alone (see, Angrist et al. (2013a), for a similar discussion of the interpretation
of heterogenous charter school effects). The most noticeable pattern from Table 9 is that no
single intermediary seems to be universally poor-performing on all outcomes. Understanding
differences across intermediaries seems worth additional investigation.
VIII Mechanisms and Changes in School Environment
The common denominator across the 108 schools in our sample is their small size. We’d also
like to know more about other differences in the small schools’ learning environment. However,
defining and measuring changes in school environment tends to be a difficult task. Fortunately,
starting in the 2006-07 school year, the New York City Department of Education launched the
nation’s largest survey effort to describe the school learning climate. The survey is completed
by students, parents, and teachers, and by 2009, 80% of eligible students and 73% of eligible
28

teachers completed the survey (see the data appendix for more details).
We use information from these surveys to characterize the school environment based on stu-
dent, parent, and teacher responses. In particular, we focus on describing changes in the school
environment for those in our experiment. Although we do not have the survey responses made
by the students in the sample, we report on the mean survey response at schools attended by
the non-offered and offered compliers. In 2003, small schools advocate Thomas Toch articulated
a vision for small school success (Toch, 2003, p. 13):
“Smaller schools encourage bonds between students and teachers and generate a
level of genuine caring and mutual obligation between them that’s found far less
frequently in comprehensive high schools. Students and teachers, as a result, tend
to work harder on each other’s behalf. Student and teacher attendance and stu-
dent involvement in extracurricular activities are higher in smaller schools. Teacher
turnover and disciplinary problems are lower. [...]
The best schools have a clear sense of what they hope to achieve with their students.
They are “focused.” Their curricula, their teaching strategies, the way they organize
their school day, even, in many instances, the design of their buildings, are aligned
with their educational aims. [...]
Successful schools also have high academic expectations for every student. That is
their defining characteristic.”
We investigate several aspects of the small school environment motivated by this quote. The
survey contains multiple questions about the school environment organized into four categories:
1) engagement, 2) safety and respect, 3) academic expectations, and 4) communications. Each
response is awarded a score between 0 and 10 by the DOE, with 10 reflecting the most favorable
for a school’s learning environment. We use data from 2006-07 through 2008-09, which covers the
most relevant years for students in our sample. To have a normalized benchmark, we standardize
responses across schools to have mean zero and unit variance.
For each category, we compute the difference for the survey-reported characteristics for our
enrollment compliers using methods in Abadie (2003). Researchers working with similar survey
datasets often construct indices to combine multiple outcome variables and have developed
inferential methods to deal with correlation across them (see, e.g., Kling, Liebman and Katz
(2007)). Though this approach is parsimonious, we instead report the answers to a few specific
questions to highlight the richness of the survey. For each category, we rank the survey questions
by the greatest difference between the answers for non-offered and offered compliers. To illustrate
the range of responses, we report the two questions for which the difference in favor of small
schools’ learning environment is largest and the two questions for which the difference against
29

small schools is largest. We also report the fraction of questions for which the small school
learning environment is favored over the counterfactual fallback school environment for those in
our experiment.
Small schools are rated higher on the overwhelming majority of questions on engagement,
safety and respect, academic expectations, and communications. This can be seen in Table 10,
which reports survey questions based on student responses. (Parent survey responses are similar
to student responses in that small schools are rated higher for the most questions in each of the
four categories. They are reported in Table A7.) Small schools employ numerous strategies to
increase engagement in addition to thematic programs and external partnerships. For instance,
at some Urban Assembly schools, teachers make home visits (Santos, 2011). These strategies
are reflected in the fact that the small school environment is associated with higher levels of
engagement on 10 out of 11 questions.
The largest difference in the engagement category in favor of small schools is for the question
about whether the adults that students see at the school know students. Here, non-offered com-
pliers are at schools that are 1.0σ worse than the typical NYC high school (which is normalized
at zero). On this metric, offered small school compliers are at schools roughly 0.5σ better than
the NYC average, resulting in a 1.5σ difference in the environment faced by non-offered and of-
fered compliers. The second largest difference in engagement is for the question about whether
adults look out for students. Here, offered compliers’ schools are at 0.2σ, while non-offered
compliers’ schools are at −0.8σ. These survey answers are consistent with greater monitoring
and increased interaction at small schools.
Toch’s quote expresses the idea that small schools will involve students in more extracur-
riculars. While the surveys do not capture extra-curricular participation, the largest difference
against the small schools environment is for the question about the variety of classes and activ-
ities. The variety of classes and activities experienced by non-offered compliers is much greater
than the NYC average, and 0.8σ greater than that experienced by offered compliers. This
finding, instead, is consistent with the view stated by Ravitch (2011, p. 205) who laments that
“because of their size, they seldom have enough students or teachers to offer advanced courses in
mathematics and science, elective, advanced placement courses, career and technical education,
choir, band, sports teams, and other programs that many teenagers want.”
The description of the small school environment is also more favorable for the three other
categories. On safety and respect, offered small school compliers are at schools with a greater
sense of community (measured by disagreement with the statement that most students in my
school just look out for themselves). Small schools are also associated with less gang activity
and outrank the untreated counterfactual school environment on 19 out of 20 questions on safety
and respect. This finding is important given concerns about placing new small schools on the
30

same campuses as struggling schools vulnerable to safety concerns (Miller, 2005). On academic
expectations, offered compliers are at small schools that regularly complete essays and where
high-achievers are treated with respect. There is little difference on college counseling, however.
On communication, the environment experienced by non-offered compliers dominates by a wide
margin on all five questions. Students consistently work in groups, feel comfortable talking to
their instructors, and participate in hands-on activities.
Table 11 reports the results of a similar exercise based on teacher survey responses. The
higher rates of teacher turnover shown in Table 3 might suggest a poor work environment at
new small schools. However, based on teacher survey responses, on a large fraction of questions,
offered small school compliers are at schools where teachers report greater engagement, safety
and respect, academic expectations, and communication. Among the many questions, we high-
light a few where the differences are most stark. First, the contrast in the fraction of teachers
who report reacting to feedback and using data to improve instructional decisions is large, but
the mean level for offered compliers is near the NYC average. Second, the positive teacher’s as-
sessments on safety and respect are nearly identical to those reported in student surveys. Third,
teachers report their schools have a clear vision and that there is effective communication with
parents when students misbehave. For our experiment, the one dimension where the small school
environment is unfavorable (as reported by teachers) is on issues related to principal supervision
and management.
Overall, a consistent picture emerges about the small school environment, whether as de-
scribed by student or teacher survey responses. Together with the results on truancy, many
of the mechanisms present in the Toch quote appear to be validated (except extracurricular
activities and teacher-principal interaction). Interestingly, many of these features where the
small school environment dominates, including use of data to guide instruction, frequent teacher
feedback, and high academic expectations, are shared by the high-performing charter schools
studied by Angrist et al. (2013a) and Dobbie and Fryer (2013a).
IX School Size in Education Production
The estimates here show remarkably consistent gains for small school attendance on test scores,
graduation, and college enrollment. These estimates speak to questions about the impact of
Bloomberg-era reforms in the nation’s largest school district. They are also relevant for policy
questions such as the expansion of small schools and closing underperforming schools.
We’d also like to investigate whether there are more general lessons from our analysis of
small schools. The role of school size in education production is an important question in the
economics of education. Conant’s (1959) original argument for large comprehensive high schools
31

was mostly based on scale economies. A subsequent literature has tried to characterize optimal
school sizes, with some claiming that high schools with about 600-900 students balance scale
economies with the negative effects of large schools (see, e.g., Andrews, Duncombe and Yinger
(2002)). Many arguments for small schools parallel those made in similar debates on small class
sizes. For instance, Lazear (2001) develops a disruption-based model of learning and shows that
optimal class size is larger for better-behaved students. It is possible to interpret his model
as one of school size with the same underlying mechanism, with the implication that a smaller
school size is preferred for harder-to-educate students. Understanding the role of school size for
achievement also seems important as school choice expands, causing many traditional district
schools to become smaller.
The evidence from school surveys suggests that small schools differ from other schools on
many dimensions. It is clear from Table 3, however, that students who attend small schools
are at schools with considerably smaller student bodies, whether measured by the number of
9th grade classmates or the number of students at the school across all high school grades. To
turn this fact into a more general statement about the effects of school size requires stronger
assumptions. In particular, we must assume that small school offers affect achievement solely
through changes in school size. In their context, Abdulkadiroglu et al. (2011a) describe two sets
of assumptions which justify using exam schools to study the causal effects of peers. We briefly
review their arguments in a parallel effort to explore how our small school experiment identifies
causal school size effects.
We begin by positing a simple model of education production, where mi denote a vector of
education inputs measured in the small school entry grade:
yi = π′mi + ηi.
The mediators in mi include school size, measures of school quality, and teacher effects. If we
partition mi into measures of school size si and other unobserved inputs wi:
mi = [s′i w′i]′,
then
yi = β′si + γ′wi + ηi.
The first argument is based on a 2SLS version of the omitted variables bias formula (see,
e.g., Angrist and Krueger (1992)). If small schools have better unmeasured inputs, then 2SLS
estimates of si omitting wi tend to be too big. The descriptive patterns in the Learning Envi-
ronment Surveys described in Section VIII suggest that small schools are associated with higher
levels of engagement, safety and respect, academic expectations, and communication. It is there-
fore plausible that the omitted variables in wi are beneficial for student achievement. Under
this interpretation, our estimate provides an upper bound on the effect of school size.
32

The second argument is based on the idea that any school input correlated with small school
offers is itself caused by differences in size. That is, the relationship between unobserved school
inputs wi is a consequence of the affect of school size (e.g., students are monitored more closely
because small schools have smaller size; the ability to have frequent interactions with pupils
affects teaching styles; improved communication is the result of fewer students). If we assume
that the randomly generated offer affects school size, and school size in turn affects these other
unmeasured inputs (i.e. a triangular structure), then 2SLS estimates treating si as endogenous
combine both the direct and indirect effects to capture the total effect of randomly assigned
school size.
Table 12 reports estimates of two versions of 2SLS models where school size is measured
either by the size of the 9th grade class or by the number of high school classmates. The first
stage estimates, shown in Panel B, are large and precise for both measures, consistent with
the sharp differences in school size shown in Table 3. The estimates imply that a small school
offer leads to 269 fewer 9th grade classmates or 701 fewer high school classmates. Though these
estimates come from a linear model, they do not impose a linear relationship, since the 2SLS
estimates can be interpreted as the weighted-average causal response to school size.17
The 2SLS estimate shown in Panel A imply that a 100 student reduction in 9th grade size
causes a 0.024σ increase in Regents math. In particular, the standard error on this estimate
is 0.007, implying that we have the power to detect small effects. For the other outcomes, the
precision of the 2SLS estimates of school size are similar to that of the 2SLS estimates treating
small school enrollment as endogenous reported earlier. For instance, a 100 student reduction in
the number of 9th grade classmates causes a statistically significant one point increase in college
attendance. Estimates of the causal effect of school size measured by grade 9-12 classmates are
similar, but roughly three times smaller, as expected given the differences in the magnitude of
the first stage.
Taken together, these estimates indicate that incremental changes in school size are likely
to have very small effects on student achievement. Instead, dramatic changes in school sizes,
such as those that occurred in New York City, would be necessary to have a significant impact
on racial and socioeconomic gaps. In this context, it also helps to draw a comparison to the
debates of the importance of input-based schooling policies (Hanuschek, 2003; Krueger, 2003). In
particular, there are now a number of well-controlled estimates of class size effects (Angrist and
Lavy, 1999; Krueger, 1999; Chetty, Friedman, Hilger, Saez and Schanzenbach, 2011; Dynarski
et al., 2011; Fredriksson et al., 2013). Estimates of the effect of class size reductions of roughly
7 fewer students from Krueger (1999) imply a 0.18 standard deviation increase in Stanford
17The weights are proportional to the effect of the instrument on the cumulative distribution function of the
endogenous variable (Angrist and Imbens, 1995).
33

Achievement Tests. Here, too, one or two fewer students in a class seem likely to have small
effects. On the other hand, incremental changes to either class or school size may be less policy-
relevant than larger-scale changes.
X Conclusion
The reconstitution of large high schools into smaller ones in New York City and elsewhere has
left a lasting legacy on America’s public high schools. The random variation created by NYC’s
high school match provides a unique opportunity to estimate the causal effects of NYC’s small
schools free from selection bias. We find consistent evidence that small schools boost student
achievement on important graduation milestones, including on five different Regents exams,
grade progression, and credit accumulation. Small school students are more likely to graduate
high school and earn Regents diplomas, and are less likely to require remediation in reading and
writing when they enter college. A large fraction of small school students are pushed to four-year
public institutions and those within the CUNY system. The evidence, so far, also indicates that
they are more likely to persist in college, as measured by matriculation for at least two academic
semesters. As the cohorts in our study age, it will be possible to study longer-term measures of
college persistence and college graduation.
The estimates reported here are best seen as indicating possibilities for urban small schools
reform. Our lottery design necessarily requires that schools be unselective and oversubscribed.
It is worth noting, however, that our sample is not isolated to a handful of schools nor do we
have idiosyncratic coverage of particular schools assisted by only some intermediaries. The 108
school programs in our study represent over 70% of those eligible. Oversubscribed schools are of
considerable policy interest, especially in light of Mayor Bloomberg’s stated goal in 2010 to phase
out the lowest performing 10 percent of city schools over the next four years (Otterman, 2010).
The requirement that students are subject to lottery-based rationing also implies that special
education and limited English proficient students are excluded from our lottery sample. Still,
it is worth emphasizing that the students in our sample are disadvantaged by most traditional
measures. More than 90% of students in our lottery sample are black or Hispanic, at least
70% obtain subsidized school lunches, and the majority have lower baseline scores than typical
NYC 8th graders. Our investigation of effects across subgroups indicates that small schools are
effective for a broad set of students.
Proponents argue that students are more easily monitored and safer at small schools; this
in turn increases their motivation and attendance, and ultimately graduation and college at-
tendance. The evidence on these mechanisms is borne out in our investigation of incredibly
detailed data from New York City’s School Learning Environment Surveys. Small schools cause
34

a significant decrease in truancy. Survey respondents associate small schools with greater lev-
els of engagement, safety and respect, academic expectations, and communication. Moreover,
the consistency of the results across intermediaries, though sometimes imprecise, suggests that
school size is an important common ingredient. When we channel the school effects through
school size, the estimates imply that incremental changes in school size will be insufficient to
have significant effects on achievement gaps, whereas large-scale changes like those that took
place in New York City may be necessary.
Our findings stand out when compared to a literature with relatively few examples of success-
ful interventions for inner-city public school students, especially for college choice and enrollment.
Given this, some have argued that high school may be too late to reduce skill gaps and efforts
should therefore be concentrated earlier or even before the start of a student’s schooling career
(see, e.g., Cunha and Heckman (2007) and Cunha, Heckman and Schennach (2010)). Moreover,
interventions showing the greatest promise for urban populations have so far come from high-
performing charter schools such as KIPP or Harlem’s Promise Academies, which operate outside
traditional district boundaries (Angrist et al., 2012; Dobbie and Fryer, 2013a). Even though the
small high schools studied here had auxiliary support from foundation grants and advocacy ef-
forts, they still operate with the same school calendar and under the same collectively-bargained
work rules as other New York City high schools.
The common features of these high-performing charter schools and the small schools studied
here include high expectations, close monitoring, frequent interaction, and the use of data-
driven instruction. While the “No Excuses” style charter schools with these practices embody
a relatively well-defined model, NYC’s small schools are horizontally differentiated with themes
designed to engage low-performing students. Cullen et al. (2013) and Murnane (2013) argue that
increasing the variety of educational offerings at high school is a worthwhile pursuit, especially
if it increases the match quality between students and schools. In future work, we intend to
further explore heterogeneity across small school models and examine issues related to how the
new small schools affect student sorting.
35


")")")
")")
")
")
")
")")
")") ")")
")
")")") ")
")")
") ")")
")") ")
")
")
")
")")
")")
")
")
")
")
")
")")
")
")
")
")")")
") ")
")
")
")
")")
")")
")") ")
")")
")
")")
")
")
")
")
")
")
")
")
")
")
")")
")
")")")") ")")
")
")")") ")
")
")
")
")
")")
")
")
")
")")
")
")
")")
")")")
")")")") ")")
")
")")
")
")
")
")
")
")")")
")
")
")
")
")
")")
")")
") ")")
")
")")")
")
")")
")
")
")
") ")")")
") ")
")
")")
")") ")")")
")
")
")
")
")
")
")
")
")
")
")")
")
")")
")
")
")") ")
")")
")")")
")")")
")
")
")
")
")")
")
")
")
")
")")
")
")") ")")
")
")")
")")
")
") ")
")
")
")
")
")
")
")")
")
")
")
")
")
")
")
")
")
")
")
")
")
")
")")
")
")
")
")")
")")
")")
")
")
") ")
")")
")
")
")
")
")
")
")
")
")")
")
")
")
")
")
")
")
")
")
")
")
")
")
")")")
")
")")")")")")")")
# *# *# *
# *# *# *
# *
# *
# *# *# *
# *
# *
# *
# *
# *
# *
# *
# *# *# *
# *
# *
# *# *# *# *
# *
# *
# *
# *
# *
# *
# *
# *# *
# *
# *# *
# *
# *
# *
# *
# *
# *
# *# *
# *
# *
# *# *# *
# *
# *
# *
# *
# *
# *# *# *# *
# * # *# *# *# *# *
# *
# *
# *
# *# *# *
# *
# *
# *
# *# *
# *# *# *
# *
# *
# *
# *
# *# *
# *# *
# *
# *
# *
# *
# *
# *
# *# *
# *
# *# *# *# *
# *
# *# *# *
# *# *
# *
# *
# *# *
# *# *
# *
# *# *# *
# *
# *
# *# *# *
# *
# *
# *
# *
# *
# *
# *# *
# *
# *
# *
# *
# *# *
# *
Sta
ten
Isla
nd
Bro
okly
nQ
ueen
s
Bro
nx
Man
hatt
an
Atla
ntic
Oce
an
Hud
son
Riv
er
Hun
tingt
onH
arbo
r
Hun
tingt
onH
arbo
r
Hun
tingt
onH
arbo
rHun
tingt
onH
arbo
r
Hun
tingt
onH
arbo
r
San
dyH
ook
Bay
Rar
itan
Bay
Titu
sM
illpo
nd
New
port
Har
bor
New
ark
Bay
Eliz
abet
hC
hann
el
Por
tNew
ark
Cha
nnel
Kill
Van
Kul
lUpp
erN
ewYo
rkB
ay
Gre
atK
ills
Har
bor
Rar
itan
Bay
Upp
erN
ewYo
rkB
ayN
ewar
kB
ay
Aut
hur
Kill
Gre
atFr
esh
Kill
Hud
son
Riv
er
San
dyH
ook
Bay
Long
Isla
ndS
ound
Spe
rmac
eti
Cov
e
Roc
kaw
ayIn
let
Low
erN
ewYo
rkB
ayGra
vese
ndB
ay
Jam
aica
Bay
Pae
rdeg
atB
asin
Mill
Bas
in
Long
Isla
ndS
ound
Eas
tMill
Bas
in
She
epsh
ead
Bay
Haw
tree
Bas
in
Bar
bado
esB
asin
Eas
tR
iver
Flus
hing
Bay
Littl
eN
eck
Bay
Man
hass
etB
ay
Hem
pste
adH
arbo
rM
otts
Cov
e
Atla
ntic
Oce
an
Mid
dle
Bay
Bro
swer
eB
ay
Hea
dof
Bay
Bas
inH
ewle
ttB
ayM
otts
Bas
in Eas
tR
ocka
way
Inle
t

Figure
3.Grow
thof
EligibleNew
York
City
SmallH
ighScho
ols
Num
bero
fnew
smallhighscho
olsinNew
York
Cityeligibleforthe
stud
ycreatedbe
tween2002
and2008.Thedata
appe
ndixprovides
additio
naldetailson
thescho
olsample.
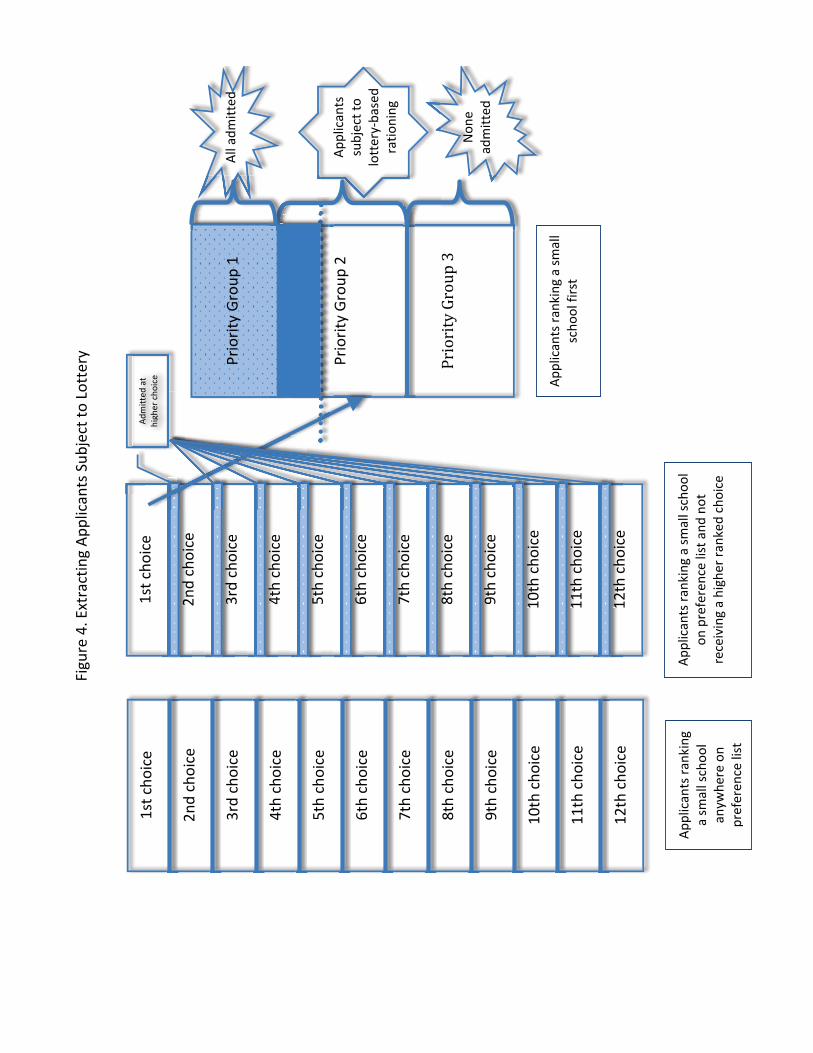


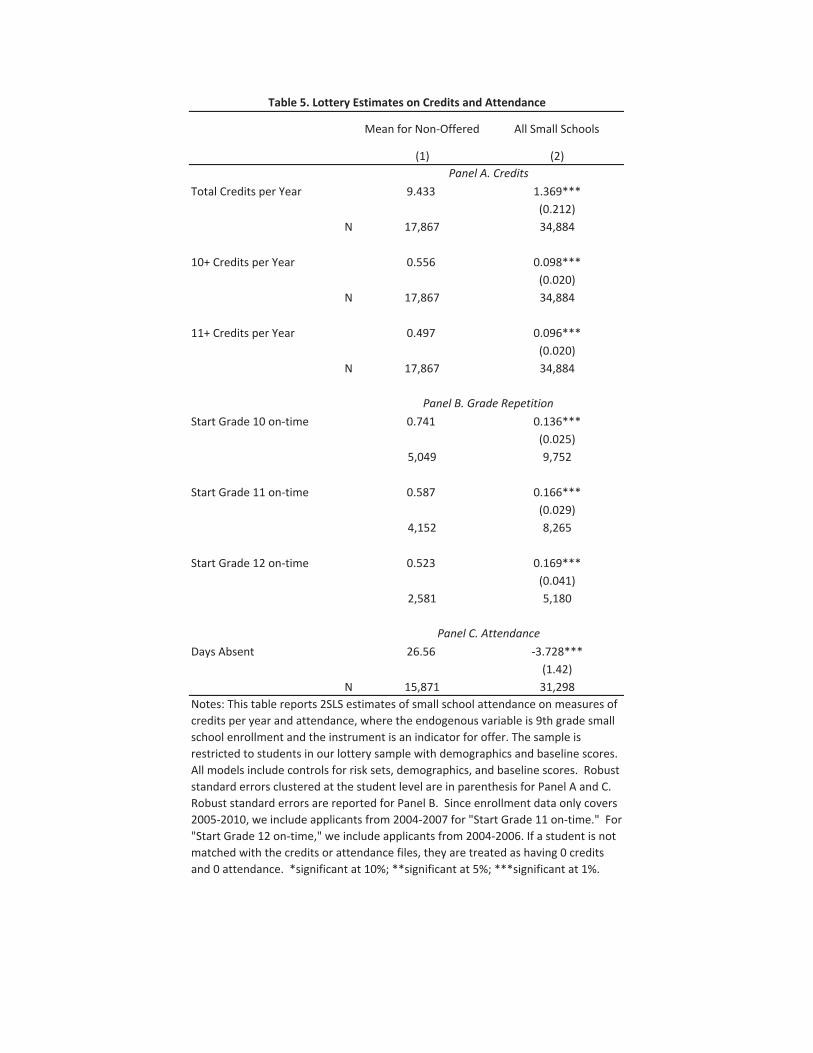
(1) (2)
Total Credits per Year 9.433 1.369***(0.212)
N 17,867 34,884
10+ Credits per Year 0.556 0.098***(0.020)
N 17,867 34,884
11+ Credits per Year 0.497 0.096***(0.020)
N 17,867 34,884
Start Grade 10 on time 0.741 0.136***(0.025)
5,049 9,752
Start Grade 11 on time 0.587 0.166***(0.029)
4,152 8,265
Start Grade 12 on time 0.523 0.169***(0.041)
2,581 5,180
Days Absent 26.56 3.728***(1.42)
N 15,871 31,298Notes: This table reports 2SLS estimates of small school attendance on measures ofcredits per year and attendance, where the endogenous variable is 9th grade smallschool enrollment and the instrument is an indicator for offer. The sample isrestricted to students in our lottery sample with demographics and baseline scores.All models include controls for risk sets, demographics, and baseline scores. Robuststandard errors clustered at the student level are in parenthesis for Panel A and C.Robust standard errors are reported for Panel B. Since enrollment data only covers2005 2010, we include applicants from 2004 2007 for "Start Grade 11 on time." For"Start Grade 12 on time," we include applicants from 2004 2006. If a student is notmatched with the credits or attendance files, they are treated as having 0 creditsand 0 attendance. *significant at 10%; **significant at 5%; ***significant at 1%.
Table 5. Lottery Estimates on Credits and Attendance
Panel A. Credits
Panel B. Grade Repetition
Panel C. Attendance
Mean for Non Offered All Small Schools
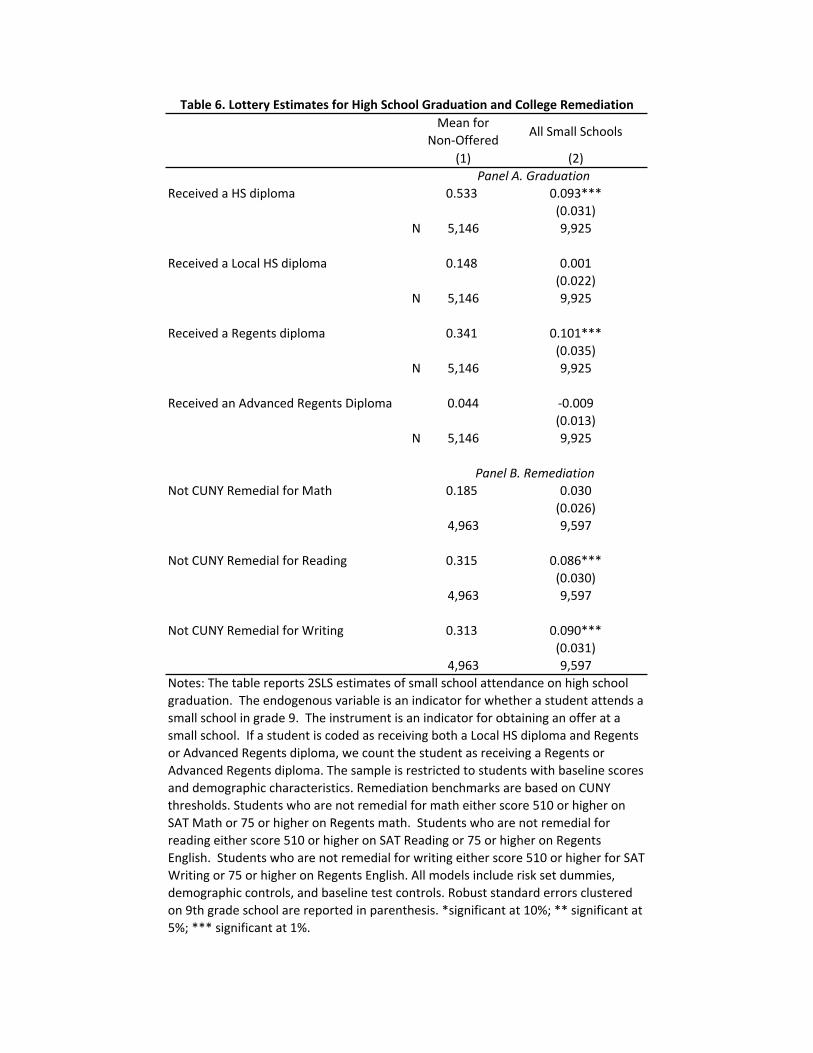


Male
Female
Black
Hispanic
Belowmed
ian
Abovemed
ian
(1)
(2)
(3)
(4)
(5)
(6)
(7)
(8)
RegentsM
ath
0.13
2***
0.04
90.18
3***
0.34
3***
0.03
20.15
1***
0.16
7***
0.11
0***
(0.040
)(0.051
)(0.052
)(0.074
)(0.038
)(0.045
)(0.047
)(0.042
)N
7,44
83,46
73,98
13,41
73,41
45,40
53,47
43,97
4
RegentsE
nglish
0.08
0.02
70.11
7**
0.07
30.11
50.11
3*0.07
60.08
3(0.051
)(0.071
)(0.053
)(0.053
)(0.095
)(0.058
)(0.086
)(0.051
)N
7,14
83,22
83,92
03,22
53,30
55,18
83,06
84,08
0
Received
aHS
diplom
a0.09
3***
0.07
2*0.12
8***
0.07
50.10
8**
0.08
5**
0.07
40.10
9***
(0.031
)(0.041
)(0.045
)(0.048
)(0.045
)(0.035
)(0.048
)(0.036
)N
9,92
54,69
15,23
44,41
84,63
07,08
74,73
65,18
9
Received
aRe
gentsd
iploma
0.10
1***
0.09
9**
0.10
9**
0.09
40.10
2***
0.10
4***
0.03
70.15
8***
(0.035
)(0.045
)(0.047
)(0.058
)(0.039
)(0.038
)(0.048
)(0.040
)N
9,92
54,69
15,23
44,41
84,63
07,08
74,73
65,18
9
Attend
college
0.07
1**
0.09
2**
0.06
40.07
3*0.06
30.03
90.05
10.09
0***
(0.028
)(0.037
)(0.044
)(0.043
)(0.042
)(0.034
)(0.042
)(0.035
)N
8,87
94,20
44,67
53,96
14,09
76,23
34,22
54,65
4
Attend
a4year
college
0.06
0***
0.06
7**
0.06
5*0.06
8**
0.02
40.05
2**
0.02
40.09
9***
(0.022
)(0.028
)(0.034
)(0.034
)(0.034
)(0.025
)(0.028
)(0.029
)N
8,87
94,20
44,67
53,96
14,09
76,23
34,22
54,65
4
Attend
a4year
publiccollege
0.06
6***
0.05
3**
0.08
5**
0.08
2***
0.02
30.06
2**
0.02
80.10
1***
(0.023
)(0.026
)(0.034
)(0.030
)(0.027
)(0.025
)(0.020
)(0.032
)N
8,87
94,20
44,67
53,96
14,09
76,23
34,22
54,65
4Notes:Thistablerepo
rts2
SLSestim
ates
ofsm
allschoo
lsforsub
grou
psof
stud
ents.Th
esampleisrestrictedto
stud
entswith
baselinescores
andde
mograph
iccharacteristics.Th
een
dogeno
usvaria
bleisyearsa
tsmallschoo
lfor
Regentso
utcomes
andgrade9sm
allschoo
latten
danceforo
ther
outcom
es.Allm
odelsinclude
year
oftest,risk
setd
ummies,de
mograph
iccontrols,
andbaselinetestcontrols.
Robu
ststandard
errors,clustered
onyear
andscho
olwhe
ntaking
theRe
gentstest,andby
scho
olforthe
othe
routcomes
areinparenthe
sis.*sig
nificanta
t10%
;**sig
nificanta
t5%;***
significanta
t1%.
Table8.LotteryRe
sults
forS
ubgrou
psGe
nder
Race
Baseline
All
Subsidize
dLunch


Non
Offe
red
Compliers(Z=0)
Offe
red
Compliers(Z=1)
Diffe
rence
Rank
ofDiffe
rence
(1)
(2)
(3)
(4)
Mosto
fthe
adultsIsee
atscho
oleveryday
know
mynameor
who
Iam.
1.00
0.45
1.45
Best
Theadultsat
myscho
ollook
outfor
me.
0.79
0.19
0.98
2nd
Myteache
rsinspire
meto
learn.
0.29
0.22
0.07
10th
Myscho
oloffersawideen
ough
varie
tyof
classesa
ndactiv
ities
tokeep
meinterested
inscho
ol.
0.45
0.37
0.82
Worst
Moststude
ntsinmyscho
oljustlook
outfor
them
selves.
0.87
0.34
1.21
Best
Thereisgang
activ
ityat
myscho
ol.
0.96
0.20
1.16
2nd
Thepresen
ceandactio
nsof
Scho
olSafetyAg
entshe
lpto
prom
oteasafe
andrespectful
learning
environm
ent.
0.32
0.28
0.04
19th
Thereisape
rson
orprogram
inmyscho
olto
helpstud
entsresolveconflicts.
0.09
0.22
0.13
Worst
Howoften,du
ringthisscho
olyear,haveyour
teache
rsaskedyouto
completean
essayor
research
projectu
singmultip
lesourceso
finformation?
0.73
0.64
1.37
Best
Stud
entswho
getg
oodgrades
inmyscho
olarerespectedby
othe
rstude
nts.
0.66
0.10
0.76
2nd
Ineedto
workhard
togetg
oodgrades
atmyscho
ol.
0.22
0.12
0.10
9th
Myhigh
scho
olprovides
helpfulcou
nselingon
howto
geta
good
jobafterh
ighscho
olor
howto
getintocollege.
0.00
0.09
0.09
Worst
Inho
wmanyof
your
classesd
uringthepasttw
oweeks
have
youworkedingrou
psof
2to
6stud
ents?
0.90
0.14
1.04
Best
Howcomfortableareyoutaking
toteache
rsandothe
radu
ltsat
your
scho
olaprob
lem
youarehaving
inclass?
0.18
0.39
0.57
2nd
Howcomfortableareyoutaking
toteache
rsandothe
radu
ltsat
your
scho
olabou
tsomething
that
isbo
theringyou?
0.14
0.17
0.31
4th
Inho
wmanyof
your
classesd
uringthepasttw
oweeks
have
youparticipated
inhand
son
activ
ities
such
asscienceexpe
rimen
tsor
buildingthings?
0.45
0.17
0.28
Worst
Table10
.Con
trastsinScho
olEn
vironm
entfor
SmallSchoo
lCom
pliersfrom
Stud
entR
espo
nses
onNYC
Scho
olClim
ateSurveys
PanelA
.Eng
agem
ent(11
questio
ns;Smallschoo
lsratedhigh
eron
10ou
tof1
1)
PanelB.Safetyan
dRe
spect(20
questio
ns;Smallschoo
lsratedhigh
eron
19ou
tof2
0)
PanelC.A
cademicExpectations
(10qu
estio
ns;Smallschoo
lsratedhigh
eron
9ou
tof1
0)
PanelD
.Com
mun
ication(5
questio
ns;Smallschoo
lsratedhigh
eron
5ou
tof5
)
Notes:Thistablerepo
rtsd
ifferen
cesinscho
olen
vironm
entfor
smallschoo
lcom
pliersbasedon
stud
enta
nswerstoScho
olClim
ateSurveysfrom
2007
through
2009
.Survey
respon
sesa
restandardize
tomeanzero
andun
itvaria
ncewith
insurvey
year
andscho
oltype
,sothat
thetypicalrespo
nseis0.Fore
achscho
ol,w
ec ompu
tean
averageof
threeyearsw
eightedby
thenu
mbe
rofrespo
nden
tsfore
achqu
estio
n.Co
mpliera
ttrib
utes
arecompu
tedfollowingmetho
dsde
scrib
edin
Abadie(200
3),followingTable3.


2003
0420
0405
2005
0620
0607
2007
08(1)
(2)
(3)
(4)
(5)
(6)
(7)
(8)
(9)
(10)
(11)
(12)
(13)
1Scho
olForD
emocracy
&Leadership
K533
K01J
NV
2004
0708
nolottery
nolottery
nolottery
nolottery
2Scho
olForD
emocracy
&Leadership
K533
K01X
NV
2004
0506
nolottery
nolottery
nolottery
nolottery
3Broo
klyn
Second
aryScho
olforC
ollabo
rativeStud
ies
K448
K03R
OB
2005
0506
,060
7no
tope
nno
lottery
nolottery
4Scho
olforH
uman
Rights/A
mne
styInternational
K531
K04X
NV
2004
nolottery
nolottery
nolottery
nolottery
nolottery
5HS
forY
outh
&Co
mmun
ityDe
velopm
enta
tErasm
usK5
37K0
6ANV
2004
nolottery
nolottery
nolottery
nolottery
nolottery
6HS
forY
outh
&Co
mmun
ityDe
velopm
enta
tErasm
usK5
37K0
6XNV
2004
0405
nolottery
nolottery
nolottery
nolottery
7Broo
klyn
Prep
aratoryHigh
Scho
olK4
88K0
7XISA
2004
0405
,050
6,06
07no
lottery
nolottery
8UAScho
olforLaw
&Justice
K483
K08X
NV,UA
2004
0304
,040
5,05
06,060
7no
lottery
9WilliamsburgHigh
Scho
olforA
rchitecture&De
sign
K558
K09X
NV
2004
0405
,050
6no
lottery
nolottery
nolottery
10Juan
MorelCampo
sSecon
dary
Scho
olK0
71K1
1XOther
2004
0708
nolottery
nolottery
nolottery
nolottery
11Foun
datio
nsAcadem
yK3
22K1
8RISA
2005
Yno
top e
nno
lottery
nolottery
nolottery
nolottery
12High
Scho
olforS
ervice
&Learning
atErasmus
K539
K30X
NV
2004
nolottery
nolottery
nolottery
nolottery
nolottery
13High
Scho
olforG
lobalCitizenship
K528
K32A
NV
2004
nolottery
nolottery
nolottery
nolottery
nolottery
14Fred
erickDo
uglassAcadem
yIV
Second
aryScho
olK3
93K3
3RRe
p20
0505
06,060
7no
tope
nno
lottery
nolottery
15Bu
shwickLeaders'HS
forA
cade
micExcellence
K556
K36A
Other
2004
0405
nolottery
nolottery
nolottery
nolottery
16WilliamsburgPrep
K561
K39X
NV
2004
0506
,060
7screen
edscreen
edno
lottery
17Broo
klyn
Academ
yof
Science&theEnvironm
ent
K547
K41A
NV
2003
0304
,040
5,05
06,060
7no
lottery
18InternationalA
rtsB
usinessS
choo
lK5
44K4
4ANV
2003
Y04
05,050
6,06
07no
lottery
nolottery
19InternationalA
rtsB
usinessS
choo
lK5
44K4
4BNV
2003
Y04
05,050
6,06
07no
lottery
nolottery
20InternationalA
rtsB
usinessS
choo
lK5
44K4
4CNV
2003
Y04
05,050
6no
lottery
nolottery
nolottery
21UANew
York
Harbor
Scho
olK5
51K5
1ANV,UA
2003
0405
,050
6no
lottery
nolottery
nolottery
22Academ
yof
Urban
Planning
K552
K52A
NV
2003
0405
nolottery
nolottery
nolottery
nolottery
23Bu
shwickScho
olforS
ocialJustice
K549
K54A
NV,ISA
2003
Y03
04,040
5no
lottery
nolottery
nolottery
24AllCity
LeadershipSecond
aryScho
olK5
54K5
5ANV
2003
0405
,050
6,06
07no
lottery
nolottery
25PerformingArts&Tech
HSK5
07K6
1XNV
2004
0506
,060
7no
lottery
nolottery
nolottery
26FD
NYHS
ForF
ire&Life
Safety
K502
K62X
NV
2004
0607
,070
8no
lottery
nolottery
nolottery
27HS
forC
ivilRights
K504
K63X
NV
2004
nolottery
nolottery
nolottery
nolottery
nolottery
28HS
ForP
ublic
Service:He
roes
ofTo
morrow
K546
K64A
NV
2003
nolottery
screen
edscreen
edscreen
edscreen
ed29
WorldAcadem
yforT
otalCo
mmun
ityHe
alth
HSK5
10K6
5XNV
2004
nolottery
nolottery
nolottery
nolottery
nolottery
30Fred
erickDo
uglassAcadem
yVIIH
SK5
14K8
0XRe
p20
0405
06,060
7no
lottery
nolottery
nolottery
31Broo
klyn
Collegiate:ACo
llege
BoardScho
olK4
93K9
3XCB
2004
0405
,050
6,06
07,070
8no
lottery
32HS
forS
portsM
anagem
ent
K348
K97R
Other
2005
Y0506
noto
pen
nolottery
nolottery
nolottery
33Ra
chelCarson
HSforC
oastalStud
ies
K344
L01R
Other
2005
Yno
tope
nscreen
edno
lottery
nolottery
nolottery
34Urban
AssemblyHS
ofMusic&Art
K350
L02R
UA
2005
0506
,060
7no
tope
nno
lottery
nolottery
35Academ
yforC
ollege
Prep
aration&Career
Exploration
K382
L21A
CB2006
noto
pen
noto
pen
nolottery
nolottery
nolottery
36Academ
yforY
oung
Writers
K404
L22A
ISA
2006
0607
,070
8no
tope
nno
top e
nno
lottery
37Academ
yforE
nviro
nmen
talLeade
rship
K403
L23A
NV
2006
noto
pen
noto
pen
nolottery
nolottery
nolottery
TableA1
.New
York
City
SmallH
ighScho
olsE
ligibleforthe
Stud
y
Year
Ope
ned
Close
dAu
dit
edYearsinLotterySample
Reason
forE
xclusio
nfrom
LotterySample
Scho
olScho
olID
Program
Code
Interm
ediary

2003
0420
0405
2005
0620
0607
2007
08(1)
(2)
(3)
(4)
(5)
(6)
(7)
(8)
(9)
(10)
(11)
(12)
(13)
TableA1
.New
York
City
SmallH
ighScho
olsE
ligibleforthe
Stud
y
Year
Ope
ned
Close
dAu
dit
edYearsinLotterySample
Reason
forE
xclusio
nfrom
LotterySample
Scho
olScho
olID
Program
Code
Interm
ediary
38Academ
yof
Hospita
lity&To
urism
K408
L24A
NV,Acad
2006
0607
noto
pen
noto
pen
nolottery
nolottery
39Broo
klyn
Commun
ityArts&Med
iaHigh
Scho
olK4
12L25A
ISA
2006
0607
noto
pen
noto
pen
nolottery
nolottery
40GreenScho
ol:A
nAcadem
yForE
nviro
nmen
talCareers
K454
L27A
NV
2006
noto
pen
noto
pen
nolottery
nolottery
nolottery
41Ag
nesY
.Hum
phreyScho
olForLeade
rship
K027
L28A
NV
2006
Yno
tope
nno
tope
nno
lottery
nolottery
nolottery
42Arts&Med
iaPrep
aratoryAcadem
yK5
89L31A
ISA
2007
noto
pen
noto
pen
noto
pen
nolottery
nolottery
43Expe
ditio
nary
L earning
Scho
olforC
o mmun
ityLeaders
K572
L34A
OB
2007
noto
pen
noto
pen
noto
pen
nolottery
nolottery
44ItTakesA
Village
Academ
yK5
63L36A
Other
2007
noto
pen
noto
pen
noto
pen
nolottery
nolottery
45Ku
rtHa
hnExpe
ditio
nary
Learning
Scho
olK5
69L37A
OB
2007
noto
pen
noto
pen
noto
pen
nolottery
nolottery
46Life
Academ
yHS
forF
ilm&Music
K559
L38A
ISA
2007
noto
pen
noto
pen
noto
pen
nolottery
nolottery
47Lyon
sCom
mun
ityScho
olK5
86L39A
NV
2007
noto
pen
noto
pen
noto
pen
nolottery
nolottery
48VictoryCo
llegiateHS
K576
L41A
ISA
2007
noto
p en
noto
pen
noto
pen
nolottery
nolottery
49Academ
yforS
ocialA
ction:
ACo
llege
BoardScho
olM36
7M01
ACB
2007
noto
pen
noto
pen
noto
pen
nolottery
nolottery
50Facing
HistoryScho
olM30
3M02
RNV
2005
0506
noto
pen
nolottery
nolottery
nolottery
51Urban
AssemblyScho
olforthe
PerformingArts
M36
9M04
AUA
2008
0708
noto
pen
noto
pen
noto
pen
noto
pen
52Lower
Manhattan
ArtsAcadem
y(Lom
a)M30
8M05
ROther
2005
0506
,060
7,07
08no
tope
nno
lottery
53Co
mmun
ityHe
alth
Academ
yof
theHe
ights
M346
M07A
NV
2008
0708
noto
pen
noto
pen
noto
pen
noto
pen
54James
Baldwin:A
Scho
olforE
xped
ition
aryLearning
M313
M08R
OB
2005
Y0506,0607
noto
pen
nolottery
nolottery
55Manhattan
TheatreLabScho
olM28
3M09
XNV
2004
Y04
05,050
6no
lottery
nolottery
nolottery
56HS
forA
rts,Im
agination,&Inqu
iryM299
M11R
NV
2005
0506,0607
noto
pen
nolottery
nolottery
57Urban
AssemblyScho
olforM
ediaStud
ies
M30
7M22
XNV,UA
2004
0405
nolottery
nolottery
nolottery
nolottery
58Food
&FinanceHS
M28
8M34
XNV
2004
0304
,060
7,07
08no
lottery
nolottery
59HS
ofHo
spita
lityManagem
ent
M296
M36X
NV,Acad
2004
0506,0607
nolottery
nolottery
nolottery
60EssexStreet
Academ
yM29
4M37
XNV
2004
0405
,060
7,07
08no
lottery
nolottery
61PA
CEHS
M29
8M38
XNV
2004
Y03
04,050
6,06
07no
lottery
nolottery
62Fred
erickDo
uglasA
cade
myII
M86
0M39
ANV,Re
p20
0203
04no
lottery
nolottery
screen
edscreen
ed63
Urban
AssemblyScho
olof
Desig
n&Co
nstructio
nM30
0M44
XNV,UA
2004
0405
,050
6,06
07no
lottery
nolottery
64He
nryStreet
Scho
olforInternatio
nalStudies
M29
2M46
XRe
p20
0404
05,050
6no
lottery
nolottery
nolottery
65MottH
allH
SM30
4M49
XRe
p20
0404
05,050
6,06
07,070
8no
lottery
66New
Desig
nHS
M543
M53A
Other
2003
nolottery
screen
edscreen
edscreen
edscreen
ed67
Urban
AssemblyScho
olof
Busin
essfor
Youn
gWom
enM31
6M63
RUA
2005
0607
noto
pen
screen
edno
lottery
nolottery
68Urban
AssemblyAcadem
yof
Governmen
t&Law
M30
5M65
RUA
2005
0506
,060
7no
top e
nno
lottery
nolottery
69WashingtonHe
ightsE
xped
ition
aryLearning
Scho
olM34
8M88
AOB
2008
noto
pen
noto
pen
noto
pen
noto
pen
nolottery
70Que
ensP
reparatory
Academ
yQ24
8Q04
RISA
2005
noto
pen
nolottery
nolottery
nolottery
nolottery
71HS
ofAp
pliedCo
mmun
ication
Q267
Q07R
Other
2005
0506,0607
noto
pen
nolottery
nolottery
72Academ
yof
Finance&Enterprise
Q26
4Q08
RAcad
2005
0506
,060
7no
tope
nno
lottery
nolottery
73PathwaysC
ollege
Prep
aratoryScho
olQ25
9Q09
RCB
2005
noto
pen
nolottery
nolottery
nolottery
nolottery
74HillcrestHS
Q50
5Q24
ZNV
2004
Y04
05no
lottery
nolottery
nolottery
nolottery

2003
0420
0405
2005
0620
0607
2007
08(1)
(2)
(3)
(4)
(5)
(6)
(7)
(8)
(9)
(10)
(11)
(12)
(13)
TableA1
.New
York
City
SmallH
ighScho
olsE
ligibleforthe
Stud
y
Year
Ope
ned
Close
dAu
dit
edYearsinLotterySample
Reason
forE
xclusio
nfrom
LotterySample
Scho
olScho
olID
Program
Code
Interm
ediary
75Excelsior
Prep
aratoryHS
Q26
5Q42
XISA
2004
0304
,040
5no
lottery
nolottery
nolottery
76Ge
orge
WashingtonCarver
High
Scho
olForT
heSciences
Q27
2Q45
AOther
2004
0405
,050
6,06
07,070
8no
lottery
77Ge
orge
WashingtonCarver
High
Scho
olForT
heSciences
Q27
2Q45
COther
2004
0405
nolottery
nolottery
nolottery
nolottery
78Fred
erickDo
uglassAcadem
yVI
HSQ26
0Q75
XRe
p20
04no
lottery
nolottery
nolottery
nolottery
nolottery
79CivicLeadershipAcadem
yQ293
Q76A
NV
2008
noto
pen
noto
pen
noto
pen
noto
pen
nolottery
80CypressH
illsC
ollegiatePrep
aratory
Q27
9Q81
ANV
2006
0607
,070
8no
tope
nno
tope
nno
lottery
81East
WestS
choo
lofInternatio
nalStudies
Q28
1Q82
ANV
2006
noto
pen
noto
pen
nolottery
nolottery
nolottery
82Prep
aratoryAcadem
yforW
riters
Q28
3Q84
ACB
2006
Yno
tope
nno
tope
nno
lottery
nolottery
nolottery
83WorldJournalism
Prep
aratory
Q28
5Q85
ACB
2006
0607
noto
pen
noto
pen
nolottery
nolottery
84Youn
gWom
en'sLeadershipScho
ol,Q
ueen
sCam
pus
Q896
Q89A
NV
2007
0607
noto
pen
noto
pen
noto
pen
nolottery
85Ch
anne
lViewScho
olforR
esearch
Q26
2Q97
XNV,OB
2004
0607
,070
8no
lottery
nolottery
nolottery
86CSIH
SforInternatio
nalStudies
R047
R01R
Other
2005
0405
,050
6,06
07no
tope
nno
lottery
87HS
ofCo
mpu
ters&Techno
logy
X275
X01X
NV
2004
Y03
04,040
5,05
06,060
7,07
0888
Academ
yforS
cholarship&Entrep
rene
urship
X270
X02R
CB20
05Y
0506
,060
7no
tope
nno
lottery
nolottery
89Exim
iusC
ollege
Prep
aratoryAcadem
yX2
50X0
3RCB
2005
0506
noto
pen
nolottery
nolottery
nolottery
90MottH
allBronx
HSX2
52X0
4RNV,Re
p20
0506
07,070
8no
tope
nno
lottery
nolottery
91Bron
xCe
nter
forS
cien
ce&Mathe
matics
X260
X05R
NV,Re
p20
0505
06,060
7no
tope
nno
lottery
nolottery
92LeadershipInstitu
teX2
76X0
6RNV
2005
noto
pen
nolottery
nolottery
nolottery
nolottery
93Va
lidus
Prep
aratoryAcadem
yX2
63X0
7ROB
2005
0607
noto
pen
nolottery
nolottery
nolottery
94Explorations
Academ
yX2
51X0
8RISA
2005
Yno
tope
nno
lottery
nolottery
nolottery
nolottery
95SouthBron
xPrep
aratory
X221
X11X
CB20
0404
05,050
6no
lottery
nolottery
nolottery
96Co
lumbu
sInstituteOfM
athAn
dScience/C
ollegiateInstitu
t eX4
15X1
2ZNV
2003
0304
,040
5,05
06,060
7no
lottery
97AstorC
ollegiateAcadem
yX2
99X1
7ANV
2003
0304
,040
5,05
06,060
7,07
0898
UAAcadem
yforH
istory&Citizen
shipforY
oung
Men
X239
X21X
NV,UA
2004
Yscreen
edscreen
edno
lottery
nolottery
nolottery
99Bron
xAcadem
yof
Health
Careers
X290
X22A
NV
2003
0304
,040
5,05
06,060
7no
lottery
100
UABron
xAcadem
yof
Letters
X551
X27A
NV,UA
2003
0304
,040
5,05
06,060
7no
lottery
101
Bron
xScho
olof
Law&Finance
X284
X28A
NV,Acad
2003
0304
,040
5,05
06,060
7no
lottery
102
CollegiateInstitu
teforM
ath&Science
X288
X29J
NV
2003
0304
,040
5,05
06,060
7,07
0810
3Bron
xAe
rospaceAcadem
yX5
45X3
0ANV
2002
Y03
04,050
6,06
07,070
8no
lottery
104
Urban
AssemblyScho
olForC
areersInSports
X548
X31A
NV,UA
2002
0304
,050
6,06
07no
lottery
nolottery
105
Bron
xGu
ildX4
52X3
2ANV
2002
0506
nolottery
nolottery
nolottery
nolottery
106
High
Scho
olForT
eachingAn
dTheProfessio
nsX4
33X3
4ANV
2002
0405
,060
7no
lottery
nolottery
nolottery
107
Bron
xHS
forthe
VisualArts
X418
X35A
NV
2002
0304
,050
6,06
07,070
8no
lottery
108
Bron
xLeadershipAcadem
yIIHS
X527
X37A
NV
2002
nolottery
nolottery
nolottery
nolottery
nolottery
109
Bron
xTheatreHS
X546
X38A
NV
2003
0304
,040
5,05
06,060
7no
lottery
110
Bron
xTheatreHS
X546
X38B
NV
2003
0405
,050
6,06
07,070
8no
lottery
111
DiscoveryHS
X549
X39A
NV
2003
Y04
05,050
6,06
07no
lottery
nolottery

2003
0420
0405
2005
0620
0607
2007
08(1)
(2)
(3)
(4)
(5)
(6)
(7)
(8)
(9)
(10)
(11)
(12)
(13)
TableA1
.New
York
City
SmallH
ighScho
olsE
ligibleforthe
Stud
y
Year
Ope
ned
Close
dAu
dit
edYearsinLotterySample
Reason
forE
xclusio
nfrom
LotterySample
Scho
olScho
olID
Program
Code
Interm
ediary
112
Glob
alEnterpriseAcadem
yX5
41X4
0ANV
2003
Y04
05,050
6no
lottery
nolottery
nolottery
113
High
Scho
olForV
iolin
AndDa
nce
X543
X41A
Other
2004
0304
,040
5,05
06,060
7no
lottery
114
MottH
aven
Village
Prep
aratoryHS
X473
X44A
NV
2002
0304
,040
5,05
06no
lottery
nolottery
115
MottH
aven
Village
Prep
aratoryHS
X473
X44X
NV
2007
0607
,070
8no
tope
nno
tope
nno
tope
n116
Pelham
Prep
aratoryAcadem
yX5
42X4
5ANV
2003
0304
,040
5,05
06,060
7no
lottery
117
Scho
olForE
xcellence
X404
X46A
NV,ISA
2002
0405
nolottery
nolottery
nolottery
nolottery
118
Commun
ityScho
olforS
ocialJustice
X427
X47A
NV
2002
0304
,040
5,06
07no
lottery
nolottery
119
HSforC
ontempo
rary
Arts
X544
X48A
NV
2003
0405
nolottery
nolottery
nolottery
nolottery
120
HSforC
o ntempo
rary
Arts
X544
X48B
NV
2003
0405
nolottery
nolottery
nolottery
nolottery
121
New
ExplorersH
SX5
47X4
9ANV
2002
0304
,040
5,05
06,060
7no
lottery
122
Scho
olforC
ommun
ityRe
search
&Learning
X540
X50A
NV
2003
Yno
lottery
nolottery
nolottery
nolottery
nolottery
123
Bron
xExpe
ditio
nary
Learning
HS/C
ollegiateAcadem
yX2
27X5
8XOB
2004
Y0506
nolottery
nolottery
nolottery
nolottery
124
WestB
ronx
Academ
yforthe
Future
X243
X59X
NV
2004
0405
nolottery
nolottery
nolottery
nolottery
125
Bron
xEngine
ering&Tech
Academ
yX2
13X6
1XNV,Acad
2004
Y04
05,050
6,06
07no
lottery
nolottery
126
M.CurieHS
forN
ursin
g,Med
.,&AlliedHe
alth
Professio
nsX2
37X6
2XNV
2004
0405
,050
6,06
07,070
8no
lottery
127
Fred
erickDo
uglasA
cade
myIII
X517
X63X
Rep
2004
0506
,060
7,07
08no
lottery
nolottery
128
Bron
xLabo
ratory
HSX2
65X6
4XISA
2004
0405
,060
7,07
08no
lottery
nolottery
129
FelisaRincon
DeGa
utierInstituteforLaw
&Pu
blicPo
licy
X519
X65R
Other
2005
Yno
tope
nno
lottery
nolottery
nolottery
nolottery
130
Gateway
Scho
olof
Environm
entalResearch&Techno
logy
X295
X66A
NV
2004
Y03
04,040
5no
lottery
nolottery
nolottery
131
Millen
nium
ArtA
cade
my
X312
X72A
NV
2003
0304
,040
5,05
06,060
7,07
0813
2Bron
xHS
forW
riting&Co
mmun
icationArts
X253
X76X
NV
2004
0405
,060
7no
lottery
nolottery
nolottery
133
Metropo
litan
HSX2
48X7
7RRe
p20
05Y
noto
pen
nolottery
nolottery
nolottery
nolottery
134
New
DayAcadem
yX2
45X7
9RRe
p20
05Y
noto
pen
nolottery
nolottery
nolottery
nolottery
135
Morris
Academ
yforC
ollabo
rativeStud
ies
X297
X81X
NV
2004
nolottery
nolottery
nolottery
nolottery
nolottery
136
Bron
xHS
forP
erform
ance
&Stagecraft
X262
X82X
NV
2004
Y04
05,050
6,06
07no
lottery
nolottery
137
EastBron
xAcadem
yforthe
Future
X271
X83X
NV
2004
0607
,070
8no
lottery
nolottery
nolottery
138
Peace&Diversity
Academ
yX2
78X8
4XNV
2004
Y04
05,050
6no
lottery
nolottery
nolottery
139
Bron
xwoo
dPrep
aratoryAcade m
y/S portsProfessio
nsHS
X514
X85R
Other
2005
Y05
06,060
7,07
08no
tope
nno
lottery
140
Bron
xHe
alth
Sciences
HSX2
49X8
8XNV
2004
Y04
05,050
6,06
07no
lottery
nolottery
141
PabloNerud
aAcadem
yX3
05X9
7ANV,ISA
2003
Yno
lottery
nolottery
nolottery
nolottery
nolottery
142
Renaissance
HSof
MusicalTheater&
Techno
logy
X293
X98A
NV
2003
0304
,040
5,05
06,060
7no
lottery
143
EagleAcadem
yforY
oung
Men
X231
X99X
NV
2004
0506
,060
7,07
08screen
edscreen
ed144
Youn
gWom
en'sLeadershipScho
ol,B
ronx
Campu
s/Wom
en'sAcadem
yof
Excellence
X282
Y01T
NV
2006
0506
,060
7no
tope
nno
tope
nno
lottery
145
DreamYard
Prep
aratoryScho
olX3
29Y21A
NV
2006
noto
pen
noto
pen
nolottery
nolottery
nolottery
146
Holcom
beL.Ru
cker
Scho
olof
Commun
ityRe
search
X332
Y22A
ISA
2006
noto
pen
noto
pen
nolottery
nolottery
nolottery
147
InternationalSchoo
lfor
Libe
ralA
rts
X342
Y24A
Other
2006
0607
,070
8no
tope
nno
tope
nno
lottery

2003
0420
0405
2005
0620
0607
2007
08(1)
(2)
(3)
(4)
(5)
(6)
(7)
(8)
(9)
(10)
(11)
(12)
(13)
TableA1
.New
York
City
SmallH
ighScho
olsE
ligibleforthe
Stud
y
Year
Ope
ned
Close
dAu
dit
edYearsinLotterySample
Reason
forE
xclusio
nfrom
LotterySample
Scho
olScho
olID
Program
Code
Interm
ediary
148
Urban
AssemblyScho
olforthe
PerformingArts
X336
Y25A
UA
2006
0607
noto
pen
noto
pen
nolottery
nolottery
149
Urban
AssemblyScho
olforA
ppliedMath&Science
X241
Y29A
NV,UA
2007
0607
,070
8no
tope
nno
tope
nno
tope
n150
Know
ledge&Po
wer
Prep
.Acade
myInternationalH
SX3
74Y32A
NV,Re
p20
07no
tope
nno
tope
nno
tope
nno
lottery
nolottery
151
Bron
xLatin
X267
Y35A
NV
2007
noto
pen
noto
pen
noto
pen
nolottery
nolottery
Notes.List
ofeligiblesm
allhighscho
olprogramsc
omes
from
theNYC
S upp
lemen
tary
High
Scho
olDirectoryfrom
2004
,200
5,and20
06;the
2005
NYC
DOEGu
ideto
SmallSchoo
ls;New
Visio
nsAn
nualRe
ports
from
2005
,200
7,20
08,201
0;Scho
olinterm
ediary
web
sites
listedinFoley(201
0);and
thelisto
fSmallSchoo
lsinBloo
m,Tho
mpson
,and
Utterman
(201
0).A
scho
oliseligibleifitop
ened
betw
een20
02and20
08andisun
screen
edor
limite
dun
screen
edfora
tleaston
eyear.To
beinthelotterystud
y,aprogram
atthescho
olmustb
easeto
fapp
licantswho
aresubjecttoaratio
ning
bytherand
omnu
mbe
r.Ab
breviatio
nsof
interm
ediary
organizatio
nsareas
follows:NV=New
Visio
ns,U
A=Urban
Assembly,Re
p=Re
plications,A
cad=NYC
Academ
ies,ISA=Institu
teforS
tude
ntAchievem
ent,CB
=Co
llege
Board,OB=Outward
Boun
d,andOther
aretheremaining
scho
ols.
Ascho
olprogram
isexclud
edfrom
thelotterysampleifitiseither
1)no
tope
ned,2)
screen
ed,3)w
ithou
tavalid
lottery,or
4)do
esno
tinvolve
ratio
ning.Scho
ols
with
outa
valid
lotteryarethoseforw
hom
theirrecords
dono
tmakeclearw
hich
applicantswereratio
ned,ifany.
Ascho
olmay
notb
eratio
nedifthereareno
tmoreapplicantsthan
seatsinthelastpriority
grou
pto
obtainan
assig
nmen
t,or
thescho
olisno
trankedinthemainroun
dof
theHS
match.Ascho
olisclosed
ifitisno
tlisted
inthe20
1213
HSDirectory.
Thelisto
faud
itedscho
olsisc
ontained
inthe
AuditorG
eneral'sHigh
Scho
olAcadem
icDa
taRe
port(Fleisc
her2
012).

(1)
(2)
(3)
(4)
(5)
(6)
(7)
(8)
(9)
(10)
(11)
2003
2004
2004
2010
912
2144
277
1390
2672
040.10
0.28
1.21
2004
2005
2005
2010
912
3423
510
020
118
5794
340.10
0.53
1.64
2005
2006
2006
2010
912
3361
511
360
134
6890
520.11
0.61
1.49
2006
2007
2007
2010
912
3459
912
520
147
7584
500.19
0.76
1.00
2007
2008
2008
2010
911
3528
712
312
151
3136
640.17
0.73
0.82
2003
2004
2004
2010
912
1951
561
9273
2410
340.68
0.31
1.17
2004
2005
2005
2010
912
3010
166
5678
4516
660.46
0.43
1.47
2005
2006
2006
2010
912
2799
573
4586
4518
220.40
0.41
1.48
2006
2007
2007
2010
912
2833
080
2192
4923
980.46
0.46
0.97
2007
2008
2008
2010
911
2878
078
0594
2012
210.29
0.27
0.80
2003
2004
2004
2010
912
4606
562
73
145
0.66
0.34
1.19
2004
2005
2005
2010
912
7886
821
105
250
0.68
0.68
2.00
2005
2006
2006
2010
912
8251
913
117
261
0.73
0.59
1.35
2006
2007
2007
2010
912
7048
1000
129
311
0.76
0.59
0.73
2007
2008
2008
2010
911
7306
966
132
240.58
0.67
1.00
2003
2004
2004
2010
912
772
487
61
130.62
0.46
1.00
2004
2005
2005
2010
912
5124
974
112
370.51
0.57
2.89
2005
2006
2006
2010
912
5886
1029
116
185
0.45
0.46
1.61
2006
2007
2007
2010
912
6165
1115
126
294
0.67
0.69
1.06
2007
2008
2008
2010
911
6551
1030
123
850.89
0.80
0.89
2003
2004
2004
2010
912
2780
196
31
870.45
0.02
0.00
2004
2005
2005
2010
912
4969
305
42
163
0.11
0.22
0.17
2005
2006
2006
2010
912
4411
376
54
192
0.18
0.21
1.29
2006
2007
2007
2010
912
4323
387
55
209
0.49
0.36
0.64
2007
2008
2008
2010
911
4046
388
50
..
..
Average
yearsa
tscho
ols
(amon
goffered)
LotteryCo
hort
Calend
aryears
observed
Enrollm
ent
Grades
observed
Num
bero
fapplicantsto
smallschoo
ls
Num
bero
fstud
ents
ever
enrolled
Num
bero
fscho
ols
TableA2
.Lottery
Inform
ationat
NYC
SmallH
ighScho
ols
PanelA
.AllSm
allH
ighScho
ols
PanelB.N
ewVisio
ns
PanelC.U
rban
Assembly
PanelD
.Replications
PanelE.N
YCAcad
emiesNum
bero
fscho
olsw
ithavalid
lottery
Num
bero
fapplicants
rankingalotto
smallschoo
las
firstchoice
Percen
toffered
Percen
tattend
ed

(1)
(2)
(3)
(4)
(5)
(6)
(7)
(8)
(9)
(10)
(11)
Average
yearsa
tscho
ols
(amon
goffered)
LotteryCo
hort
Calend
aryears
observed
Enrollm
ent
Grades
observed
Num
bero
fapplicantsto
smallschoo
ls
Num
bero
fstud
ents
ever
enrolled
Num
bero
fscho
ols
TableA2
.Lottery
Inform
ationat
NYC
SmallH
ighScho
ols
Num
bero
fscho
olsw
ithavalid
lottery
Num
bero
fapplicants
rankingalotto
smallschoo
las
firstchoice
Percen
toffered
Percen
tattend
ed
2003
2004
2004
2010
912
3151
507
62
300.57
0.53
1.88
2004
2005
2005
2010
912
4626
754
95
940.69
0.63
1.28
2005
2006
2006
2010
912
4390
995
121
190.95
0.79
1.39
2006
2007
2007
2010
912
5938
1238
154
115
0.79
0.71
1.35
2007
2008
2008
2010
911
6249
1150
152
121
0.84
0.69
0.81
2003
2004
2004
2010
912
300
154
20
..
..
2004
2005
2005
2010
912
2042
368
52
390.54
0.51
2.05
2005
2006
2006
2010
912
2821
580
84
106
0.38
0.47
1.55
2006
2007
2007
2010
912
3223
667
93
125
0.44
0.46
0.87
2007
2008
2008
2010
911
3813
707
91
230.61
0.57
0.93
2003
2004
2004
2010
912
262
180
20
..
..
2004
2005
2005
2010
912
1406
428
50
..
..
2005
2006
2006
2010
912
1972
434
53
280.68
0.54
1.26
2006
2007
2007
2010
912
2214
492
74
680.71
0.60
1.02
2007
2008
2008
2010
911
2914
575
81
230.43
0.35
0.80
2003
2004
2004
2010
912
2999
585
61
290.52
0.55
3.13
2004
2005
2005
2010
912
5564
1075
135
157
0.80
0.73
2.34
2005
2006
2006
2010
912
7054
1125
147
234
0.39
0.33
1.47
2006
2007
2007
2010
912
7290
1252
157
252
0.47
0.47
1.04
2007
2008
2008
2010
911
8443
1298
155
138
0.80
0.67
0.83
Notes:Tablerepo
rtsthe
numbe
rofschoo
lsandoversubscriptio
nratesa
teligiblesm
allhighscho
ols.
Column(4)isrestrictedto
8thgradersinNew
York
City
public
PanelF.InstituteforS
tudent
Achievem
ent
PanelG
.College
Board
PanelH
.OutwardBo
und
PanelI.AllO
ther
SmallSchoo
ls


Table A6. Lottery Results by School Subsamples
2002 2005 2006 2008(1) (2) (3) (4) (5)
Regents Math 0.132*** 0.108*** 0.282** 0.135*** 0.114***(0.040) (0.040) (0.112) (0.036) (0.042)
N 7,448 7,024 424 7,110 6,541
Regents English 0.080 0.073 0.081*** 0.087* 0.049(0.051) (0.051) (0.017) (0.048) (0.045)
N 7,148 6,761 387 6,830 6,304
Total Credits 1.369*** 1.266*** 1.037** 1.486*** 1.218***(0.212) (0.208) (0.496) (0.204) (0.213)
N 34,884 33022 1,862 33,228 30,400
Received a HS diploma 0.093*** 0.081*** 0.137** 0.099*** 0.100***(0.031) (0.029) (0.068) (0.030) (0.032)
N 9,925 9,344 581 9,472 8,711
Received a Regents diploma 0.101*** 0.095*** 0.064 0.107*** 0.120***(0.035) (0.033) (0.073) (0.033) (0.033)
N 9,925 9,344 581 9,472 8,711
Attend college 0.071** 0.058** 0.135* 0.076*** 0.066**(0.028) (0.027) (0.071) (0.027) (0.029)
N 8,879 8,298 581 8,447 7,788
Attend a 4 year college 0.060*** 0.049** 0.106* 0.063*** 0.055**(0.022) (0.021) (0.061) (0.022) (0.023)
N 8,879 8,298 581 8,447 7,788
Attend a 4 year public college 0.066*** 0.059*** 0.077 0.074*** 0.056**(0.023) (0.022) (0.048) (0.022) (0.024)
N 8,879 8,298 581 8,447 7,788
Excludingauditedschools
Notes: This table reports 2SLS estimates for different sets of small schools. The endogenous variable is years at smallschool for Regents outcomes and grade 9 small school attendance for other outcomes. The sample is restricted tostudents with baseline scores and demographic characteristics. All models include year of test, risk set dummies,demographic controls, and baseline test controls. Robust standard errors, clustered on year and school when takingthe Regents test, and by school for the other outcomes are in parenthesis. The standard error of English in Column(3) is clustered on the year of test. The last row reports 2SLS estimates on effects of enrollment at any small schoolsin grade 9. Robust standard errors clustered at the student level are reported. *significant at 10%; ** significant at5%; *** significant at 1%.
Year school openedAll SmallSchools
Excludingclosed schools


A Data Appendix
A.1 Constructing List of Small High Schools
Data Sources for School Sample
There is no comprehensive list of new small high schools created during school years 2002-03
and 2007-08. We assembled a master list of small schools from the following sources:
1) NYC Department of Education Publications
– Directory of NYC Public High Schools 2002-2003
This directory indicates on the top of each page whether a school is new. 44 school
programs are listed as new in the directory, three of them are exam schools. The
remaining 41 school are in the master list.
– Supplementary Directory of NYC Public High Schools, 2004, 2005, 2006
These directories were distributed to participants in the High School (HS) Match
to provide information on new small schools, which were not included in the HS
Directory. 50 schools are listed in the 2004 directory, 30 schools are listed in the 2005
directory, and 18 schools are listed in the 2006 directory. These 98 schools are in the
master list.
2) New Visions Publications
– 2005-06 Guide to NYC Small High Schools
In 2005, the New Visions for the Public Schools published a separate guide to NYC
small high schools listing 220 small schools. 115 of these schools are not in the 2002-
2003 directory or Supplementary Directories, and are therefore added to the master
list.
– Annual Reports from New Visions for Public Schools, 2005, 2007, 2008, 2010
The appendix of the Annual Reports of the New Visions for Public Schools includes
a list of small schools supported by New Visions. We collected all annual reports
available online, covering years 2005, 2007, 2008 and 2010. 109 schools are in the
2005 report, but each is already in the master list. 120 schools are in the 2007 report,
4 of which are not yet in the master list. 98 schools are in the 2008 report, 43 of
which are not yet in the master list. 98 schools are in the 2010 report, 8 of which are
not yet in the master list.
65

– The Fund for Teachers list of New Visions-Affiliated New York City Public Schools
The Fund for Teachers, a group supporting teacher training, assembled a list of 194
New Visions affiliated New York City Public Schools. 10 of these schools are not yet
in the master list.
3) Other Outside Reports
– New Century High Schools and the Small Schools Movement in New York City –
Interim Report
There are 81 schools in this report, all of which are already in the master list.
– Approaches of Bill & Melinda Gates Foundation-Funded Intermediary Organizations
to Structuring and Supporting Small High Schools in New York City (Foley et al.,
2010)
We visit each intermediary organization’s website to collect the list of schools they
support. We visited websites of the following organizations: Asia Society, Big Pic-
ture Learning, City University of New York (CUNY), Coalition of Essential Schools,
College Board, Diploma Plus, Good Shepherd Services, Institute for Student Achieve-
ment, Internationals Network for Public Schools, Johns Hopkins University (JHU),
National Academy Foundation, National Council of La Raza (NCLR), New Visions
for Public Schools, New York City Outward Bound Center, Replications, The Urban
Assembly, Woodrow Wilson National Fellowship Foundation (WWNFF), and Young
Women’s Leadership Network. The Early College High School Initiative lists CUNY,
NCLR and WWNFF schools at their website. We identify a total of 324 schools from
these 18 Intermediary websites, 147 of which are not yet in the master list. Many of
these additional schools admit students at 6th grade, are screened, or are created after
2008 and therefore will be ineligible. Diploma Plus and Good Shepherd Services are
primarily involved in transfer schools serving over-age students with difficulty in ful-
filling graduation requirements, so these schools are excluded from the sample. Johns
Hopkins Talent Development High Schools operate schools which are not necessarily
small high schools and therefore excluded.
– Transforming the High School Experience: How New York City’s New Small Schools
Are Boosting Student Achievement and Graduation Rates? (Bloom et al., 2010)
There are a total of 109 schools in this report, 1 of which is not yet in the master list.
66

Eligible Unscreened Small Schools
There can be multiple school programs at a school, and applicants rank programs in the HS
match. The HS match files (further described below) include the correspondence between pro-
gram code and school building code (DBN code). If a program code is not linked to a school
building code, we look up the building code in subsequent year’s high school directories.
Combining the list of schools identified above, there are a total of 466 school programs.
To be an eligible small school, we impose two additional restrictions. First, we require that a
school is created in or after 2002 and is created before or in 2008. New programs in the 2002-03
Directory of the NYC Public High Schools are founded in 2002. We identify the opening years
for the other remaining programs by using the opening year listed in the 2005-06 Guide to NYC
Small High Schools, if available. If the opening year of a program cannot be identified from
these sources, we define the opening year based on the enrollment and ranking year as follows:
First, we exclude programs at schools that have students enrolled in grade 12 in 2004, inferring
that the school was open before 2002. Second, we include any school for which the first year a
program at their school is listed as a choice is a year between 2004-05 through 2007-08.
Next, we eliminate any small schools that screen applicants. Schools with Audition, Edu-
cational Option, Screened, and Test admissions types are excluded, while Unscreened, Limited
Unscreened, or Zoned schools are included.
Table A1 lists 151 programs in 143 schools that form our eligible small school program
sample.
A.2 Data Sources for Student Applications, Outcomes, and School Surveys
The New York City Department of Education is the source for four datasets: 1) high school
match and student enrollment office files containing student rankings, eligibility and priorities
for each school as well as demographic information on applicants at the time of application, 2)
registration and enrollment files which contains school attendance information from the Office
of School Performance and Accountability, 3) outcome files for baseline tests, Regents tests,
graduation, credits, attendance, College Board (PSAT, SAT, and AP) assessments, and National
Student Clearinghouse college information and 4) School Climate Surveys. We describe these
data sets in turn and provide details on the procedures used to construct the analysis sample.
High School Match and Student files
The High School Application Processing System (HSAPS) is maintained by the Student En-
rollment Office (formerly the Office of Student Enrollment and Planning Operations, OSEPO),
which oversees the high school admissions process. The Student Enrollment office provided us
67

access to files used in the HS match for five school years 2003-04 through 2007-08, for initial
placement of students into high school in school years 2004-05 through 2008-09.
All students interested in attending a New York City high school participate by submitting a
rank order list of up to 12 schools. The high school match files contain students’ choice schools
in preference order, the priority that a student obtains at each school, and the high school
assignments at the end of the main round of the match (the main round follows the assignment
of Specialized High Schools).
In addition to the match files, the student file has demographic information such as gender,
race, home language code, and borough of residence for each student. These files also include a
student’s LEP and SPED status for application years 2003-04 through 2006-07. LEP and SPED
status for 2007-08 are provided in enrollment files (see below). Each file for a given application
year contains a unique student ID number, which allows us to merge the files together.
Registration and Enrollment files
The registration file is from the Office of School Performance and Accountability and is available
as part of data underlying school progress reports. The registration and enrollment cover all
public school students in grades 9 to 12 for school years 2002-2003 through 2009-2010.
This data set includes each student’s ID, grade, and current school as of October in the school
year. The registration data are used to determine whether and for how many years a student
enrolls in a small school, where a student who is enrolled in October is counted as enrolling for
the entire year. Starting in 2004-05, there is a separate file which contains a list of all students
who obtain a subsidized school lunch in that year. This variable is used to code subsidized
lunch status for applicants using the application year. For applicants in 2003-04, 2004-05, and
2005-06, we used the lunch status record from 2004-05. For application cohort in 2006-07, we
used the lunch status record from 2005-06. For application cohort in 2007-08, we used the lunch
status record from 2006-07. Table B1 indicates the steps involved in processing the high school
application file and merging it with the Student Enrollment files.
From the file of high school applicants, we eliminated 9th grade applicants (since the main
entry point is the 8th grade), private school applicants (based on whether their ID starts with the
letter “A”) and those who do not submit a New York City Public School Admissions Application
(based on the Main Round HS ranking file). These correspond to columns 2-4 in Table B1.
Further sample restrictions to identify the applicants subject to lotteries are described below.
68
Identifying Admissions Lotteries
Table B1 describes additional steps involved towards identifying admissions lotteries from the
high school application file. In the first few years of the high school match, the enrollment office
had discretion on the placement of limited English proficient and special education students,
so we exclude them from the lottery sample. We also exclude students who are rated top 2%
performers in a standardized English Language Arts exam since they are guaranteed a seat if
their first choice is an Educational Option school.
The next step is to eliminate students who do not rank a small school program as their first
choice. A student’s priority at a program is determined by two variables: priority group and
hs rank. priority group is an integer that is determined by factors such as students’ borough
of residence. hs rank is an integer entered by schools, which may be determined by eligibility,
whether the student visited school open house, etc. Programs that screen students also enter
their ranking of students via hs rank. A finer hs rank indicates that the program is screening
applicants. Therefore, if the maximum hs rank is greater than 10 for a program in a given year,
the program is likely screening applicants and is not part of the lotteried set.
A program may give precedence to either the priority group variable or the hs rank variable
in determining a student’s final priority. For example, consider a school that gives precedence
to priority group. A student has higher (i.e. better) priority if he has a lower priority group
number. Among two students who have the same priority group number, the one with the lower
hs rank has higher priority. We identify the “lotteried priority” at a school as the priority group-
hs rank cell where some students who rank the school first are offered a seat, and others are
not. We only include lotteried priority (given by priority group-hs rank cells) where 1) some of
the students in the priority group-hs rank cell are not assigned the school, 2) no student with
priority group-hs rank cell higher than the lotteried priority at the school is assigned a lower
school in her choice list, and 3) no student in a priority group-hs rank lower than the lotteried
priority at the school receives an offer from the program.
Among students within the lotteried priority, a student’s offer variable is coded as 1 if he is
assigned to the school program; it is coded 0 otherwise.
Outcomes: Baseline test files
The baseline test file has 8th grade scores on New York State Education Department Math and
English Language Arts for each student indexed by student ID and spans years 2003 through
2008. Each year, we standardized scores to have mean zero and standard deviation one for each
test among all test takers in New York City. These serve as our baseline math and English
scores.
69

Outcomes: Regents test file
The NYC Regents test file contains the date and raw score for each tested student from 2004 to
2010. Regents exams are mandatory state examinations where performance determines whether
a student is eligible for a Regents high school diploma in New York. There are Regents exam-
inations in English, Global History, US History, and multiple exams in math and Science. A
Regents exam typically has a multiple choice section and a long answer or essay component, and
each exam usually lasts for three hours. The English exam, however, consists of two three-hour
pieces over two days. The exam has a locally graded component and Dee, Jacob, McCrary, and
Rockoff (2011) illustrate how test scores bunch near performance thresholds.
The New York State Board of Regents governs and designs the Regents exams. Starting in
2005, they started to modify the math exams. At the beginning of our sample, the two math
exams were Elementary Algebra and Planar Geometry (Math A) and Intermediate Algebra and
Trigonometry (Math B). Two new math exams, Integrated Algebra I (Math E) and Geometry
(Math G), have since been phased in. Since students typically either take Math A or Math E,
we focus on the score on the test taken first, taking the Math A score when both are contem-
poraneous. There are Regents science exams in Earth Science, Living Environment, Chemistry,
and Physics. The science outcome we focus on is Living Environment because it is the most
commonly taken Regents science exam. English and US History Regents exams are typically
taken in 11th grade. In Table B2, for each test, we report the number of applicants and the
number of test scores we observe.
Since students may take Regents exams multiple times, there can be multiple test scores
per student in the Regents test file. Table B2 presents the number of students who have taken
each exam more than once among small school applicant sample. The Regents file does not
have the test date, and instead only has a variable indicating the term (”termcd”). Based on
discussions with the DOE, we either convert term to fall, if the termcd is “1”, “5”, “a”, or “A”
and to spring if the termcd is “2”, “3”, “4”, “6”, or “7”. The DOE indicated that there are
exceptions at the following school DBNs where the termcd of “2” refers to the fall semester:
79M573, 79M612, 32K564, 02M560, 10X319, 02M575, 22K585, 12X480, 03M505, 02M570,
21K525, 21K540, 19K409, 17K489, 15K698, 14K454, 14K640, 07X379, 11X265, 15K529, 08X377,
05M285, 21K728, 02M303, 25Q792, 18K578, 24Q520, and 19K431. If a student takes the test
more than once after 9th grade, we used the test score from the earliest date. There are a small
number of cases where there is more than one score on the same date, and this date is the first
date after entering 9th grade. In some of these cases, there are two different test codes, where
one code ends with a “2.” We used the score corresponding to the test that does not end with
a “2.” Otherwise, we treated the score as missing.
70

Some students may also take Regents exams before exam school enrollment. Table B2 shows
the fraction of students who take exams before enrolling in an exam school. With the exception
of Math where the fraction is small, almost no students take a Regents exam before entering high
school. Students who have scores before the 9th grade are omitted for that outcome because
they tested prior to potential small school enrollment.
Most Regents exams are offered in January, June, and August, with most students usually
taking tests in June. The exact number of students who take the exam before 9th grade, the
number who take the exam more than once after 9th grade, and the number who take the exam
on a date other than the most common test date are presented in Table B2.
For each subject, we standardized scores to have mean zero and standard deviation one
within year-term-subject among all subject test takers among the cohort of applicants in the
HS match for years 2003-04 to 2007-08.
Outcomes: Credits
The Credit file indicates the total number of high school credits a student earned in a given year
covering years 2005-2011. We study three measures of credits: 1) total credits per year, 2) an
indicator if credit requirement for promotion is met, i.e. credit is greater than or equal 10, and
3) an indicator if credit requirement for graduation is met, i.e. credit greater than or equal 11.
Outcomes: Attendance
The Attendance file contains information on student absences for each school year and term.
The file covers school years from 2003-04 to 2008-09. If a student switches schools, there are
multiple observations within the year for the student. We total the days of absence in these
cases within the year.
Outcomes: High School Graduation
The Graduation file contains the discharge status of all public school students from 2005 to the
Spring 2012. For application cohorts 2003-04, 2004-05, 2005-06, 2006-07 and 2007-08, students
should start school in Fall 2004, Fall 2005, Fall 2006, Fall 2007 and Fall 2008 and graduate
on-time in Spring 2008, Spring 2009, Spring 2010, Spring 2011 and Spring 2012, respectively.
We do not report graduation in 5 years or 6 years.
To code graduation type, we use the following discharge codes:
a) 26, 30, and 61 (discharge codes for a local diploma)
b) 27, 46, and 60 (discharge codes for a Regents diploma)
71

c) 28, 47, and 62 (discharge codes for an Advanced Regents diploma)
It is possible for students to have graduated with several different discharge files. In such
cases, we take the highest ranking diploma received. For instance, if a student received both
a local and Regents diploma, then we code her as obtaining a Regents diploma. Similarly,
if a student is listed as receiving a Regents and an Advanced Regents diploma, we code her
as receiving Advanced Regents. Consequently, there is a unique graduation outcome for each
student.
Outcomes: College Board (PSAT, SAT, and APs)
The College Board provides NYC DOE with reports on the test performance of all NYC test-
takers from 2006 through 2012. The match rates of our application cohorts is shown in Table
B3. When there is more than one test score available for applicants, we use the maximum test
score.
Outcomes: National Student Clearinghouse
The NYC Department of Education matches data on seniors to National Student Clearinghouse
(NSC) files, which record information on enrollment at over 90 percent of American 4-year
colleges and universities. The data were submitted by the NYC DOE for students based on
graduation or GED cohorts for a 4 or 6 year cycle. The file we have is from the list of students
in a graduation cohort in 2009-2012, and was submitted to the NSC in January 2013. A college
is coded as a four year college if the highest degree offered by the college is 4 years, even if a
student is enrolled in a 2 year program. In 2011 and 2012, parents could opt out of the National
Student Clearinghouse. The DOE estimates that only roughly 100 parents opted out. Table B3
shows the number of applicants we observe with NSC outcomes.
The NYC DOE reports that the following colleges with more than 1,000 students are not
in the National Student Clearinghouse. The two main colleges are Rutgers and Columbia Uni-
versity. Other colleges which are not in the NSC are ASA Institute of Business and Computer
Technology, the United States Military Academy, Bard College, St. Thomas Aquinas College,
Briar Cliffe College in Bethpage, United Talmudical Seminar, Art Institute of New York City,
UTA Mesivta or Kiryas Joel, Boricua College, the American Musical and Dramatic Academy,
and the Mildred Elley School.
The most common colleges attended in our lottery sample are CUNY Borough of Manhat-
tan, CUNY Bronx Community College, CUNY New York City College of Technology, CUNY
Lehman College, CUNY LaGuardia Community College, CUNY College of Staten Island, CUNY
72

Kingsborough Community College, CUNY Hostos CMTY College, CUNY Queensborough Com-
munity College, and CUNY John Jay College of Criminal Justice.
NYC School Climate Surveys
In the 2006-07 school year, the NYC Department of Education initiated a Learning Environment
Survey to collect information from students in grades 6-12, parents, and teachers about school
practices. The survey is administered every year and the response rate for the years we use are
as follows:
Parent Teacher Students Total
2006-07 216,914 (26%) 31,592 (44%) 338,201 (65%) 586,707 (40%)
2007-08 347,829 (40%) 48,002 (61%) 410,708 (73%) 806,539 (55%)
2008-09 381,543 (45%) 57,822 (73%) 410,299 (80%) 849,664 (59%)
We use data on school surveys obtained online at http://schools.nyc.gov/Accountability/tools/
survey/default.htm (last accessed, July 2013). Even though response rates have increased over
time, we only use data from surveys for three years from 2007-2009 because our goal is to
characterize the school environment experienced by the students in our sample.
The school survey contains four parts: engagement, safety and respect, communication, and
academic expectations. Though there is some overlap between these categories, the DOE defines
them as follows:
1) Engagement : engage all parents, teachers, and students in an active and vibrant partner-
ship to promote student learning.
2) Safety and Respect : ensure that all members of the school community feel physically and
emotionally secure, allowing everyone to focus on student learning.
3) Communication: provide information about school’s educational goals and offer appropri-
ate feedback on each student’s learning outcomes.
4) Academic Expectations: encourage students to do their best by developing rigorous and
meaningful academic goals.
Students, parents, and teachers are asked to fill out questions related to each of these aspects
of schooling. Each question response is awarded a score between 0 and 10, with 10 reflecting the
score most favorable to a school’s learning environment. The DOE converts each question into
a score using a school survey model (DOE, 2012d). Scores on surveys contribute to a school’s
progress reports, representing 10-15% of school’s grade. Rockoff and Speroni (2008) provide
73

further analysis of the comparability of survey responses from students, teachers, and parents
from 2008.
The survey classifies schools into nine groups: Early Childhood Center, Elementary School,
Elementary/Middle School, K-12 School, Middle School, Middle/High School, High School,
Transfer School, and YABC. We standardize scores with zero mean and unit variance within
survey year and school type. For each school, we compute an average of three years weighted by
the number of respondents for each question. We merge school survey attributes to enrollment
by school (not program).
Matching Datasets and the Analysis Sample
We merged high school match files and the student file, then matched the merged file to the
registration file for grade 8. Next, we merged baseline scores for students for whom they are
available. Finally, we merged the dataset of cleaned Regents outcome scores. For each test, we
compute the implied years of small school attendance based on the test date and enrollment
status. If a student took a Regents test in the fall semester, we computed years assuming
the exam date is January 31st. Otherwise, we compute years assuming the exam date is June
1st. The resulting file is our analysis sample for the Regents outcomes. We follow a similar
approach for credit, attendance, and graduation outcomes. We compute grade progression from
enrollment files. The NYC DOE’s College Board and National Student Clearinghouse files are
matched to the set of lotteried small school applicants.
74

(1)
(2)
(3)
(4)
(5)
2003
0417
3,85
592
,070
81,191
72,637
59,140
2004
0519
1,10
896
,949
86,662
73,502
59,802
2005
0619
2,23
196
,631
86,683
72,000
58,012
2006
0718
1,26
291
,637
81,984
70,575
56,668
2007
0878
,995
78,995
78,995
65,501
53,966
AllYears
817,45
145
6,28
241
5,51
535
4,21
528
7,58
8
(6)
(7)
(8)
(9)
(10)
2003
0457
,345
4,52
21,06
71,06
71,05
220
0405
59,033
6,71
61,96
71,93
91,90
120
0506
56,912
7,31
22,48
72,42
92,39
120
0607
55,913
7,72
03,31
53,24
03,19
820
0708
52,708
8,29
11,58
21,55
61,54
1AllYears
281,91
134
,561
10,418
10,231
10,083
Exclud
ingapplicants
notinMainRo
undof
theapplicationprocess
Exclud
ingapplicants
participated
inlotteries
ofprevious
years
Exclud
inglim
itedEnglish
proficient
andspecial
educationstud
ents
Exclud
ingstud
ents
with
outa
nypo
stassig
nmen
tnum
eric
outcom
etestscores
TableB1
.Processingof
SmallSchoo
lApp
licationDa
tafrom
HSMatch
Notes:Thistablesummarize
sthe
step
sgoing
from
rawapplicationdata
totheanalysissample.
ApplicationYear
ApplicationYear
Totalnum
bero
frecords
Exclud
ingtop2%
stud
ents
Exclud
ing9thgraders
Exclud
ingstud
entsno
trankingsm
allschoo
lsas
firstchoice
Exclud
ingapplicants
from
privatescho
ols
Exclud
ingapplicants
notinvalid
lotteries

2003 04 2004 05 2005 06 2006 07 2007 08 All Years(1) (2) (3) (4) (5) (6)
Number of applicants 1,067 1,939 2,429 3,240 1,556 10,231Number with score observed before application 29 20 53 149 64 315Number with score observed after application 802 1,415 1,745 2,393 1,169 7,524Number with different multiple scores observed after application 247 644 808 1,164 534 3,397Number with different multiple scores observed after application, on first date 1 5 0 2 2 10Number with score observed on most common date 498 662 720 1,435 678 3,993Number with score observed before most common date 194 507 753 179 47 1,680Number with score observed after most common date 109 241 272 777 442 1,841
Number of applicants 1,067 1,939 2,429 3,240 1,556 10,231Number with score observed before application 0 0 0 0 1 1Number with score observed after application 778 1,353 1,709 2,331 1,091 7,262Number with different multiple scores observed after application 223 458 650 701 352 2,384Number with different multiple scores observed after application, on first date 0 1 1 15 5 22Number with score observed on most common date 310 549 674 993 456 2,982Number with score observed before most common date 168 278 394 455 291 1,586Number with score observed after most common date 300 525 640 868 339 2,672
Number of applicants 1,067 1,939 2,429 3,240 1,556 10,231Number with score observed before application 0 0 0 0 0 0Number with score observed after application 797 1,365 1,673 2,276 1,069 7,180Number with different multiple scores observed after application 254 640 692 823 371 2,780Number with different multiple scores observed after application, on first date 0 5 2 9 1 17Number with score observed on most common date 475 809 933 1,315 723 4,255Number with score observed before most common date 26 62 151 165 85 489Number with score observed after most common date 296 489 587 787 260 2,419
Number of applicants 1,067 1,939 2,429 3,240 1,556 10,231Number with score observed before application 0 0 0 0 0 0Number with score observed after application 716 1,256 1,608 2,163 933 6,676Number with different multiple scores observed after application 215 399 492 494 174 1,774Number with different multiple scores observed after application, on first date 0 0 1 2 2 5Number with score observed on most common date 393 624 887 1,180 641 3,725Number with score observed before most common date 240 403 468 572 214 1,897Number with score observed after most common date 83 229 252 409 76 1,049
Number of applicants 1,067 1,939 2,429 3,240 1,556 10,231Number with score observed before application 0 0 0 0 0 0Number with score observed after application 788 1,326 1,645 2,189 1,046 6,994Number with different multiple scores observed after application 157 447 511 598 232 1,945Number with different multiple scores observed after application, on first date 0 1 0 2 1 4Number with score observed on most common date 307 473 749 1,050 491 3,070Number with score observed before most common date 2 7 42 123 39 213Number with score observed after most common date 479 845 854 1,014 515 3,707
Panel E. Living Environment
Record Availability
Notes: This table summarizes the match between Regents test score outcomes and lotteried small school applicants. The sample is restricted tostudents in column (10) of Table B1.
Table B2. Match from Small School Applicants to Regents Test Score OutcomesApplication School Year
Panel A. Math
Panel B. English
Panel C. Global History
Panel D. US History

Total Offered Not Offered
2003 2004 1,067 2005 2011 2005 2008 0.922 0.926 0.9142004 2005 1,939 2005 2011 2006 2009 0.943 0.949 0.9372005 2006 2,429 2005 2011 2007 2010 0.929 0.942 0.9202006 2007 3,240 2005 2011 2008 2011 0.921 0.932 0.9112007 2008 1,556 2005 2011 2009 2011 0.939 0.927 0.947
2003 2004 1,067 2005 2010 2005 2008 0.988 0.986 0.9912004 2005 1,939 2006 2010 2006 2009 0.985 0.986 0.9842005 2006 2,429 2007 2010 2007 2010 0.978 0.984 0.9742006 2007 3,240 2008 2010 2008 2010 0.970 0.973 0.9682007 2008 1,556 2009 2010 2009 2010 0.993 0.985 0.998
2003 2004 1,067 2008 2012 2010 0.799 0.799 0.7972004 2005 1,939 2009 2012 2011 0.812 0.836 0.7882005 2006 2,429 2010 2012 2012 0.798 0.823 0.7802006 2007 3,240 2011 2012 2012 0.815 0.826 0.8032007 2008 1,556 2012 2012 0.814 0.803 0.821
2003 2004 1,067 2004 2008 2005 2006 0.604 0.631 0.5502004 2005 1,939 2002 2010 2006 2007 0.624 0.660 0.5882005 2006 2,429 2005 2011 2007 2008 0.636 0.679 0.6042006 2007 3,240 2007 2011 2008 2009 0.660 0.705 0.6162007 2008 1,556 2008 2012 2009 2010 0.673 0.687 0.664
2003 2004 1,067 2006 2010 2007 0.425 0.450 0.3722004 2005 1,939 2007 2011 2008 0.326 0.331 0.3212005 2006 2,429 2008 2012 2009 0.297 0.342 0.2642006 2007 3,240 2009 2012 2010 0.374 0.399 0.3502007 2008 1,556 2010 2012 2011 0.393 0.423 0.374
2003 2004 1,067 2006 2008 2007 2008 0.070 0.058 0.0952004 2005 1,939 2007 2009 2008 2009 0.054 0.051 0.0562005 2006 2,429 2007 2011 2009 2010 0.091 0.111 0.0762006 2007 3,240 2008 2012 2010 2011 0.123 0.147 0.1002007 2008 1,556 2009 2012 2011 2012 0.107 0.132 0.089
2003 2004 1,067 2009 2012 n.a 0.004 0.001 0.0092004 2005 1,939 2009 2013 2009 2012 0.401 0.444 0.3592005 2006 2,429 2009 2013 2010 2012 0.395 0.439 0.3632006 2007 3,240 2009 2013 2011 2012 0.400 0.431 0.3702007 2008 1,556 2010 2013 2012 0.293 0.316 0.277
Notes: This table summarizes the match between credit, attendance, graduation, College Board, and National Student Clearinghouseoutcomes and lotteried small school applicants. The sample is restricted to students in column (10) of Table B1.
Panel E. SAT
Panel F. Advanced Placement
Panel G. National Student Clearinghouse
Application CohortNumber ofStudents inSample
Years ObservedMost CommonYears Observed
Table B3. Match from Small School Applicants to Outcome Data
Matching Rate
Panel A. Credits
Panel B. Attendance
Panel C. Graduation
Panel D. PSAT

References
Abadie, Alberto, “Semiparametric Instrumental Variables Estimation of Treatment Response
Models,” Journal of Econometrics, 2003, 113(2), 231–263.
Abdulkadiroglu, Atila, Josh Angrist, and Parag Pathak, “The Elite Illusion: Achieve-
ment Effects at Boston and New York Exam Schools,” 2011. forthcoming, Econometrica.
, , Yusuke Narita, and Parag Pathak, “Research Design meets Market Design,”
2013. Unpublished working paper, MIT.
, Joshua D. Angrist, Susan Dynarski, Thomas J. Kane, and Parag A. Pathak,
“Accountability and Flexibility in Public Schools: Evidence from Boston’s Charters and
Pilots,” Quarterly Journal of Economics, 2011, 126(2), 699–748.
, Parag A. Pathak, and Alvin E. Roth, “The New York City High School Match,”
American Economic Review, Papers and Proceedings, 2005, 95, 364–367.
, , and , “Strategy-proofness versus Efficiency in Matching with Indifferences:
Redesigning the New York City High School Match,” American Economic Review, 2009,
99(5), 1954–1978.
Anderson, Michael, “Multiple Inference and Gender Differences in the Effects of Early Inter-
vention: A Reevaluation of the Abecedarian, Perry Preschool and Early Training Projects,”
Journal of the American Statistical Association, 2008, 103, 1481–1495.
Andrews, M., W. Duncombe, and J. Yinger, “Revisiting Economies of Size in American
Education: Are We Any Closer to a Consensus?,” Economics of Education Review, 2002,
21(3), 245262.
Angrist, Joshua D. and Alan Krueger, “Estimating the Payoff to Schooling Using the
Vietnam-Era Draft Lottery,” 1992. NBER Working Paper 4067.
and Guido Imbens, “Two-Stage Least Squares Estimation of Average Causal Effects in
Models with Variable Treatment Intensity,” Journal of the American Statistical Association:
Applications and Case Studies, 1995, 90, 431–442.
and Victor Lavy, “Using Maimonides’ Rule to Estimate the Effect of Class Size on
Student Achievement,” Quarterly Journal of Economics, 1999, 114(2), 533–575.
, Parag Pathak, and Christopher R. Walters, “Explaining Charter School Effective-
ness,” American Economic Journal: Applied Economics, 2013, 5(4), 1–27.
78

, Sarah R. Cohodes, Susan Dynarski, Parag A. Pathak, and Christopher Wal-
ters, “Stand and Deliver: Effects of Boston’s Charter High Schools on College Preparation,
Entry and Choice,” 2013. NBER Working paper, 19275.
, Susan Dynarski, Thomas J. Kane, Parag A. Pathak, and Christopher Walters,
“Who Benefits from KIPP?,” Journal of Policy Analysis and Management, 2012.
Barrow, Lisa, Amy Claessens, and Diane Whitmore Schanzenbach, “The Impact of
Chicago’s Small High School Initiative,” 2013. NBER Working Paper, 18889.
Bloom, Howard S. and Rebecca Unterman, “Sustained Positive Effects on Graduation
Rates Produced by New York City’s Small Public High Schools of Choice,” 2012. MDRC
Policy Brief.
and , “Sustained Progress: New Findings about the Effectiveness and Operation of
Small Public High Schools of Choice in New York City,” 2013. MDRC Policy Brief, August
26.
Bloom, Howard, Saskia-Levy Thompson, and Rebecca Unterman, “Transforming the
High School Experience: How New York City’s New Small Schools are Boosting Student
Achievement and Graduation Rates,” 2010. MDRC.
Bloomfield, David C., “Small Schools: Myth and Reality,” in “NYC Schools Under
Bloomberg and Klein: What Parents, Teachers, and Policymakers Need to Know” 2006,
pp. 49–56.
Bowen, William, Mathew Chingos, and Mike McPherson, Crossing the Finish Line:
Completing College at America’s Public Universities, Princeton University Press, Princeton
NJ, 2009.
Brynes, Susan, “$51 Million Grant from Bill & Melinda Gates Foundation to Support Small
Dynamic High Schools to Boost Student Achievement,” 2003. Press Release, Bill & Melinda
Gates Foundation, September. Available at: http://www.gatesfoundation.org/Media-
Center/Press-Releases/2003/09/New-York-City-Department-of-Education-Receives-
Grant.
Chetty, Raj, John N. Friedman, Nathaniel Hilger, Emmanuel Saez, and Diane Whit-
more Schanzenbach, “How Does Your Kindergarten Classroom Affect Your Earnings?
Evidence from Project Star,” Quarterly Journal of Economics, 2011, 126(4), 1593–1660.
Conant, James B., The American High School Today: A First Report to Interested Citizens,
New York: McGraw-Hill, 1959.
79

Cullen, Julie B., Brian Jacob, and Steve Levitt, “The Effect of School Choice on Partic-
ipants: Evidence from Randomized Lotteries,” Econometrica, 2006, 75, 1191–1230.
, Steven D. Levitt, Erin Robertson, and Sally Sadoff, “What Can Be Done to
Improve Struggling High Schools?,” Journal of Economic Perspectives, 2013, 27(2), 133–
152.
Cunha, Flavio and James Heckman, “The Technology of Skill Formation,” American Eco-
nomic Review, 2007, 97(2), 31–47.
, , and Susanne Schennach, “Estimating the Technology of Cognitive and Noncog-
nitive Skill Formation,” Econometrica, 2010, 78(3), 883–931.
Dee, Thomas S., Brian A. Jacob, Justin McCrary, and Jonah Rockoff, “Rules and
Discretion in the Evaluation of Students and Schools: The Case of the New York Regents
Examinations,” 2011. Work in progress, Columbia University.
Deming, David J. and Susan Dynarski, “Into College, Out of Poverty? Policies to Increase
the Postsecondary Attainment of the Poor,” in Philip Levine and David Zimmerman, eds.,
Targeting Investments in Children: Fighting Poverty When Resources are Limited, Univer-
sity of Chicago Press, 2010.
, Justine S. Hastings, Thomas J. Kane, and Douglas O. Staiger, “School Choice,
School Quality and Postsecondary Attainment,” 2011. forthcoming, American Economic
Review.
Dobbie, William and Roland J. Fryer, “Are High Quality Schools Enough to Close the
Achievement Gap? Evidence from a Social Experiment in Harlem,” American Economic
Journal: Applied Economics, 2011, 3(3), 158–187.
and , “Getting Beneath the Veil of Effective Schools: Evidence from New York City,”
American Economic Journal: Applied Economics, 2013, 5(4), 28–60.
and , “The Medium-Term Impacts of High-Achieving Charter Schools on Non-Test
Score Outcomes,” 2013. Working paper, Princeton University.
DOE, “Empowerment School Performance Agreement for 2006-07,” 2007. Available
at: http://www.crpe.org/portfolio/external-resources/nyc-performance-contract, Last ac-
cessed: September 2013.
80

, “New York City Department of Education, Office of Labor Relations, Frequently
Asked Questions,” 2007. http://schools.nyc.gov/NR/rdonlyres/7E50C743-72E1-4BDC-
8F40-E8DDED86570A/0/LaborFAQs200742407.pdf, Last accessed: September 2013.
, “ChildrenFirst: A Bold, Common-Sense Plan to Create Great Schools for
All New York City Children,” 2009. New York City Department of Educa-
tion, Available at: http://schools.nyc.gov/NR/rdonlyres/51C61E8F-1AE9-4D37-8881-
4D688D4F843A/0/cf corenarrative.pdf, Last accessed: September 2013.
, “Mayor Bloomberg and Chancellor Walcott Announce 54 New Schools
Will Open Next Fall,” 2012. DOE Press Release, April 17, Avail-
able at: http://schools.nyc.gov/Offices/mediarelations/NewsandSpeeches/2011-
2012/54 New Schools, Last accessed: September 2013.
, “New York City Graduation Rates: Class of 2011 (2007 Cohort),” 2012. Available at:
http://www.nyc.gov/html/om/pdf/2012/2011 grad deck presentation.pdf, Last accessed:
August 2013.
, “New York City Graduation Requirements,” 2012. Available at:
http://schools.nyc.gov/RulesPolicies/GraduationRequirements/default.htm, Last ac-
cessed: August 2013.
, “NYC School Survey 2011-2012,” 2012. Available at:
http://schools.nyc.gov/Accountability/tools/survey/default.htm, Last accessed: Au-
gust 2013.
Dur, Umut, Scott D. Kominers, Parag A. Pathak, and Tayfun Sonmez, “The Demise
of Walk Zones in Boston: Priorities vs. Precedence in School Choice,” 2013. NBERWorking
Paper 18981.
Dynarski, Susan M., Joshua Hyman, and Diane Schanzenbach, “Experimental Evi-
dence on the Effect of Childhood Investments on Postsecondary Attainment and Degree
Completion,” 2011. NBER Working Paper, w17533.
Epstein, Marc, “Small Schools: Miracle or Mirage?,” 2013. Huffington Post,
Blog, Available at: http://www.huffingtonpost.com/marc-epstein/small-schools-miracle-
or b 2641400.html?utm hp ref=new-york, Last accessed: September 2003.
Fleischer, Brian, “High School Academic Data Audit Report,” 2012. Report from Office of
Auditor General Commissioned by the New York City Department of Education, February
23.
81

Foderaro, Lisa, “CUNY Adjusts Amid Tide of Remedial Students,” 2011. New York Times,
N.Y. / Region, March 3.
Foley, Eileen and Elizabeth Reisner, “The New Century High Schools in New York City,”
in Becky A. Smerdon and Kathryn M. Borman, eds., Saving America’s High Schools, Urban
Institute Press, 2009, pp. 85–111.
, Erickson Arcaira, Stephen Coleman, Elizabeth Reisner, Troy Scott, Tandra
Turner, and Yvonne Woods, “Approaches of Bill & Melinda Gates Foundation-Funded
Intermediary Organizations to Structuring and Supporting Small High Schools in New York
City,” 2010. Policy Studies Associates.
Fredriksson, Peter, Bjorn Ockert, and Hessel Oosterbeek, “Long-Term Effects of Class
Size,” Quarterly Journal of Economics, 2013, 128(1), 249–285.
Gates, Bill, “Prepared remarks by Bill Gates at National Education Summit on High Schools,”
2005. Available at: http://www.gatesfoundation.org/media-center/speeches/2005/02/bill-
gates-2005-national-education-summit, Last accessed: July 2013.
, “Annual Letter of the Bill and Melinda Gates Foundation,” 2009.
http://www.gatesfoundation.org/who-we-are/resources-and-media/annual-letters-
list/annual-letter-2009.
Gewertz, Catherine, “Federal Officials to Probe Complaint Against N.Y.C. Small High
Schools,” Education Week, July 12, 2006.
, “Small Schools Under Big Fire,” Education Week, March 22, 2006.
Goertz, M., S. Loeb, and J. Wyckoff, “Recruiting, Evaluating and Retaining teachers: The
Children First Strategy to Improve New York City’s Teachers,” in J. O’Day, C. Bitter, and
L. Gomez, eds., Education Reform in New York City: Ambitious Change in the Nation’s
Most Complex School System, Cambridge MA: Harvard Education Press, 2011, pp. 157–177.
Gootman, Elisa, “Early Gains at City’s Themed Schools,” 2005. New York Times, Metropoli-
tan Desk, January 4.
, “Annenberg Grant to Help Smaller Schools,” 2006. New York Times, NY/Region Section,
April 28.
, “City’s New Small Schools are Focus of a Bias Inquiry,” 2006. New York Times,
NY/Region Section, June 16.
82

and Sharona Coutts, “Lacking Credits, Some Students Learn a Shortcut,” 2008. New
York Times, NY/Region Section, April 11.
Hanuschek, Eric A., “The Failure of Input-Based Schooling Policies,” Economic Journal,
2003, 113, F64–F98.
Hemphill, Clara and Kim Nauer, “The New Marketplace: How Small-School Reforms and
School Choice have Reshaped New York City’s High Schools,” 2009. Center for New York
City Affairs, Milano the New School for Management and Urban Policy.
and , “Managing by the Numbers: Empowerment and Accountability in New York
City’s Schools,” 2010. Center for New York City Affairs, Milano the New School for Man-
agement and Urban Policy.
Hoxby, Caroline and Christopher Avery, “The Missing “One-offs”: The Hidden Supply of
High-Achieving, Low-Income Students,” 2012. NBER Working Paper, 18586.
Iatarola, P., A. Schwartz, L. Stiefel, and Colin Chellman, “Small Schools, Large Dis-
tricts: Small School Reform and New York City’s Students,” Teachers College Record, 2008,
110(9), 1837–1878.
Imbens, Guido W. and Joshua D. Angrist, “Identification and Estimation of Local Average
Treatment Effects,” Econometrica, 1994, 62, 467–475.
Klein, Joel I., “Cover Letter,” in Laura Kurgan and New Visions for Public Schools, eds., From
Large School Buildings to Small School Campuses: Orchestrating the Shift, 2005, p. 2.
, “Empowerment Schools FAQ,” 2006. New York City Department of Education, Avail-
able at: http://schools.nycenet.edu/region6/midwood/empowerment.html, Last accessed:
September 2013.
Kling, Jeffrey R., Jeffrey B. Liebman, and Lawrence F. Katz, “Experimental Analysis
of Neighborhood Effects,” Econometrica, 2007, 75(1), 83–119.
Kominers, Scott D. and Tayfun Sonmez, “Designing for Diversity in Matching,” 2012.
Working paper, Boston College.
Krueger, Alan, “Experimental Estimates of Education Production Functions,” Quarterly
Journal of Economics, 1999, 114(2), 497–532.
Krueger, Alan B., “Economic Considerations and Class Size,” Economic Journal, 2003, 113,
34–63.
83

Kuziemko, Ilyana, “Using Shocks to School Enrollment to Estimate the Effect of School Size
on Student Achievement,” Economics of Education Review, 2006, 25, 63–75.
Lawrence, Barbara, “Dollars and Sense: The Cost Effectiveness of Small Schools,” 2002. To-
gether with: Steven Bingler and Barbara Diamond and Bobbie Hill and Jerry Hoffman and
Craig Howley and Stacy Mitchell and David Rudolph and Elliot Washor, KnowledgeWorks
Foundation.
Lazear, Edward P., “Educational Production,” Quarterly Journal of Economics, 2001, 116(3),
777–803.
Miller, Gifford, “Sharing Space: Rethinking the Implementation of Small High School
Reform in New York City,” 2005. Council of the City of New York, Available
at: http://www.nyc.gov/html/records/pdf/govpub/2130small schools final3.pdf, last ac-
cessed: September 2013.
Murnane, Richard J., “U.S. High School Graduation Rates: Patterns and Explanations,”
2013. NBER Working Paper, 18701.
Nadelstern, Eric, “Inteview with Horace editor Jill Davidson,” 2005. Available at:
http://www.essentialschools.org/resources/312, Last accessed: September 2013.
NCES, “Digest of Education Statistics, National Center for Education Statistics,” 2010.
http://nces.ed.gov/fastfacts/, Last accessed: July 2012.
NVPS, “Reforming High Schools: Lessons from the New Century High Schools Initiative,”
2006. Publication of New Visions for Public Schools.
NYSED, “New York State Education Department, 100.5 Diploma Requirements,” 2010. Avail-
able at: http://www.p12.nysed.gov/part100/pages/1005.html, Last accessed: August 2013.
Otterman, Sharon, “Big Schools Fall Hard in City Plan,” 2010. NY Times, Metropolitan
Desk, January 26.
Phillips, Anna, “In a First, City Plans to End Contract with a Support Organization,” 2011.
GothamSchools, April 19th, http://gothamschools.org/2011/04/19/in-a-first-city-plans-to-
end-contract-with-a-support-organization/, Last accessed: September 2013.
Pop-Eleches, Cristian and Miguel Urquiola, “Going to a Better School: Effects and Be-
havioral Responses,” American Economic Review, 2013, 4, 1289–1324.
Ravitch, Diane, The Death and Life of the Great American School System: How Testing and
Choice are Undermining Education, Basic Books, 2011.
84

Robelen, Eric, “Gates High Schools get Mixed Review in Study,” 2005. Education Week,
November 16.
Rockoff, Jonah and Cecilia Speroni, “Reliability, Consistency, and Validity of the NYC
DOE Environmental Surveys: A Preliminary Analysis,” 2008. Unpublished note, Columbia
University.
Rodriguez-Planas, Nuria, “Longer-Terms Impacts of Mentoring, Educational Services, and
Learning Incentives: Evidence from a Randomized Trial in the United States,” American
Economic Journal: Applied Economics, 2012, 4(4), 121–139.
Santos, Fernanda, “Before the School Bell, Teachers in Bronx Make House Calls,” 2011. NY
Times, N.Y. Region, September 2.
Schwartz, Amy E., L. Stiefel, and Matthew Wiswall, “Do Small Schools Improve Perfor-
mance in a Large, Urban District? Causal Evidence from New York City,” 2013. Unpub-
lished manuscript, Institute for Education and Social Policy, NYU.
Shear, Linda, Barbara Means, Karen Mitchell, Ann House, Torie Gorges, Aasha
Joshi, Becky Smerdon, and Jamie Shkolnik, “Contrasting Paths to Small-School
Reform: Results of a 5-year Evaluation of the Bill & Melinda Gates Foundation’s National
High Schools Initiative,” Teachers College Volume, 2008, 110(9), 1986–2039.
Toch, Thomas, High Schools on a Human Scale: How Small Schools Can Transform American
Education, Beacon Press, 2003.
, “Small is Still Beautiful,” Washington Monthly, 2010, July/August.
UFT, “Report of the United Federation of Teachers Small School Task Force,” 2005. Avail-
able at: http://www.uft.org/files/attachments/uft-report-2005-06-small-schools.pdf, Last
accessed: September 2013.
85