small cap core portfolio managed accounts fourth … 7.51% 7.78% -25%-20%-15%-10%-5% 0% 5% 10% 15%...
TRANSCRIPT

kayne.com
1800 Avenue of the Stars, 2nd Floor Los Angeles, CA 90067 T 800.231.7414
Small Cap Core Portfolio Managed Accounts Fourth Quarter 2017 Review

2
Firm Overview As of December 31, 2017
• Originally established to manage founder capital
• Specialization in small cap equity strategies with over three decades of experience
• A differentiated “business analyst” investment approach focusing on high-quality businesses
• A disciplined and repeatable investment process that produces high-conviction portfolios
• A wholly owned, independent subsidiary of Virtus Investment Partners
Profile At a Glance
Year Founded 1984
Headquarters Los Angeles, CA
AUM $18.9 billion
Number of Investment Professionals 14
Average Investment Experience 16 Years
AUM by Investment Discipline
All Cap 1% Large Cap
13%
Mid Cap 3%
Small-Mid Cap 14%
Small Cap 62%
Fixed Income 7%
Numbers may not always add up due to rounding.

3
• To achieve a return meaningfully above that of the Russell 2000® Index
• To achieve this return objective with a portfolio that exhibits lower overall risk characteristics
Investment Objectives
We believe that purchasing high-quality businesses with competitive protections at attractive valuations will achieve excess returns over a complete market cycle
Investment Philosophy
Disciplined Investment Approach Investment Philosophy & Objectives

4
Tenets of Quality
High Quality
Market Control
Ability to Develop, Nurture, Protect its Market/
Effective Competitive Differentiation
Management Excellence
Develop and Adhere to Core Competencies/
Disciplined Capital Allocation
Balance Sheet Statement
Low Capital Intensity/ Low Debt Balance Sheet
Cash Flow Statement
High Free Cash Flow/ Self Financing
Income Statement
Durable Earnings Growth/
High Return on Capital

Small Cap Core Team
5
Portfolio Manager/Analysts Responsibility Research Experience Years with KAR
Douglas S. Foreman, CFA Chief Investment Officer 31 Years 6 Years
Todd Beiley, CFA Portfolio Manager & Senior Research Analyst Sector Coverage: Financials and Producer Durables
18 Years 15 Years
Jon Christensen, CFA Portfolio Manager & Senior Research Analyst Sector Coverage: Health Care
22 Years 16 Years
Julie Kutasov Senior Research Analyst Sector Coverage: Energy and Financials
16 Years 16 Years
Craig Stone Senior Research Analyst Sector Coverage: Producer Durables
28 Years 17 Years
Chris Wright, CFA Senior Research Analyst Sector Coverage: Consumer Discretionary, Consumer Staples, and Financials
7 Years 5 Years
Chris Benway, CFA Research Analyst Sector Coverage: Materials and Processing and Producer Durables
8 Years 3 Years
Julie Biel, CFA Research Analyst Sector Coverage: Technology and Consumer Discretionary
9 Years 4 Years
Jordan Greenhouse Portfolio Specialist 20 Years* 1 Year
*Represents years of industry experience.

11.25%
5.78%
17.84%
16.91%
(17.14%)
2.36%
0.02%
1.00%
1.26%
7.22%
7.51%
7.78%
-25% -20% -15% -10% -5% 0% 5% 10% 15% 20% 25%
Utilities
FinancialServices
Technology
ConsumerDiscretionary
Energy
Consumer Staples
Fourth Quarter 2017
One Year Ending 12/31/17
This material is deemed supplemental and complements the performance and disclosure at the end of this presentation. Data is obtained from FactSet Research Systems and is assumed to be reliable. Past performance is no guarantee of future results.
Market Review
Index Performance
Sector Performance Russell 2000® Index
Top Performers
Bottom Performers
6
7.44% 4.23%
6.64%
3.34% 0.41% 0.39%
37.28%
25.03% 21.83%
14.65%
7.48%
3.54%
0%
5%
10%
15%
20%
25%
30%
35%
40%
MSCI®Emerging
Markets Index
MSCI®EAFE Index
S&P 500®Index
Russell2000® Index
ICE BofAML U.S.High Yield Index
Bloomberg BarclaysU.S. Aggregate
Bond Index
Fourth Quarter 2017
One Year Ending 12/31/17
7
This material is deemed supplemental and complements the performance and disclosure at the end of this presentation. Data is obtained from FactSet Research Systems and is assumed to be reliable. Past performance is no guarantee of future results.
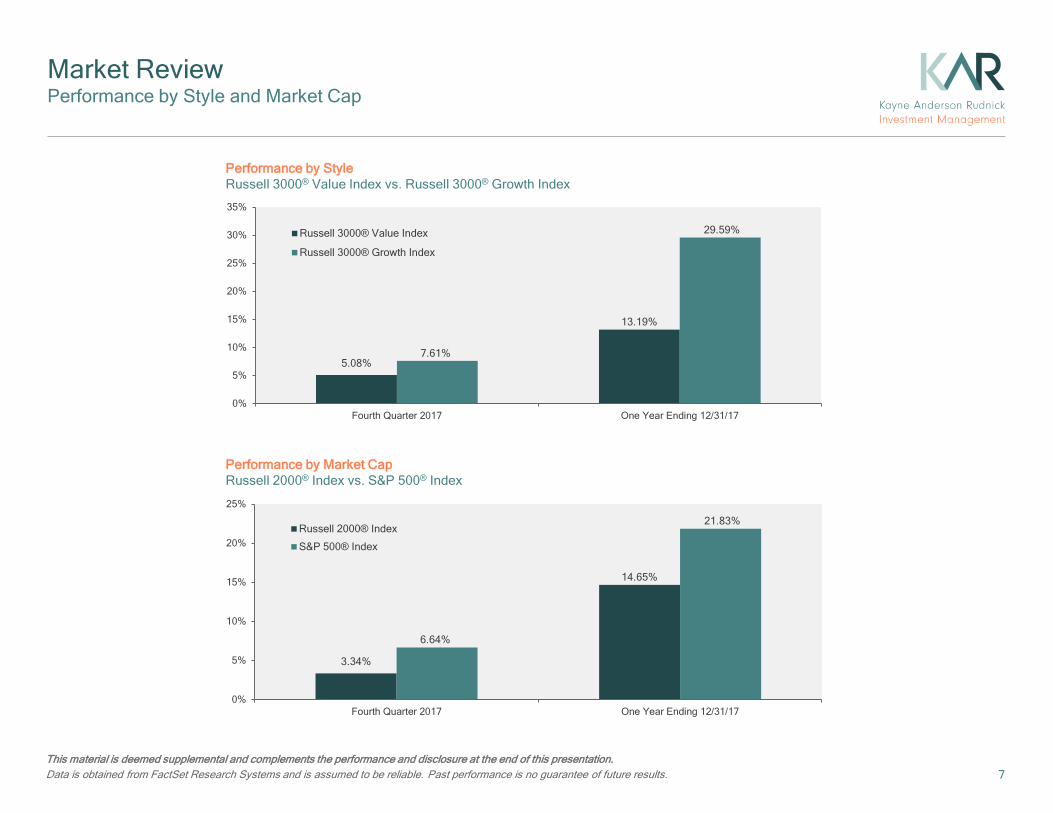
Market Review Performance by Style and Market Cap
Performance by Style Russell 3000® Value Index vs. Russell 3000® Growth Index
5.08%
13.19%
7.61%
29.59%
0%
5%
10%
15%
20%
25%
30%
35%
Fourth Quarter 2017 One Year Ending 12/31/17
Russell 3000® Value Index
Russell 3000® Growth Index
Performance by Market Cap Russell 2000® Index vs. S&P 500® Index
3.34%
14.65%
6.64%
21.83%
0%
5%
10%
15%
20%
25%
Fourth Quarter 2017 One Year Ending 12/31/17
Russell 2000® Index
S&P 500® Index
8
This material is deemed supplemental and complements the performance and disclosure at the end of this presentation. Returns for the Kayne Anderson Rudnick composite are preliminary. All periods less than one year are total returns and are not annualized. For further details on the composite, please see the disclosure statement in this presentation. Data is obtained from FactSet Research Systems and is assumed to be reliable. Numbers may not always add up due to rounding. Past performance is no guarantee of future results.
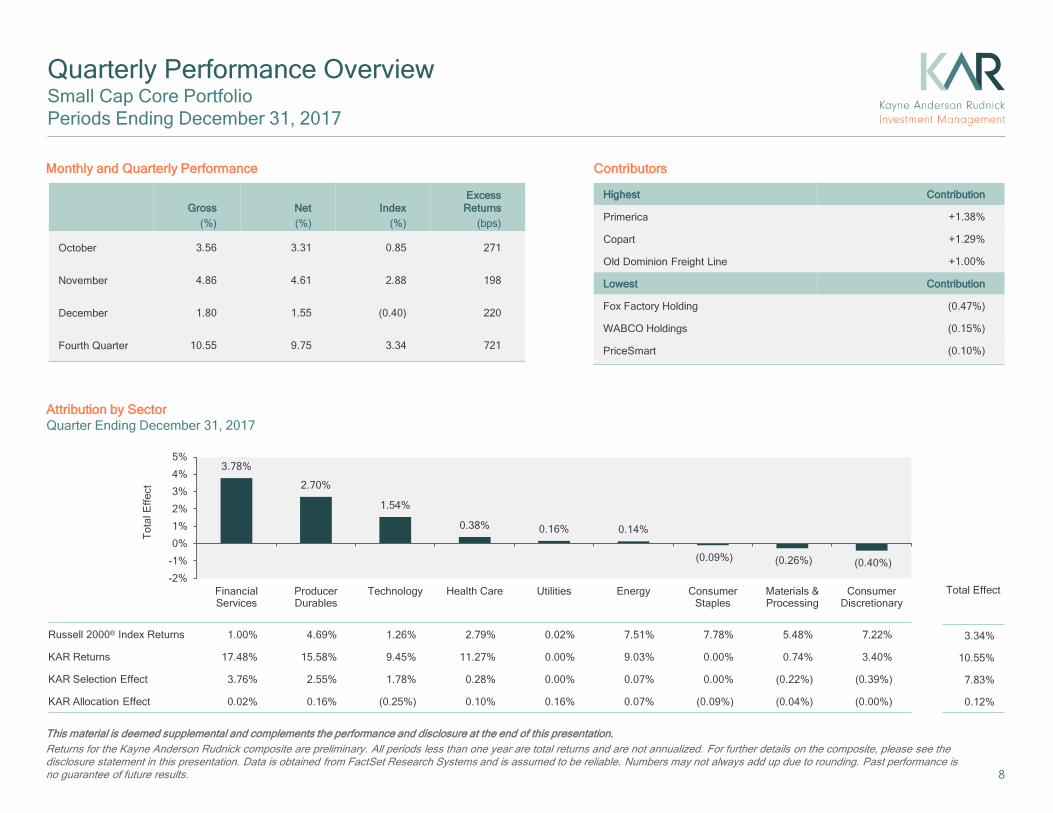
Quarterly Performance Overview Small Cap Core Portfolio Periods Ending December 31, 2017
Contributors
Tot
al E
ffect
Attribution by Sector Quarter Ending December 31, 2017
Monthly and Quarterly Performance
Highest Contribution
Primerica +1.38%
Copart +1.29%
Old Dominion Freight Line +1.00%
Lowest Contribution
Fox Factory Holding (0.47%)
WABCO Holdings (0.15%)
PriceSmart (0.10%)
Gross (%)
Net (%)
Index (%)
Excess Returns
(bps)
October 3.56 3.31 0.85 271
November 4.86 4.61 2.88 198
December 1.80 1.55 (0.40) 220
Fourth Quarter 10.55 9.75 3.34 721
3.34%
10.55%
7.83%
0.12%
Russell 2000® Index Returns 1.00% 4.69% 1.26% 2.79% 0.02% 7.51% 7.78% 5.48% 7.22%
KAR Returns 17.48% 15.58% 9.45% 11.27% 0.00% 9.03% 0.00% 0.74% 3.40%
KAR Selection Effect 3.76% 2.55% 1.78% 0.28% 0.00% 0.07% 0.00% (0.22%) (0.39%)
KAR Allocation Effect 0.02% 0.16% (0.25%) 0.10% 0.16% 0.07% (0.09%) (0.04%) (0.00%)
3.78%
2.70%
1.54%
0.38% 0.16% 0.14%
(0.09%) (0.26%) (0.40%) -2%
-1%
0%
1%
2%
3%
4%
5%
FinancialServices
ProducerDurables
Technology Health Care Utilities Energy ConsumerStaples
Materials &Processing
ConsumerDiscretionary
Total Effect

Gross (%)
Net (%)
Index (%)
Excess Returns
(bps)
First Quarter 2017 5.96 5.18 2.47 349
Second Quarter 2017 6.86 6.08 2.46 440
Third Quarter 2017 8.69 7.90 5.67 302
Fourth Quarter 2017 10.55 9.75 3.34 721
1 Year Ending 12/31/17 36.04 32.12 14.65 2140
9
This material is deemed supplemental and complements the performance and disclosure at the end of this presentation. Returns for the Kayne Anderson Rudnick composite are preliminary. All periods less than one year are total returns and are not annualized. For further details on the composite, please see the disclosure statement in this presentation. Data is obtained from FactSet Research Systems and is assumed to be reliable. Numbers may not always add up due to rounding. Past performance is no guarantee of future results.
Annual Performance Overview Small Cap Core Portfolio Periods Ending December 31, 2017
Quarterly and Annual Performance
14.65%
36.04%
26.28%
(1.35%)
Total Effect
Attribution by Sector One Year Ending December 31, 2017
Tot
al E
ffect
Russell 2000® Index Returns 5.78% 17.84% 18.62% 16.91% 15.65% 2.36% 11.25% (17.14%) 36.08%
KAR Returns 39.92% 69.95% 46.57% 35.79% 30.14% (11.71%) 0.00% (15.35%) (5.04%)
KAR Selection Effect 7.73% 8.37% 6.01% 4.64% 0.80% 0.02% 0.00% 0.47% (1.76%)
KAR Allocation Effect 0.46% (0.19%) 0.47% (0.15%) 0.06% 0.39% 0.20% (0.83%) (1.86%)
8.19% 8.18% 6.48%
4.48%
0.87% 0.41% 0.20%
(0.36%)
(3.62%) -6%-4%-2%0%2%4%6%8%
10%
FinancialServices
Technology ProducerDurables
ConsumerDiscretionary
Materials &Processing
ConsumerStaples
Utilities Energy Health Care

10
This material is deemed supplemental and complements the performance and disclosure at the end of this presentation. A complete list of portfolio holdings and specific securities transactions for the preceding 12 months is available upon request. Holdings are subject to change. All information is provided for informational purposes only and should not be deemed as a recommendation to purchase the securities mentioned. Kayne Anderson Rudnick has chosen to review the securities in this document based upon objective criteria. It should not be assumed that securities recommended in the future will be profitable. Data is obtained from FactSet Research Systems and is assumed to be reliable. Past performance is no guarantee of future results.
Highest Contributors Small Cap Core Portfolio One Year Ending December 31, 2017
Security Contribution Comments
Autohome +8.35% Autohome shares increased meaningfully during 2017 as the company refined its strategy and exited a money-losing new car transaction business. This allowed the strong profitability of its core business to re-emerge and translated into double-digit growth in revenue and earnings-per-share for the trailing 12 months. Autohome’s financial results are also benefiting from the ongoing secular shift of ad budgets from offline to online media. Given Autohome’s strong competitive positioning, improved capital allocation and the expected long-term growth of the Chinese car market, we remain owners of the business.
NVR (Sold Q4 2017)
+2.73% NVR shares increased throughout the year as the company reported several quarters of better-than-expected revenue and earnings growth. NVR continues to benefit from the ongoing, but slow, recovery in housing. While we expect opportunities to remain for further increases in revenues and earnings, we have sold our position as the market cap has now surpassed $13 billion and is no longer appropriate for a small cap strategy.
Primerica +2.63% Primerica shares have increased meaningfully following the election due to investor expectations that the Department of Labor’s Fiduciary Standard Rule (the “Rule”) would be meaningfully scaled back under the new administration. While changes to the Rule have not been made yet, full implementation of the Rule has been pushed back until 2019 so that officials have more time to review the Rule as currently written. More importantly, the fundamentals of Primerica’s business continue to improve as the company sells more life insurance and investment products to middle-income families.

11
This material is deemed supplemental and complements the performance and disclosure at the end of this presentation. A complete list of portfolio holdings and specific securities transactions for the preceding 12 months is available upon request. Holdings are subject to change. All information is provided for informational purposes only and should not be deemed as a recommendation to purchase the securities mentioned. Kayne Anderson Rudnick has chosen to review the securities in this document based upon objective criteria. It should not be assumed that securities recommended in the future will be profitable. Data is obtained from FactSet Research Systems and is assumed to be reliable. Past performance is no guarantee of future results.
Lowest Contributors Small Cap Core Portfolio One Year Ending December 31, 2017
Security Contribution Comments
Shutterstock (Sold Q1 2017)
(0.73%) Shutterstock stock had rebounded in the first half of 2016 as concerns regarding the competitive threat from Adobe’s new stock photo offering abated. However, a meaningful slowdown in revenue growth over the next two quarters sent the share price lower. Our original investment thesis was based on the network effects of Shutterstock’s core stock photo marketplace business. Even at lower growth rates, that marketplace business is very profitable and valuable. Unfortunately, the profits from that great business will remain depressed as management seeks growth by investing capital to grow other parts of the company where Shutterstock’s competitive advantage is less clear. Thus, we sold our position in the first quarter.
Dril-Quip (0.65%) Dril-Quip shares lagged, driven by continuous weakness in deepwater drilling activity. Our view of the company’s long-term market positioning remains intact, however. We continue to believe that Dril-Quip is better protected both as a “best of breed” mission-critical equipment supplier and as a low-cost manufacturer. Importantly, Dril-Quip has a long-term track record of disciplined capital allocation, and the company’s balance sheet remains pristine with plenty of cash and no debt.
Abaxis (0.36%) Abaxis saw its shares fall in the last year after experiencing a weak sales quarter as its vet business grew only slightly while the medical business declined due to distributor de-stocking. The company is ramping up its R&D efforts that should drive the top line, but this disconnect with the financials could continue for a few more quarters. The solid balance sheet and high consumables mix, combined with a re-rating of the shares with future growth ahead, keeps us as shareholders.
12
This material is deemed supplemental and complements the performance and disclosure at the end of this presentation. A complete list of portfolio holdings and specific securities transactions for the preceding 12 months is available upon request. Holdings are subject to change. All information is provided for informational purposes only and should not be deemed as a recommendation to purchase the securities mentioned. Kayne Anderson Rudnick has chosen to review the securities in this document based upon objective criteria. It should not be assumed that securities recommended in the future will be profitable.
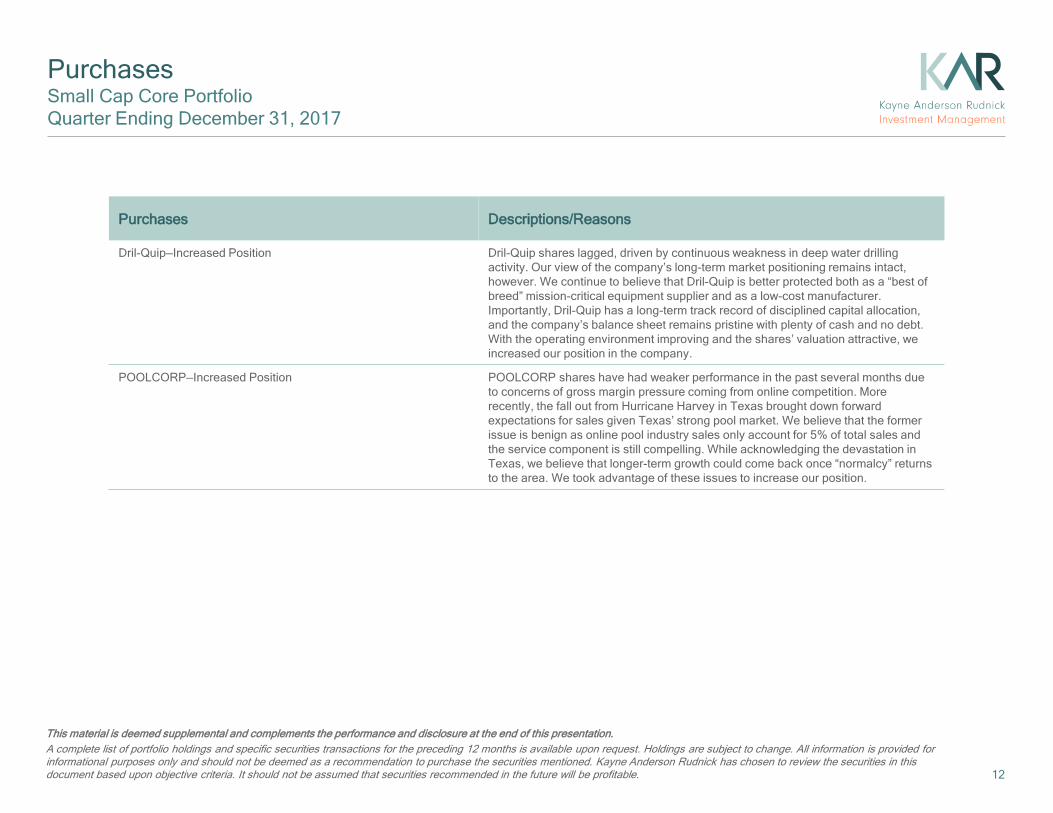
Purchases Small Cap Core Portfolio Quarter Ending December 31, 2017
Purchases Descriptions/Reasons
Dril-Quip—Increased Position Dril-Quip shares lagged, driven by continuous weakness in deep water drilling activity. Our view of the company’s long-term market positioning remains intact, however. We continue to believe that Dril-Quip is better protected both as a “best of breed” mission-critical equipment supplier and as a low-cost manufacturer. Importantly, Dril-Quip has a long-term track record of disciplined capital allocation, and the company’s balance sheet remains pristine with plenty of cash and no debt. With the operating environment improving and the shares’ valuation attractive, we increased our position in the company.
POOLCORP—Increased Position POOLCORP shares have had weaker performance in the past several months due to concerns of gross margin pressure coming from online competition. More recently, the fall out from Hurricane Harvey in Texas brought down forward expectations for sales given Texas’ strong pool market. We believe that the former issue is benign as online pool industry sales only account for 5% of total sales and the service component is still compelling. While acknowledging the devastation in Texas, we believe that longer-term growth could come back once “normalcy” returns to the area. We took advantage of these issues to increase our position.

13
This material is deemed supplemental and complements the performance and disclosure at the end of this presentation. A complete list of portfolio holdings and specific securities transactions for the preceding 12 months is available upon request. Holdings are subject to change. All information is provided for informational purposes only and should not be deemed as a recommendation to purchase the securities mentioned. Kayne Anderson Rudnick has chosen to review the securities in this document based upon objective criteria. It should not be assumed that securities recommended in the future will be profitable.
Sales Small Cap Core Portfolio Quarter Ending December 31, 2017
Sales Reasons
NVR—Sold Entire Position Since our last trim of NVR shares more than two years ago, the business has performed strongly relative to the Russell 2000 Index. The market cap of NVR was getting too large for the portfolio so we sold our position.
Polaris Industries—Sold Entire Position Polaris has largely completed a significant recall effort while new product introductions and improving industry demand led to a rebound in business. Consequently, the shares rose and the stock was priced at an attractive multiple. Given this, we reduced our position during the quarter and ultimately sold our holdings.
14
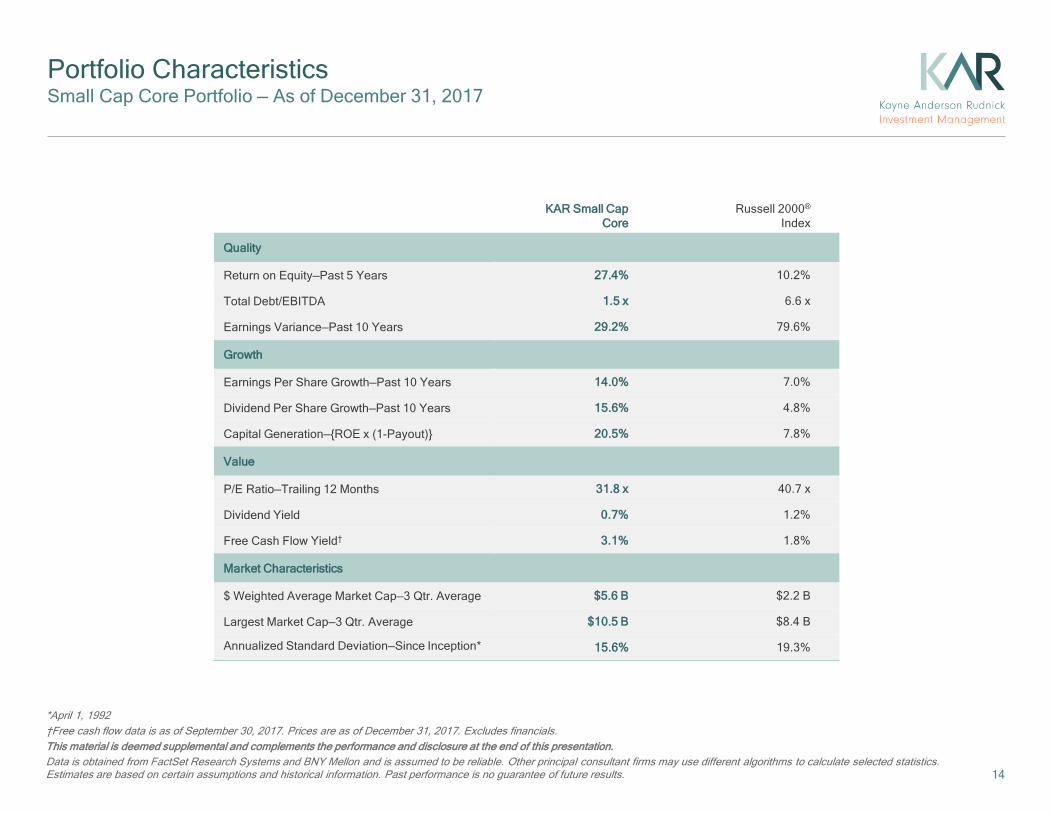
*April 1, 1992 †Free cash flow data is as of September 30, 2017. Prices are as of December 31, 2017. Excludes financials. This material is deemed supplemental and complements the performance and disclosure at the end of this presentation. Data is obtained from FactSet Research Systems and BNY Mellon and is assumed to be reliable. Other principal consultant firms may use different algorithms to calculate selected statistics. Estimates are based on certain assumptions and historical information. Past performance is no guarantee of future results.
Portfolio Characteristics Small Cap Core Portfolio — As of December 31, 2017
KAR Small Cap Core
Russell 2000®
Index
Quality
Return on Equity—Past 5 Years 27.4% 10.2%
Total Debt/EBITDA 1.5 x 6.6 x
Earnings Variance—Past 10 Years 29.2% 79.6%
Growth
Earnings Per Share Growth—Past 10 Years 14.0% 7.0%
Dividend Per Share Growth—Past 10 Years 15.6% 4.8%
Capital Generation—{ROE x (1-Payout)} 20.5% 7.8%
Value
P/E Ratio—Trailing 12 Months 31.8 x 40.7 x
Dividend Yield 0.7% 1.2%
Free Cash Flow Yield† 3.1% 1.8%
Market Characteristics
$ Weighted Average Market Cap—3 Qtr. Average $5.6 B $2.2 B
Largest Market Cap—3 Qtr. Average $10.5 B $8.4 B
Annualized Standard Deviation—Since Inception* 15.6% 19.3%
15
Market Outlook U.S. Economy
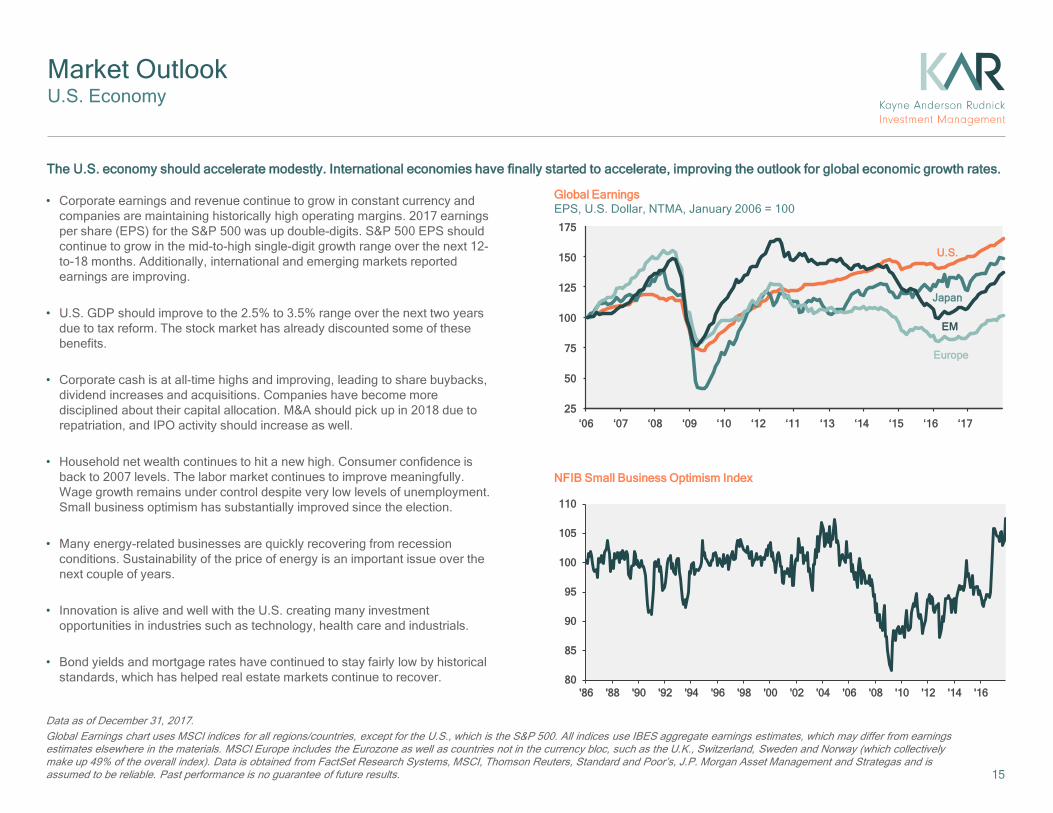
Data as of December 31, 2017. Global Earnings chart uses MSCI indices for all regions/countries, except for the U.S., which is the S&P 500. All indices use IBES aggregate earnings estimates, which may differ from earnings estimates elsewhere in the materials. MSCI Europe includes the Eurozone as well as countries not in the currency bloc, such as the U.K., Switzerland, Sweden and Norway (which collectively make up 49% of the overall index). Data is obtained from FactSet Research Systems, MSCI, Thomson Reuters, Standard and Poor’s, J.P. Morgan Asset Management and Strategas and is assumed to be reliable. Past performance is no guarantee of future results.
• Corporate earnings and revenue continue to grow in constant currency and companies are maintaining historically high operating margins. 2017 earnings per share (EPS) for the S&P 500 was up double-digits. S&P 500 EPS should continue to grow in the mid-to-high single-digit growth range over the next 12-to-18 months. Additionally, international and emerging markets reported earnings are improving.
• U.S. GDP should improve to the 2.5% to 3.5% range over the next two years due to tax reform. The stock market has already discounted some of these benefits.
• Corporate cash is at all-time highs and improving, leading to share buybacks, dividend increases and acquisitions. Companies have become more disciplined about their capital allocation. M&A should pick up in 2018 due to repatriation, and IPO activity should increase as well.
• Household net wealth continues to hit a new high. Consumer confidence is back to 2007 levels. The labor market continues to improve meaningfully. Wage growth remains under control despite very low levels of unemployment. Small business optimism has substantially improved since the election.
• Many energy-related businesses are quickly recovering from recession conditions. Sustainability of the price of energy is an important issue over the next couple of years.
• Innovation is alive and well with the U.S. creating many investment opportunities in industries such as technology, health care and industrials.
• Bond yields and mortgage rates have continued to stay fairly low by historical standards, which has helped real estate markets continue to recover.
The U.S. economy should accelerate modestly. International economies have finally started to accelerate, improving the outlook for global economic growth rates.
NFIB Small Business Optimism Index
Global Earnings EPS, U.S. Dollar, NTMA, January 2006 = 100
U.S.
Japan
EM
Europe
‘06
150
125
100
75
50
25
175
‘07 ‘08 ‘12 ‘13 ‘14 ‘15 ‘16 ‘17 ‘09 ‘10 ‘11
80
85
90
95
100
105
110
'86 '88 '90 '92 '94 '96 '98 '00 '02 '04 '06 '08 '10 '12 '14 '16
16
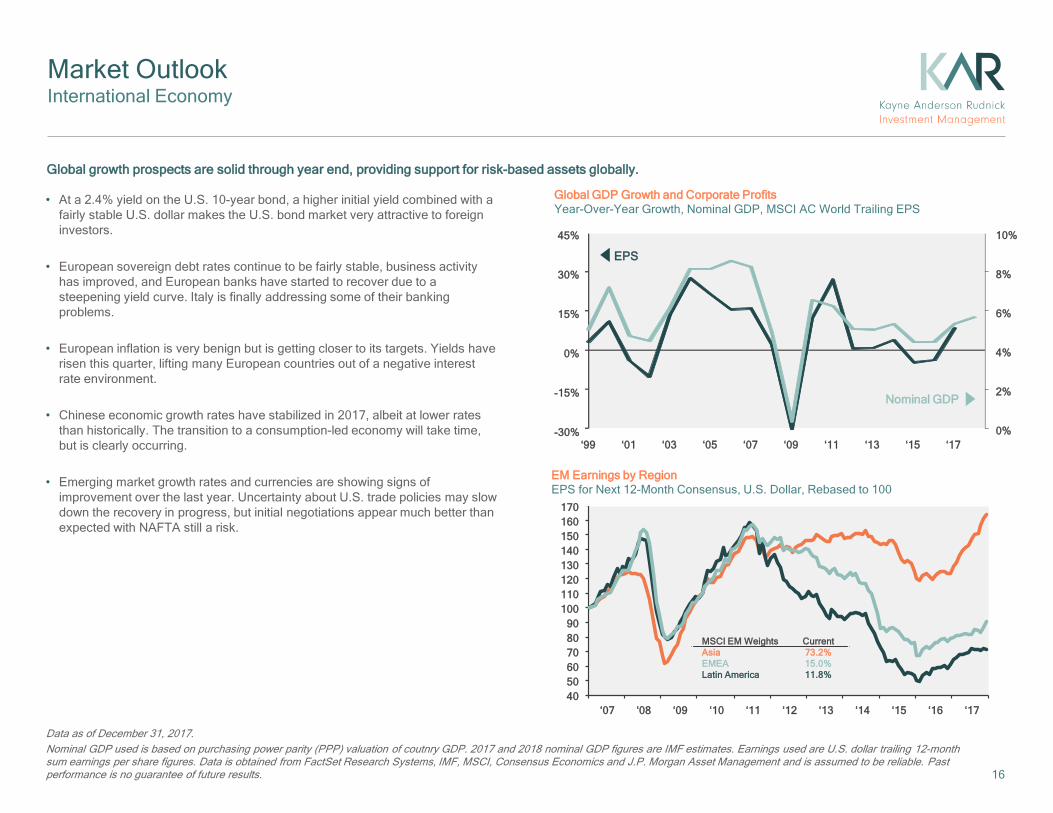
Data as of December 31, 2017. Nominal GDP used is based on purchasing power parity (PPP) valuation of coutnry GDP. 2017 and 2018 nominal GDP figures are IMF estimates. Earnings used are U.S. dollar trailing 12-month sum earnings per share figures. Data is obtained from FactSet Research Systems, IMF, MSCI, Consensus Economics and J.P. Morgan Asset Management and is assumed to be reliable. Past performance is no guarantee of future results.
Market Outlook International Economy
• At a 2.4% yield on the U.S. 10-year bond, a higher initial yield combined with a fairly stable U.S. dollar makes the U.S. bond market very attractive to foreign investors.
• European sovereign debt rates continue to be fairly stable, business activity has improved, and European banks have started to recover due to a steepening yield curve. Italy is finally addressing some of their banking problems.
• European inflation is very benign but is getting closer to its targets. Yields have risen this quarter, lifting many European countries out of a negative interest rate environment.
• Chinese economic growth rates have stabilized in 2017, albeit at lower rates than historically. The transition to a consumption-led economy will take time, but is clearly occurring.
• Emerging market growth rates and currencies are showing signs of improvement over the last year. Uncertainty about U.S. trade policies may slow down the recovery in progress, but initial negotiations appear much better than expected with NAFTA still a risk.
Global growth prospects are solid through year end, providing support for risk-based assets globally.
EM Earnings by Region EPS for Next 12-Month Consensus, U.S. Dollar, Rebased to 100
170
50
‘07
Global GDP Growth and Corporate Profits Year-Over-Year Growth, Nominal GDP, MSCI AC World Trailing EPS
‘01
45%
‘09 ‘11 ‘15 ‘17
10%
30%
15%
0%
-15%
-30%
8%
6%
4%
2%
0% ‘13 ‘03 ‘05 ‘07
EPS
Nominal GDP
MSCI EM Weights Current Asia 73.2% EMEA 15.0% Latin America 11.8%
‘99
150 140 130 120 110 100
90 80 70 60
160
‘08 ‘09 ‘10 ‘11 ‘12 ‘13 ‘14 ‘15 ‘16 ‘17 40
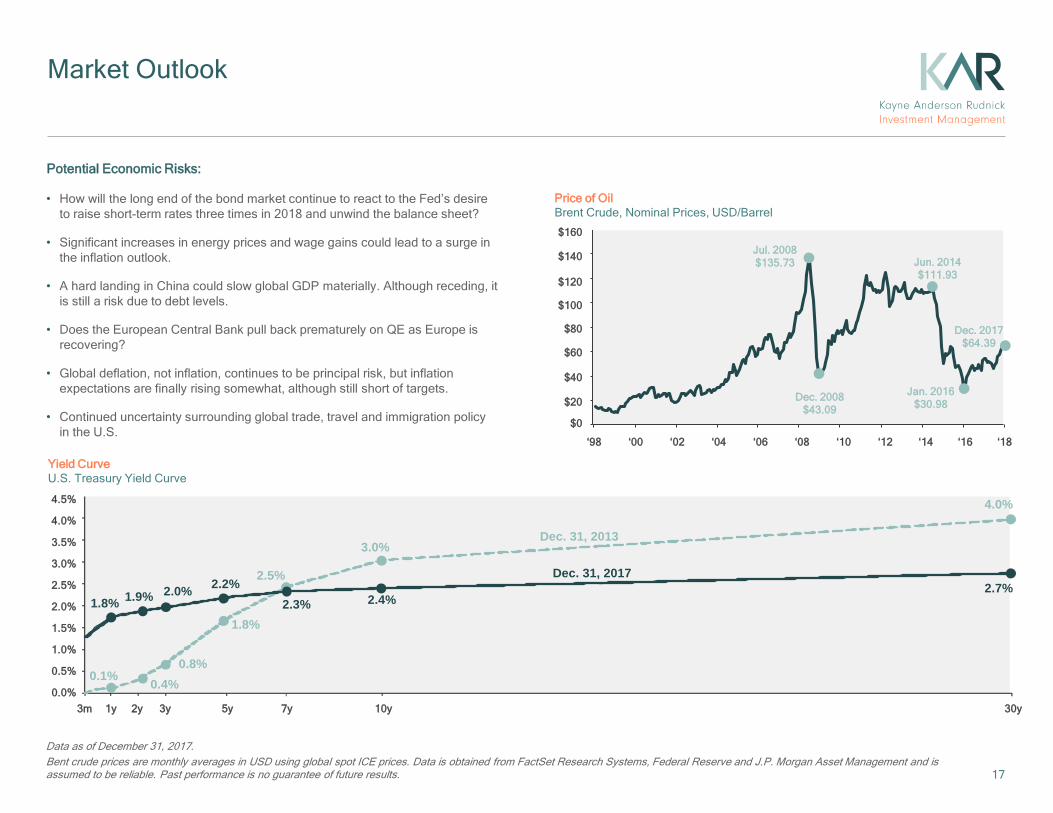
Data as of December 31, 2017. Bent crude prices are monthly averages in USD using global spot ICE prices. Data is obtained from FactSet Research Systems, Federal Reserve and J.P. Morgan Asset Management and is assumed to be reliable. Past performance is no guarantee of future results.
Market Outlook
17
Dec. 31, 2013
Dec. 31, 2017
1.8% 1.9% 2.0% 2.2% 2.5%
3.0%
4.0%
2.7%2.4%2.3%
1.8%
0.8%0.4%0.1%
• How will the long end of the bond market continue to react to the Fed’s desire to raise short-term rates three times in 2018 and unwind the balance sheet?
• Significant increases in energy prices and wage gains could lead to a surge in the inflation outlook.
• A hard landing in China could slow global GDP materially. Although receding, it is still a risk due to debt levels.
• Does the European Central Bank pull back prematurely on QE as Europe is recovering?
• Global deflation, not inflation, continues to be principal risk, but inflation expectations are finally rising somewhat, although still short of targets.
• Continued uncertainty surrounding global trade, travel and immigration policy in the U.S.
Potential Economic Risks:
Price of Oil Brent Crude, Nominal Prices, USD/Barrel
$160
$140
$120
$100
$60
$40
$20
‘00 ‘10 ‘98 ‘02 ‘04 ‘06 ‘08 ‘12 ‘14
3m 1y 2y 3y 5y 7y 10y 30y
3.0%
3.5%
2.5%
2.0%
1.5%
1.0%
0.5%
0.0%
4.0%
4.5%
Yield Curve U.S. Treasury Yield Curve
Jul. 2008 $135.73
Dec. 2008 $43.09
Jun. 2014 $111.93
Dec. 2017 $64.39
Jan. 2016 $30.98
$0
‘16
$80
‘18

18
Data as of December 31, 2017. *P/CF is a 20-year average due to cash flow data availability. Price to earnings is price divided by consensus analyst estimates of earnings per share for the next 12 months as provided by IBES since December 1989, and FactSet for December 31, 2017. Average P/E and standard deviations are calculated using 25 years of FactSet history. Shiller’s P/E uses trailing 10-years of inflation-adjusted earnings as reported by companies. Dividend yield is calculated as the next 12-month consensus dividend divided by most recent price. Price to book ratio is the price divided by book value per share. Price to cash flow is price divided by NTM cash flow. EY minus Baa yield is the forward earnings yield (consensus analyst estimates of EPS over the next 12 months divided by price) minus the Moody’s Baa seasoned corporate bond yield. Std. dev. over-/under-valued is calculated using the average and standard deviation over 25 years for each measure. Data is obtained from FactSet Research Systems, FRB, Thomas Reuters, Robert Shiller, Standard and Poor’s and J.P. Morgan Asset Management and is assumed to be reliable. Past performance is no guarantee of future results.
Market Outlook
Current:18.2x
25-year average: 16.0x
+1 Std. dev.: 19.2x
-1 Std. dev.: 12.8x
• As consumer confidence stays strong, there is potential for P/E ratios to improve slightly. Retail investors still are not fully engaged in the equity market.
• Equity valuations remain reasonable by historic measures, both at absolute levels but particularly relative to interest rates.
• Foreign markets are finally supporting U.S. EPS growth rates, particularly for large multinationals.
• With favorable corporate cash flow, investors are being rewarded with increased share buybacks, dividends and occasional acquisitions.
• Corporate profit margins are still being maintained at very high historical levels.
• Due to tax reform, we believe high-quality businesses with protected markets are a better place to invest than lower quality companies operating in more competitive markets which will pass on these savings to their customers eventually.
• Investors should expect more modest equity returns going forward (6% to 8% range over time) based on the maturity of this economy and business cycle. Volatility has been very low since the election and we are overdue for some type of correction, but the longer term outlook is still favorable.
We continue to believe that the risk/reward ratio for equities over the long term is favorable on an absolute basis and particularly relative to fixed income.
S&P 500® Index: Forward P/E Ratio 26x
24x
22x
20x
18x
16x
14x
12x
10x
8x ‘90 ‘92 ‘94 ‘96 ‘98 ‘00 ‘02 ‘04 ‘06 ‘08 ‘10 ‘12 ‘14 ‘16
Valuation Measure Description Latest 25-year avg.*
Std. dev. Over-/under-valued
P/E Forward P/E 18.2x 16.0x 0.7
CAPE Shiller’s P/E 32.4 26.4 1.0
Div. Yield Dividend Yield 2.0% 2.0% 0.1
P/B Price to book 3.1 2.9 0.2
P/CF Price to cash flow 12.8 10.7 1.1
EY Spread EY minus Baa yield 1.3% -0.2% -0.8
‘18

19
Appendix
• Portfolio Data
• Disclosure
20
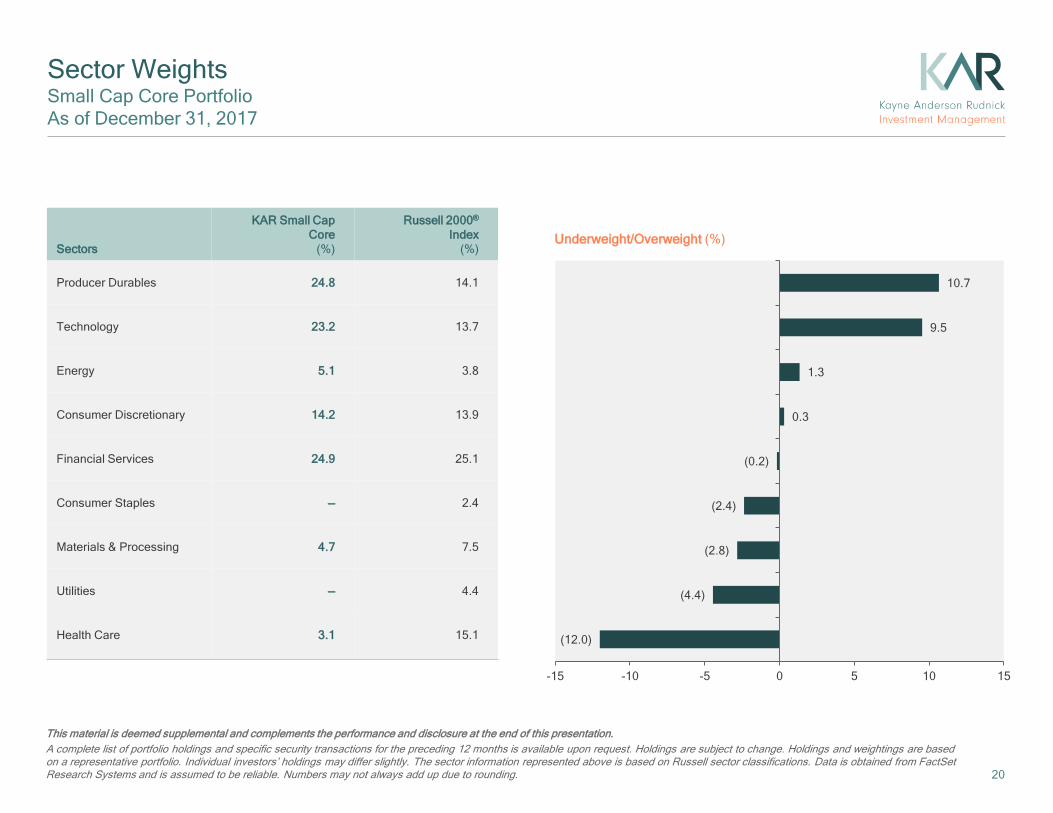
This material is deemed supplemental and complements the performance and disclosure at the end of this presentation. A complete list of portfolio holdings and specific security transactions for the preceding 12 months is available upon request. Holdings are subject to change. Holdings and weightings are based on a representative portfolio. Individual investors’ holdings may differ slightly. The sector information represented above is based on Russell sector classifications. Data is obtained from FactSet Research Systems and is assumed to be reliable. Numbers may not always add up due to rounding.
Sector Weights Small Cap Core Portfolio As of December 31, 2017
Underweight/Overweight (%) Sectors
KAR Small Cap Core (%)
Russell 2000®
Index (%)
Producer Durables 24.8 14.1
Technology 23.2 13.7
Energy 5.1 3.8
Consumer Discretionary 14.2 13.9
Financial Services 24.9 25.1
Consumer Staples — 2.4
Materials & Processing 4.7 7.5
Utilities — 4.4
Health Care 3.1 15.1 (12.0)
(4.4)
(2.8)
(2.4)
(0.2)
0.3
1.3
9.5
10.7
-15 -10 -5 0 5 10 15
21
This material is deemed supplemental and complements the performance and disclosure at the end of this presentation. A complete list of portfolio holdings and specific security transactions for the preceding 12 months is available upon request. Holdings are subject to change. Holdings and weightings are based on a representative portfolio. Individual investors’ holdings may differ slightly. The sector information represented above is based on Russell sector classifications. Data is obtained from FactSet Research Systems and is assumed to be reliable. Numbers may not always add up due to rounding.
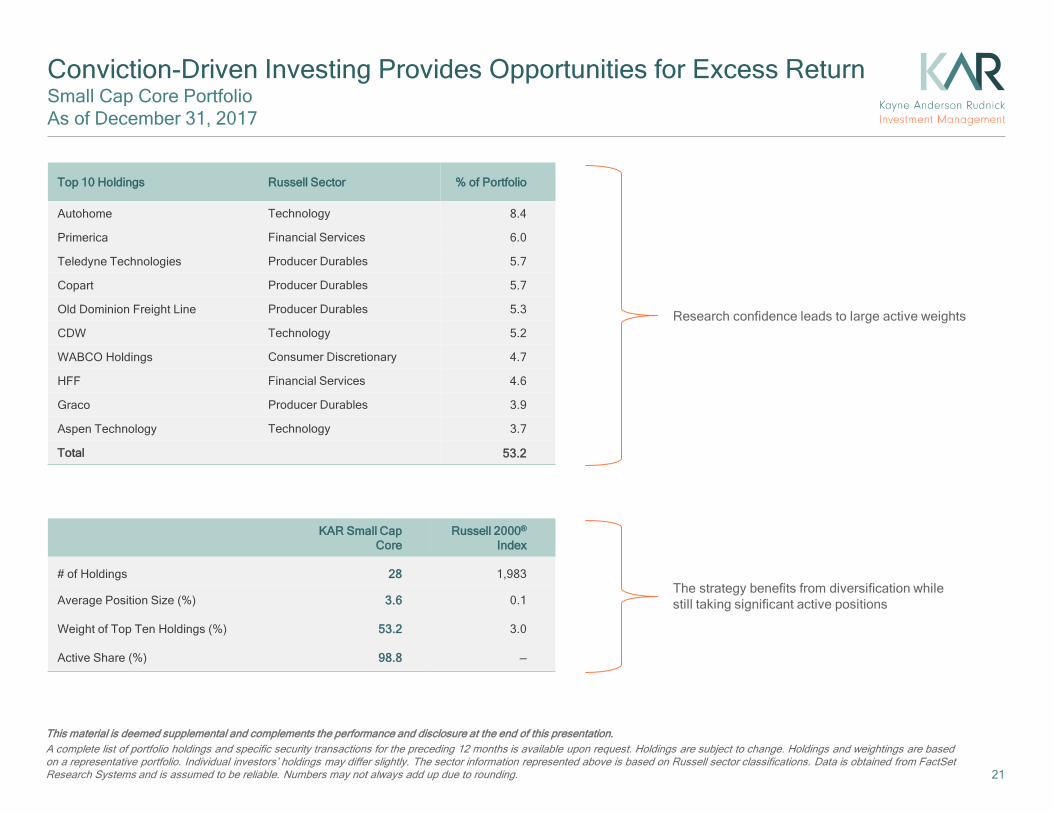
Conviction-Driven Investing Provides Opportunities for Excess Return Small Cap Core Portfolio As of December 31, 2017
Top 10 Holdings Russell Sector % of Portfolio
Autohome Technology 8.4
Primerica Financial Services 6.0
Teledyne Technologies Producer Durables 5.7
Copart Producer Durables 5.7
Old Dominion Freight Line Producer Durables 5.3
CDW Technology 5.2
WABCO Holdings Consumer Discretionary 4.7
HFF Financial Services 4.6
Graco Producer Durables 3.9
Aspen Technology Technology 3.7
Total 53.2
KAR Small Cap Core
Russell 2000® Index
# of Holdings 28 1,983
Average Position Size (%) 3.6 0.1
Weight of Top Ten Holdings (%) 53.2 3.0
Active Share (%) 98.8 —
Research confidence leads to large active weights
The strategy benefits from diversification while still taking significant active positions
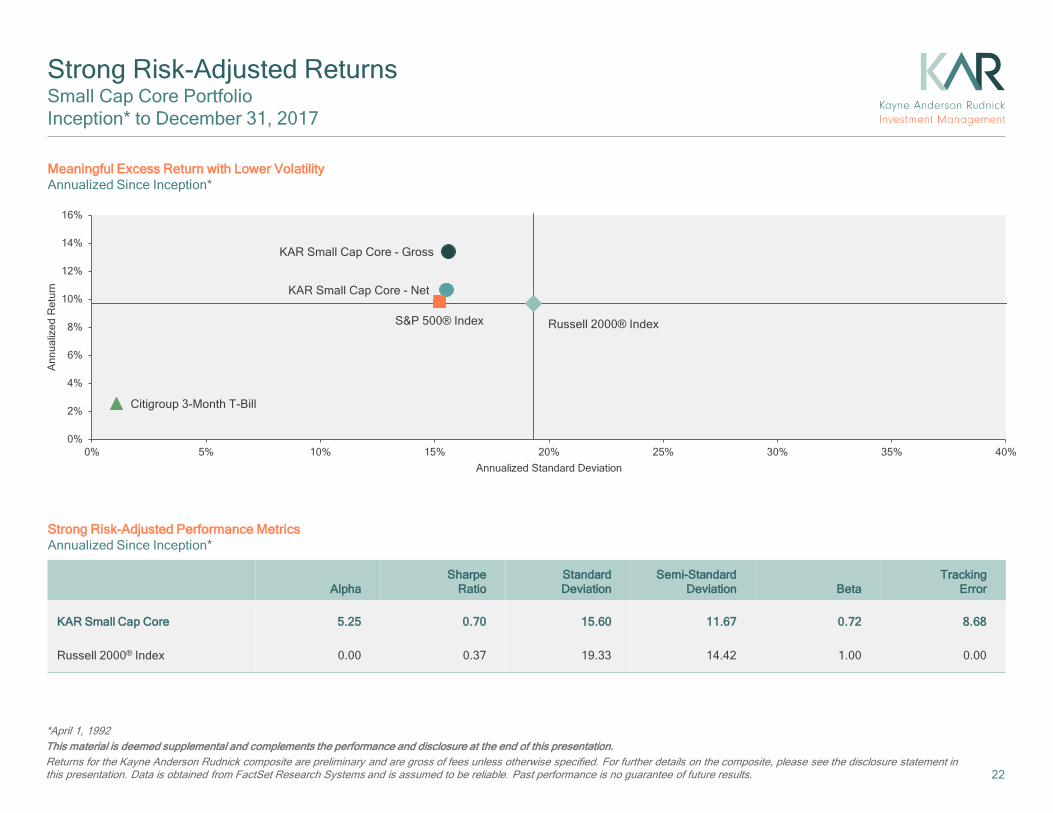
KAR Small Cap Core - Net
KAR Small Cap Core - Gross
S&P 500® Index
Citigroup 3-Month T-Bill
Russell 2000® Index
0%
2%
4%
6%
8%
10%
12%
14%
16%
0% 5% 10% 15% 20% 25% 30% 35% 40%
Ann
ualiz
ed R
etur
n
Annualized Standard Deviation
Alpha Sharpe
Ratio Standard Deviation
Semi-Standard Deviation Beta
Tracking Error
KAR Small Cap Core 5.25 0.70 15.60 11.67 0.72 8.68
Russell 2000® Index 0.00 0.37 19.33 14.42 1.00 0.00
22
*April 1, 1992 This material is deemed supplemental and complements the performance and disclosure at the end of this presentation. Returns for the Kayne Anderson Rudnick composite are preliminary and are gross of fees unless otherwise specified. For further details on the composite, please see the disclosure statement in this presentation. Data is obtained from FactSet Research Systems and is assumed to be reliable. Past performance is no guarantee of future results.
Strong Risk-Adjusted Returns Small Cap Core Portfolio Inception* to December 31, 2017 Meaningful Excess Return with Lower Volatility Annualized Since Inception*
Strong Risk-Adjusted Performance Metrics Annualized Since Inception*
This material is deemed supplemental and complements the performance and disclosure at the end of this presentation. The Small Cap Core Universe includes all managers categorized in the small cap core asset class by eVestment. Returns for the Kayne Anderson Rudnick composite are preliminary and are gross of fees unless otherwise specified. For further details on the composite, please see the disclosure statement in this presentation. Data is obtained from FactSet Research Systems and is assumed to be reliable. Past performance is no guarantee of future results. Management fees are described in Part II of our form ADV, which is available upon request. Gross annual returns will be reduced by investment management fees and other expenses that may be incurred in the management of the account. Net annual returns have been calculated after the deduction of an assumed maximum annual fee of 3%. The effect of fees on performance would grow at a compounded rate. Over a five-year period, if a $100,000 portfolio had an annual return of 10%, it would grow to $161,051. The net compounded effect of a 3% annual investment management fee would total $20,796 and result in a portfolio value of $140,255.
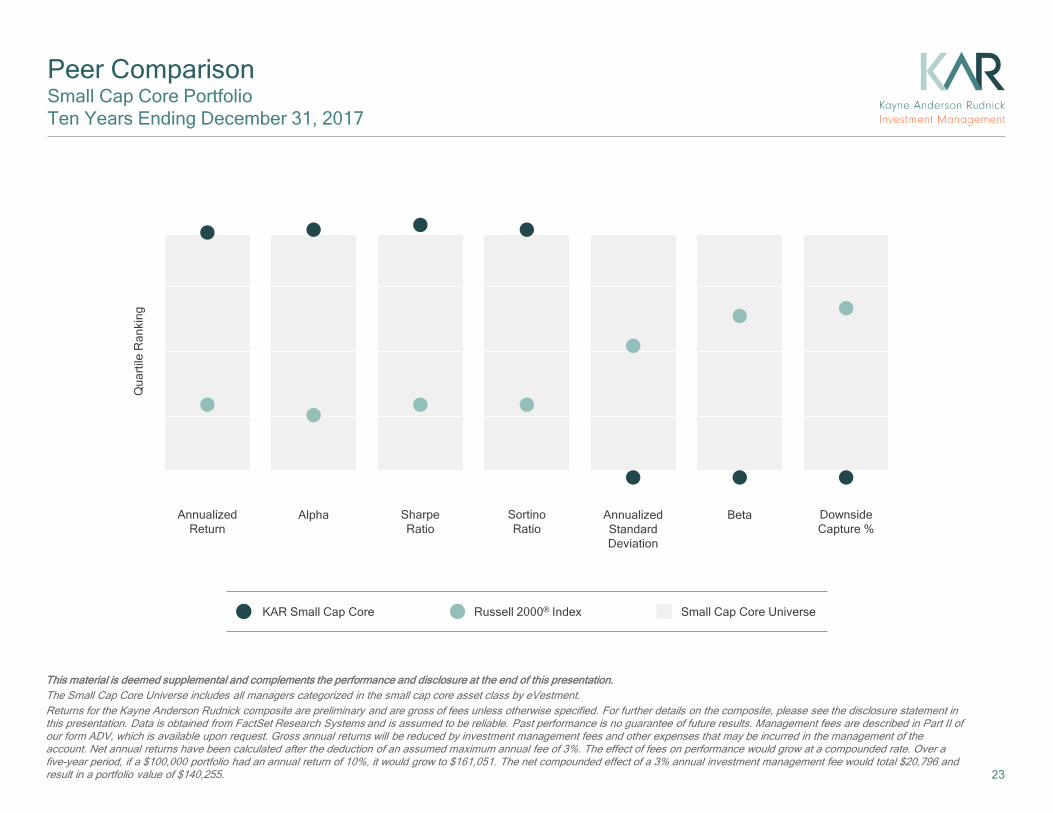
Peer Comparison Small Cap Core Portfolio Ten Years Ending December 31, 2017
Small Cap Core Universe Russell 2000® Index KAR Small Cap Core
Annualized Return
Alpha Sharpe Ratio
Sortino Ratio
Annualized Standard Deviation
Beta Downside Capture %
Qua
rtile
Ran
king
23

Periods Ending 12/31
Gross (%)
Net (%)
Index (%)
Excess Return (bps)
2017 36.04 32.12 14.65 2140
2016 18.55 15.09 21.31 (275)
2015 2.09 0.51 (4.41) 650
2014 7.31 5.57 4.89 241
2013 30.89 28.76 38.82 (793)
2012 13.75 11.80 16.35 (260)
2011 9.64 7.75 (4.18) 1382
2010 24.83 22.56 26.85 (203)
2009 31.80 29.72 27.17 463
2008 (28.15) (29.36) (33.79) 563
2007 3.25 1.71 (1.57) 481
2006 13.46 11.87 18.37 (491)
2005 7.87 4.63 4.55 331
2004 23.07 19.42 18.33 474
2003 35.02 31.19 47.25 (1223)
2002 (13.73) (16.34) (20.48) 675
2001 6.82 3.74 2.49 434
2000 20.98 17.42 (3.02) 2400
1999 7.02 3.93 21.26 (1423)
1998 20.98 17.42 (2.55) 2353
1997 21.00 17.45 22.36 (136)
1996 26.98 23.22 16.49 1049
1995 18.57 15.07 28.45 (988)
1994 2.75 (0.26) (1.82) 457
1993 20.00 16.54 18.88 112
1992† 9.65 7.25 10.16 (50) 24
*April 1, 1992 †Performance calculations are for the nine months ended December 31, 1992. This material is deemed supplemental and complements the performance and disclosure at the end of this presentation. Returns for the Kayne Anderson Rudnick composite are preliminary. All periods less than one year are total returns and are not annualized. For further details on the composite, please see the disclosure statement in this presentation. Data is obtained from FactSet Research Systems and is assumed to be reliable. Numbers may not always add up due to rounding. Past performance is no guarantee of future results. IMPORTANT RISK CONSIDERATIONS: Equity Securities: The market price of equity securities may be adversely affected by financial market, industry, or issuer specific events. Focus on a particular style or on small or medium-sized companies may enhance that risk. Limited Number of Investments: Because the fund has a limited number of securities, it may be more susceptible to factors adversely affecting its securities than a less concentrated fund. Industry/Sector Concentration: A fund that focuses its investments in a particular industry or sector will be more sensitive to conditions that affect that industry or sector than a non-concentrated fund.
Returns Small Cap Core Portfolio
Annualized Performance Calendar Year Performance
Periods Ending 12/31/17
Gross (%)
Net (%)
Index (%)
Excess Return
(bps)
Fourth Quarter 10.55 9.75 3.34 721
1 Year 36.04 32.12 14.65 2140
3 Years 18.08 15.19 9.96 813
5 Years 18.26 15.74 14.12 413
7 Years 16.34 14.00 11.62 472
10 Years 13.05 10.89 8.71 434
Since Inception* 13.39 10.65 9.66 373
25
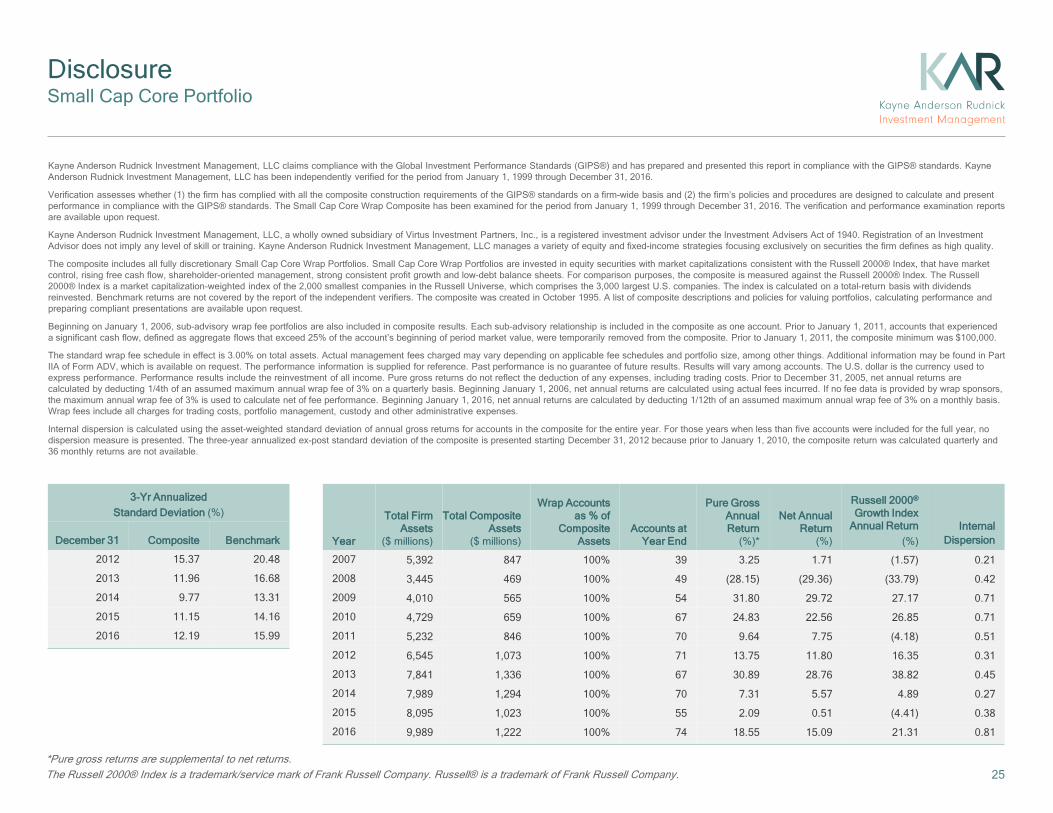
Disclosure Small Cap Core Portfolio
Kayne Anderson Rudnick Investment Management, LLC claims compliance with the Global Investment Performance Standards (GIPS®) and has prepared and presented this report in compliance with the GIPS® standards. Kayne Anderson Rudnick Investment Management, LLC has been independently verified for the period from January 1, 1999 through December 31, 2016.
Verification assesses whether (1) the firm has complied with all the composite construction requirements of the GIPS® standards on a firm-wide basis and (2) the firm’s policies and procedures are designed to calculate and present performance in compliance with the GIPS® standards. The Small Cap Core Wrap Composite has been examined for the period from January 1, 1999 through December 31, 2016. The verification and performance examination reports are available upon request.
Kayne Anderson Rudnick Investment Management, LLC, a wholly owned subsidiary of Virtus Investment Partners, Inc., is a registered investment advisor under the Investment Advisers Act of 1940. Registration of an Investment Advisor does not imply any level of skill or training. Kayne Anderson Rudnick Investment Management, LLC manages a variety of equity and fixed-income strategies focusing exclusively on securities the firm defines as high quality.
The composite includes all fully discretionary Small Cap Core Wrap Portfolios. Small Cap Core Wrap Portfolios are invested in equity securities with market capitalizations consistent with the Russell 2000® Index, that have market control, rising free cash flow, shareholder-oriented management, strong consistent profit growth and low-debt balance sheets. For comparison purposes, the composite is measured against the Russell 2000® Index. The Russell 2000® Index is a market capitalization-weighted index of the 2,000 smallest companies in the Russell Universe, which comprises the 3,000 largest U.S. companies. The index is calculated on a total-return basis with dividends reinvested. Benchmark returns are not covered by the report of the independent verifiers. The composite was created in October 1995. A list of composite descriptions and policies for valuing portfolios, calculating performance and preparing compliant presentations are available upon request.
Beginning on January 1, 2006, sub-advisory wrap fee portfolios are also included in composite results. Each sub-advisory relationship is included in the composite as one account. Prior to January 1, 2011, accounts that experienced a significant cash flow, defined as aggregate flows that exceed 25% of the account’s beginning of period market value, were temporarily removed from the composite. Prior to January 1, 2011, the composite minimum was $100,000.
The standard wrap fee schedule in effect is 3.00% on total assets. Actual management fees charged may vary depending on applicable fee schedules and portfolio size, among other things. Additional information may be found in Part IIA of Form ADV, which is available on request. The performance information is supplied for reference. Past performance is no guarantee of future results. Results will vary among accounts. The U.S. dollar is the currency used to express performance. Performance results include the reinvestment of all income. Pure gross returns do not reflect the deduction of any expenses, including trading costs. Prior to December 31, 2005, net annual returns are calculated by deducting 1/4th of an assumed maximum annual wrap fee of 3% on a quarterly basis. Beginning January 1, 2006, net annual returns are calculated using actual fees incurred. If no fee data is provided by wrap sponsors, the maximum annual wrap fee of 3% is used to calculate net of fee performance. Beginning January 1, 2016, net annual returns are calculated by deducting 1/12th of an assumed maximum annual wrap fee of 3% on a monthly basis. Wrap fees include all charges for trading costs, portfolio management, custody and other administrative expenses.
Internal dispersion is calculated using the asset-weighted standard deviation of annual gross returns for accounts in the composite for the entire year. For those years when less than five accounts were included for the full year, no dispersion measure is presented. The three-year annualized ex-post standard deviation of the composite is presented starting December 31, 2012 because prior to January 1, 2010, the composite return was calculated quarterly and 36 monthly returns are not available.
*Pure gross returns are supplemental to net returns. The Russell 2000® Index is a trademark/service mark of Frank Russell Company. Russell® is a trademark of Frank Russell Company.
Year
Total Firm Assets
($ millions)
Total Composite Assets
($ millions)
Wrap Accounts as % of
Composite Assets
Accounts at Year End
Pure Gross Annual Return
(%)*
Net Annual Return
(%)
Russell 2000® Growth Index
Annual Return (%)
Internal Dispersion
2007 5,392 847 100% 39 3.25 1.71 (1.57) 0.21
2008 3,445 469 100% 49 (28.15) (29.36) (33.79) 0.42
2009 4,010 565 100% 54 31.80 29.72 27.17 0.71
2010 4,729 659 100% 67 24.83 22.56 26.85 0.71
2011 5,232 846 100% 70 9.64 7.75 (4.18) 0.51
2012 6,545 1,073 100% 71 13.75 11.80 16.35 0.31
2013 7,841 1,336 100% 67 30.89 28.76 38.82 0.45
2014 7,989 1,294 100% 70 7.31 5.57 4.89 0.27
2015 8,095 1,023 100% 55 2.09 0.51 (4.41) 0.38
2016 9,989 1,222 100% 74 18.55 15.09 21.31 0.81
3-Yr Annualized Standard Deviation (%)
December 31 Composite Benchmark
2012 15.37 20.48
2013 11.96 16.68
2014 9.77 13.31
2015 11.15 14.16
2016 12.19 15.99