small business financing: corporate manufacturers · small business financing of the survey, in...
TRANSCRIPT

Small Business Financing:Corporate Manufacturers
IN 1957 the Federal Reserve System,with the encouragement of four congres-sional committees, undertook a comprehen-sive study of the financing problems of smallbusiness. The first two parts of this studyincluded analyses of existing data and ma-terials on small business financing and sur-veys of lender practices and standards in thisfield. These were submitted to the congres-sional committees in the spring of 1958.1
The third part was to consist of direct sur-veys of businessmen to obtain informationon their financing experience.
This article summarizes the results of thefirst of two such surveys. It was recog-nized from the outset that these surveyswould need to be experimental, for onlylimited efforts had been made to collect suchdata theretofore. To develop effective tech-niques for collecting data in this relativelyuncharted area, the Federal Reserve Systemenlisted the cooperation of the Bureau ofthe Census.
Jointly, the staffs of these two agenciesconducted a number of pilot surveys to testdifferent types of questionnaires, different
1 Financing Small Business, Report by the FederalReserve System to the Committees on Banking andCurrency and the Select Committees on Small Busi-ness, U. S. Congress, Washington, 1958.
NOTE.—The Board's surveys of business financingexperience have been under the direction of Daniel H.Brill, Associate Adviser in the Board's Division ofResearch and Statistics. Eleanor J. Stockwell andJames C. Byrnes of the Board's staff were responsiblefor a major share of survey planning, data processing,and analysis of the results. The Bureau of the Censusconducted the surveys for the Board, under the direc-tion of Frank A. Cirillo, Chief, Program Researchand Coordination Branch, Business Division. Directsupervision of Census activities on the project wasprovided by Robert W. Schiedel.
methods of collecting data, and questions ofvarying detail with respect to business fi-nancing practice. These pilot surveyscovered large and medium-size businessesas well as small businesses, unincorporatedas well as incorporated firms, and manufac-turers as well as wholesalers and retailers.Some test surveys were conducted by mail,others by personal interview.
By early 1959 the feasibility of certainspecific approaches had been demonstrated,and the Board of Governors authorized thestaff to proceed with full-scale surveys. Thefirst, covering corporate manufacturers, wasbegun in the summer of 1959, and informa-tion was collected during the remainder ofthe year. The Technical Note at the end ofthis article describes the sampling and col-lection techniques used in the first survey.A second survey, covering unincorporatedretailers, was conducted in the summer of1960, and the results of this survey are nowbeing tabulated.
SCOPE OF SURVEY
The survey of manufacturing corporationswas designed to obtain information on theefforts made by these companies to obtainexternal financing during their last fiscal yearand also on the financial position of eachrespondent, i.e., on the relative profitabilityof the enterprise and on its financial struc-ture as shown by its balance sheet, in orderto permit evaluation of the influence of thesefactors on the success of financing efforts.Corporations of all sizes and in all lines ofmanufacturing were included in the scope
8
Federal Reserve Bulletin: January 1961

SMALL BUSINESS FINANCING
of the survey, in order to permit comparisonof financing experience both by size of com-pany and by industry. The sample excludedcompanies in business for less than one fullyear at the time of the survey. It also ex-cluded companies that were subsidiaries ofother manufacturing corporations.
Of the 3,600 corporate names drawn forthe sample, approximately 3,000 proved tobe within the scope of survey definitions.About 2,540 of these companies providedall or most of the information requested.The 460 companies that did not respondrepresented about 18 per cent of all "inscope" companies. Most of these nonre-spondents were smaller companies.2
Because of the limited size of the sample,companies in the survey could be classi-fied into only four broad industry groupswithin the corporate manufacturing sector.The groupings distinguish producers of dur-able goods from those producing nondurablegoods, and within each of these categories,industries generally requiring heavy capital-ization per unit of output from those withlighter capitalization. (Hereafter thesegroupings are referred to as "heavy" or"light" durable or nondurable.) A detailedlist of the industries included in each of thefour categories is given in the TechnicalNote.
Businesses were classified in three sizegroups—small, medium, and large. The sizeof each company was measured by itstotal assets as reported on the completedquestionnaire. Size groupings used in theanalysis vary by industry, i.e., a small com-pany in one industry group might have assets
2 All proportions of companies "within surveyscope" shown in the text and tables represent per-centages of the total number of manufacturing cor-porations falling within survey specifications, whetheror not they responded to the questionnaire. Non-response is treated in the tables as a separate classifica-tion.
equivalent to those of a company classifiedas medium-size in another industry of gen-erally lower capitalization. Thus, a producerof machine tools with assets of almost $5million was classified as small, while a pro-ducer of lumber products with the same totalassets was classified as being of medium size.The specific size groupings within broad in-dustry groups also are given in the Tech-nical Note.
It is to be emphasized that the survey at-tempted to study fund-raising operationsfrom the viewpoint of the prospective bor-rower rather than from that of prospectivecreditors or equity investors. Respondentswere asked to give their own opinions as totheir needs for external financing and toevaluate their efforts to obtain financing interms of their own satisfaction with theresults. No attempt was made to assess themerits of reported needs for funds or to ob-tain lenders' perspective on the financing ef-forts reported.
In tabulating the responses, dissatisfac-tion with financing experience was definedvery broadly to include: (a) companiesmaking efforts to obtain funds but gettingnone; (b) those obtaining funds but beingdissatisfied with the amount obtained, orwith the interest rate charged, or with anyother of the financing terms; (c) those need-ing funds but making no efforts to get themeither because they felt that efforts would notbe successful or for other reasons.
The limited sample did not permit statisti-cally valid cross-classifications of all the ele-ments that analysts might wish to examine.Moreover, no survey of this type can assessthe significance of certain factors that areoften assumed to bear importantly on thesuccess of financing efforts, such as lenders'evaluations of management capabilities orof product potentials. Despite these limita-
Federal Reserve Bulletin: January 1961

10 FEDERAL RESERVE BULLETIN • JANUARY 1961
tions, the survey does permit the importanceof many criteria of financing success to bequantified and, because of its scope and de-tail, it provides more insight into the financ-ing process than has been available before.
FINANCING EXPERIENCE
Respondents were asked to report theirfinancing needs and financing experienceduring their last full fiscal year. For mostrespondents this was the calendar year 1958,a year that included first recession andthen vigorous recovery, with credit suppliesample earlier in the year, but with creditdemands generally rising after midyear. InAugust of that year, Congress adopted anew Government-sponsored program foraiding small businesses in need of long-termfinancing, but none of the small business in-vestment companies authorized by the newlegislation were in operation in the periodcovered by the survey.
Type of financing. Financing needs andsuccess in obtaining funds differed widelyamong the three major types of financingcovered in the survey—short-term credit,long-term credit (including intermediate-term loans), and equity capital.
1. A large number of respondents re-
TABLE 1
FINANCING EXPERIENCE OF MANUFACTURINGCORPORATIONS
[Percentage of all companies in survey scope]
Financing experience
Total in scope.
Total responseNo need for fundsNeeded funds
Needs met satisfactorilyExperience not satisfactory
No financing efforts madeFinancing efforts unsatisfactory.
Memo: Efforts made to obtain financing.. 33.8 9.6 3.2
Short-termcredit
100.0
82.044.137.927.310.64.16.5
Long-termcredit
100.081.964.317.76.3
11.38.13.2
Equitycapital
100.082.068.313.61.8
11.810.41.4
ported no need for any external financingduring the year to which the survey related.As indicated in Table 1, more than two-fifths of the companies within the scope ofthe survey reported no need for short-termcredit (other than trade credit) and abouttwo-thirds reported no need for long-termcredit or for additional equity capital.3
FINANCING NEEDS, BY TYPE OF FUNDSPERCENTAGE OF ALL MANUFACTURING CORPORATIONS
SHORT-TERMCREDIT
LONG-TERMCREDIT
EQUITYCAPITAL
NO RESPONSE
NOTE.—Details may not add to totals because of rounding.
2. Three-eighths of the companies re-ported a need for additional short-termcredit, one-sixth for long-term credit, andone-seventh for additional equity capital.
3. Among manufacturing corporationsthat reported a need for external financing,the extent to which needs were met on asatisfactory basis varied widely from oneform of financing to another. Of the 38per cent that needed short-term credit,nearly three-fourths were able to obtain such
3 Information available from sources other than thesurvey, on the profitability and credit rating of non-respondents, suggests that they were at least as profit-able as those that responded and that their creditratings were, on the average, higher than those ofrespondents of the same size and industry classifica-tion. The inference might be drawn, therefore, thatmore nonrespondents probably would fall into thegroup that had no need for external financing or wereable to obtain funds on a satisfactory basis, thaninto the dissatisfied group.
Federal Reserve Bulletin: January 1961
SMALL BUSINESS FINANCING 11
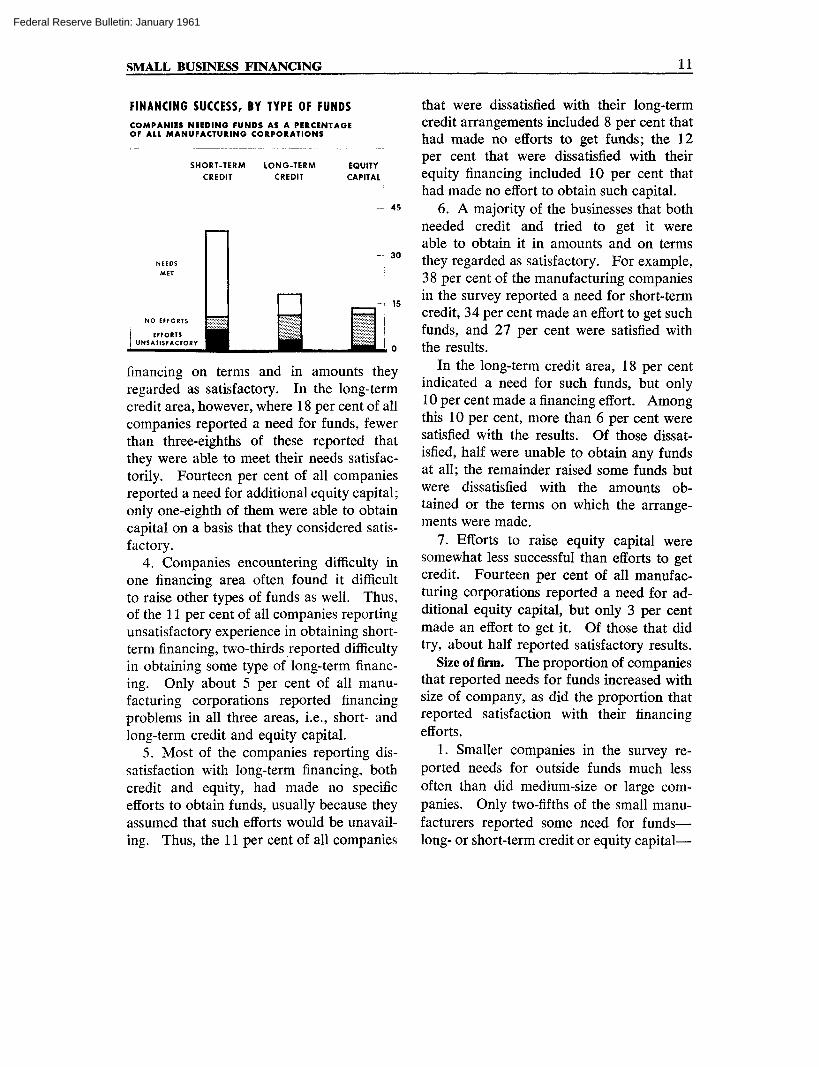
FINANCING SUCCESS, BY TYPE OF FUNDSCOMPANIES NEEDING FUNDS AS A PERCENTAGEOF ALL MANUFACTURING CORPORATIONS
45
30
financing on terms and in amounts theyregarded as satisfactory. In the long-termcredit area, however, where 18 per cent of allcompanies reported a need for funds, fewerthan three-eighths of these reported thatthey were able to meet their needs satisfac-torily. Fourteen per cent of all companiesreported a need for additional equity capital;only one-eighth of them were able to obtaincapital on a basis that they considered satis-factory.
4. Companies encountering difficulty inone financing area often found it difficultto raise other types of funds as well. Thus,of the 11 per cent of all companies reportingunsatisfactory experience in obtaining short-term financing, two-thirds reported difficultyin obtaining some type of long-term financ-ing. Only about 5 per cent of all manu-facturing corporations reported financingproblems in all three areas, i.e., short- andlong-term credit and equity capital.
5. Most of the companies reporting dis-satisfaction with long-term financing, bothcredit and equity, had made no specificefforts to obtain funds, usually because theyassumed that such efforts would be unavail-ing. Thus, the 11 per cent of all companies
that were dissatisfied with their long-termcredit arrangements included 8 per cent thathad made no efforts to get funds; the 12per cent that were dissatisfied with theirequity financing included 10 per cent thathad made no effort to obtain such capital.
6. A majority of the businesses that bothneeded credit and tried to get it wereable to obtain it in amounts and on termsthey regarded as satisfactory. For example,38 per cent of the manufacturing companiesin the survey reported a need for short-termcredit, 34 per cent made an effort to get suchfunds, and 27 per cent were satisfied withthe results.
In the long-term credit area, 18 per centindicated a need for such funds, but only10 per cent made a financing effort. Amongthis 10 per cent, more than 6 per cent weresatisfied with the results. Of those dissat-isfied, half were unable to obtain any fundsat all; the remainder raised some funds butwere dissatisfied with the amounts ob-tained or the terms on which the arrange-ments were made.
7. Efforts to raise equity capital weresomewhat less successful than efforts to getcredit. Fourteen per cent of all manufac-turing corporations reported a need for ad-ditional equity capital, but only 3 per centmade an effort to get it. Of those that didtry, about half reported satisfactory results.
Size of firm. The proportion of companiesthat reported needs for funds increased withsize of company, as did the proportion thatreported satisfaction with their financingefforts.
1. Smaller companies in the survey re-ported needs for outside funds much lessoften than did medium-size or large com-panies. Only two-fifths of the small manu-facturers reported some need for funds—long- or short-term credit or equity capital—
Federal Reserve Bulletin: January 1961

12 FEDERAL RESERVE BULLETIN • JANUARY 1961
while half of the medium-size and three-quarters of the large companies reported aneed for outside funds, as shown in Table 2.
TABLE 2
FINANCING EXPERIENCE BY SIZE OF COMPANY[Percentage of all manufacturing corporations in each size group]
Financing experience
Total in scope
Total responseNo need for any external financing..Needed some type of external
financingAll needs met satisfactorilySome experience not satisfactory.
Small Medium Large
All types of financing combined
100.0
81.040.2
40.822.718.1
100.0
83.832.3
51.440.311.1
100.0
94.518.4
76.166.79.5
NOTE.—Details may not add to totals because of rounding.
2. Reported needs for short-term creditincreased steadily with increasing size ofbusiness. The proportion of companies re-porting a need for long-term funds, however,was about the same for small and for me-dium-size companies—about one-sixth re-ported a need for long-term credit and aboutone-seventh a need for equity capital.Among large companies, reported needswere much higher, especially for equitycapital, as Table 3 shows.
3. The extent to which financing needswere met satisfactorily varied substantiallyby type of financing needed. Almost three-fourths of the small companies needingshort-term credit were able to obtain suchfunds in amounts and on terms they re-garded as satisfactory. In the long-termcredit area, however, only one-third of thesmall companies needing funds obtainedthem on a satisfactory basis, and only one-tenth of those needing equity capital weresatisfied.
Reflecting in part their readier access to arange of fund sources, medium-size andlarge companies were more often successfulin meeting financing needs than were small
companies, particularly in the long-termcredit and equity capital areas. It should benoted that funds raised through companyplans for selling stock to employees or toemployee benefit and pension funds wereincluded in the survey both as efforts to get
TABLE 3
SIZE OF COMPANY AND TYPE OF FINANCING RELATEDTO FINANCING EXPERIENCE
[Percentage of all manufacturing corporations in each size group]
Financing experience
Total in scope.
Total responseNo need for fundsNeeded funds
Needs met satisfactorilyExperience not satisfactory
No financing efforts made
Total in scope.
Total responseNo need for fundsNeeded funds
Needs met satisfactorilyExperience not satisfactory
No financing efforts made
Total in scope.
Total responseNo need for fundsNeeded funds
Needs met satisfactorilyExperience not satisfactory. ..
No financing efforts made
Small Medium Large
Short-term credit
100.0
81.844.537.326.311.04.3
100.0
83.938.745.239.95.21.2
100.094.545.349.848.3
1.50.5
Long-term credit
100.0
81.764.117.65.9
11.78.4
100.0
84.066.018.011.76.43.6
100.0
94.570.124.420.93.52.0
Equity capital
100.0
81.868.213.51.4
12.210.7
100.0
83.969.914.16.27.96.7
100.094.552.742.336.36.03.0
NOTE.—Details may not add to totals because of rounding.
funds and as satisfied needs. As might beexpected, such methods of raising equitycapital were reported most often by largercompanies, and they accounted for the bulkof the equity financing accomplished by thelarge companies in the sample.
4. Among small businesses, reported dis-satisfaction with long-term financing experi-ence, for both equity capital and credit, re-flected primarily lack of effort to get funds,because respondents assumed their efforts
Federal Reserve Bulletin: January 1961
SMALL BUSINESS FINANCING 13
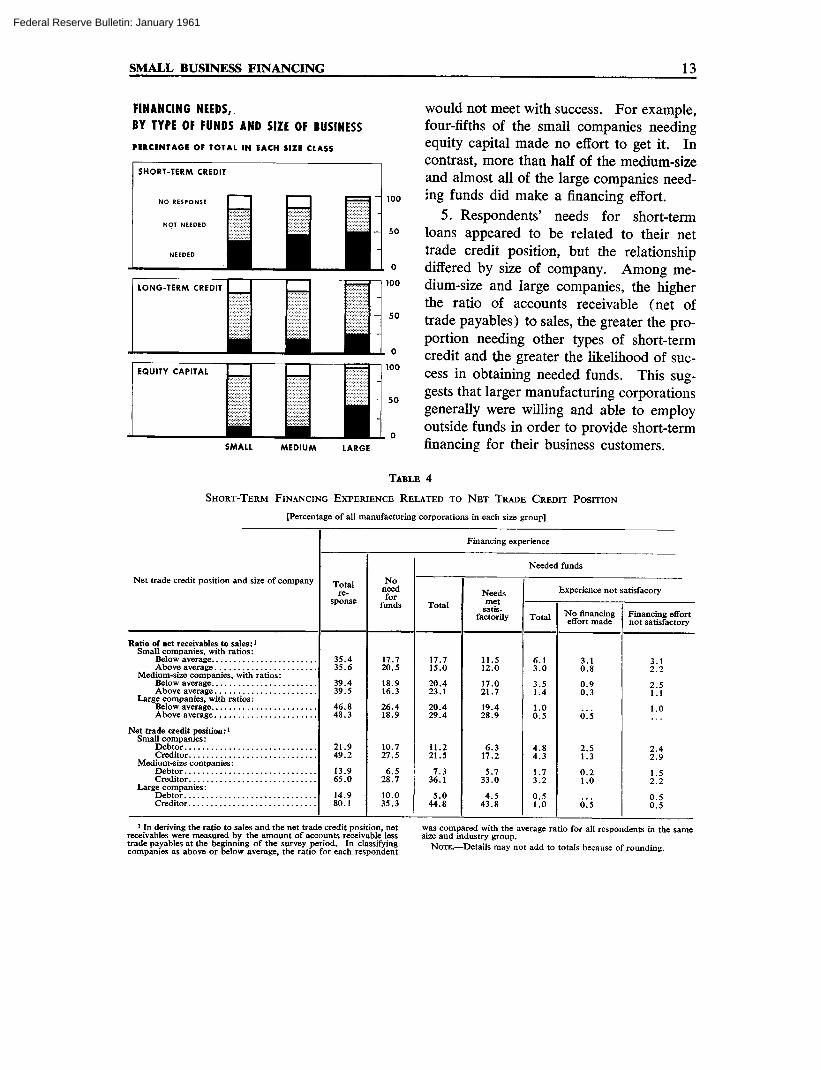
FINANCING NEEDS,BY TYPE OF FUNDS AND SIZE OF BUSINESS
PERCENTAGE OF TOTAL IN EACH SIZE CLASS
SHORT-TERM CREDIT
NO RESPONSE
NOT NEEDED
LONG-TERM CREDIT
EQUITY CAPITAL
100
50
SMALL MEDIUM LARGE
would not meet with success. For example,four-fifths of the small companies needingequity capital made no effort to get it. Incontrast, more than half of the medium-sizeand almost all of the large companies need-ing funds did make a financing effort.
5. Respondents' needs for short-termloans appeared to be related to their nettrade credit position, but the relationshipdiffered by size of company. Among me-dium-size and large companies, the higherthe ratio of accounts receivable (net oftrade payables) to sales, the greater the pro-portion needing other types of short-termcredit and the greater the likelihood of suc-cess in obtaining needed funds. This sug-gests that larger manufacturing corporationsgenerally were willing and able to employoutside funds in order to provide short-termfinancing for their business customers.
TABLE 4
SHORT-TERM FINANCING EXPERIENCE RELATED TO NET TRADE CREDIT POSITION
[Percentage of all manufacturing corporations in each size group]
Net trade credit position and size of company
Financing experience
Totalre-
sponse
Noneedfor
funds
Needed funds
TotalNeedsmet
satis-factorily
Experience not satisfacory
Total No financingeffort made
Financing effortnot satisfactory
Ratio of net receivables to sales:1
Small companies, with ratios:Below averageAbove average
Medium-size companies, with ratios:Below averageAbove average
Large companies, with ratios:Below averageAbove average
Net trade credit position:1Small companies:
DebtorCreditor
Medium-size companies:DebtorCreditor
Large companies:DebtorCreditor
35.435.6
39.439.5
46.848.3
21.949.2
13.965.0
14.980.1
17.720.5
18.916.3
26.418.9
10.727.5
6.528.710.035.3
17.715.0
20.423.1
20.429.4
11.221.5
7.336.1
5.044.8
11.512.0
17.021.719.428.9
6.317.2
5.733.0
4.543.8
6.13.0
3.51.4
1.00.5
4.84.3
1.73.20.51.0
3.10.8
0.90.3
0.5
2.51.3
0.21.0
0.5
3.12.22.51.1
1.0
2.42.9
1.52.20.50.5
1 In deriving the ratio to sales and the net trade credit position, netreceivables were measured by the amount of accounts receivable lesstrade payables at the beginning of the survey period. In classifyingcompanies as above or below average, the ratio for each respondent
was compared with the average ratio for all respondents in the samesize and industry group.
NOTE.—Details may not add to totals because of rounding.
Federal Reserve Bulletin: January 1961

14 FEDERAL RESERVE BULLETIN • JANUARY 1961
In contrast with the pattern among me-dium-size and large companies, needs foroutside funds by small companies declinedas their net trade creditor position increased.As Table 4 shows, the relative need for out-side financing was greater among those smallcompanies that were in a net debtor positionwith respect to trade credit, that is, hadsmaller accounts receivable than tradepayables. Moreover, the net trade debtorsreported the most satisfactory financing ex-perience. More than two-fifths of those thatneeded funds reported an inability to obtainother short-term funds on a satisfactorybasis, compared with one-fifth unsuccessfulamong those in a net creditor position. Thissuggests that small companies unusually de-pendent on trade sources for their short-termfinancing may have been so in part involun-tarily because their credit standing or othercircumstances did not permit them to obtainenough short-term funds from other sources.
FINANCING SUCCESS,BY TYPE OF FUNDS AND SIZE OF BUSINESS
COMPANIES NEEDING FUNDS AS A PERCENTAGEOF TOTAL IN EACH SIZE CLASS
60
40
20
0
SHORT-TERM CREDIT
NEEDS MET 1 1
NO EFFORTS | |
EFFORTS UNSATISFACTORY ^ ^ H • i
LONG-TERM CREDIT
r H Q-
EQUITY CAPITAL
IxvX-XvXvxJ I I
pigxl |=':':'J
_
40
20
0
40
20
0
SMALL MEDIUM LARGE
Industry group. While financing experi-ence differed somewhat among industries,these differences were much less than thevariations in experience by size of company.
1. Needs for outside funds were reportedmore frequently among producers of durablegoods, but producers of nondurable goodstended to report success in financing moreoften. These differences were not verylarge, however. The proportion of com-panies needing some external financingranged from 36 per cent of those in heavilycapitalized nondurable goods industries to46 per cent in the lightly capitalized durablegoods industries, as shown in Table 5. Theproportion reporting successful financing ef-forts ranged from 22 per cent in the heavydurable goods group to 26 per cent in thelight nondurable goods group.
2. Within each of the four broad industrygroups, reported needs for funds rose withrelative size of company. There was morevariation from industry to industry amongthe large companies, however, than amongthe medium-size or small. Comparing thefour industry groups, between 35 and 46per cent of the small companies reported aneed for funds, while among large com-panies the proportion ranged from 56 to 86per cent.
3. Success in financing also increasedwith size of company within each industrygroup, except for the light durable goodsgroup where the proportion of large com-panies reporting success was slightly lessthan for the medium-size. Also, there wasmore variation from industry to industryamong the large companies than amongthe medium-size or small. Comparing thefour industry groups, between one-fifth andone-fourth of the small companies reportedcomplete success in obtaining outside funds,
Federal Reserve Bulletin: January 1961

SMALL BUSINESS FINANCING 15
TABLE 5
FINANCING EXPERIENCE BY BROAD INDUSTRY GROUP
All Types of Financing Combined
[Percentage of all manufacturing corporations in each industry-size group]
Financing experienceDurable
Heavy 1 Light
Nondurable
Heavy1 Light
Durable
Heavy 1 Light
Nondurable
Heavy1 Light
All size groups combined Small
Total in scope . . .
Total responseNo need for any external financingNeeded some type of external financing
All needs met satisfactorilySome experience not satisfactory
Total in scope.
Total responseNo need for any external financingNeeded some type of external financing. . .
All needs met satisfactorilySome experience not satisfactory
100.0
81.238.542.721.721.0
100.0
80.834.646.124.421.7
100.0
82.245.736.423.413.0
100.0
81.141.639.526.013.5
100
8138422021
.0
.0
.82.7.4
100.0
80.434.545.923.122.8
100.0
81.846.435.422.213.2
100.0
81.042.938.124.413.7
Medium Large
100.0 100.0 100.0 100.0
87.732.155.645.79.9
84.936.648.338.010.3
89.030.158.950.58.4
100.0 100.0 100.0 100.0
81.530.451.138.912.1
93.712.880.974.66.4
88.532.655.937.318.6
100.026.373.765.87.9
95.99.6
86.379.46.9
1 See Technical Note for detailed list of industries in group.
while the proportion of large companiessimilarly successful ranged from about two-fifths in the light durable goods group tofour-fifths in the light nondurable goods in-dustry.
4. Industry differences were somewhatmore marked when success in financing wasrelated to need for funds rather than to thetotal of all respondents in each industry.Small companies in durable goods industrieswere relatively less successful in meetingfinancing needs than those in the nondurablegoods group; of the small companies re-porting a need for funds of some type, aboutone-half of the durable goods group weresuccessful in all areas, as compared with al-most two-thirds of the nondurable goodsgroup.
For medium-size companies, variationamong industries was not so large as ineither the small or large classes. Largecompanies showed the greatest variation inthe proportion of those successful to thosereporting a need for funds.
NOTE.—Details may not add to totals because of rounding.
RELATION OF OTHER FACTORS TOFINANCING EXPERIENCE
The information obtained concerning thefinancial position of respondents permittedanalysis of the relation of financing experi-ence to other factors in addition to size andindustry grouping. These factors wereprofitability, balance-sheet structure, age ofcompany, and credit rating.
Profitability. Several measures of profita-bility were derived from the results of thesurvey, including profit-to-sales ratios forthe current reporting year, profit-to-salesratios for the two years preceding the cur-rent reporting year, and the ratio of profitsto net worth. The relationship of financingexperience to profitability appeared to bemuch the same regardless of the measure ofprofitability used.
1. As might be expected, the mostprofitable companies—relative to others inthe same industry-size group—were leastlikely to need external financing, and the
Federal Reserve Bulletin: January 1961

16 FEDERAL RESERVE BULLETIN • JANUARY 1961
least profitable were most likely to report aneed for funds.
2. As also might be expected, success inobtaining funds was related positively torelative profitability. Table 6 indicates that
TABLE 6
FINANCIAL POSITION RELATED TO FINANCING
EXPERIENCE
All Types of Financing[Percentage of all manufacturing companies in each size group]
Financial position and size
Profitability:Small companies, with ratios:
Below averageAbove average
Medium-size companies, with ratios:Below averageAbove average
Large companies, with ratios:Below averageAbove average
Liquidity:Small companies, with ratios:
Below averageAbove average
Medium-size companies, with ratiosBelow averageAbove average
Large companies, with ratios:Below averageAbove average
Owners' equity:Small companies, with ratios:
Below averageAbove average
Medium-size companies, with ratiosBelow averageAbove average
Large companies, with ratios:Below averageAbove average
Neededsome
externalfinanc-
ing
20.214.4
33.615.6
43.333.3
24.812.0
33.716.7
43.333.3
20.913.4
30.419.7
39.337.3
Allneedsmet
satis-factorily
10.09.8
24.714.0
38.828.4
12.68.3
24.615.2
36.330.8
10.99.3
22.517.2
33.333.8
Some ex-perience
notsatis-
factory
10.14.6
8.91.5
4.55.0
12.23.7
9.01.6
7.02.5
10.04.1
8.02.6
6.03.5
NOTE.—Profitability is measured here as the ratio of profits beforetaxes to sales, for the two years preceding the reporting year. Liquidityis the ratio of cash and U. S. Government security holdings to totalcurrent liabilities at the beginning of the reporting year. Owners'equity is the ratio of net worth to total debt at the beginning of thereporting year. In classifying companies as above or below average,the ratios for each respondent were compared with the averageratios for all respondents in the same size and industry group.
Figures shown exclude those respondents that provided informationon financing experience but not on profitability or balance-sheetstructure.
Details may not add to totals because of rounding.
among companies needing some type of ex-ternal financing, those with above-averageprofitability were more likely to be satisfiedwith financing experience than were com-panies whose profitability was below averagefor their industry-size group.
3. Success in financing was more closely
associated with profitability among smallcompanies than it was among medium-sizeand large companies. Of small businessesneeding funds, companies with above-aver-age profitability were successful in obtainingsatisfactory financing half again as often asthose with below-average profitability.
Among medium-size companies, successin financing was about one-fifth more fre-quent for those with above-average profita-bility; among large companies, relativeprofitability did not appear to be closely as-sociated with success or lack of success inmeeting financing needs. Another indica-tion that profitability may not be a primarycriterion of creditworthiness for larger, es-tablished companies is that medium-size andlarge companies with below-average profit-ability (compared with other companies intheir respective industry-size groups) wererelatively more successful in getting neededfunds than were small companies withabove-average profitability.4
4. Although success in financing waspositively associated with relative profita-bility for small companies, as many as halfof those with below-average profitabilitywere able to meet all their financing needssatisfactorily. Even among small com-panies reporting a loss over the two-yearperiod preceding the survey, almost halfwere successful in obtaining the financingthey needed.
Balance-sheet structure. Four ratios werecomputed from the balance sheets submittedby respondents in the survey: liquid assetsto current liabilities, total current assets tototal current liabilities, current liabilities tototal assets, and net worth to total debt.Ratios for each respondent were then clas-
4 It should be noted that the groups with below-aver-age profitability include companies reporting netlosses, and a much larger proportion of these occurredamong small companies.
Federal Reserve Bulletin: January 1961

SMALL BUSINESS FINANCING 17
sified in terms of whether they were aboveor below the median ratio for the size andindustry group to which the respondent be-longed. The premise being tested waswhether higher liquidity or higher owners'equity—relative to other companies ofsimilar size in the same industry—facilitatedexternal financing. The results were substan-tially the same whichever ratio was studied.
1. Generally, companies reporting higherthan average liquidity or higher than aver-age ratios of equity to debt were less likely toreport a need for additional external financ-ing.
2. Companies with greater liquidity orequity that needed external financing weremore likely to be successful in obtainingfunds than companies whose liquidity orequity ratios were below average. Not allof the balance-sheet tests proved equally sig-nificant, however, and the pattern variedsomewhat by type of financing sought.
3. The influence of balance-sheet struc-ture on relative success in meeting financingneeds (the number satisfied as a percentageof the number needing funds) was mostmarked among small businesses. Differ-ences in relative success between above- andbelow-average companies in the medium-sizeand large groups were not as great. More-over, medium-size and large companies withliquidity and equity ratios below the averagefor their respective size groups were success-ful in meeting financing needs relativelymore often than above-average small com-panies.
4. Survey results do not suggest, however,that balance-sheet ratios rigidly determinesuccess in obtaining external funds. Abouthalf of the small companies with below-average liquidity or below-average equityratios were able to meet all of their externalfinancing needs on a satisfactory basis.
Looking at this from another perspective, ofthe small businesses that reported all financ-ing needs had been met satisfactorily, morethan half had liquidity or equity ratios be-low average for their respective industry-sizegroup.
Age. Respondents were asked to reportthe age of the business without regard toprevious changes in ownership or legal formof organization. The median age of re-spondents was 13 years. One-fourth hadbeen in business 7 years or less, and aboutone-tenth had been operating from 1 to 3years. Companies that had not been in busi-ness for at least one full year were not in-cluded in the scope of the survey.
This distribution by age reflects princi-pally that of the small corporations in thesample. Almost all of the medium-size andlarge companies were at least 14 years old.For this reason, analysis of the relationshipbetween age and success in financing is re-stricted to the reported experience of smallcompanies in the survey.
1. Age did not appear to be closely re-lated to needs for short-term credit. Almosthalf of the youngest small businesses andmore than two-fifths of the oldest companiesreported a need for short-term funds, asshown in Table 7.
2. Needs for long-term credit and equitycapital, however, tended to decline moresharply as age of business increased. Therange in the proportion reporting a need forlong-term credit was from about one-fourthof those in the 1- to 3-year group to aboutone-sixth of the companies that were 14years or older.
3. Among small companies needing ex-ternal financing, the proportion successful inobtaining short- and long-term credit tendedto increase with age. The relation betweenage and success in obtaining needed equity
Federal Reserve Bulletin: January 1961

18 FEDERAL RESERVE BULLETIN • JANUARY 1961
TABLE 7
SMALL MANUFACTURING CORPORATIONS: FINANCINGEXPERIENCE BY AGE OF COMPANY
[Percentage of all small companies]
Financing experience
Total response.
Needed funds.Needs met satisfactorily. . .Experience not satisfactory.
Total response
Needed fundsNeeds met satisfactorily. . .Experience not satisfactory.
Total response
Needed funds.Needs met satisfactorily. . .Experience not satisfactory.
1-3years
4-7years
8-13years
14 yearsand ovei
Short-term credit
9.0
4.42.61.9
13.5
6.64.62.0
19.3
9.16.42.7
37.5
16.112.33.8
Long-term credit
8.8
2.30.61.7
13.5
3.60.92.6
19.3
4.31.42.9
37.5
6.92.84.1
Equity capital
Q QO . O
2.10.21.9
13.5
2.60.22.4
19.4
3.50.62.9
37.7
5.20.34.8
NOTE.—Details may not add to totals because of rounding.
capital, however, was too irregular to sup-port any generalization.
4. Many of the younger companies re-porting dissatisfaction with financing hadmade no effort to get the funds needed. Ofthose that were dissatisfied with their short-term credit experience, for example, two-thirds had made no effort to get funds, whileless than one-third of those 14 years andover had failed to try.
5. When comparisons are restricted tosmall companies that both needed fundsand made efforts to get them, the survey re-sults indicate that even the youngest firmswere able to obtain short-term creditabout as frequently as those in the nexttwo age brackets (4-7 and 8-13 years)and not much less often than small compa-nies in the oldest age group. The number ofcompanies needing and trying to get long-term credit and equity capital was too smallto permit intensive analysis of differences
among age groups, but the data do suggestthat age of business is related to experiencewith long-term credit in much the same man-ner as to experience with short-term financ-ing.
Credit rating. Respondents were classi-fied according to the credit rating assignedthem by a nationwide private credit ratingagency. Such ratings are intended as aguide primarily to trade suppliers rather thanto institutional lenders or investors. Never-theless, credit ratings may play a part in de-cisions to make loans, especially when pro-spective borrowers are smaller companies.
Almost all of the large companies wererated by the agency and had been assigneda rating of "high" at the beginning of thesurvey period. Nearly two-thirds of themedium-size respondents were rated, andthese were almost all in the "high" or "good"categories.
Information on credit rating could be ob-tained for only half of the small respondents.Of these, about three-tenths were rated as"high," four-tenths as "good," one-quarteras "fair," and a small number as "limited."Because almost all of the medium-size andlarge companies had relatively high creditratings, an analysis of the effect of differentcredit ratings on financing experience mustnecessarily be limited to the small compa-nies.
1. Rated companies were somewhat moresuccessful in meeting their financing needsthan those that were not rated. About three-fifths of the small, rated companies thatneeded funds reported complete satisfactionwith the results of their financing efforts,compared with half of those that were notrated.
2. Among small companies that wererated, reported needs for external financingwere larger the lower the credit rating. Thus,
Federal Reserve Bulletin: January 1961

SMALL BUSINESS FINANCING 19
two-thirds of the small respondents rated as"fair" reported a need for some type of ex-ternal financing, but only half of those witha "good" rating and only one-third of thosewith a "high" rating reported any financingneeds.
3. Success in obtaining funds was also re-lated to credit rating. Only half of thosewith a "fair" rating reported complete satis-faction in meeting any of their financingneeds, compared with two-thirds amongthose needing funds and rated "good," andthree-fourths in the group receiving the"high" rating.
SOURCES OF FINANCING
Respondents that needed funds and madean effort to obtain them were asked to indi-cate the sources of funds approached andthe sources from which financing was ob-tained. They were not, however, asked toindicate the order in which sources were ap-proached or the number of times any par-ticular type of fund-supplier was approachedwithin the reporting year. The results of thesurvey, therefore, may understate the im-portance of certain financial institutions toparticular industry groups.
1. Small businesses turned primarily tocommercial banks when seeking either short-or long-term credit, and generally they wereable to meet at least a part of their financingneeds from this source. One-third of allsmall corporations in the survey made someeffort to obtain external short-term financ-ing. Thirty-one per cent approached com-mercial banks, 29 per cent obtained funds,and 24 per cent reported satisfaction withthe amount obtained and the terms of theloan.
Ten per cent of the small businesses ac-tively sought longer term credit. Six percent turned to commercial banks for this
SOURCES OF FINANCING,BY TYPE OF FUNDS AND SIZE OF BUSINESSCOMPANIES SEEKING FUNDS AS A PERCENTAGE OFTOTAL IN EACH SIZE CLASS
LONG-TERM CREDIT
BANKS OTHERS
EQUITY CAPITAL
STOCK OTHERS
PURCHASE
PLANS
SMALL
60
40
20
0
MEDIUM LARGE
type of financing, and 4 per cent were ableto obtain credit from this source, 3 per centon a satisfactory basis. More than half of thesmall businesses that made an effort to getlonger term credit were seeking intermediate-term loans with maturities of 1 to 5 years.The importance of commercial banks in sup-plying such credit to small businesses may beexplained in part by the relatively short ma-turity of term loan the small firms were seek-ing. In contrast, the bulk of the largecompanies seeking long-term credit reportedthat they were seeking loans with maturitiesof 10 years or more.
2. Commercial banks were also by farthe most important suppliers of short-termcredit to medium-size and large companiesand the largest source of longer term fundsto the medium-size group. The 14 per centof medium-size companies seeking long-term credit included 9 per cent that ap-proached commercial banks, and most of
Federal Reserve Bulletin: January 1961

20 FEDERAL RESERVE BULLETIN • JANUARY 1961
these received funds. Large companies de-pended more heavily on security marketsand nonbank financial institutions for theirlong-term credit needs. Nevertheless, athird of those that sought long-term creditreported seeking bank term loans.
3. Small manufacturers seeking short-term funds also approached shareholdersand officers of their own companies, tradesuppliers, finance companies, factors, andothers, but the extent of dependence onthese sources was very small compared withtheir dependence on commercial banks. Thiswas generally the case among medium-sizecompanies also. Among large companies,the only significant type of short-term financ-ing other than commercial bank loanswas the sale of commercial paper, and thiswas done principally by large companies inthe food, tobacco, and textile industries.
4. In addition to seeking longer termcredit from commercial banks, small com-panies also sought longer term credit fromtheir own shareholders and officers and, toa minor extent, from other sources. Me-dium-size companies, which also often reliedon commercial banks for longer term financ-ing, turned to nonbank financial institutionssuch as insurance companies and pensionfunds more often than did small companies.The large companies used public securitymarkets as well as nonbank institutions tomeet their long-term credit needs.
5. Very few of either the small or me-dium-size companies sought equity financingduring the year covered by the survey, andthose that did relied almost entirely on em-ployee stock purchase plans or on existingshareholders. The number of instanceswhere other sources of funds were ap-proached by small or medium-size compa-nies seeking equity capital was too small tosupport any conclusions as to adequacy of
the then available financing facilities. Evenamong large companies in the survey, almostall of the equity funds sought and obtainedcame from employee stock purchase or ben-efit plans; most of these plans had been inexistence before the year of the survey, butin a few cases plans were adopted duringthat year.
EFFECTS OF FINANCING DIFFICULTIES
Respondents that reported unsatisfactory fi-nancing experience—including those thatmade no efforts to obtain needed financing—were also asked to indicate whether thishad affected business operations or plansand, if so, what the effects were. The ques-tionnaire specified six types of effects, suchas reduction in current operations, reductionin working capital, or cancellation or reduc-tions in planned spending for plant andequipment.
1. Eighteen per cent of all small busi-nesses, 11 per cent of the medium-size, and9 per cent of the large companies reportedan unsatisfactory financing experience inone or more financing areas. Of these,three-fifths of the small companies andabout half of the medium-size companies in-dicated that failure to meet financing needssatisfactorily had some adverse effect oncurrent business operations or expansionplans. Very few of the large companies re-porting unsatisfactory experience, however,reported that this affected either operationsor plans.
2. Companies that were dissatisfied onlywith their short-term financing experiencereported adverse effects much less oftenthan did those dissatisfied with long-termfinancing.
3. For both small and medium-size com-panies, the most frequently mentioned effectof financing difficulties was a reduction in
Federal Reserve Bulletin: January 1961

SMALL BUSINESS FINANCING 21
the current levels of working capital, i.e., adrawing down of cash, liquidation of inven-tories, or tightening up on customer credit.
4. The effect that small businesses men-tioned next most often was cancellationof plans for expansion or replacement ofplant and other fixed assets. Among me-dium-size companies, the second most fre-quent effect of unsatisfied financing needswas a cutback, rather than a cancellation,in planned expansion of both working capi-tal and fixed assets. Reduction in currentrates of operation was mentioned more oftenby small companies than by medium-sizecompanies.
5. Many respondents indicated that unsat-isfactory financing had resulted in more thanone type of effect on their operations orplans. Multiple effects were more common
in the replies from small businesses thanfrom medium-size companies.
6. In terms of differences by industry, thetwo durable goods industry groups generallyreported a greater proportion of unsatisfac-tory financing experience, and a failure tomeet financing needs was more likely to re-sult in an adjustment in their operations orplans. The pattern of adjustments was gen-erally the same among industries—reduc-tion in working capital, cancellation ofplans to expand plant, and reduction inworking capital expansion plans, in that or-der. However, in the light durable goodsindustries, which have smaller fixed assetrequirements, reductions in planned in-creases in working capital were reportedmore often than reduction or cancellationof plant expansion plans.
TECHNICAL NOTE
This note describes the techniques usedin the survey of corporate manufacturers.
Sample selection. The sample drawn forthe survey consisted of 3,608 manufactur-ing corporations selected by the Bureau ofthe Census from a stratified sample of cor-porate income tax returns for fiscal year1958 that had been filed with the InternalRevenue Service. The universe of such re-turns for corporate manufacturers in thatyear amounted to 128,000.
Companies filing tax returns were classi-fied into four broad groups. First, indus-tries producing durable goods were sepa-rated from those producing nondurablegoods, and, second, within each of theseproduct categories, industries in which capi-talization per dollar of output is relativelylight were separated from those in whichcapitalization is relatively heavy. Each ofthese four broad industry groups was fur-
ther subdivided into three size classes basedon reported assets: small, medium, andlarge. Dollar limits of the size classes werenot the same for all industry groups; a smallcompany in one industry group might be ofan asset size that would warrant its classifi-cation as medium-size in another industry,depending on the general extent of capitali-zation in each industry group. A list of thespecific industries in each broad grouping,and of the asset classes, is given on the fol-lowing page.
From the sample of tax returns stratifiedby industry and size, probability sampleswere selected for each of the "medium" and"small" categories. All companies fallinginto the "large" category in each of the fourindustry groups were included in the surveysample.
Survey response. About 600 of the corpora-tions selected for the sample were not eligi-
Federal Reserve Bulletin: January 1961

22 FEDERAL RESERVE BULLETIN • JANUARY 1961
ble or not available for inclusion in the anal-ysis. Most of these "out of scope" companieswere those that had filed income tax returnsfor fiscal year 1958 but were no longer op-erating by late 1959. The remainder provedto be subsidiaries of other companies, wereno longer in the manufacturing industry, orwere ineligible for other reasons.
Of the 3,000 companies falling within thescope of the survey, about 460 did not re-spond to the questionnaire despite extendedefforts to obtain information from businessesselected for the sample. Each corporationin the sample received the questionnaire inAugust 1959; subsequently, in September1959, the Bureau of the Census sent a certi-fied letter to all nonrespondents. Finally,either a Census field representative or amember of the staff of a Federal ReserveBank contacted each nonrespondent byphone and often in person; most of theselatter contacts were made during Octoberand November 1959, but some were madeas late as January 1960.
Survey reliability. Each company selectedfor the survey sample was assigned a weightaccording to the probability of its being se-lected. Percentages shown in the text arebased on weighted figures and represent es-timates for the corporate manufacturinguniverse. Approximate standard errors ap-plicable to these percentages are given inthe accompanying table.
The chances are about 2 in 3 that esti-mated percentages obtained from the sur-
Percentage
5040 or 6020 or 8010 or 905 or 951 or 99 . . .
Approximate standard error of apercentage when data are classified by:
Size, all industriescombined
1.61.51.3
.9
.7
.3
Both sizeand industry
2.52.42.01.51.1
.5
vey sample differ from the true percentagesfor the corporate manufacturing universe byless than the amounts shown in the table.It will be noted that the absolute size of thestandard error declines as the percentage be-ing estimated departs from 50 per cent, andthat the relative size of the standard error in-creases as the percentage being estimated de-clines. For example, a survey proportion of50 per cent is likely to be within 1.6 per-centage points of the universe proportion,with a probability of two-thirds. A surveyproportion of only 5 per cent for a particularrelationship, however, is likely to be within arange of 0.7 percentage points about the uni-verse value in at least two-thirds of the cases.
The table also indicates that when dataobtained in the survey are classified by onlysize of business with all industries combined,reliability is greater than when the results areclassified by both size and industry.
Survey categories. The following tabula-tion shows the industries and the size group-ings used in the survey.
INDUSTRY GROUPINGS
Industry Size(total assets, in
millions of dollars)Durable goods manufacturers—heavy capitalization
Fabricated metalsMachinery ') [Small Under 5
•> \Medium...5-249[Large 250 and over
Durable goods manufactuers—light capitalization
Furniture and fixtures ]Instruments | f Small Under 1Lumber and wood [ | Medium... 1-49Miscellaneous | [Large 50 and overStone, clay, and glass J
Nondurable goods manufacturers—heavy capitalization
Chemicals.Paper.Petroleum and coal products.
f Small Under 5<! Medium...5-249
Rubber P™uu™- J \Large 250 and over
Nondurable goods manufacturers—light capitalization
Apparel )Food, beverages, and tobacco (Small Under 1Leather \ j Medium... 1-99
(Large 100 and overPrinting and publishing.Textiles and mill products...
Federal Reserve Bulletin: January 1961