small business equity tracker · 2017-07-28 · small business equity tracker 2017 5 stage,...
TRANSCRIPT

SMALL BUSINESS EQUITY TRACKER2017

2 BRITISH BUSINESS BANK
3 FOREWORD 4 EXECUTIVE SUMMARY 7 INTRODUCTION
9 CHAPTER 1: RECENT TRENDS IN SME EQUITY MARKETS
9 1.1 TOTAL INVESTMENT 11 1.2 BUSINESS STAGE 13 1.3 DEAL SIZES 14 1.4 ENGLISH REGIONS AND DEVOLVED ADMINISTRATIONS 20 1.5 GEOGRAPHIC CLUSTERS 23 1.6 INVESTORS 24 1.7 SECTORS 25 1.8 TECHNOLOGY SUB-SECTORS
26 CHAPTER 2: BRITISH BUSINESS BANK ACTIVITY
26 2.1 INTRODUCTION 28 2.2 METHODOLOGY 29 2.3 MARKET SHARE 30 2.4 BUSINESS STAGE32 2.5 SECTOR33 2.6 REGION
34 CHAPTER 3: VC FUNDRAISING
34 3.1 INTRODUCTION 36 3.2 COMPOSITION OF INVESTORS 38 3.3 FUND CHARACTERISTICS
39 CHAPTER 4: PORTFOLIO COMPANY EXITS
39 4.1 INTRODUCTION 40 4.2 SURVIVAL STATUS 43 4.3 INTERNATIONAL COMPARISON OF EXITS46 4.4 INVESTMENT DURATION48 4.5 NUMBER OF FUNDING ROUNDS AND INVESTORS
50 APPENDIX 53 BEAUHURST METHODOLOGY 53 ACKNOWLEDGMENTS
CONTENTS

3SMALL BUSINESS EQUITY TRACKER 2017
Our approach to this objective is three-fold: to increase the overall supply of finance available to small businesses wherever they are in the country; to boost the diversity of the finance on offer to them; and to ensure small businesses are fully aware of, understand, and have confidence in these finance options. All while ensuring taxpayers get good value for money. The Small Business Equity Tracker, now in its third year, helps provide a vital evidence base to inform this mission.
Equity finance is crucial for small businesses looking to grow. The right funding at the right time, coupled with the expertise that outside equity investors can bring, is often the key to unlocking rapid growth for companies wanting to expand, diversify, or enter new markets. A vibrant and healthy equity finance market for smaller businesses is a vital ingredient for a successful UK economy.
Given the private nature of many equity deals, no one source can give the definitive picture of the market. However, uniquely, our Small Business Equity Tracker brings together data from multiple sources to build a comprehensive picture of the UK’s equity finance market for smaller businesses. Underlining the strength of the research, our report contains detailed analysis of venture capital fundraising and exits.
The Bank is committed to improving the small business equity finance markets right across the UK. Our Northern Powerhouse Investment Fund – launched earlier this year with £400m of investment – and the forthcoming launch of the Midlands Engine Investment Fund – with £250m of investment pledged – will both see significant additional finance to help develop equity markets in those regions.
We have also expanded our VC Catalyst Fund programme with the additional £400m of funding pledged in last year’s Autumn Statement. Our Angel Co-Fund and Enterprise Capital Funds programme have invested over £500m in growing business since their creation.
The information contained within this report will be used by the Bank, and has been fed into the government’s Patient Capital Review, to develop understanding of the equity finance market for smaller businesses and, in turn, refine our work in this crucial area of small business finance.
FOREWORD
KEITH MORGAN, CEO OF BRITISH BUSINESS BANK
The British Business Bank, as the nation’s economic development bank, was created to change finance markets so they work more effectively and allow small businesses to prosper across the UK.

A vibrant and healthy market for equity finance is vitally important for ambitious and innovative businesses looking to grow. The provision of funding at the right time, combined with expertise that outside equity investors bring, can fuel rapid growth when companies are starting up, expanding, diversifying or entering new markets.This report, the third British Business Bank Equity Tracker Report examining equity investments in UK smaller businesses, points to a decline in equity investments in 2016, both in volume and value, following substantial growth since 2011. This market softening is part of a wider global slowdown in equity finance, as investors have taken stock of their positions and have become more cautious. This decline is seen across most sectors, although it is worth noting that the technology/ IP-based business sector continues to attract the greatest amount of investment – forming 38% by volume and 49% by value of the entire UK equity market. It is however worth noting that the first half of 2017 saw a significant recovery with record deal values expected.
KEY FINDINGS
1. EVIDENCE OF GEOGRAPHIC VARIATION IN EQUITY MARKETS ACROSS THE UK.
As in previous years, London has the biggest concentration of equity deals with 46% of all deals in 2016 (56% by value). The number of equity deals in London has also grown over the last five years faster than areas outside of London.
These trends are explained in part by the different sectoral composition of the London economy compared to the rest of the UK and clusters of strong deal activity also exist around the country. For example, there are several
areas outside of London within the top twenty-five areas by number of equity deals in 2016 including Edinburgh, Manchester, Bristol and Birmingham, as well as more established equity eco-systems of Oxford and Cambridge.
2. THE NUMBER AND VALUE OF EQUITY DEALS DECLINED IN 2016 FOLLOWING STRONG GROWTH OVER THE PREVIOUS FIVE YEARS.
For first time in five years, the flow of equity finance to smaller businesses declined in 2016 due to a wider slowdown in equity markets worldwide. Compared to 2015, deal numbers are 18% lower and investment amounts are 4% lower. Overall annual deal numbers and investment amounts in 2016 now stand at 1,148 equity deals with an investment value of £3.4bn.
Quarterly numbers confirm investment amounts peaked in the third quarter of 2015, with the number of deals declining throughout 2016.
The decline in deal numbers has been seen across most types of investor, but the decline in percentage terms has been greatest in smaller deal sizes of less than £1m. In contrast, the number of deals greater than £10m in size has increased by 18% suggesting that on average deal sizes have increased in recent years.
It will be important for the Business Bank to monitor the trends in equity finance, and assess the impact this will have on the funding needs of growing businesses.
3. THE GREATEST DECLINE IS SEEN IN THE VENTURE STAGE, WHILE SEED STAGE INVESTMENT AMOUNTS SHOWED STRONG INCREASES DESPITE LOWER DEAL NUMBERS.
For the purposes of this report, analysis of UK equity investments are split into three stages relating to the development stage of the underlying business: seed-
4 BRITISH BUSINESS BANK
EXECUTIVESUMMARY

5SMALL BUSINESS EQUITY TRACKER 2017
stage, venture-stage and growth-stage. After five years of strong growth, all of these stages have seen decreases in deal numbers in 2016, but different trends are seen in the amount invested.
At the seed-stage (predominantly pre-revenue companies) equity deal numbers declined by 9%, but investment amounts showed strong growth and increased by 44% between 2015 and 2016, to reach its highest level. This suggests an increase in the average size of seed-stage deals. There were 569 seed-stage investments in 2016 (£542m). Early stage funding conditions have improved in recent years as demonstrated by the proportion of deals that are at the seed-stage increasing from 39% of all deals in 2011 to 50% in 2016.
At the venture-stage (predominantly young pre-profit companies that are currently expanding rapidly1) annual deal numbers declined by 26% between 2015 and 2016, and the annual investment value declined by 28%. This decline reverses some of the recent gains, as annual deal numbers at the venture-stage had grown year-on-year between 2011 and 2015. There were 372 venture-stage deals in 2016 (£894m).
At the growth-stage (more established companies which are profitable or close to being profitable that are looking to expand), however, annual deal numbers declined by 22% between 2015 and 2016 but the annual amount invested was relatively stable and declined by just 1%. Again, this suggests larger growth-stage deals. There were 207 growth-stage deals in 2016 (£2.0bn). Growth-stage investment in 2016 is still considerably higher than at 2014 levels, when it stood at £1.3bn.
4. DECLINE IN DEAL NUMBERS SEEN ACROSS MOST TYPES OF EQUITY INVESTOR INCLUDING CROWD FUNDING.
Private Equity/ Venture Capital (PE/ VC) investors were the most active type of equity investor in 2016 in terms of announced deals, involved in 405 deals. PE/ VC investors maintain their lead position, but deal numbers have fallen 14% compared to 2015. After strong growth between 2011-2015, deals involving crowdfunding platforms declined by 18% in 2016, its first annual decline, showing signs that the crowdfunding market was also affected by the wider slowdown in equity markets.
Nevertheless, crowdfunding remains an important source of funding for early stage companies forming 25% of all announced equity deals in 2016. Crowdfunding platforms were the most prevalent investor at the seed-stage in 2016
(a similar position to 2015), with crowdfunding platforms involved in 192 deals compared to 132 for PE/VC funds.
5. TECHNOLOGY/ IP-BASED BUSINESS SECTOR CONTINUES TO ATTRACT THE GREATEST AMOUNT OF EQUITY INVESTMENT.
As widely reported the UK technology sector has seen rapid growth in recent years. The number of equity investments in technology/ IP-based businesses decreased in 2016 by 17% (broadly in line with the overall market decrease), nonetheless the amount invested in the sector has reached the highest recorded level of £1.7bn in 2016.2 The technology sector now forms 38% by number and 49% by value of the total equity market.
Software forms the largest technology sub-sector with 287 software deals in 2016 (£810m), followed by life science (55 deals, £622m).
6. DESPITE IMPROVING RETURNS, THE UK HAS A THINNER MARKET OF LIMITED PARTNER (LP) INVESTORS INVESTING IN VC FUNDS COMPARED TO THE US.
Financial returns from investing in VC continue to improve, with recent BVCA data showing the 10 year IRR from investing in VC (for funds with a 2002 vintage onwards) is now 8.8%, up from 7.9% a year ago.3
Despite this, the UK continues to have a relative thin market of LP investors investing in VC. Public pension funds form the largest proportion of LP funding devoted to VC across the US, UK and rest of Europe. However, the US market is more diverse with a greater proportion of funding coming from other types of LP investors including endowments, insurance companies and corporate pensions funds compared to UK and European markets. UK and European markets are more reliant on Government agencies and the EIF for funding, with a lower share of private sector funding coming from other sources. Government agencies form 26% of UK fundraising, and 21% in the rest of Europe.4
Pitchbook data shows that between 2010 and February 2017, the British Business Bank was the second largest LP investor in UK VC funds behind the European Investment Fund (EIF). This shows the Bank is well established in UK VC markets with some of the bank’s programmes like Enterprise Capital Funds (ECF) having operated since 2006.

7. PORTFOLIO COMPANY EXITS ARE IMPORTANT TO THE LONG TERM SUCCESS OF THE VC MARKET. THE UK HAS THE SAME PROPORTION OF IPO EXITS AS THE US, ONCE THE HEALTHCARE SECTOR IS EXCLUDED.
Equity investors only realise financial returns when they exit their portfolio companies, with most successful exits occurring through a trade sale. Only a small percentage of successful exits occur through an Initial Public Offering (IPO) on a public market.
Preqin data shows the UK appears to be less likely to IPO (6% of all successful exits) compared to US (9%) and Europe (10%) but new analysis in this report shows that this may be explained by the UK healthcare sector having a lower proportion of IPO exits compared to other countries. Only 11% of UK healthcare successful exits are an IPO, compared to 24% for US and 27% for Europe, which has a disproportionate effect on the overall UK share of IPO exits. Excluding healthcare shows very small differences between the UK, US and Europe in the proportion of successful exits that are IPOs (5-6%). This suggests the UK has broadly the same likelihood to IPO as the US and Europe.
The UK has the same average investment duration as the US (around 5.3 years), suggesting UK VC investors are not any less patient in exiting deals than their US counterparts, but UK companies IPO at an earlier stage than US companies. There is also evidence to suggest UK companies receive less funding rounds than average compared to US companies. This is being explored further by the Patient Capital Review.
In summary, the report findings demonstrate that the British Business Bank continues to have an important role to play in supporting venture capital and other equity finance across the UK.
ABOUT THIS REPORT
This report provides an in-depth assessment of equity markets for growing businesses using a range of data sources. Our understanding of the equity finance markets for smaller businesses presented in this report will be used by the British Business Bank to help refine our equity programmes and to further support ambitious smaller businesses looking to grow.
We continue to use Beauhurst as a source of data on UK deal activity over time and to examine the characteristics of those deals. Beauhurst has excellent coverage of SME deals, but we also draw in data from other data sources
including Preqin and Pitchbook to provide international comparisons and an insight into portfolio company exits and trends in fund raising. Given the private nature of equity deals, no one data source can capture all deals, but the Beauhurst data used in this report covers the widest range of investor types from crowd funders to Private Equity funds.
ABOUT THE BRITISH BUSINESS BANK
The British Business Bank was established to make finance markets work better for small businesses in the UK at all stages of their development. We will continue to:
• Increase the supply of equity finance available to smaller businesses in areas where the market does not work well, including addressing geographic differences in the availability of equity finance through initiatives such as the Northern Powerhouse Investment Fund
• Create a more diverse finance market for smaller businesses including in the provision of equity finance
• Help ensure better provision of information in the market connecting smaller businesses and finance providers
The British Business Bank continues to maintain and expand our equity interventions, with the Angel Co-Fund and the Enterprise Capital Funds programme, which have invested over £500m in growing business since its inception. Both programmes are working to address structural issues affecting smaller equity deal sizes.
Following the £400m of additional funding received at Autumn Statement 2016 for venture capital, the Bank has also recently expanded its VC Catalyst Fund programme, so that it is better able to tackle the identified later stage VC funding gap and support scale-up companies.
In addition, the British Business Bank has launched the £400m Northern Powerhouse Investment Fund and will soon launch the £250m Midlands Engine Investment Fund in 2017, which will help to deliver more equity finance to those areas.
Tackling supply issues is one part of the Bank’s approach to increasing use of equity finance. Alongside those efforts the Bank is addressing demand side issues through raising awareness amongst small businesses of the options for obtaining equity finance through our Business Finance Guide. This provides information on the range of finance options available to businesses at different stages of their development, providing advice and sources of information to help them grow.
6 BRITISH BUSINESS BANK

7SMALL BUSINESS EQUITY TRACKER 2017
BACKGROUND
The British Business Bank first collaborated with Beauhurst in 2015 to produce an Equity Tracker report, in response to the lack of reliable and comprehensive data on the number and value of equity investments into private UK companies.5 The report looked at equity investments made by the full range of equity investors from large multi-million pound growth investments in established businesses by Private Equity Funds, to smaller investments in early stage companies by angel investors and equity crowdfunding platforms.
This is the third annual equity tracker report. The report will continue to focus on recent trends in SME equity markets using data from Beauhurst, but this year the focus of the report has been widened to also cover trends in portfolio company exits and fund raising using other data sources including Pitchbook and Preqin to gain a wider understanding of current market issues.
BEAUHURST METHODOLOGY
A full description of the data methodology is given in the appendix. Beauhurst’s dataset is built from the bottom-up, identifying each individual business receiving investment. This focus enables the data to be analysed by company stage, sector and location, or according to the type of investor, or the size of investment.
In this report “equity investment” includes any form of external equity finance, excluding transactions on public equity markets, buyouts and family and friends rounds which exclude outside investors.6 The definition therefore captures the activity of business angels, equity crowdfunding, venture capital funds, corporate venturing, and private equity funds.
The investments reported in the Equity Tracker are all publicly announced deals and were all received by businesses defined as small or medium sized, according to the definition set out by the European Commission.7
Deals that are not publicly announced via government regulatory organisations, confirmation with the investee or investor or via a press release or news source are not included in the Equity Tracker analysis. Beauhurst also tracks unannounced deals from changes in share ownership certificates.8 In 2016 it is estimated that only around 40% of equity deals were announced but it is likely that smaller deals and deals at earlier stages, e.g. seed deals are less likely to be announced. Whilst it is desirable to include as many deals as possible in the analysis, less information is available on these unannounced deals. For instance, funding amounts and type of investor are largely missing, which reduces the analysis that can be undertaken. Therefore, this report uses analysis based on announced deals only.
INTRODUCTION

8 BRITISH BUSINESS BANK
There are likely to be differences in the willingness of investors to make their deals publicly known. For instance, angel and private investors could be less likely to formally announce their investments than Venture Capital/ Private Equity funds.
For the purpose of this report, Beauhurst applies an “SME filter” so that only companies that were SMEs at the time of receiving funding are included. The SME filter is applied based on the accounts filed closest to the date of the equity investment. The data published by Beauhurst themselves in their “The Deal” publication9 does not have an SME filter applied, which explains some of differences in the figures quoted between these two publications.
This year’s report builds on the previous Equity Tracker Report published by the British Business Bank in 2016. The has been some minor refinements to the underlying dataset to ensure that this year’s report is the most accurate and complete view of UK equity investment to date. The figures quoted in this report should be considered to supersede those previously quoted.
It is important to acknowledge that a number of other data sources also cover equity investments, including the British Venture Capital Association (BVCA) and Invest Europe. These predominantly measure the investment activities of their members, which are mainly comprised of Private Equity and Venture Capital funds. The data sources therefore have different coverage of investors and are not always consistent with one another. The British Business Bank’s 2016/17 Small Business Finance Markets report provides an overview of the differences between these data sources and offers explanations for any differences observed.10
Whilst the Beauhurst dataset has good coverage of equity deals involving institutional investors, business angels are less likely to be driven to seek publicity on completing investments, and so are largely missing from the investment numbers. The UK Business Angel Association (UKBAA), which covers 18,000 investors mainly investing through 54 groups, confirms the lack of statistics on the annual number of deals undertaken by angel investors in the UK. The British Business Bank is currently working with the UK Business Angel Association to undertake a new survey of angel investors to explore their characteristics. This survey will be published later in the year.
PREQIN OVERVIEW
Preqin is source of data on the alternative assets industry, providing information on private equity, real estate, hedge fund, infrastructure, private debt and natural resources asset classes. Preqin provides information on funds and fundraising, financial performance, institutional investors and deals, both in the UK and abroad, and is widely used by the VC industry.11
PITCHBOOK OVERVIEW
Pitchbook is a global data provider on VC and PE, capturing information on companies, deals & deal metrics, investors, fund & fund performance and Limited Partners amongst other things.
Pitchbook has international coverage of deals, and is widely used in the VC industry. 12 Pitchbook has recently become the official partner to the US National Venture Capital Association, with Pitchbook responsible for collecting and reporting on deal activity.13

9SMALL BUSINESS EQUITY TRACKER 2017
CHAPTER 1:
RECENT TRENDS IN SME EQUITY MARKETS
1.1
TOTAL INVESTMENT
ANNUAL FIGURES
Annual deal numbers and investment amounts in UK SME equity markets have been growing rapidly since 2011, increasing by 205% by number and 179% by investment value between 2011 and 2015. 2016, the latest period covered by this report, marked the first year there has been an overall decline both in deal number and investment amount since the series began. There were 1,148 equity deals (£3.4bn) in 2016, down from 1,408 (£3.6bn) the year before which represents an 18% decline in deal numbers and a 4% decline in investment amount.
As highlighted in the 2016/17 Small Business Finance Markets report14, the decline in the UK seen over 2016 is part of a wider slowdown in Venture Capital affecting US and European markets that started at the end of 2015. Some commentators explain the slowdown as Venture Capital markets ‘normalising’ with investors becoming more cautious about high valuations which have increased in recent years.15 In times of greater economic uncertainty investors concentrate on their existing portfolios and by undertaking larger deals in later stage companies.16 Whilst the scale of the decline is noticeable17, VC funding amounts are still high by historic standards.
Fig 1.1NUMBER AND VALUE OF EQUITY DEALS BY YEARSource: British Business Bank analysis of Beauhurst
Inve
stm
ent v
alue
(£m
)
Num
ber o
f Dea
ls
Number of Deals
0
500
1000
1500
2000
2500
3000
3500
4000
201620152014201320122011300
600
900
1200
1500
Bars represent investment value

10 BRITISH BUSINESS BANK
QUARTERLY FIGURES
Quarterly figures show more fluctuation but show a similar picture to the annual figures. Investment peaked in Q3 2015 with £982m invested, and number of deals declined throughout 2016 from 344 in Q4 2015 to 268 in Q4 2016. Investment amounts fluctuate on a quarterly
basis but there is some recovery in Q4 2016 (£915m), up from £782m the previous quarter (17% increase), and 11% higher than the same quarter in 2015. The British Business Bank will continue to monitor equity market conditions very carefully.
Fig 1.2NUMBER AND VALUE OF EQUITY DEALS BY QUARTERSource: British Business Bank analysis of Beauhurst
Inve
stm
ent v
alue
(£m
)
Num
ber o
f dea
ls
Number of deals
0
200
400
600
800
1000
50
100
150
200
250
300
350
400
Q1 Q2 Q3 Q4
2011 2012 2013 2014 2015 2016

11SMALL BUSINESS EQUITY TRACKER 2017
Whilst there has been a decline in SME equity deals and investment amounts overall in 2016 compared to the previous year, levels are still healthy by historic standards but there are some differences by business stage. The greatest decline seen at the venture-stage for companies looking to scale-up.
• Seed-stage: Overall the amount going to seed-stage investment has been increasing over recent years showing a positive funding environment for early stage companies. There were 569 seed stage deals in 2016 worth £542m, an increase of 44% compared to 2015 levels but showing a 9% decrease in the number of deals. This therefore suggests seed stage deals are getting larger.18
• Venture-stage: out of the three business stages this stage showed the largest decline compared to 2015, with investment amount falling by 28% and the number of deals by 26%. Overall there were 372 venture stage deals in 2016 worth £894m. It is however important to put the latest data in context. Venture-stage investment showed large increases in 2015, so while 2016 reverses much of this increase, it is still higher than 2014 levels (£856m).
• Growth-stage: investment amounts have been very strong in 2015 and 2016, and are considerably higher than earlier time periods. There were 207 growth stage deals in 2016 worth £2.0bn. While representing a relatively small 1% decrease in investment value in 2016, there was a 22% decline by deal number compared to the previous year. This suggests the market was characterised by larger deals sizes.
1.2
BUSINESS STAGE
Fig 1.3NUMBER AND VALUE OF EQUITY DEALS BY BUSINESS STAGESource: British Business Bank analysis of Beauhurst
Inve
stm
ent v
alue
(£m
)
Num
ber o
f dea
ls
0
500
1000
1500
2000
0
100
200
300
400
500
600
700
800
Number of deals2011 2012 2013 2014 2015 2016

12 BRITISH BUSINESS BANK
Charts 1.4 and 1.5 show the business stage as a proportion of the total equity market for number and value of deals. The seed-stage forms the largest proportion of the market by number of deals, forming 50% of all equity deals in 2016. This compares to 39% in 2011, which confirms the positive investment environment for early stage companies that has developed in the UK over the last few years. Venture-stage formed 32% of deals in 2016, down from 37% in the previous year. 18% of all equity deals in 2016 were at the growth-stage, slightly down from the year before.
In terms of investment value the picture is reversed, with growth-stage deals forming the largest percentage of the market (58% in 2016) due to their larger deal sizes. While seed-stage deals formed just 16% of the market in 2016, the long-term trend has been for seed-stage deals to have increased its share of the market over time from 6% in 2011 and 5% in 2012. This is also a positive development, showing equity markets are better able to support early stage companies. Venture-stage formed 26% of the market in 2016, down from 34% in 2015 and 37% in 2014.
Fig 1.4PROPORTION OF EQUITY DEALS BY BUSINESS STAGESource: British Business Bank analysis of Beauhurst
Fig 1.5PROPORTION OF INVESTMENT VALUE BY BUSINESS STAGESource: British Business Bank analysis of Beauhurst
0% 0%
20 20% %
40% 40%
60 60% %
80% 80%
1 100% 00%
201620152014201320122011
Seed Venture Growth Seed Venture Growth
201620152014201320122011

13SMALL BUSINESS EQUITY TRACKER 2017
Average equity deal sizes have increased over the last few years from £2.2m in 2013 to £3.7m in 2016. Deals sizes vary by business stage with seed-stage deals being the smallest (£1.2m on average in 2016) and growth-stage deals being the largest (£12.2m). Average deal sizes in 2016 have increased across all business stages, but there have been large increases in seed-stage deals in 2016, with the average deal size now above £1m for the first time.
The increase in average deal sizes in 2016 reflects changing deal size composition, with a decline in the number of smaller deals but an increase in the number of larger deals. While the number of deals up to £499k and £500k-£999k both fell by 27% compared to 2015, the number of deals greater than £10m increased in 2016 by 18%. Deals between £1m to £1.99m meanwhile fell by 4% over the same period but deals between £2m to £4.99m and £5m to 9.99m fell by 11% and 20% respectively. Taken together this changing profile has therefore contributed to increases in the average deal size overall.
It is important to recognise that most equity deals are relatively small, reflecting the size of the underlying company, but with a large spread of investment size. For instance, 39% of deals (with disclosed investment amounts) are below £500k. However, the largest equity deals can be very large. For instance, the ten largest equity deals in 2016 were equal to £795m and formed 23% of market. This is similar to 2015 when the ten largest deals formed 25% of the market, which is up from 20% in 2014.
1.3
DEAL SIZES
Fig 1.6NUMBER AND VALUE OF EQUITY DEALS BY INVESTMENT CATEGORYSource: British Business Bank analysis of Beauhurst
Source: British Business Bank analysis of Beauhurst
Seed Venture Growth All business stages
2011 £634,000 £2.5m £11.0m £3.7m
2012 £449,000 £2.6m £6.8m £3.0m
2013 £552,000 £1.7m £5.8 £2.2m
2014 £438,000 £2.4m £6.5m £2.4m
2015 £785,000 £2.8m £9.8m £3.2m
2016 £1.2m £3.0m £12.2m £3.7m
AVERAGE DEAL SIZES OVER TIME BY STAGE
0
500
1000
1500
2000
2500
Number of deals2011 2012 2013 2014 2015 2016
0
100
200
300
400
500Up to
£499k£500k to
£999k£1m to £1.99m
£2m to £4.99m
£5m to £9.99m
£10m+ Undisclosed
Inve
stm
ent v
alue
(£m
)
Num
ber o
f dea
ls

14 BRITISH BUSINESS BANK
As noted in the Industrial Strategy,19 there are large geographic disparities in the number and value of equity deals in the UK. London continues to be the English region receiving the greatest amount of equity investment with large increases seen from 2014 onwards. London received the greatest amount of funding (£1.9bn) in 2016, but was not immune from the market slowdown. London experienced a 22% decline in deal numbers but a 1% decline in investment value.
Trends in equity deals outside of London have been more varied, with eight areas experiencing a decline in deals numbers in 2016 but some areas experienced increases (Northern Ireland, Wales and East of England). Year on year changes in investment amounts can be volatile, due to the impact of a small number of large deals.
1.4
ENGLISH REGIONS AND DEVOLVED ADMINISTRATIONS
Fig 1.7NUMBER AND VALUE OF DEALS BY ENGLISH REGION AND DEVOLVED ADMINISTRATIONSource: British Business Bank analysis of Beauhurst
Nort
hern
Irel
and
Nort
h Ea
st
Wal
es
East
Mid
land
s
Wes
t Mid
land
s
Sout
h W
est
Scot
land
York
shire
and
Hum
bers
ide
Nort
h W
est
East
of E
ngla
nd
Sout
h Ea
st
Lond
on
0
100
200
300
400
500
600
700
800
2011 2012 2013 2014 2015 2016
£0
£500
£1,000
£2,000
£1,500
£2,500
Inve
stm
ent v
alue
(£m
)
Num
ber o
f dea
ls
Number of deals

15SMALL BUSINESS EQUITY TRACKER 2017
London received the greatest amount of funding (47% by deal number, 56% by investment amount) in 2016, yet the region accounts for 20% of high growth businesses.20 This may suggest equity deals are underrepresented in other regions relative to the share of high growth businesses. Only a small proportion of high growth businesses are likely to be using equity finance, but for some high growth potential
businesses, equity finance is the only funding source that can enable them to achieve their growth potential. The latest available ONS figures for the population of high growth businesses goes up to 2014. This lags the latest equity figures which are for 2016. The UK regional share of high growth businesses has changed very little over time, and so it is not expected to have changed substantially since 2014.
% of total value of UK % of total number of % of total number of UK high equity investments (2016) UK equity deals (2016) growth businesses (2014)
London 56% 47% 20%
South East 16% 10% 14%
East of England 12% 8% 9%
North West 4% 7% 11%
Yorkshire and Humberside 3% 3% 8%
Scotland 3% 6% 7%
South West 2% 5% 8%
West Midlands 1% 3% 8%
East Midlands 1% 2% 7%
Wales 1% 3% 3%
North East 1% 3% 3%
Northern Ireland 1% 1% 2%
London’s concentration is even greater if Government funds21 are removed from the figures. Most deals (69%) in the North East in 2016 involved Government funds, followed by 52% for Scotland and 40% in Wales. Excluding Government funds from the deals shows London share of all UK deals increasing from 47% to 53% in 2016.
Source: Beauhurst, ONS count of high growth enterprises and BEIS business population estimates
Fig 1.8PROPORTION OF EQUITY DEALS INVOLVING GOVERNMENT FUNDS (2016)Source: British Business Bank analysis of Beauhurst
East
Mid
land
s
Sout
h W
est
Sout
h Ea
st
Lond
on
East
of E
ngla
nd
Nort
hern
Irel
and
York
shire
and
H
umbe
rsid
e
Wes
t Mid
land
s
Nort
h W
est
Wal
es
Scot
land
Nort
hEa
st
80%
70%
60%
50%
40%
30%
20%
10%
0%
PROPORTION OF EQUITY INVESTMENT, DEALS AND HIGH GROWTH BUSINESSES BY REGION AND DEVOLVED ADMINISTRATION
16 BRITISH BUSINESS BANK
UNDERSTANDING GEOGRAPHIC DIFFERENCES IN DETAIL
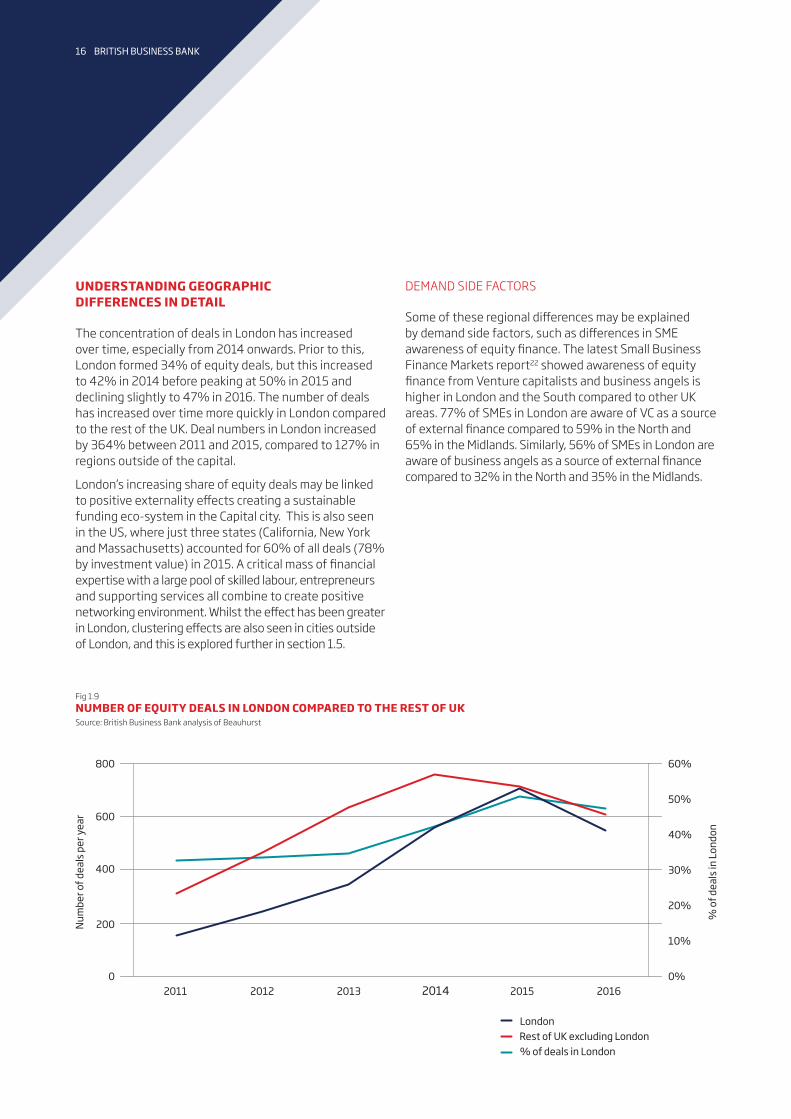
The concentration of deals in London has increased over time, especially from 2014 onwards. Prior to this, London formed 34% of equity deals, but this increased to 42% in 2014 before peaking at 50% in 2015 and declining slightly to 47% in 2016. The number of deals has increased over time more quickly in London compared to the rest of the UK. Deal numbers in London increased by 364% between 2011 and 2015, compared to 127% in regions outside of the capital.
London’s increasing share of equity deals may be linked to positive externality effects creating a sustainable funding eco-system in the Capital city. This is also seen in the US, where just three states (California, New York and Massachusetts) accounted for 60% of all deals (78% by investment value) in 2015. A critical mass of financial expertise with a large pool of skilled labour, entrepreneurs and supporting services all combine to create positive networking environment. Whilst the effect has been greater in London, clustering effects are also seen in cities outside of London, and this is explored further in section 1.5.
DEMAND SIDE FACTORS
Some of these regional differences may be explained by demand side factors, such as differences in SME awareness of equity finance. The latest Small Business Finance Markets report22 showed awareness of equity finance from Venture capitalists and business angels is higher in London and the South compared to other UK areas. 77% of SMEs in London are aware of VC as a source of external finance compared to 59% in the North and 65% in the Midlands. Similarly, 56% of SMEs in London are aware of business angels as a source of external finance compared to 32% in the North and 35% in the Midlands.
Fig 1.9NUMBER OF EQUITY DEALS IN LONDON COMPARED TO THE REST OF UKSource: British Business Bank analysis of Beauhurst
2016201520142013201220110
200
400
600
800
Num
ber o
f dea
ls p
er ye
ar
% o
f dea
ls in
Lond
on
0%
10%
20%
30%
40%
50%
60%
London
% of deals in LondonRest of UK excluding London

17SMALL BUSINESS EQUITY TRACKER 2017
SUPPLY SIDE FACTORS
Some of this lower awareness could be due to a lack of fund manager presence in areas outside of London. British Business Bank analysis of Pitchbook shows of the 512 active investors23 with VC listed as one of their investment strategies,24 71% have their head office listed with a London address (362).25 There are 150 investors (including public sector backed fund managers) listed with a head office located outside of London. This underestimates the presence of equity investors in areas outside of London as many large investors have regional offices. It is possible that fund managers have a head office based in London, so that they are closer to LP investors who are also likely to be based in London in order to make fund raising easier.
The following table show the number of unique equity investors per region26 with VC listed as one of their investment strategies, as well as those specialising in VC. This shows a limited presence of private sector equity investors27 in Wales, Yorkshire and Humber, South West, Northern Ireland, North East and East Midlands, with less than 10 investors having an office in each of these areas. This covers investors with a presence on Pitchbook but it is possible that individual private investors and business angels are more geographically dispersed throughout the UK.
VC listed as VC listed as one investment primary strategy investment strategy
London 531 305
South East 42 26
East of England 34 25
Scotland 33 22
North West 27 15
West Midlands 18 11
East Midlands 9 8
North East 8 4
Northern Ireland 8 6
South West 8 4
Yorkshire and Humberside 7 4
Wales 2 2
Total 647 391Source: British Business Bank analysis of Pitchbook
NUMBER OF UNIQUE EQUITY INVESTORS PER REGION (EXCLUDING GOVERNMENT INVESTORS)

18 BRITISH BUSINESS BANK
CAN TECHNOLOGY ADDRESS THESE ISSUES?
Explaining the regional distribution of equity deals is complex and is likely to involve both demand side and supply side issues. If it was purely a supply side problem (i.e. lack of fund managers outside of London), we would expect crowdfunding deals to be more regionally dispersed than other types of equity deals as technology minimises the cost of undertaking transactions and the effect of distance between firm and investor. However, the data shows this is not the case and activity remains concentrated along regional lines.
Whilst 47% of all equity deals overall are in London in 2016 (53% if we exclude deals involving government funders), the proportion of crowdfunding deals in London is even higher (57%). This is higher than the share of deals involving PE/VC which is 49%. Further evidence of location effects can be seen at the regional level. Crowdfunding is higher in the South West (8% of crowdfunding deals are in the South West compared to just 4% of VC/PE deals), most likely due to one large crowd funding platform (Crowdcube) located in the region. Even if technology does reduce the costs of under taking an equity deal, this may show investors prefer undertaking deals closer to their own location, or the presence of funders in the area increases business awareness which increases uptake of equity finance.
Fig 1.10DISTRIBUTION OF EQUITY DEALS BY TYPE OF INVESTOR (2016)Source: British Business Bank analysis of Beauhurst
Lond
on
Sout
h Ea
st
of E
ngla
nd
Nort
h W
est
York
shire
and
Hum
bers
ide
Scot
land
Sout
h W
est
Wes
t Mid
land
s
East
Mid
land
s
Wal
es
Nort
h Ea
st
Nort
hern
Irel
and
0%
10%
20%
30%
40%
50%
60%
70%
All Equity All Equity excluding Government VC/PE Crowdfunding Platform
Sout
h Ea
st

19SMALL BUSINESS EQUITY TRACKER 2017
CAN DIFFERENCES IN SECTOR EXPLAIN SOME OF THE REGIONAL DIFFERENCES IN EQUITY FINANCE?
Part of this uneven use of equity finance may be a result of different sectoral composition of equity deals in London compared to the rest of the country. London has higher levels of software-related deals than other parts of the country. The number of software deals has increased over the last few years, which may have contributed to a greater concentration of deals in London. For instance, the number of software deals (unweighted counts) have increased by 304% between 2011 and 2015 compared to 144% for non-software.
The following table shows the relative share of software and non-software sectors (unweighted counts) excluding deals involving government funds between 2014 and 2016. 61% of software deals are in London compared to 43% of non-software deals, with other regions share of non-software deal being closer to the region’s share of high growth businesses.28
The picture for non-software related businesses is more nuanced. London still has a higher density of earlier stage and smaller investments (less than £1 million) compared to the rest of the country, but growth-stage deals in non-software sectors are slightly more spread out in the UK, and are closer to the wider distribution of high growth businesses. For instance, London share of growth deals in non-software sectors is 28%.
% of UK % of UK % of UK % of all UK high growth non-software deals software deals equity deals businesses (2014) (2014-2016) (2014-2016) (2014-2016)
London 19.7% 43.1% 61.1% 52.5%
South East 14.5% 14.1% 10.5% 12.2%
East of England 9.0% 9.6% 7.6% 8.5%
South West 8.5% 6.5% 5.4% 5.9%
North West 11.0% 5.3% 3.3% 4.3%
Scotland 6.9% 6.0% 2.4% 4.1%
Yorkshire and Humberside 7.6% 3.7% 2.1% 2.9%
West Midlands 7.9% 3.3% 2.4% 2.8%
East Midlands 6.6% 2.9% 1.3% 2.1%
Wales 3.4% 2.0% 1.7% 1.8%
North East 3.0% 2.3% 0.9% 1.6%
Northern Ireland 1.9% 1.3% 1.2% 1.2%Source: British Business Bank analysis of Beauhurst and ONS High growth enterprises
PROPORTION OF EQUITY DEALS BY SOFTWARE/ NON-SOFTWARE SECTORS BY ENGLISH REGION AND DEVOLVED ADMINISTRATION

20 BRITISH BUSINESS BANK
English regions and devolved administration figures disguise the large variation in equity deal numbers that occurs within areas as equity deals tend to be grouped into geographic clusters where innovative companies, skilled labour and equity investors locate close together. To provide further granularity to the picture, the following map shows the number of equity deals in 2016 by Local Authority District. Whilst equity deals are concentrated in London, it reveals there are clusters of deal activity outside of London.
This is confirmed by the table on page 22 which shows the top 25 Local Authority District by number of deals in 2016. Boroughs in London form nearly half of the top 25 areas (with 12 boroughs), but represent 8 of the 10 highest areas ranked by number of deals in 2016.
Unsurprisingly because of the universities and the communities of angel investors that have developed over a period of time, Cambridge and Oxford are also in the list (ranked 6th and 12th respectively). Cities including Edinburgh, Manchester, Cardiff, Bristol, Glasgow, Sheffield and Leeds and Birmingham are also important equity hotspots where deals are clustered.
These areas tend to follow the wider UK total in terms of their sector specialisation with technology/ IP-based businesses (in particular the software technology sub-sector) being the sectors with the most deals followed by business and professional services. Life science (technology sub-sector) are within the top two sectors in Oxford and Cambridge by number of deals. In Sheffield the industrials sector has the highest number of deals, and industrials is the second highest sector in Leeds. The retail sector is important in Glasgow.
1.5
GEOGRAPHIC CLUSTERS

21SMALL BUSINESS EQUITY TRACKER 2017
NUMBER OF ANNOUNCED EQUITY DEALS IN 2016 BY LOCAL AUTHORITY DISTRICTSource: Beauhurst
Number of Deals
0 >25
Number of Deals
0 >25

22 BRITISH BUSINESS BANK
Rank Local Authority District Number Sector with highest Sector with second of deals number of deals highest number of deals
1 Hackney London 79 Software Business and professional services Borough Council
2 Camden London 77 Software Business and professional services Borough Council
3 Westminster City Council 75 Software Business and professional services
4 City of London 59 Software Business and professional services
5 Tower Hamlets London 51 Business and Software Borough Council professional services
6 Cambridge City Council 44 Software Life science
7 Islington London 38 Software Business and professional services Borough Council
8 Lambeth London 31 Software Business and professional services Borough Council
9 Edinburgh City Council 29 Business and Software professional services
10= Southwark London 24 Business and Software Borough Council professional services
10= Manchester City Council 24 Software Business and professional services
12 Oxford City Council 21 Life science Software
13 Hammersmith and Fulham 19 Software Business and professional services London Borough Council
14 Wandsworth Borough Council 18 Business and Software professional services
15= Kensington and Chelsea 17 Business and Software Royal Borough Council professional services
15= Bristol City Council 17 Software Business and professional services
17 Glasgow City Council 15 Software Retail
18= Cardiff Council 14 Business and Software professional services
18= Newcastle upon Tyne City Council 14 Business and Software professional services
20 Sheffield City Council 11 Industrials Software
21= Barnet London Borough Council 10 Software Business and professional services
21= Leeds City Council 10 Software Industrials
21= Birmingham City Council 10 Software Business and professional services
21= Brighton and Hove City Council 10 Software
25 Liverpool City Council 10 Software
TOP 25 AREAS FOR DEAL ACTIVITY IN 2016:
Source: British Business Bank analysis of Beauhurst

23SMALL BUSINESS EQUITY TRACKER 2017
The decline in deal numbers in 2016 was seen across most investor types with only two types of investor seeing an increase in number of deals.29 The number of deals involving commercialisation companies increased marginally from 42 in 2015 to 44 in 2016, and Private Investment vehicles increased their number of deals by 1 compared to 2015.
Private Equity/ Venture Capital (PE/ VC) was the most active type of investor in 2016 in terms of number of deals participated in (405 deals). The number of deals involving PE/ VC was 14% lower than in 2015, and continues the decline seen from 2014 when PE/ VC participated in 497 deals.
Crowdfunding has become an important source of equity finance in recent years for SMEs with exponential growth seen between 2011-2015. There were just 8 deals involving crowdfunding in 2011, but by 2015 this has increased to 349. Crowdfunding experienced its first yearly decline in 2016, with the number of deals reducing by 18% in 2016 to 285 deals. This is likely to reflect the wider market decline seen in other types of equity investors, rather than a change in appetite amongst investors investing through crowdfunding platforms.
Crowdfunding platforms were involved in 25% of all equity deals in 2016, but they have a larger share of seed stage deals, forming 34% of seed stage deals. Crowdfunders were the most prevalent seed stage investor in 2016 (similar to 2015), in terms of number of deals involved in. Crowdfunding platforms undertook 192 seed stage deals in 2016 compared to 132 for PE/VC investors showing it is an important funding route for seed stage companies.
Private investment vehicles were the third most prevalent investor overall, involved in 242 equity deals in 2016, but the number of deals is at a similar level to 2015 (241) showing no real change.
Government funds were involved in 169 deals in 2016, down from 227 the previous year. Government deals include deals made by funds operated the devolved administrations (Scottish Enterprise and Finance Wales), as well as JEREMIE backed funds and other local Government Funds. It also includes deals involving the British Business Bank’s Angel CoFund but excludes private sector funds supported by the British Business Bank, for example through the ECF programme. See Chapter 2 for a detailed assessment of deals involving funds supported by the British Business Bank.
1.6
INVESTORS
Fig 1.11NUMBER OF EQUITY DEALS BY INVESTOR TYPE (2011-2016)Source: British Business Bank analysis of Beauhurst
Num
ber o
f dea
ls
0
100
200
300
400
500
Bank
Corp
orat
e
Com
mer
cialis
atio
n co
mpa
ny
Acce
lara
tor
Ange
l n
Gove
rnm
ent
Priv
ate
inve
stm
ent v
ehic
le
Crow
dfun
ding
Priv
ate
Equi
ty a
nd
Vent
ure
Capi
tal

24 BRITISH BUSINESS BANK
A strong sectoral theme continues with the technology/ IP-based business sector receiving the greatest number of deals and investment in 2016, similar to previous years. Overall there were 440 technology/ IP-based business deals in 2016, receiving £1.7bn of funding.30 Technology forms 38% and 49% of total market by number and value respectively and has seen large increases over time, outperforming other sectors. Whilst the 17% decline in technology deal numbers seen in 2016 is similar to the overall equity market which has declined by 18%, the investment going to this sector still increased by 2% in 2016.
Business and professional services formed the next largest sector with 264 deals in 2016 (£757m), followed by industrials (142 deals, £212m). Both these sectors experienced a decline in the number and value of deals between 2015 and 2016.
1.7
SECTORS
Fig 1.12NUMBER AND VALUE OF EQUITY DEALS BY SECTORSource: British Business Bank analysis of Beauhurst
Inve
stm
ent (
£m)
Num
ber o
f dea
ls
Ener
gy
Craf
t ind
ustr
ies
Built
env
ironm
ent
Reta
il
Med
ia
Indu
stria
ls
Tele
com
mun
icat
ion
serv
ices
Pers
onal
serv
ices
Leis
ure
&en
tert
ainm
ent
Busi
ness
&pr
ofes
sion
al se
rvic
es
Tech
nolo
gy a
nd IP
base
d bu
sine
sses
0
600
1000
1400
1800
0
600
500
400
300
200
100
1600
1200
800
400
200
2011 2012 2013 2014 2015 2016 Number of deals

25SMALL BUSINESS EQUITY TRACKER 2017
Technology/ IP-based businesses can be subdivided further into numerous sub-sectors, with two sub-sectors forming the bulk of the market:
Software forms the largest technology sub-sector, with 287 deals in 2016 (£810m). Investment amounts in software increased by 23% compared to 2015, although the number of deals fell by 14%.
Life sciences formed the next largest sector, both in investment amount and number of deals. There were
55 life science deals in 2016 (£622m). Life science deals tend to be larger than software deals reflecting the capital-intensive nature of this sub-sector. The number of life science deals declined by 19% and the investment amount declined by 9% between 2015 and 2016, but investment amounts remain considerably higher than 2014 levels reflecting overall strength of the sector.31
The third largest technology sub-sector by deal number was clean technology with 26 deals in 2016 worth £61m.
1.8
TECHNOLOGY SUB-SECTORS
Fig 1.13NUMBER AND VALUE OF EQUITY DEALS BY TECHNOLOGY SUB-SECTORSource: British Business Bank analysis of Beauhurst
Number of deals
Inve
stm
ent (
£m)
Num
ber o
f dea
ls900
800
700
600
500
400
300
200
100
0
350
300
250
200
150
100
50
0
2011 2012 2013 2014 2015 2016
Nano
-tec
hnol
ogy
Mat
eria
lste
chno
logy
Othe
rte
chno
logy
Med
ical
tech
nolo
gy
Har
dwar
e
Clea
nte
chno
logy Life
scie
nces
Soft
war
e

CHAPTER 2:
BRITISH BUSINESS BANK ACTIVITY
2.1
INTRODUCTION
26 BRITISH BUSINESS BANK
This chapter explores the characteristics of equity deals made by equity funds supported by the British Business Bank and compares the characteristics of these investments to those made by the overall equity market.
As a Government owned financial institution, the British Business Bank has an objective of increasing the supply of finance to smaller businesses in areas of the markets that are not working as effectively as they could. The rationale for the Bank’s equity programmes are based on addressing market failures affecting the supply of equity finance. The Bank does this by working through VC funds as a Limited Partner (LP) investor in to these funds,
through co-investment alongside business angels or by establishing programmes such as the Northern Powerhouse and Midlands Engine Investment Funds, rather than making funding directly available to SMEs. Equity funds supported by the British Business Bank’s programmes combine private and public money to make commercially focused equity investments. British Business Bank equity programmes achieve good financial returns whilst addressing market gaps in the availability of equity finance. For instance, as at the end of March 2017, the ECF programme has generated an overall fund TVPI (Total Value to Paid-In) return of 1.30.

27SMALL BUSINESS EQUITY TRACKER 2017
Programme Description
Angel CoFund The Angel CoFund was established in 2011 to increase the supply of business angel finance available to viable small businesses with growth potential, and to improve the quality of angel investment through setting high standards for due diligence and scrutiny of deals.
Aspire The Aspire fund was established in 2008 to increase the supply of equity finance to women-led businesses with growth potential, but which would otherwise have struggled to raise private capital.
ECF ECFs were established in 2006 as a rolling programme of funds to increase the supply of equity (Enterprise finance to high growth potential businesses that would otherwise have faced difficulties Capital Funds) raising finance due to a lack of supply within the “equity gap”.
UKIIF UKIIF was established as a fund of funds in 2009 to increase the supply of equity finance to (UK Innovation viable growing technology businesses in strategically important sectors such digital technologies, Investment Fund) life sciences, clean technology and advanced manufacturing.
VC Catalyst Fund The VC Catalyst Fund was announced in 2013 and invests in commercially viable venture capital funds that might otherwise fail to reach a satisfactory “first close”. The programme was retargeted in 2016 to target the later stage VC funding gap.
NPIF NPIF is a £400m programme launched in February 2017, in collaboration between the (Northern British Business Bank and 10 LEPs in the North West, Yorkshire & Humber and Tees Valley. Powerhouse Investment Fund)
MEIF MEIF is a £250m programme that is a collaboration between the British Business Bank (Midlands Engine and 10 LEPs in the East and South East Midlands, and West Midlands. Investment Fund)
Further information on British Business Bank programmes, including their design and investment criteria can be found on the British Business Bank website.32
SUMMARY OF BRITISH BUSINESS BANK PROGRAMMES

28 BRITISH BUSINESS BANK
British Business Bank deals are matched to deals in the Beauhurst dataset using the Company Registration Number (CRN) in the first instance, or by the name of the company if CRN is not available. British Business Bank deals are then only included if the name of the fund manager is included in the list of investors for that specific deal. This will underestimate the actual coverage of deals involving British Business Bank supported funds as information on investors is not available for all deals, but this approach avoids capturing deals made in companies previously funded by British Business Bank supported funds. There are several investments within the Beauhurst dataset that relate to companies that have previously been funded by the British Business Bank through one of its previous schemes or prior to 2011. These deals are excluded from the following analysis, which provides an accurate picture of deals clearly involving British Business Bank supported funds.
Between 2011 and 2016 there are 401 visible equity deals undertaken by funds financially supported by the British Business Bank in the Beauhurst dataset. This relates to 271 unique companies, with a total investment value of £1.4bn.33 This includes investments made by the following British Business Bank programmes:34
• Angel CoFund
• Aspire Fund
• Enterprise Capital Funds (ECFs)
• UK Innovation Investment Fund (UKIIF)
• VC Catalyst Fund
For announced equity deals, where the specific British Business Bank supported fund is named in the investor category, Beauhurst captures 54% of British Business Bank supported fund deals but coverage varies by programme. For instance, 75% of Angel Cofund/ Aspire deals are captured, but only 32% of VC Catalyst fund deals are captured, possibly reflecting these fund managers being less likely to disclose deals publicly.
Whilst all companies are legally obliged to file SH01 forms with Companies House for any new equity share issuances, only a small proportion of equity deals are formally announced by VC fund managers or other equity investors through press notices or website announcement. This analysis is based on announced deals only as there is less information available on unannounced deals. It is therefore important to acknowledge that the figures presented in this chapter are based on a sample of deals that British Business Bank supported funds have undertaken and figures may differ to British Business Bank Management Information which is based on the full population of deals.
2.2
METHODOLOGY
Number of UK Company Coverage unique population companies (BBB MI Data)
ACF/ Aspire 60 80 75%
ECF 147 301 49%
UKIIF 66 121 55%
VC Catalyst 7 22 32%
All 271 503 54%Source: BBB MI data
COVERAGE OF BEAUHURST DEALS AGAINST BBB MI DATA

29SMALL BUSINESS EQUITY TRACKER 2017
Based on the number of announced investments, British Business Bank programmes are estimated to have supported around 7% of all equity deals between 2011 and 2016 and these deals formed around 11% of the overall invested equity amount.35
There are some differences by stage with British Business Bank supported funds involved in:
• 3% of seed-stage deals (5% by value)
• 9% of venture-stage deals (12% by value)
• 9% of growth-stage deals (11% by value)
It should be noted that British Business Bank programmes largely operate through VC funds set up as Limited Liability Partnerships and through co-investment with business angel syndicates through the Angel Cofund. Therefore, the overall market comparison is not necessarily “like with like”, as the Beauhurst data includes a wider range of investors beyond VC funds and angel networks – such as private investors, crowdfunding and local/regional government – which may have different investment behaviour.
The following graph shows the number of announced deals involving British Business Bank-supported funds over time as identified in the Beauhurst dataset. The number of identified British Business Bank programme investments increases gradually over time from 40 in 2011 to 81 in 2015, before declining in 2016 to 68. Care should be taken in interpreting this finding as there may be a time delay between deals being announced by British Business Bank supported funds. The ECF programme has made the largest number of identified investments, followed by UKIIF in the last three years. The number of identified combined Angel Cofund/ Aspire fund investments has declined since 2013.
Fig 2.1NUMBER OF ANNOUNCED DEALS INVOLVING BRITISH BUSINESS BANK FUNDS PER YEARSource: British Business Bank analysis of Beauhurst
2.3
MARKET SHARE
ACF/Aspire ECF UKIIF VC Catalyst All BBB programmes
201620152014201320122011
100
90
80
70
60
50
40
30
20
10
0
Num
ber o
f uni
que
com
pani
es
(Preliminary)

30 BRITISH BUSINESS BANK
Fig 2.2 shows the majority (71%) of British Business Bank-supported fund deals between 2011 and 2016 take place at the seed or venture-stage, with the Bank’s funds having a focus on venture-stage deals which make up nearly half (49%) of all the Bank’s deals. This is because the British Business Bank is targeted at increasing the supply of equity finance by addressing identified market gaps:
• In comparison to the overall equity market, British Business Bank supported funds invest in relatively fewer seed-stage deals (21% compared to 44%), but a higher proportion in venture-stage deals, (49% compared to 35%). The Bank’s funds also target a higher share of growth stage deals than the overall equity market (29% compared to 33%). The growth-stage covers later stage venture capital companies as well as established companies seeking growth capital.
• Overall equity markets are distorted by the inclusion of crowdfunding deals which tend to focus on earlier stage deals, and so comparisons are also made to deals involving PE/ VC investors only. This shows the activity of British Business Bank funds is more in line with overall PE/ VC market activity as 27% of PE/ VC deals occurring at the seed-stage, 39% at the venture-stage and 33% at the growth-stage. This still shows the Bank is more targeted at the venture-stage compared to PE/ VC funds, but has a slightly lower share of deals at the growth-stage.
• Seed-stage investments have declined as a proportion of all British Business Bank deals from 33% of all deals in 2011 to 19% in 2016. This partly reflects the shift in focus of British Business Bank programmes towards supporting scale-up companies (e.g. through the VC Catalyst programme), and the growth in funding opportunities for early stage companies in the overall equity market over recent years.
• When looking at investment values, most British Business Bank supported fund investment (60%) is at the growth-stage reflecting growth-stage deals being substantially larger than seed-stage and venture-stage deals on average. This is slightly higher than the overall equity market (58%) but lower than PE/ VC funds where the growth stage forms 63% of total investments. British Business Bank has a higher share of venture-stage investments (35%) than the overall equity market (31%) and PE/ VC (29%), but a lower share of seed-stage investments. Seed-stage investments formed 5% of British Business Bank fund deals, compared to 10% for the overall equity market and 8% for PE/VC funds.
2.4
BUSINESS STAGE

31SMALL BUSINESS EQUITY TRACKER 2017
British Business Bank supported fund’s seed and venture-stage deals are smaller than overall PE/ VC market, showing these funds are targeted at addressing the equity gap where private sector fund managers by themselves are less likely to target. British Business Bank supported funds growth-stage deals are smaller than the overall PE/ VC market (£7.8m compared to £10.6m), again showing the focus on targeting areas of the market that are not working as effective as they could be.
AVERAGE DEAL SIZE BY BUSINESS STAGE
British Overall Overall PE/ Business equity VC market Bank market
Seed £1.3m £730,000 £2.1m
Venture £2.9m £2.5m £4.1m
Growth £7.8m £8.5m £10.6m
Fig 2.2PROPORTION OF TOTAL DEALS BY BUSINESS STAGE (2011-2016)Source: British Business Bank analysis of Beauhurst
British Business Bank Overall equity market Overall PE/VC market
60%
50%
40%
30%
20%
10%
0%

32 BRITISH BUSINESS BANK
Funds backed by the British Business Bank are more likely to invest in Technology/ IP-based businesses than the overall equity market. 51% of deals was in this sector compared to 39% in the overall equity market. The next highest sector was business and professional services (forming 23% of all British Business Bank supported fund
deals) and industrials (8%), with these sector rankings being similar to the overall equity market. By investment amount, British Business Bank funds invested 50% in technology/ IP-based businesses, slightly higher than the overall equity market figure of 48%.
2.5
SECTOR
Fig 2.3PROPORTION OF TOTAL DEALS AND INVESTMENT VALUE BY SECTOR (2011-2016)Source: British Business Bank analysis of Beauhurst
Med
ia
Tele
com
mun
icat
ions
serv
ices
Indu
stria
ls
Reta
il
Built
env
ironm
ent
and
infr
astr
uctu
re
Tran
spor
tatio
nop
erat
ors
Leis
ure
and
ente
rtai
nmen
t
Busi
ness
and
prof
essi
onal
serv
ices
Tech
nolo
gy/IP
-bas
edbu
sine
sses
Craf
t ind
ustr
ies
Supp
ly ch
ain
Trad
espe
ople
Pers
onal
serv
ices
Ener
gy
BBB deals BBB investmentOverall market deals Overall market investment
0%
10%
20%
30%
40%
50%
60%

33SMALL BUSINESS EQUITY TRACKER 2017
In the Beauhurst dataset, British Business Bank supported fund deals are currently more concentrated in London than the overall equity and PE/ VC market with 53% of all deals (60% by value) located in the capital. In comparison, London’s share of number and value of deals is 42% and 46% respectively over 2011 to 2016. Whilst this is distorted to some extent by the inclusion of Government backed funds, removing these gives London a 50% share of deals and 48% by investment amount. Nevertheless, even if Government backed funds are removed, the British Business Bank funds still have a higher share of deals than the overall equity market.
This may be due to 30% of British Business Bank funds’ deals being in the software sector, which is higher than the overall market figure of 22%. As Section 1.4 shows, software deals are more likely to be in London. The British Business Bank funds included in this analysis do not have geographic restrictions on their deals, and are instead designed to work with the market by focusing on specific market failures. For instance, ECFs are targeted at the equity gap affecting smaller deal sizes.
NPIF and MEIF deals are not currently included in the British Business Bank deal numbers used in this report, but their inclusion in future years are likely to provide a more geographically balanced picture for British Business Bank deal activity.
2.6
REGION
Nort
hern
Irela
nd
York
shire
and
Hum
bers
ide
East
of
Engl
and
Nort
h Ea
st
Wes
t Mid
land
s
Wal
es
East
Mid
land
s
Scot
land
Nort
h W
est
Lond
on
Sout
h Ea
st
Sout
h W
est
Fig 2.4PROPORTION OF TOTAL DEALS AND INVESTMENT VALUE BY AREA (2011-2016)Source: British Business Bank analysis of Beauhurst
BBB deals
BBB Investment
0%
10%
20%
30%
40%
50%
60%
70%
Overall market deals
Overall market Investment Overall VC/PE Investment
Overall VC/PE deals

CHAPTER 3:
VC FUNDRAISING
3.1
INTRODUCTION
34 BRITISH BUSINESS BANK
Pitchbook data36 shows European VC fundraising has been relatively buoyant in 2015 and 2016 with over €8bn raised annually, but this is a result of larger funds being raised rather than due to an increased number of funds closing.37 Whilst this is a positive market development as larger funds can better able to support scale-up businesses (see British Business Bank Small Business Finance Markets Report 2016/17), there has been a long run decline in the overall number of European VC fund closing.
In 2011, 134 VC funds closed in Europe, but by 2016, this figure had fallen to 58. In particular, Pitchbook data shows the number of first time funds has fallen to a low with just 25 funds closing in 2016, which may limit the amount of funding for businesses looking for smaller amounts of equity funding. In recognition of this part of the market needing support, the British Business Bank’s ECF programme helps smaller funds and new fund management teams raise funding in the UK.
There is a similar picture for the UK with the number of funds closing declining over time but fundraising amounts in the UK are more volatile due to the smaller number of funds. 27 VC funds closed in 2016, the same number as the year before, but substantially lower than 2008 when 41 funds closed. Fund raising amounts were very high in in 2016 (£16.4bn), a large increase from the £4bn raised the year before.

35SMALL BUSINESS EQUITY TRACKER 2017
Fig 3.1EUROPEAN VC FUNDRAISING BY YEAR Source: Pitchbook
Capi
tal r
aise
d (€
bn)
Num
ber o
f fun
ds cl
osed
Number of funds closedCapital raised (€bn)
2006 2007 2008 2009 2010 2011 2012 2013 2014 2015 2016
€1
€2
€4
€7
€10
€9
€8
€6
€5
€3
0
20
60
120
160
140
100
80
40

36 BRITISH BUSINESS BANK
The British Business Bank has undertaken detailed analysis using the Pitchbook data platform for Limited Partner (LP) investor commitments into European and US VC funds between 2010 to Feb 2017 to explore key differences in investor composition and characteristics. This is useful to explore the types of LP investors investing in VC to understand key differences between UK and US markets. Pitchbook does not have full coverage of all LP commitments to VC.38 Therefore, commitment amounts should not be used to gauge total market size and these findings should be treated as indicative only.
The following analysis is based on fund location, rather than the location of investor. The British Business Bank estimates around half of all VC fundraising between 2010 and Feb 2017 came from overseas funding sources (17% from US LPs alone).
The European Investment Fund (EIF) is currently a significant investor in UK VC and PE funds. The 2016/17 Small Business Finance markets report confirmed, the European Investment Fund (EIF) has contributed a large amount of funding into UK equity funds, having supported 144 UK equity funds since 1996. The European Investment Fund has committed approximately £390m per year on average
into UK VC and PE funds over 2011-15.39 According to Pitchbook data, the European Investment Fund (EIF) is estimated to be the largest single investor in UK VC fund raising between 2010 and 2017, followed by the British Business Bank.
The following chart shows the composition of LPs for VC funds raised between 2010 and 2017.40 Public pension funds form the largest proportion of LP funding across all geographies. Public pension funds form 28% of UK VC fundraising compared to 65% in the US and 35% in the Rest of Europe. Private sector sources of funding form a smaller proportion of UK and European market compared to US. The US has greater proportion of endowment, insurance company and corporate pensions than the UK.
Government agencies form 26% of UK fundraising, and 21% in Rest of Europe, showing the importance of government funds to VC markets. In comparison, just 2% of funding in the US comes from Government sources, although this excludes US government funding through the SBIC programme. The funding provided by the Small Business Administration through the SBIC programme is structured as a loan rather than a capital contribution to a VC fund.
3.2
COMPOSITION OF INVESTORS

37SMALL BUSINESS EQUITY TRACKER 2017
Fig 3.2 PROPORTION OF LP INVESTMENT VALUE BY COUNTRY OF VC FUNDSource: British Business Bank analysis of Pitchbook
UK US
Public pensions Government agencies EIF
Insurance co., banksand wealth funds
Fund of funds Corporations/ Corporatepension funds
Other investors
Foundations/Endowments
0%
10%
20%
40%
80%
70%
60%
50%
30%
90%
100%
Rest of Europe

38 BRITISH BUSINESS BANK
The UK has a thinner market of LP investors investing in VC funds compared to the US. The average US VC fund has 5.2 LP investors compared to 2.9 in UK and 3.0 in Rest of Europe.
Average commitment per fund is £16.1m for UK funds, £11.7m for US funds and £14.6m for ROE funds, which is relatively similar. This may help explain why the average UK VC fund is 1.5 times smaller than the average US
fund (£118m compared to £180m). Fewer LPs per fund increases the risk for individual LPs due to greater investment concentration. Whilst larger fund sizes by themselves do not guarantee higher financial returns, the revised VC Catalyst programme aims to increase fund size to help create larger VC funds that are able to provide greater funding to scale-up businesses.
3.3
FUND CHARACTERISTICS

CHAPTER 4:
PORTFOLIO COMPANY EXITS
4.1
INTRODUCTION
39SMALL BUSINESS EQUITY TRACKER 2017
Portfolio company exits are very important to equity investors as they provide liquidity events to compensate for the risks they have taken.41 Whilst VC financial returns have been improving in recent years42, published long term returns still lag the returns from investing in MBOs. Recent BVCA data showing the 10 year IRR from investing in VC (for funds with a 2002 vintage onwards) is now 8.8%, up from 7.9% a year ago, but lower than the 11% IRR generated for PE overall.43 It is widely documented that investing in VC is risky, with the failure rate for early stage companies being high.44
This chapter presents detailed analysis using Beauhurst data looking at the survival outcome of businesses that received an equity deal in 2011, as well as making international comparisons of Initial Public Offering (IPO) and trade sale exits of VC backed companies using data from Preqin.

40 BRITISH BUSINESS BANK
Beauhurst has recently added the ability to track the survival status of companies receiving equity deals to examine whether they are still active, have exited via a trade sale, sale to a fund or IPO,45 or are permanently wound up (either voluntary or involuntary).
Of the 400 companies that received an equity investment in 2011, 63% are still active (an additional 1% are classed as zombie46) and 17% are dead47 by mid-April 2017. 19% of companies with an equity investment in 2011 have exited (equivalent to 74 businesses). The majority (86%)
of these have exited via an acquisition (trade sale), rather than an IPO. Of the 74 companies with an exit outcome, 64 Companies have exited via trade sale. 10 have exited via an IPO mainly on the AIM market (7), or the Main LSE market (2). The proportion of companies being active increases through yearly cohorts as there is less time to develop and exit. Therefore, the analysis in the rest of this chapter exploring differences in exit outcome by business characteristic is based only on companies that received an equity deal in 2011 to avoid any distortionary effects different investment years may cause.
4.2
SURVIVAL STATUS
Fig 4.1 PORTFOLIO COMPANY LATEST STATUS BY YEAR OF FIRST DEALSource: British Business Bank analysis of Beauhurst
Active
2011 2012 2013 2014 2015 2016
DeadExited
100%
90%
80%
70%
60%
50%
40%
30%
20%
10%
0%
% b
y st
atus

41SMALL BUSINESS EQUITY TRACKER 2017
Survival rates vary by business stage (based on first deal status). Companies receiving seed stages funding are most likely to die by mid-2017, with 20% having closed, and are also the least likely to have exited (9%). In comparison, companies receiving growth stage funding in 2011 are most likely to have exited (31% have exited) and the least likely to be dead (12% have died). This confirms the higher risks associated with investing in early stage businesses compared to later stage growth companies.
Comparing the survival rates to the general business population and drawing conclusions is difficult due to differences in company age48 and other business characteristics. ONS data shows for businesses born in 2010, 41.4% were still active five years later and for businesses started in 2011, 51% were still active 4 years later.49
PORTFOLIO COMPANY LATEST STATUS BY STAGE IN 2011
Exited Dead Active
Seed 9% 20% 71%
Venture 21% 18% 59%
Growth 31% 12% 57%Source: British Business Bank analysis of Beauhurst
Within the 2011 cohort of deals, there are some differences by sector, with technology/ IP-based businesses and media business being more likely to exit, 21% and 20% respectively. Businesses in the industrials and leisure sectors are more likely to be classified as dead (22% and 23% respectively). Interestingly, the proportion of technology/ IP-based businesses that are dead (15%) is lower than the all sector figure of 17%, which may suggest technology is less risky than is widely perceived or that technology companies take longer to develop than other sectors.
Fig 4.2PORTFOLIO COMPANY LATEST STATUS BY SECTOR (2011 DEALS)Source: British Business Bank analysis of Beauhurst
Exited Dead Active
Tech
nolo
gy/IP
base
d bu
sine
sses
Busi
ness
and
prof
essi
onal
serv
ices
Indu
stria
ls
Leis
ure
Med
ia
All S
ecto
rs
80%
70%
60%
50%
40%
30%
20%
10%
0%
% b
y st
atus

42 BRITISH BUSINESS BANK
Differences also exist by broad geographic area,50 but these differences could be explained by differences in investment stage or sector. Care is required in interpreting the causality of these differences. Businesses that received equity finance in 2011 in Northern areas are most likely to have died by 2017 (25%), with the lowest percentage exited (14%) of
all areas. Businesses in the Midlands, also have higher death rates (20%) compared to the UK average (17%).51 In comparison, the equity investments in the South (excluding London) have the greatest proportion of exits (24%). Given London’s high share of the overall equity market, it is unsurprising that London’s share of exited and dead businesses is similar to the UK total figure.
Fig 4.3PORTFOLIO COMPANY LATEST STATUS BY AREA (2011 DEALS)Source: British Business Bank analysis of Beauhurst
Exited Dead Active
Lond
on
Sout
h (E
xclu
ding
Lond
on)
Mid
land
s
Nort
h
UK To
tal80%
70%
60%
50%
40%
30%
20%
10%
0%
% o
f bus
ines
ses

43SMALL BUSINESS EQUITY TRACKER 2017
The following analysis uses Preqin and shows international comparisons in portfolio company exit outcomes. Most portfolio companies are unsuccessful and are written off, but Preqin only records successful exit events like trade sales, IPOs and secondary sales. This analysis is therefore based on successful outcomes only and the reported percentages relate to this, rather than the proportion of all deals.
Exit activity is very cyclical and is affected by wider macro-economic conditions. Exits declined during the 2008 and 2009 recession, before recovering in 2010 to 2013. The past three years have seen historically strong exit activity in Europe compared to earlier time periods. In 2016, 615 VC portfolio companies exited in the US, compared to 64 in the UK and 170 in the rest of Europe.
4.3
INTERNATIONAL COMPARISONS OF EXITS
Fig 4.4NUMBER OF SUCCESSFUL EXITS OVER TIMESource: British Business Bank analysis of Preqin
0
200
400
600
800
1000
20162015201420132012201120102009200820072006
US UK Rest of Europe
Num
ber o
f suc
cess
ful e
xits

44 BRITISH BUSINESS BANK
Of those successful exits, the majority (approximately 80%) occur through a trade sale. The UK has the same proportion of trade sale exits (79%) as the US (80%), but is higher than Europe (73%). The UK appears to be less likely to IPO (6%) compared to US (9%) and Europe (10%), but chart 4.6 shows this may be explained by just one sector.52
The UK healthcare sector53 has lower proportion of IPO exits compared to other countries and this has a disproportionate effect on the overall UK share of IPO exits. Healthcare forms 20% of all exits in the UK, a similar proportion to Europe and US, but only 11% of
UK healthcare exits are an IPO, compared to 24% for US and 27% for Europe. The UK has lower likelihood to exit via an IPO across all healthcare sub-sectors suggesting it is a general healthcare issue rather than confined to a specific sub-sector. Excluding healthcare shows very small differences between areas in the proportion of successful exits that are IPOs (5-6%). Thus, the low share of healthcare IPO exits has a disproportionate effect on overall UK share of IPO exits. Removing healthcare from the analysis, IPOs form approximately the same proportion of total successful exits as the US and Europe.
Fig 4.5PROPORTION OF EXITS BY EXIT ROUTE (SUCCESSFUL EXITS ONLY)Source: British Business Bank analysis of Preqin
UK US Rest of Europe
% o
f suc
cess
ful e
xit
Trad
e sa
le IPO
Sale
to G
P
Mer
ger
Sale
to M
anag
emen
t
Rest
ruct
urin
g
Priv
ate
Plac
emen
t
0%
10%
20%
30%
40%
50%
60%
70%
80%
90%

45SMALL BUSINESS EQUITY TRACKER 2017
Fig 4.6PROPORTION OF EXITS THAT ARE IPO BY HEALTHCARE/ NON-HEALTHCARE SECTORS (SUCCESSFUL EXITS ONLY) Source: British Business Bank analysis of Preqin
Hea
lthca
re
Non-
heal
thca
re
All s
ecto
rs
UK US Rest of Europe All areas
% o
f suc
cess
ful e
xit
30%
25%
20%
15%
10%
5%
0%

46 BRITISH BUSINESS BANK
Preqin shows the average investment duration between first known investment and exit date is approximately 5.3 years.54 The UK has broadly the same average investment duration as the US (5.3 years), suggesting UK VC investors are not any less patient in exiting deals than their US counterparts. However, there does appear to be larger differences in average investment durations between exit routes and sectors.
Exiting via an IPO take longer to occur on average than exiting via a trade sales (6.3 years compared to 5.1 on average). This is not surprising given the length of time necessary to build a company of sufficient size to be
able to list on a public market. IPOs take longer in US (6.4 years) compared to the UK (5.3 years) but there is little difference between the UK and US in the average investment duration for trade sale exits (around 5.1 years). Secondary sales take the longest to exit (6.6 years on average), which may be a result of being seen by some as an exit route of last resort, given the illiquid nature of VC. Secondary sales represent a very small proportion of US and European PE markets.55
4.4
INVESTMENT DURATION
Fig 4.7AVERAGE INVESTMENT DURATION BY EXIT ROUTE UK US Rest of Europe All areas
Average investment duration (Years)

47SMALL BUSINESS EQUITY TRACKER 2017
Differences exist by sector with some sectors taking longer to exit than others. Healthcare and semi-conductor sectors take longer to exit than the average for all sectors, possibly reflecting the capital-intensive nature of these industries and length of time required to gain approval for the healthcare sector. Internet and telecoms sectors are generally shorter to exit than the average for all sectors, reflecting the rapid speed
technology is diffused within these sectors. The UK investment duration figures may be more volatile due to smaller numbers of exits compared to the US and rest of Europe, so care is needed in drawing strong conclusions from the data but the UK appears to take longer to exit in consumer and food sectors than other areas. UK is quicker to exit in business services, industrials and semi-conductors.
Fig 4.8AVERAGE INVESTMENT DURATION BY SECTOR UK US Rest of Europe All areas
Busi
ness
serv
ices
Clea
nTe
ch.
Cons
umer
Disc
.
Ener
gy a
ndUt
ilitie
s
Aver
age
inve
stm
ent d
urat
ion
(yea
rs)
Food
and Ag
.
Hea
lthca
re
Indu
stria
ls
Inte
rnet
Othe
r IT
Sem
ic &
Elec
tron
ics
Soft
war
e &
rela
ted
Tele
com
s
All s
ecto
rs
3
4
5
6
7
6.5
5.5
4.5
3.5

48 BRITISH BUSINESS BANK
When looking at companies scaling up it is useful to look at how many funding rounds they receive and the average number of investors to examine how wide the funding ecosystem is. It takes 3.5 funding rounds on average to exit via an IPO compared to 2.4 for a trade sale. This shows developing a company to be a position ready to IPO requires more funding than developing a company for a trade sale.
UK VC backed companies that successfully exit receive fewer funding rounds on average compared to companies in the US (1.9 compared to 2.7) companies. Differences exist across all the main exit routes, suggesting UK companies may be less developed by the time they exit compared to companies in the US. The number of funding rounds UK companies receive is similar to the rest of Europe, showing it is a wider funding issue for Europe as a whole. The finding also holds for UK healthcare companies who have fewer funding rounds than healthcare companies in the US.
4.5
NUMBER OF FUNDING ROUNDS AND INVESTORS
Fig 4.9AVERAGE NUMBER OF FUNDING ROUNDS BY EXIT ROUTE UK US Rest of Europe All areas
Sale
to G
P
Aver
age
num
ber o
f fun
ding
roun
ds
IPO
Trad
e Sa
le
All e
xits
0.0
1.0
2.0
3.0
4.0

49SMALL BUSINESS EQUITY TRACKER 2017
The US has a more diverse funding eco-system with a greater number of separate investors supporting companies at different stages of their development. For VC backed companies in the UK that exit, on average they have 3.7 investors. Whilst this is similar to the rest of Europe (3.9 investors on average), it is substantially lower
than the US which has 5.8 investors. Companies that exit via an IPO in the US have 7.7 investors on average, compared to just 4 in the UK suggesting there may be fewer investors with the required skills and funding available to enable UK companies to scale-up.
Fig 4.10AVERAGE NUMBER OF INVESTORS BY EXIT ROUTE
0
1
2
3
4
5
6
7
8
UK US Rest of Europe All areas
IPO Trade Sale All exitsSale to GP
Num
ber o
f Inv
esto
rs

50 BRITISH BUSINESS BANK
BEAUHURST
Beauhurst was founded in 2010 and provides in-depth data on the UK’s fastest growing companies. Beauhurst’s research team identifies and investigates equity deal announcements for UK companies on a daily basis. In the categorisation of deals by, for instance, sector and stage of business, researchers make use of a set of complex criteria developed in-house to maintain consistency. Beauhurst’s equity deal data goes back to July 2010 and covers publicly announced equity investments into UK-based private companies.
Equity deals included meet the following criteria: (1) the recipient of the funding is a UK-based business; (2) there is no upper or lower limit for the sum invested; (3) the investment is visible, meaning that it has been publicly announced via press release or some other media; (4) The recipient of investment is a small or medium-sized business as defined by the European Commission.56
When analysing sector data, Beauhurst weights deal numbers and investment amounts across all the sectors the business is in. For example, a seed-stage company in the internet platform and theatre sectors will be counted as half a deal in each of these two sectors. Unless otherwise stated, this report omits single sector analysis to avoid double counted figures.
Where investment amounts have been provided in foreign currencies, these have been converted to GBP at the exchange rate on the day of the transaction.
The relatively simple breakdown by business stage used by Beauhurst differs from organisations such as Invest Europe and BVCA, which tend to distinguish between seed and start-up, and between early and late stage venture.
The reasons for using the simpler taxonomy are:
1. In some cases there isn’t enough information to decide on a principled basis which of the two seed or venture subgroups a company lies in.
2. The simpler taxonomy can be used for all sectors, whereas a more complicated one would be more difficult to apply consistently across sectors.
3. A less detailed breakdown reduces “noise” in the data resulting from smaller numbers of deals being categorised into narrower stages – the small base sizes can lead to large swings in reported investment from one quarter to the next.
The following table summarises the differences between the Beauhurst taxonomy and the more detailed classifications of investment stage used by Invest Europe and BVCA, and offers some broad descriptors of the types of activity and company supported in each case.
Location information is based on the head office location of the company receiving investment. This is also true of ONS data used to measure equity deal activity against regional business stock.
Second closing of a round: If, for example, a company completes a second closing of its Series B round for £5m and previously had closed £2m in a prior quarter, then only the £5m is included in the data for this quarter.
Ongoing fundraising: If a company indicates the closing of £1m out of a desired raise of £10m, the data only reflects the amount that has closed.
APPENDIX

51SMALL BUSINESS EQUITY TRACKER 2017
BUSINESS STAGE CLASSIFICATION
Beauhurst Invest Europe BVCA Broad Description Classification Classification Classification
Seed Seed Seed Young companies in the process of being setup or been in business for a short time, but have not yet made any commercial sales. Likely to have uncertain product-market fit or just started with regulatory approval process.
Start-up Company likely to be seeking finance to establish itself/ develop product/ service further.
Venture Start-up Other Early stage Company that has been around for a few years and is in the process of gaining significant Later stage venture Later stage venture market traction or progressing with regulatory approval. Sales are growing rapidly but unlikely to be profitable.
Company has high cash burn rate and is seeking finance to scale-up rapidly.
Growth More established company that has been around for at least 5 years. Likely to have multiple offices or branches with substantial revenue streams (some of them may be profitable).
Growth Expansion or Company likely to be seeking finance to grow ‘Growth Capital’ core market further or expanding into new markets or products/services.
Company may be getting ready to exit shortly (e.g. Pre-IPO).

52 BRITISH BUSINESS BANK
INVESTOR CLASSIFICATION
Investor classification Description of investor type
Family Office Wealth management firms that manage the investments of wealthy individuals, families, or multiple families.
Government Equity programmes managed by central, devolved, regional or local governments. British Business Bank programmes delivered by private sector fund managers are not included in this classification.
Bank Institutions that also provide commercial loans to businesses alongside equity investors.
Corporate Companies making equity investments into smaller companies directly or through a separate fund, often with a strategic purpose.
Incubator Provide a variety of benefits to early stage businesses including mentorship, office space, and funding, often in exchange for an equity stake.
Angel High Net Worth Individuals that invest their own wealth into growing companies. Angels may invest as an individual or as part of a syndicate involving other angels.
Private Investment Vehicle Individuals or a small group of individuals that invest in growing companies. PIVs are similar to angel investors but the equity shares are held by a fund or other structure rather than directly held by the individual(s).
Crowdfunding Online platforms enabling retail investors to invest into private companies.
Private Equity/ Fund structures that invest institutional funding into private companies. Venture Capital Venture Capital funds typically invest in early stage, high growth businesses; whilst Private Equity funds invest in later stage established businesses.

53SMALL BUSINESS EQUITY TRACKER 2017
Contingent funding: If a company receives a commitment for £10m subject to certain milestones being achieved but first gets £5m, the entire £10m is included in the data.
Timing: Investments are allocated based on funding announcement date and not on close date. There is generally and lag between the announcement data and the close date, with the latter preceding the former.
Equity financing: Funding comes from both “organised” and “unorganised” investors. The former includes institutional investors such as private equity firms, corporate venturing arms or formal networks such as business angel groups. The latter includes investments by business angels.
Crowdfunding investment: Investments of money in return for equity from crowdfunding intermediaries are included, e.g. Crowdcube, Seedrs.
Deals only partly equity: Venture debt, loans or grants issued to private companies are included only if they have come alongside equity financing. The entire round (including debt) is added to the data.
Investment only into private companies: Publicly-listed companies on any exchange are excluded from the numbers even if they received investment by an organised investor.
Only announced deals are included: Investments are verified via (1) government regulatory organisations (2) confirmation with the investee or investor or (3) a press release or news source.
Companies must be headquartered in the UK: The geographic data is based on the local authority where the company receiving investment is headquartered at the time of receiving investment. For example, if a company has offices in multiple cities or was founded in a particular city but has moved its headquarters, the data only reflect the headquarters.
What Beauhurst does not include for the purposes of this report:
• Buyouts, mergers and acquisitions: These transaction types involve the change in ownership of existing shares (to buy out existing shareholders) rather than the creation of new shares (and the injection of new money into the company).
• Private placements: Private investment in public equities even if made by a venture capital or private equity firm.
• Solely debt/grant funding: Venture debt or grants issued to emerging, start-up companies without any additional equity financing.
• Cash for rewards: Investment into companies for nonfinancial rewards, e.g. Kickstarter.
ACKNOWLEDGMENTS
This report was written by Dan van der Schans in the British Business Bank’s Economics Team, with guidance from Matt Adey, Alice Hu Wagner, Graeme Fisher and Asad Ghani.
We are grateful to the team at Beauhurst for all their support and guidance including Henry Whorwood. We are also grateful to Pitchbook and Preqin for the use of their data in this report.
BEAUHURST METHODOLOGY

54 BRITISH BUSINESS BANK
FOOTNOTES1 The venture-stage relates to the life cycle stage of the underlying business
and does not specifically relate to funding by VC investors.
2 Throughout this report, deal number and investment value calculated across industry sectors is based on weighted counts. This reflects the weighting Beauhurst attaches to the sectors an investee company covers. For example, a company in the Internet Platform and Theatre sectors will be counted as half a deal in each of these two sectors, rather than being counted twice under each sector.
3 BVCA Private Equity and Venture Capital Performance Measurement Survey 2016 https://www.bvca.co.uk/Portals/0/Documents/Research/Industry%20Performance/2016-Performance-Measurement-Summary.pdf
4 Funding from the SBIC programme is structured as a loan rather than a capital investment into a fund.
5 i.e equity investments into unlisted companies
6 Investments involving family and friends are included in the unannounced deals as it is not possible to identify the relationship of investors from information filed in Companies House.
7 The EC defines an SME as a business with less than 250 employees and either a turnover of less than €50m or balance sheet total of less than €43m.
8 SH01s filed at Companies House.
9 https://www.beauhurst.com/analysis/publication/
10 http://british-business-bank.co.uk/wp-content/uploads/2017/02/BBB-SBFM-REPORT-2016-17-web.pdf
11 For more information: https://www.preqin.com/
12 For more information: http://pitchbook.com/
13 https://nvca.org/research/pitchbook-nvca-partnership/
14 http://british-business-bank.co.uk/wp-content/uploads/2017/02/BBB-SBFM-REPORT-2016-17-web.pdf
15 https://techcrunch.com/2016/01/31/tech-valuations-in-2016-the-end-of-the-line-for-sloppy-growth/
16 Pitchbook data for Europe shows first-time financings at lowest quarterly total post-financial crisis, whilst late stage investments remain relatively strong.
17 Published Pitchbook data for Europe shows a 19% decline in deal number and 25% decline in investment amount between 2015 and 2016. VC deals in Europe have fallen quarter on quarter for seven of the eight periods. (Pitchbook European Venture Report 2017 Q1). Published data for the US shows a 19% decline in deal number and 10% decline in investment amount (Pitchbook Venture Monitor 1Q 2017).
18 Pitchbook data for Europe also confirms an increase in average deal sizes for early stage investments.
19 HM Government (2017) ‘Building our Industrial Strategy: Green paper’ https://www.gov.uk/government/uploads/system/uploads/attachment_data/file/611705/building-our-industrial-strategy-green-paper.pdf
20 High growth businesses in this instance are defined as “any business with average annualised growth of 20 per cent or more and with 10 or more employees in the starting period.” Source “Count of 'High Growth' enterprises, surviving enterprises and active enterprises with 1+ employees for the period 2010 to 2014 by District, Counties, Unitary Authorities and standard industrial classification (SIC2007)”, available at: https://www.ons.gov.uk/file?uri=/businessindustryandtrade/changestobusiness/businessbirthsdeathsandsurvivalrates/
21 Government funds include ERDF backed JEREMIE funds, as well as funds operated by the devolved administrations (Finance Wales and Scottish Investment Bank) and local Governments (for instance, London Co-investment fund). British Business Bank supported funds delivered by private sector fund managers are not included in definition of Government funds.
22 http://british-business-bank.co.uk/wp-content/uploads/2017/02/BBB-SBFM-REPORT-2016-17-web.pdf
23 Open to new investments
24 Some of these investors may predominantly invest in Private Equity rather than VC.
25 Preqin shows a slightly higher proportion with 78% of investors with their head office listed as London.
26 Some investors have several offices in the same region.
27 This obviously misses out business angels. Business angels could be more geographically dispersed than other types of equity investor.
28 The UK share of non-software businesses in the East of England is slightly higher than the share of high growth businesses in the region (9.6 compared to 9.0), possibly due to the impact of deals in Cambridge.
29 Equity deals often involve multiple types of equity investor and it is not possible to allocate specific funding amounts to each investor type. Therefore, information is only presented by deal number.
30 Throughout this report, deal number and investment amounts are calculated across industry sector based on weighted sectors. This reflects the weighting Beauhurst attaches to the sectors the company covers. For example, a company in the internet platform and theatre sectors will be counted as half a deal, rather than being counted twice under each sector.
31 See UK Bio Industry Association “Building something great: UK's Global Bioscience Cluster 2016” for more details of this specific sector.

55SMALL BUSINESS EQUITY TRACKER 2017
32 http://british-business-bank.co.uk/
33 This does not specifically relate to the amount contributed by the British Business Bank fund.
34 If unannounced British Business Bank fund supported deals are included, there are 471 deals relating to 294 unique companies. This give an estimated coverage of 59%.
35 This cannot be interpreted as total value of British Business Bank funding, as the figure includes funding amounts from other investors in deals involving multiple investors.
36 Pitchbook European Venture Report 2017 Q1
37 Closing a fund refers to VC funds finishing their fund raising, so that they can start making investments in companies.
38 No dataset has full coverage of LP commitments but the British Business Bank estimates around half of its supported funds are captured by Pitchbook, with commitment amounts generally being accurate. Throughout the LP commitment data, commitment amounts are often not reported being available for only 48% of funds and biased towards larger institutions (e.g. pension funds). Differences in coverage may also exist between US and Europe.
39 http://british-business-bank.co.uk/wp-content/uploads/2017/02/BBB-SBFM-REPORT-2016-17-web.pdf
40 Committed amounts are greatly under reported for certain investor types. For instance, High Net Worth Individuals and family offices.
41 Further information on financial returns is available from Pitchbook and Preqin.
42 See British Business Bank “Small Business Finance Markets 2016/17”
43 BVCA Private Equity and Venture Capital Performance Measurement Survey 2016 https://www.bvca.co.uk/Portals/0/Documents/Research/Industry%20Performance/2016-Performance-Measurement-Summary.pdf
44 http://www.techrepublic.com/article/the-dark-side-of-venture-capital-five-things-startups-need-to-know/
45 Beauhurst does not include MBOs within its definition of an exit event.
46 The company’s website and/or social media presence show prolonged neglect and/or its Companies House status is showing distress e.g. Administration, liquidation, etc.
47 The company has declared it has ceased all activity and/or the ultimate legal entity behind it has been dissolved according to information on Companies House.
48 Companies may be a few years old before receiving equity finance.
49 https://www.ons.gov.uk/businessindustryandtrade/business/activitysizeandlocation/bulletins/businessdemography/2015#business-survivals
50 These areas correspond to broad areas grouped together in the 2017 British Business Bank finance survey. The North includes NE, NW, Y&H, Scotland and NI. Midlands includes WM, EM and Wales. South includes SW, SE and EE.
51 The higher death rates for businesses in the North and Midlands, also holds if the analysis is extended to include deals made in 2012 (20% and 21% respectively) compared to the UK average figure of 17%. Exit rates for these regions are also lower (15% for Midlands and 13% for the North) compared to UK average of 19%.
52 Europe also has greater share of secondary sales compared to the UK and US.
53 Preqin includes the following sectors in its healthcare definition: Life science, biotechnology, pharmaceuticals, medical technology as well patient care services and healthcare IT.
54 The company may have been established several years prior to receiving equity funding
55 Capital Dynamics (2014) ‘White Paper – Private Equity Secondaries: Roadmap for small to mid-sized investors to successfully access secondaries’ https://www.capdyn.com/media/1627/white-paper-private-equity-secondaries-second-edition-jun14-en-1.pdf
56 The EC defines an SME as a business with less than 250 employees and either a turnover of less than €50m or balance sheet total ofless than €43m.

© BRITISH BUSINESS BANK PLC (JULY 2017) THIS PUBLICATION IS AVAILABLE FROM: BRITISH-BUSINESS-BANK.CO.UK
ANY ENQUIRIES REGARDING THIS PUBLICATION SHOULD BE SENT TO:
BRITISH BUSINESS BANK PLC FOUNDRY HOUSE 3 MILLSANDS SHEFFIELD S3 8NH