small and medium-sized entrepreneurship in greece: recovery with slow but steady steps
TRANSCRIPT

Small and medium-sized entrepreneurship: Recovery with slow but steady steps
November 2017
Ilias LekkosParaskevi Vlachou
ECONOMIC RESEARCH AND INVESTMENT STRATEGY

2
Introductory note
The results of last year’s annual sectoral assessment of small and medium-sized enterprises (SMEs) showed signs of
stabilisation. This year’s edition confirms the upward trend of small and medium sized entrepreneurship as revealed by the
analysis of the financial statements of a sample of over 17 thousand SMEs, SAs, and LTDs of all sectors of economic activity in
2015.
The stabilisation trend of the sectoral performance recorded in 2014 gained momentum in 2015, since a significant number of
sectors of economic activity made a remarkable improvement in their financial performance. In particular, the average index of
sectoral performance assessment, BIC Index, stood at 40.5 units versus 38.8 in 2014, a fact that is attributed to the improved
efficiency and liquidity and the stabilisation of the capital structure. In 2015, BIC Index recorded all time high since it first
constructed, with its previous higher score at 40.4 units being in the pre-crisis era, i.e. in 2007. Indicative of the positive
momentum of the Greek small and medium sized entrepreneurship is that in 2015 the average rating was “a-”, i.e. reaching the
2007 level, from “b” in 2014, exceeding by far the “c” rating in the three-year period 2010-2012.
At the same time, it is interesting that in 2015 the best performance was recorded in “non-traditional” sectors of the Greek
economy, i.e. manufacturing sectors such as repair and installation of machinery and equipment (33), manufacture of basic
metals (24) and manufacture of electrical equipment (27), as well as sectors of services such as computer programming and
information services (62+63) and administrative and support service activities excluding travel agencies (N-79). On the contrary,
the worst performance was recorded in sectors related to private consumption, such as entertainment (R), mass media
(59+60), manufacture of furniture (31) and tobacco products (12).
This positive performance of SMEs sends an optimistic message, but the challenges of the Greek economy remain.
Entrepreneurship seems to be on a recovery path aided by the gradual cleaning-up of the most problematic business cases. But
we need to wait until next year to see whether this momentum can be maintained.
BIC Index: November 2017
Contents of study
BIC Index: November 2017 3
1. Purpose of the study – key findings
2. Presentation of BIC Index results
3. BIC Rating System
4. Appendices

1. Purpose of the study – key findings
BIC Index: November 2017 4

Purpose of the study
BIC Index: November 2017 5
The purpose of this study is to update:
• the BIC Index and
• the BIC Rating System
– in order to assess the sectoral performance, regarding Small and
Medium Enterprises (SMEs) for 2015.
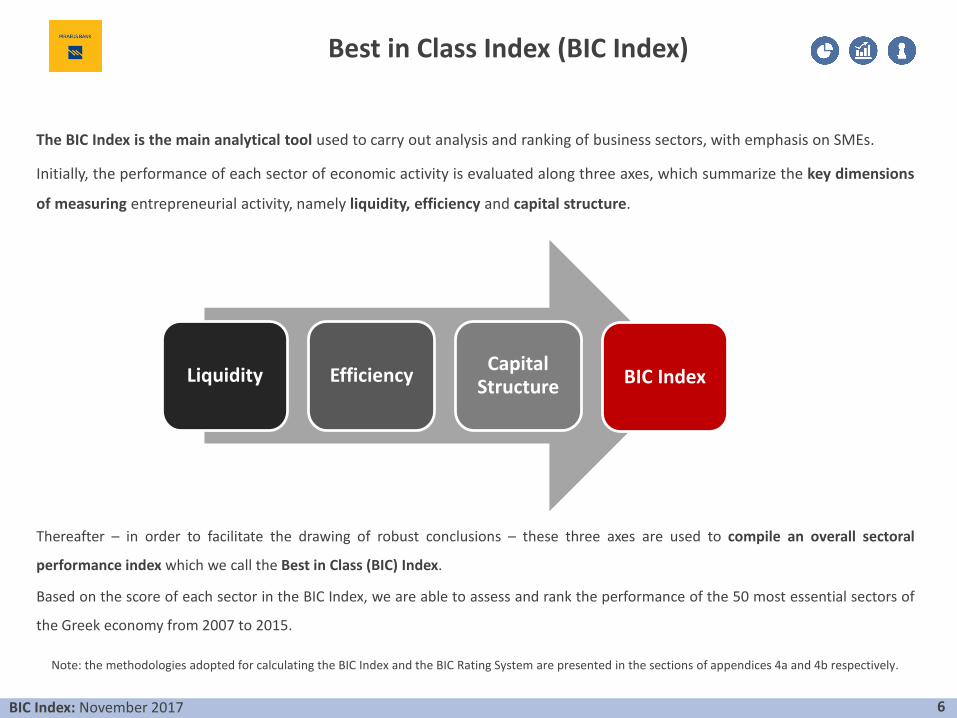
The BIC Index is the main analytical tool used to carry out analysis and ranking of business sectors, with emphasis on SMEs.
Initially, the performance of each sector of economic activity is evaluated along three axes, which summarize the key dimensions
of measuring entrepreneurial activity, namely liquidity, efficiency and capital structure.
Thereafter – in order to facilitate the drawing of robust conclusions – these three axes are used to compile an overall sectoral
performance index which we call the Best in Class (BIC) Index.
Based on the score of each sector in the BIC Index, we are able to assess and rank the performance of the 50 most essential sectors of
the Greek economy from 2007 to 2015.
Best in Class Index (BIC Index)
BIC Index: November 2017 6
Liquidity EfficiencyCapital
Structure BIC Index
Note: the methodologies adopted for calculating the BIC Index and the BIC Rating System are presented in the sections of appendices 4a and 4b respectively.

BIC Rating System
BIC Rating System
BIC Index: November 2017 7
Score
rangeScore Rating
BIC Index
Performance
≥63 a+
[51-63) a
[40-51) a-
[39-40) b+
[37-39) b
[36-37) b-
[35-36) c+
[33-35) c
[32-33) c-
[24-32) d+
[16-24) d
<16 d-
<32 underperformers
≥40 outperfomers
36-40 good performers
32-36medium
performers
The BIC Index allows us to rank the performance of sectors of
economic activity from the strongest to the weakest
separately for each year from 2007 to 2015.
In order to move on to a longitudinal analysis of the
development of sectoral performance throughout the period
2007-2015, we have developed a rating system of sectoral
performance – the BIC Rating System.
According to this system, each sector is ranked on a 12-grade
rating scale. Any improvement or decline in the BIC Index
score of each sector from year to year is reflected by a
corresponding upgrade or downgrade of the specific sector.

BIC Index: Sectors with the best performance, 2015
The sector of repair and installation of machinery and
equipment (33) showed resistance to the crisis and
enhanced its performance in 2015.
Other manufacturing sectors with positive results are
those related to manufacture of motor vehicles (29),
manufacture of basic metals (24), other kinds of
manufacturing (32) and manufacture of electrical
equipment (27).
Regarding the latter, another sector related to technology
that maintained a high performance was the sector of
computer programming and information services
(62+63).
Finally, the sectors of water supply etc. (E) and real estate
(68) remained in high positions for another year.
However, the BIC Index score of the E sector reduced
considerably compared to previous years, recording its
lowest value.
BIC Index: November 2017 8Source: Piraeus Bank Research, ICAP DATA
33Repair and installation of machinery and
equipment
32 Other manufacturing
ΕWater supply; sewerage, waste management and
remediation activities
62+63Computer programming, consultancy and related
activities. Information service activities
68 Real estate activities
24 Manufacture of basic metals
29Manufacture of motor vehicles, trailers and semi-
trailers
Ν-79
Administrative and support service activities
expect for travel agency, tour operator and other
reservation service and related activities
50 Water transport
27 Manufacture of electrical equipment
The sectors with the strongest performance, 2015

BIC Index: Sectors with the poorest performance, 2015
The sectors of entertainment, such as arts and
entertainment (R) and mass media (59+60)
continue to be among the lowest performers.
The situation in wood processing sectors is quite
similar, especially in the wood industry (16) and
the manufacture of furniture (31).
The performance of the agricultural sector (A) and
tobacco industry (12) remains low. Finally, the
decline of mining and quarrying (B) was significant
compared to the previous year, especially in terms
of efficiency and capital structure. Finally, the
performance of the manufacture of other non-
metallic mineral products (23) was significantly
lower as well.
BIC Index: November 2017 9Source: Piraeus Bank Research, ICAP DATA
59+60
Motion picture, video and television programme
production, sound recording and music
publishing activities. Programming and
broadcasting activities
16
Manufacture of wood and of products of wood
and cork, except furniture; manufacture of
articles of straw and plaiting materials
R Arts, entertainment and recreation
15 Manufacture of leather and related products
Β Mining and quarrying
31 Manufacture of furniture
Α Agriculture, forestry and fishing
51 Air transport
23Manufacture of other non-metallic mineral
products
12 Manufacture of tobacco products
The sectors with the weakest performance, 2015
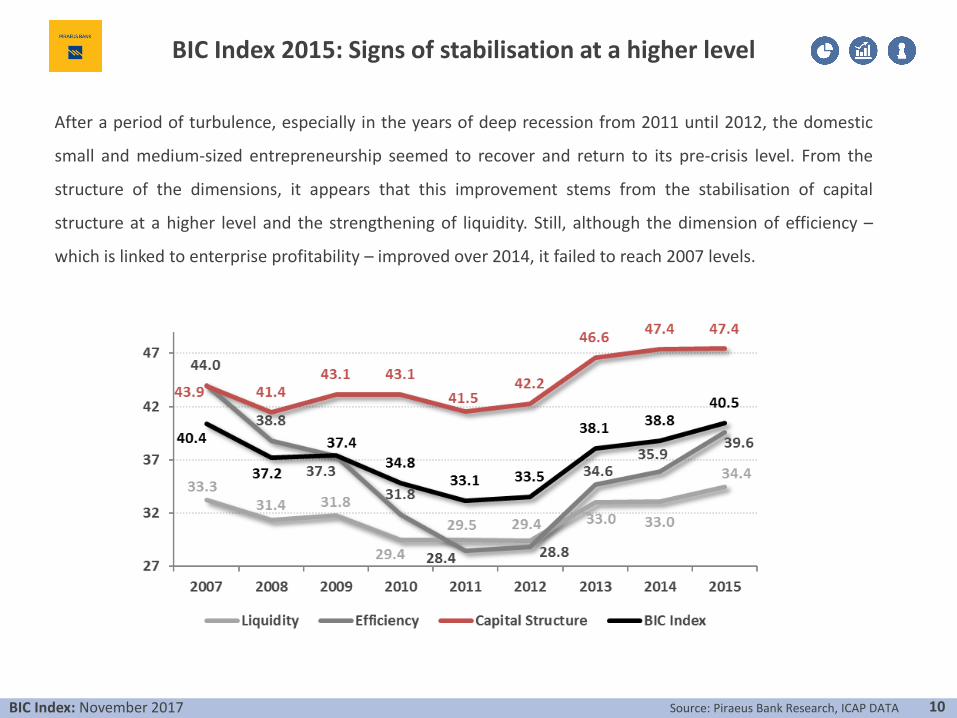
After a period of turbulence, especially in the years of deep recession from 2011 until 2012, the domestic
small and medium-sized entrepreneurship seemed to recover and return to its pre-crisis level. From the
structure of the dimensions, it appears that this improvement stems from the stabilisation of capital
structure at a higher level and the strengthening of liquidity. Still, although the dimension of efficiency –
which is linked to enterprise profitability – improved over 2014, it failed to reach 2007 levels.
BIC Index 2015: Signs of stabilisation at a higher level
BIC Index: November 2017 10Source: Piraeus Bank Research, ICAP DATA

The improved average performance of SMEs in 2015, which approached the levels of 2007, is also reflected at a sectoral level, since
60% of all sectors recorded a higher BIC Index score compared to 2007. In particular, 44% of all sectors exceeded the average
performance and at the same time improved over the period 2007-2015. The sectors of repair and installation of equipment (33) and
other manufacturing (32) combined among the highest performance and score improvement. On the other hand, the sectors of mass
media (59+60), wood industry (16), and arts and entertainment (R) continued recording the lowest performance and the strongest
reductions in 2007-2015. Among the sectors with the highest performance, the sectors of water supply, etc. (E) and real estate (68)
recorded the largest decline in BIC Index score over the period 2007-2015. Finally, despite their low performance, the tobacco industry
(12) and the telecommunications (61) recorded the highest improvement compared to 2007.
BIC Index 2007-2015: Performance and progress of sectors
BIC Index: November 2017 11Source: Piraeus Bank Research, ICAP DATA
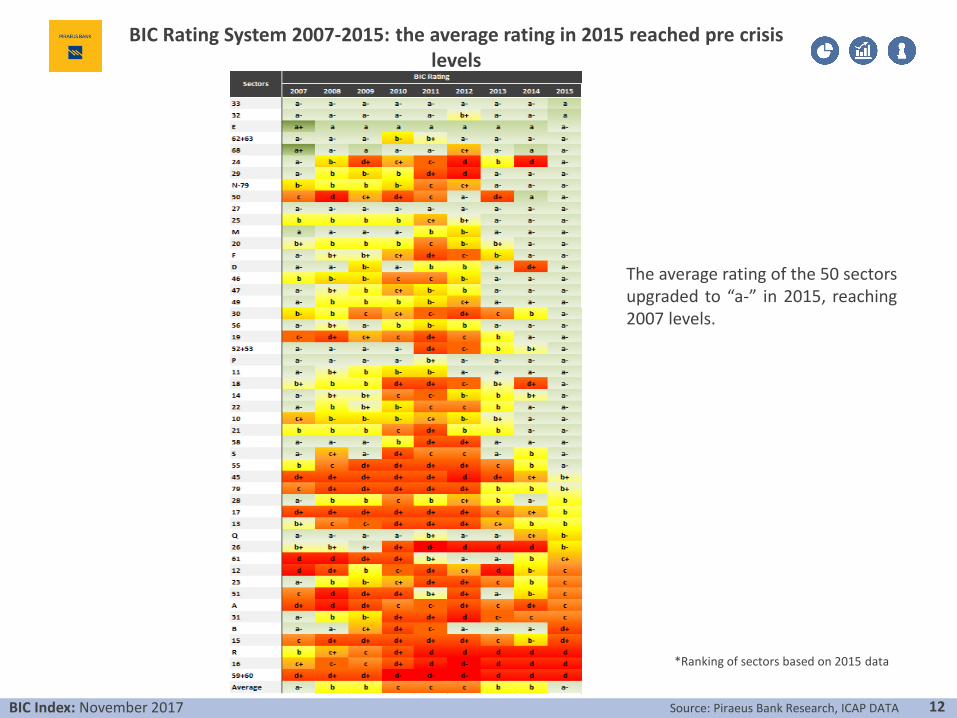
The average rating of the 50 sectorsupgraded to “a-” in 2015, reaching2007 levels.
BIC Rating System 2007-2015: the average rating in 2015 reached pre crisis levels
*Ranking of sectors based on 2015 data
BIC Index: November 2017 12Source: Piraeus Bank Research, ICAP DATA

BIC Rating System: mapping of sectors based on their performance, 2015
BIC Index: November 2017 13Source: Piraeus Bank Research, ICAP DATA
•45, 79,
•28, 17,
•13, Q,
•26
•61, 12,
•23, 51
•A, 31
•33, 32, Ε, 62+63, 68,
•24, 29, Ν-79, 50,
•27, 25, Μ, 20, F,
•D, 46, 47, 49, 30,
• 56, 19, 52+53, P,
•11, 18, 14, 22, 10,
•21, 58, S, 55
•B, 15
•R, 16
•59+60
Underperformers
(5 sectors, 10%)
Outperformers
(32 sectors, 64%)
Good performers
(7 sectors, 14%)
Medium performers
(6 sectors, 12%)
Turnover: €742.2mnNet earnings before interestexpenses, taxes, depreciation andamortisation: €15.9mnNet loss before taxes: €-78.9mnEquity: €838.9mnTotal liabilities: €1.4bnNet debt: €1.3bnInterest expenses: €37.8mn
Turnover: €41.7bnNet earnings before interestexpenses, taxes, depreciation andamortisation: €4bnNet profit before taxes: €1.8bnEquity: €28.5bnTotal liabilities: €33.1bnNet debt: €27.4bnInterest expenses: €928.6mn
Turnover: €4.1bnNet earnings before interestexpenses, taxes, depreciation andamortisation: €304.2mnNet profit before taxes: €109.5mnEquity: €2.1bnTotal liabilities: €3.1bnNet debt: €2.6bnInterest expenses: €89.2mn
Turnover: €2bnNet earnings before interestexpenses, taxes, depreciation andamortisation: €173.9mnNet profit before taxes: €15.1mnEquity: €1.5bnTotal liabilities: €2.2bnNet debt: €2bnInterest expenses: €68.9mn
Note: the figures are the sums of sectors per performance based on thesample of enterprises in 2015

BIC Rating System 2007-2015: Key findings
• In 2015, the average rating of small and medium-sized entrepreneurship reached the levels of
2007, i.e. achieved again an “a-” rating.
• Almost half the sectors (24 out of 50) retained the same rating in 2015 as in 2014, while 32% of
the sectors were upgraded.
• 64% of the sectors were characterised as “outperformers”, as 30 sectors achieved an “a-” rating
and 2 sectors an “a” in 2015.
• The important developments in the ratings of the sectors in 2015 are summarised below:
– the sectors of printing (18), energy (D) were upgraded from “d+” and manufacture of basic metals (24)
from “d” in 2014 to “a-”.
– the sector of manufacture of electrical equipment (27) maintained a high stability over the period 2007-
2015 and retained its “a-” rating.
– on the other hand, the leather industry (15) was upgraded to “c” after a recovery attempt in 2013 and to
“b-” in 2014, but it was downgraded again in 2015 to “d+”.
– similarly, mining and quarrying (B) were downgraded to “d+” in 2015 after three successive years (2012-
2014) with an “a-” rating.
BIC Index: November 2017 14

2. Presentation of BIC Index results
BIC Index: November 2017 15
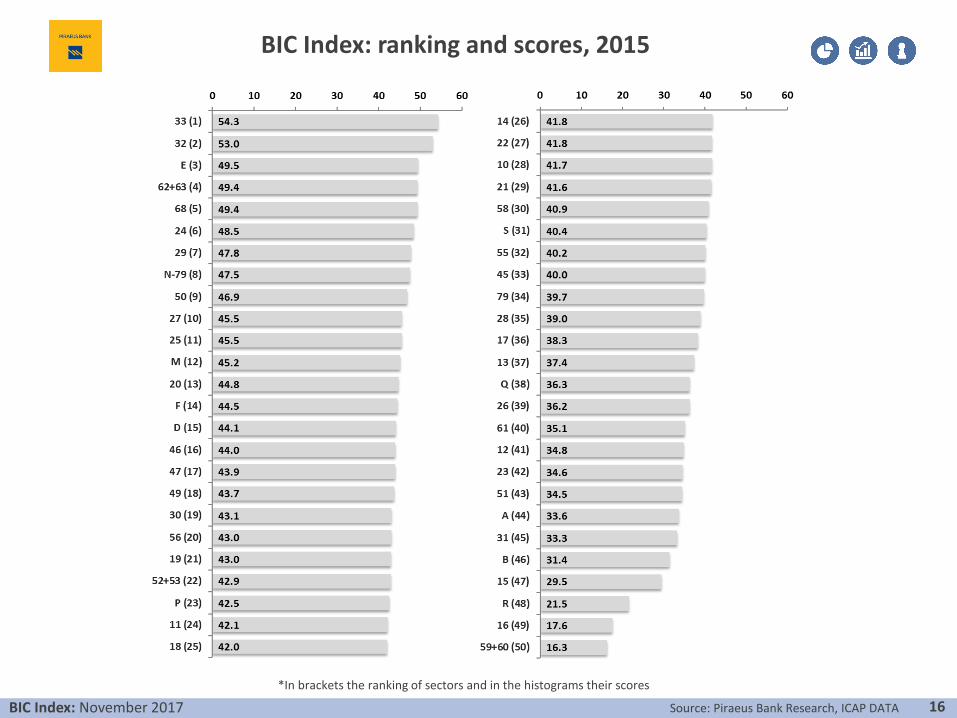
BIC Index: ranking and scores, 2015
*In brackets the ranking of sectors and in the histograms their scores
BIC Index: November 2017 16Source: Piraeus Bank Research, ICAP DATA

BIC Index: examination of the scores and rankings of the individual dimensions, 2015
BIC Index: November 2017 17Source: Piraeus Bank Research, ICAP DATA
• The green colour indicates the sectors whose scores are above the median score of every dimension among the sectors, in contrast with the redcolour, which indicates scores below the median score.• The arrow indicates the intensity of the direction of each sector relative to the median score of the corresponding dimension.
• score ≥ 75% of score range
• 50% ≤ score < 75%
• 25% ≤ score < 50%
• score < 25%
Score Rank Score Rank Score Rank Score Rank Score Rank Score Rank Score Rank Score Rank
33 54.3 1 32.9 33 60.8 3 69.3 2 14 41.8 26 39.4 11 37.1 33 48.9 26
32 53.0 2 44.0 4 53.1 4 61.9 4 22 41.8 27 27.9 44 39.9 26 57.4 9
E 49.5 3 47.8 2 40.5 22 60.3 6 10 41.7 28 33.2 30 38.0 32 53.8 17
62+63 49.4 4 42.5 6 48.2 10 57.5 8 21 41.6 29 37.6 14 48.7 9 38.4 40
68 49.4 5 55.4 1 46.2 15 46.5 29 58 40.9 30 43.7 5 41.5 19 37.7 41
24 48.5 6 45.8 3 29.1 43 70.5 1 S 40.4 31 34.8 25 36.7 34 49.9 22
29 47.8 7 35.7 22 52.1 5 55.6 14 55 40.2 32 30.2 38 50.3 6 39.9 36
N-79 47.5 8 33.0 32 48.8 8 60.6 5 45 40.0 33 33.0 31 36.0 37 51.0 20
50 46.9 9 35.9 20 68.3 2 36.6 43 79 39.7 34 36.7 17 43.9 17 38.6 38
27 45.5 10 39.7 8 32.1 41 64.7 3 28 39.0 35 37.2 15 41.2 20 38.6 39
25 45.5 11 39.7 9 38.6 30 58.2 7 17 38.3 36 31.5 36 39.3 27 44.0 34
M 45.2 12 39.5 10 48.0 11 48.3 28 13 37.4 37 35.7 23 19.4 48 57.0 11
20 44.8 13 34.5 27 47.1 12 52.7 18 Q 36.3 38 25.4 47 39.3 28 44.2 33
F 44.5 14 38.6 13 40.4 23 54.4 16 26 36.2 39 29.6 39 40.2 24 39.0 37
D 44.1 15 36.9 16 69.1 1 26.3 48 61 35.1 40 35.2 24 36.0 36 34.1 46
46 44.0 16 36.2 19 40.1 25 55.9 13 12 34.8 41 28.1 43 30.3 42 46.2 31
47 43.9 17 38.8 12 40.9 21 52.1 19 23 34.6 42 27.2 45 32.3 40 44.4 32
49 43.7 18 35.7 21 38.1 31 57.3 10 51 34.5 43 29.5 40 25.0 45 48.9 25
30 43.1 19 36.5 18 46.6 13 46.2 30 A 33.6 44 31.5 35 32.7 39 36.7 42
56 43.0 20 34.0 28 46.6 14 48.4 27 31 33.3 45 29.0 41 39.1 29 31.8 47
19 43.0 21 31.1 37 42.0 18 55.9 12 B 31.4 46 33.6 29 19.7 47 41.0 35
52+53 42.9 22 42.4 7 35.4 38 50.9 21 15 29.5 47 26.4 46 27.7 44 34.4 45
P 42.5 23 28.7 42 50.0 7 48.9 24 R 21.5 48 18.1 49 10.1 50 36.4 44
11 42.1 24 32.5 34 44.1 16 49.8 23 16 17.6 49 14.4 50 12.7 49 25.5 49
18 42.0 25 34.7 26 36.2 35 55.0 15 59+60 16.3 50 19.2 48 19.9 46 9.7 50
Capital StructureLiquidity EfficiencySectors
2015
BIC Index Liquidity Efficiency Capital Structure Sectors
2015
BIC Index
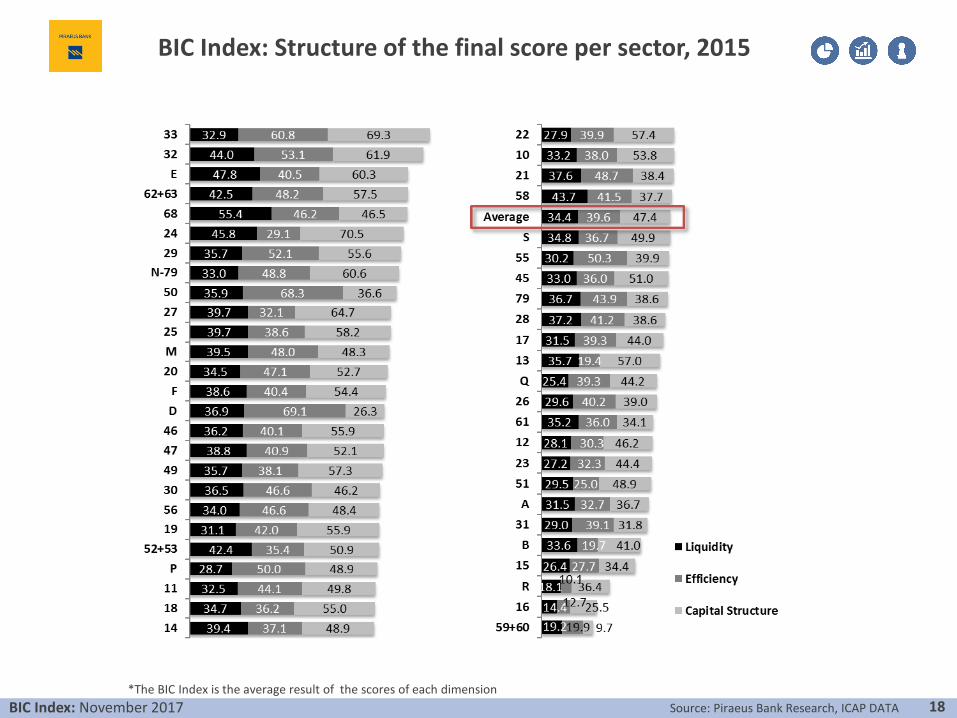
BIC Index: Structure of the final score per sector, 2015
BIC Index: November 2017 18Source: Piraeus Bank Research, ICAP DATA
*The BIC Index is the average result of the scores of each dimension

BIC Index: Sectors with the best performance, 2015
The sector of repair and installation of machinery and
equipment (33) showed resistance to the crisis and
enhanced its performance in 2015.
Other manufacturing sectors with positive results are
those related to manufacture of motor vehicles (29),
manufacture of basic metals (24), other kinds of
manufacturing (32) and manufacture of electrical
equipment (27).
Regarding the latter, another sector related to technology
that maintained a high performance was the sector of
computer programming and information services
(62+63).
Finally, the sectors of water supply etc. (E) and real estate
(68) remained in high positions for another year.
However, the BIC Index score of the E sector reduced
considerably compared to previous years, recording its
lowest value.
BIC Index: November 2017 19Source: Piraeus Bank Research, ICAP DATA
33Repair and installation of machinery and
equipment
32 Other manufacturing
ΕWater supply; sewerage, waste management and
remediation activities
62+63Computer programming, consultancy and related
activities. Information service activities
68 Real estate activities
24 Manufacture of basic metals
29Manufacture of motor vehicles, trailers and semi-
trailers
Ν-79
Administrative and support service activities
expect for travel agency, tour operator and other
reservation service and related activities
50 Water transport
27 Manufacture of electrical equipment
The sectors with the strongest performance, 2015

BIC Index: Sectors with the poorest performance, 2015
The sectors of entertainment, such as arts and
entertainment (R) and mass media (59+60)
continue to be among the lowest performers.
The situation in wood processing sectors is quite
similar, especially in the wood industry (16) and
the manufacture of furniture (31).
The performance of the agricultural sector (A) and
tobacco industry (12) remains low. Finally, the
decline of mining and quarrying (B) was significant
compared to the previous year, especially in terms
of efficiency and capital structure. Finally, the
performance of the manufacture of other non-
metallic mineral products (23) was significantly
lower as well.
BIC Index: November 2017 20Source: Piraeus Bank Research, ICAP DATA
59+60
Motion picture, video and television programme
production, sound recording and music
publishing activities. Programming and
broadcasting activities
16
Manufacture of wood and of products of wood
and cork, except furniture; manufacture of
articles of straw and plaiting materials
R Arts, entertainment and recreation
15 Manufacture of leather and related products
Β Mining and quarrying
31 Manufacture of furniture
Α Agriculture, forestry and fishing
51 Air transport
23Manufacture of other non-metallic mineral
products
12 Manufacture of tobacco products
The sectors with the weakest performance, 2015
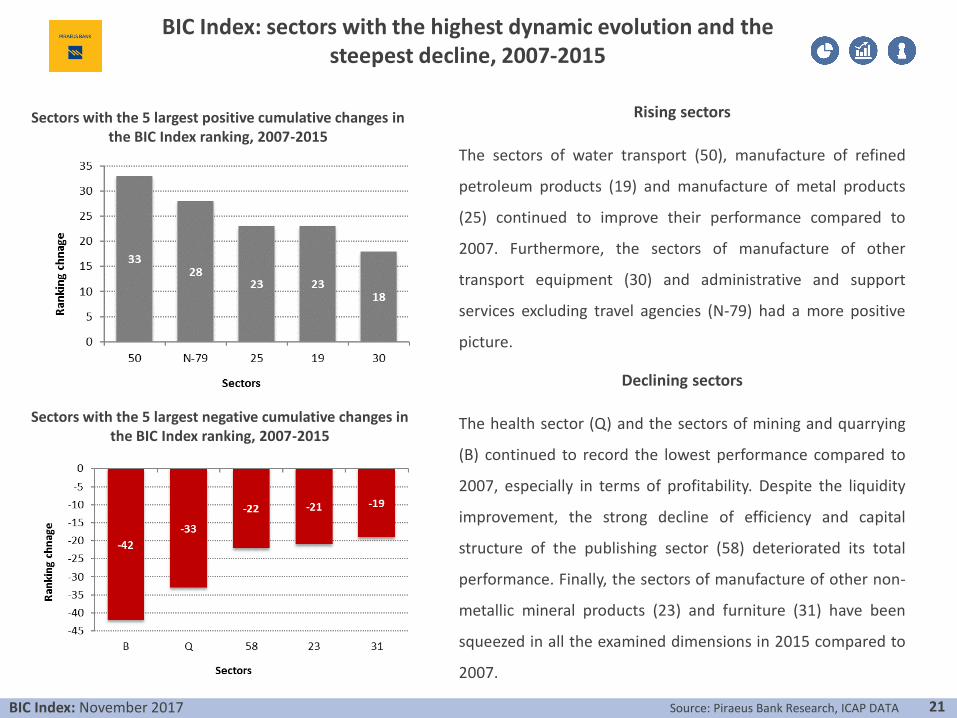
Rising sectors
The sectors of water transport (50), manufacture of refined
petroleum products (19) and manufacture of metal products
(25) continued to improve their performance compared to
2007. Furthermore, the sectors of manufacture of other
transport equipment (30) and administrative and support
services excluding travel agencies (N-79) had a more positive
picture.
BIC Index: sectors with the highest dynamic evolution and the steepest decline, 2007-2015
Sectors with the 5 largest positive cumulative changes in the BIC Index ranking, 2007-2015
BIC Index: November 2017 21
Sectors with the 5 largest negative cumulative changes in the BIC Index ranking, 2007-2015
Declining sectors
The health sector (Q) and the sectors of mining and quarrying
(B) continued to record the lowest performance compared to
2007, especially in terms of profitability. Despite the liquidity
improvement, the strong decline of efficiency and capital
structure of the publishing sector (58) deteriorated its total
performance. Finally, the sectors of manufacture of other non-
metallic mineral products (23) and furniture (31) have been
squeezed in all the examined dimensions in 2015 compared to
2007.
Source: Piraeus Bank Research, ICAP DATA

After a period of turbulence, especially in the years of deep recession from 2011 until 2012, the domestic
small and medium-sized entrepreneurship seemed to recover and return to its pre-crisis level. From the
structure of the dimensions, it appears that this improvement stems from the stabilisation of capital
structure at a higher level and the strengthening of liquidity. Still, although the dimension of efficiency –
which is linked to enterprise profitability – improved over 2014, it failed to reach 2007 levels.
BIC Index 2015: Signs of stabilisation at a higher level
BIC Index: November 2017 22Source: Piraeus Bank Research, ICAP DATA

The improved average performance of SMEs in 2015, which approached the levels of 2007, is also reflected at a sectoral level, since
60% of all sectors recorded a higher BIC Index score compared to 2007. In particular, 44% of all sectors exceeded the average
performance and at the same time improved over the period 2007-2015. The sectors of repair and installation of equipment (33) and
other manufacturing (32) combined among the highest performance and score improvement. On the other hand, the sectors of mass
media (59+60), wood industry (16), and arts and entertainment (R) continued recording the lowest performance and the strongest
reductions in 2007-2015. Among the sectors with the highest performance, the sectors of water supply, etc. (E) and real estate (68)
recorded the largest decline in BIC Index score over the period 2007-2015. Finally, despite their low performance, the tobacco industry
(12) and the telecommunications (61) recorded the highest improvement compared to 2007.
BIC Index 2007-2015: Performance and progress of sectors
BIC Index: November 2017 23Source: Piraeus Bank Research, ICAP DATA

BIC Index: Mapping of sectors based on their performance, 2007-2015
BIC Index: November 2017 24
• 11, 56, 58, 68,
• D, E, M, P
• 13, 15, 16, 23,
• 26, 28, 31, 59+60,
• B, Q, R, S
• 10, 14, 18, 19, 20,
• 21, 22, 24, 25, 27,
• 29, 30, 32, 33, 46,
• 47, 49, 50, 52+53,
• 62+63, N-79,
• F
• 12, 17, 45, 51,
• 55, 61, 79, A
Low performance,
progress
8 sectors
High performance,
progress
22 sectors
High performance, deterioration
8 sectors
Low performance, deterioration
12 sectors
Source: Piraeus Bank Research, ICAP DATA

3. BIC Rating System
BIC Index: November 2017 25

BIC Rating System: mapping of sectors based on their performance, 2015
BIC Index: November 2017 26Source: Piraeus Bank Research, ICAP DATA
•45, 79,
•28, 17,
•13, Q,
•26
•61, 12,
•23, 51
•A, 31
•33, 32, Ε, 62+63, 68,
•24, 29, Ν-79, 50,
•27, 25, Μ, 20, F,
•D, 46, 47, 49, 30,
• 56, 19, 52+53, P,
•11, 18, 14, 22, 10,
•21, 58, S, 55
•B, 15
•R, 16
•59+60
Underperformers
(5 sectors, 10%)
Outperformers
(32 sectors, 64%)
Good performers
(7 sectors, 14%)
Medium performers
(6 sectors, 12%)
Turnover: €742.2mnNet earnings before interestexpenses, taxes, depreciation andamortisation: €15.9mnNet loss before taxes: €-78.9mnEquity: €838.9mnTotal liabilities: €1.4bnNet debt: €1.3bnInterest expenses: €37.8mn
Turnover: €41.7bnNet earnings before interestexpenses, taxes, depreciation andamortisation: €4bnNet profit before taxes: €1.8bnEquity: €28.5bnTotal liabilities: €33.1bnNet debt: €27.4bnInterest expenses: €928.6mn
Turnover: €4.1bnNet earnings before interestexpenses, taxes, depreciation andamortisation: €304.2mnNet profit before taxes: €109.5mnEquity: €2.1bnTotal liabilities: €3.1bnNet debt: €2.6bnInterest expenses: €89.2mn
Turnover: €2bnNet earnings before interestexpenses, taxes, depreciation andamortisation: €173.9mnNet profit before taxes: €15.1mnEquity: €1.5bnTotal liabilities: €2.2bnNet debt: €2bnInterest expenses: €68.9mn
Note: the figures are the sums of sectors per performance based on thesample of enterprises in 2015

Classification of sectors per year based on the BIC Rating System
BIC Index: November 2017 27Source: Piraeus Bank Research, ICAP DATA
Rating Rating
a+ E 68 a+
a M E E 68 E E E E 50 E 68 33 32 a
B Q 62+63 M 62+63 68 Q 62+63 M 68 M 27 68 33 27 33 62+63 27 29 61 51 56 29 62+63 E 62+63 68
56 58 P Q B 27 32 P 33 D 33 32 32 Q 11 50 56 62+63 33 32 M 27 24 29 N-79
D 32 27 P 58 32 27 S 56 Q P 52+53 P 61 B 27 68 58 20 33 46 50 27 25
11 F 47 52+53 D 33 58 52+53 26 P M D 25 22 P M 20 F
52+53 29 33 32 Q 11 47 28 11 D 46 47
24 14 23 S 47 25 58 19 F 49 30 56
49 28 S 46 N-79 B 10 N-79 49 19 52+53 P
22 31 49 B 21 11 18 14
22 10 21
58 S 55
20 18 26 14 26 47 22 F 14 61 62+63 51 32 25 10 18 20 52+53 14 45 79
13 F 11 56 P Q
46 21 55 21 25 49 25 47 49 49 56 25 M D 28 56 21 D 52+53 24 22 S 55 23 28 17 13
25 R 30 31 N-79 11 20 12 29 20 58 47 19 79 28 61 13 79
20 28 29 28 21 18 14 21 30
22 23 18 N-79
N-79 30 24 46 10 D 29 31 62+63 N-79 22 56 47 11 M 14 46 F 51 12 15 Q 26
10 23 46 10 11 49 20 10
10 16 S R B 50 19 23 47 24 10 25 12 28 68 13 17 45 Q 61
30 F N-79 49
79 15 50 55 13 R 30 16 14 21 46 46 N-79 50 22 19 S 30 23 17 31 12 23 51
51 19 28 A 20 22 S 15 A 55 A 31
19 16 13 12 14 A 24 F 18 52+53 31
B 30
A 45 59+60 15 79 45 55 17 24 18 B 17 15 31 F 30 79 51 50 45 A D 18 B 15
17 17 59+60 19 A 79 51 51 S 16 18 21 52+53 A 55 58
12 45 15 61 79 13 31 12 55 19 17 15 13
59+60 15 55 26 79 23 17 23
45 50 R 29 58 13
61 45
61 12 50 A 51 16 R 31 45 24 12 R 26 R 24 26 R 16 59+60
61 29 26 R 16 59+60 16 59+60
d- 59+60 59+60 26 59+60 16 d-
2010
c-
d+
d
b+
b
b-
c+
c
2007 2008
a-
d
b+
b
b-
c+
c
c-
2012
a-
d+
201520142009 20132011

Mapping of the performance of sectors per year based on the BIC Rating System
BIC Index: November 2017 28Source: Piraeus Bank Research, ICAP DATA
*Ranking of sectors basedon 2015 data

4. Appendices
BIC Index: November 2017 29

4a. Methodology of calculating BIC Index
BIC Index: November 2017 30
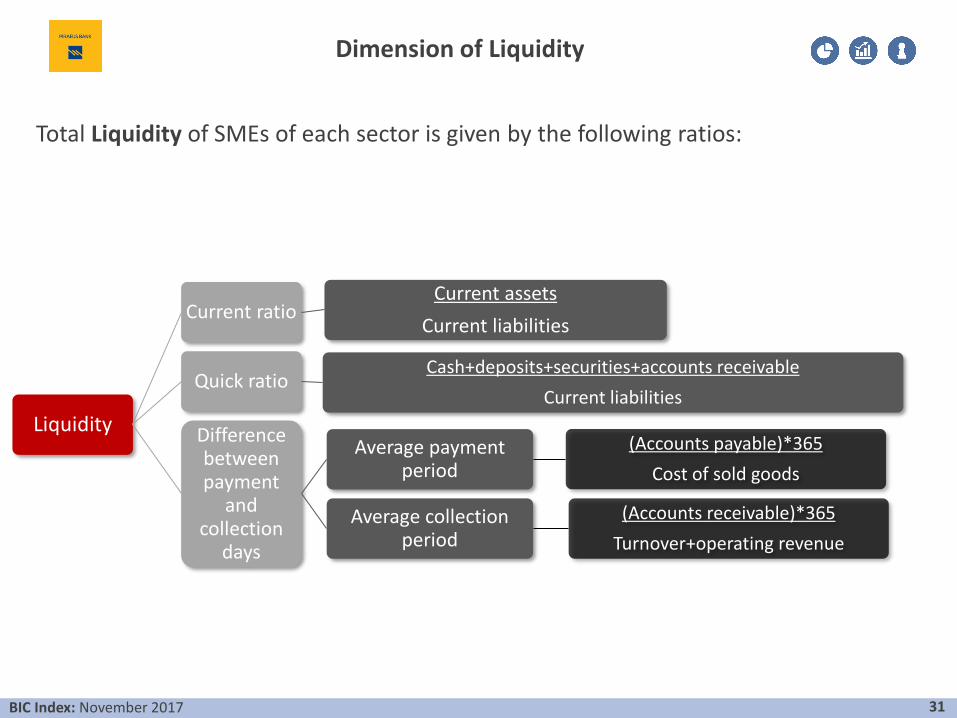
Total Liquidity of SMEs of each sector is given by the following ratios:
Dimension of Liquidity
Liquidity
Current ratioCurrent assets
Current liabilities
Quick ratioCash+deposits+securities+accounts receivable
Current liabilities
Difference between payment
and collection
days
Average payment period
(Accounts payable)*365
Cost of sold goods
Average collection period
(Accounts receivable)*365
Turnover+operating revenue
31BIC Index: November 2017

The overall measure of the Efficiency of each sector is given by:
Dimension of Efficiency
Efficiency
Gross profit margin
Gross profit
Turnover
Net profit margin
Net profit before taxes
Turnover+operating revenue
EBITDA margin
Net earnings before interest expenses, taxes, depreciation and amortisation
Turnover+operating revenue
Return on total assets
Net profit before taxes
Total assets
Return on equity
Net profit before taxes
Equity
32BIC Index: November 2017

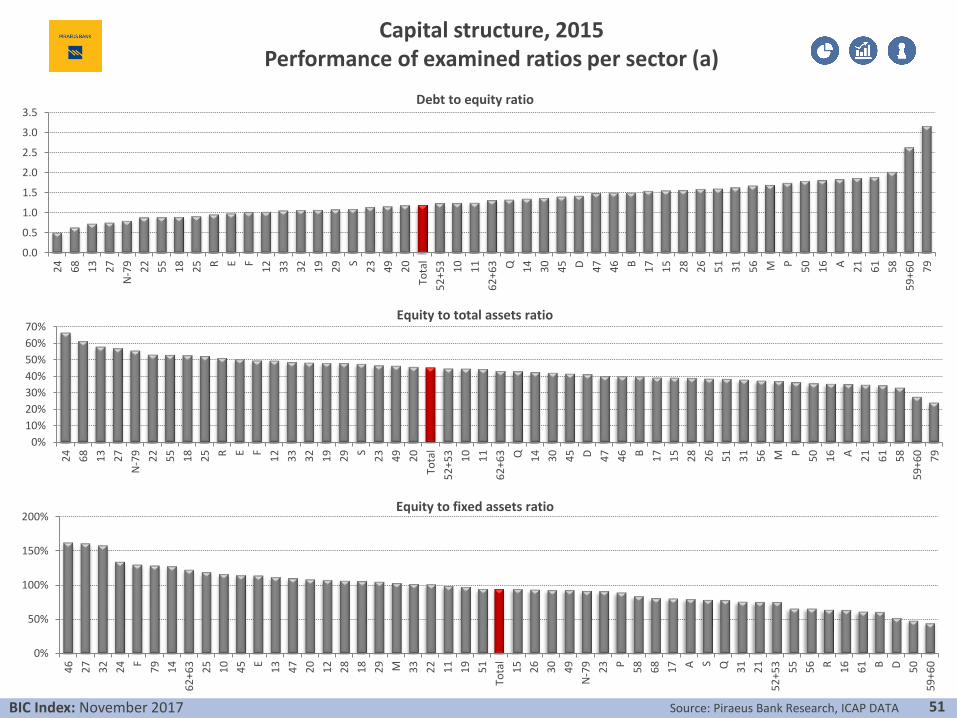
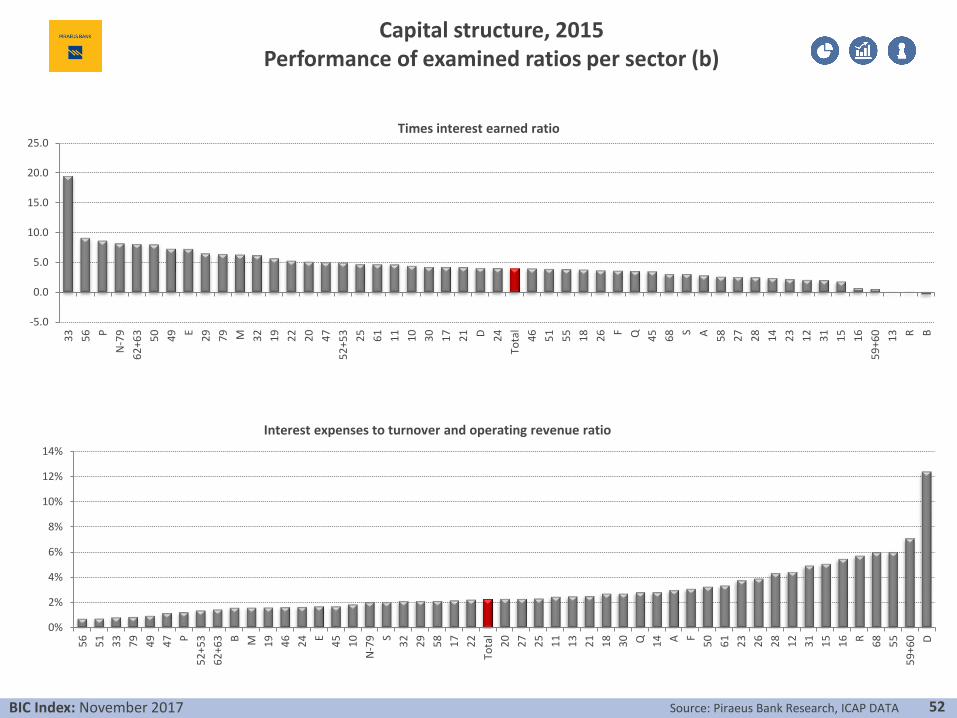
The basic Capital Structure ratios we use are the following:
Dimension of Capital Structure
Capital structure
Debt to equity ratio
Total liabilities
Equity
Equity to total assets
ratio
Equity
Total assets
Times interest
earned ratio
Net earnings before interest expenses, taxes, depreciation and amortisation
Interest expenses
Equity to fixed assets
ratio
Equity
Net fixed assets
Interest expenses to
turnover and operating
revenue ratio
Interest expenses
Turnover+operating revenue
33BIC Index: November 2017

Each of these variables has a different range, as well as different units of
measurement; e.g. some variables count the number of days, some are
expressed as percentages and so on.
In order to be able to initially compare and synthesize these variables,
for the three key dimensions of liquidity, efficiency and capital structure
and then the BIC Index, all variables should be converted to a common
base.
Transformation of variable values of the BIC Index
34BIC Index: November 2017

Standardization of variables examined:
When the rise of a variable value is a positive development, the standardizationformula is:
Where, pi: the variable value of sector i after the standardization;
Ii: the variable value of sector i before the standardization;
Imin: the variable value of the sector with the weakest performance of all examinedsectors;
Imax: the variable value of the sector with the strongest performance of all examinedsectors.
When the decline of a variable value is a positive development, the standardizationformula is:
The common range of variables is: 0-100.
Calculation of the BIC Index scores
35BIC Index: November 2017
𝑝𝑖 =𝐼𝑖 − 𝐼𝑚𝑖𝑛
𝐼𝑚𝑎𝑥 − 𝐼𝑚𝑖𝑛× 100
𝑝𝑖 =𝐼𝑚𝑎𝑥 − 𝐼𝑖
𝐼𝑚𝑎𝑥 − 𝐼𝑚𝑖𝑛× 100

Crucial to the construction of the index is the choice of the base
period, namely the period used to calculate the maximum (Imax) and
minimum (Imin) value.
• Financial ratios: min-max standardisation: 2006
• Source of financial data: ICAP DATA.
Overall, we examine 50 sectors and the number of the sample of SAs
and LTDs ranges from 17 thousand to 23.5 thousand during 2007-2015.
Calculation of the BIC Index scores
36BIC Index: November 2017

Weights of examined ratios and variables per dimension for the calculation of the BIC Index
The final BIC Index is calculated as follows:
37
• Current ratio………….………………………………33.3%
• Quick ratio…………………………..………….…….33.3%
• Difference between payment and collection days…………………….…..............………..………33.3%
Liquidity
(33.3%)
• Gross profit margin…………………….……….……20%
• Net profit margin………..………………………..….20%
• EBITDA margin…………………….……..…………….20%
• Return on total assets……………………………….20%
• Return on equity……..……………………………….20%
Efficiency
(33.3%)
• Debt to equity ratio…………………………..………..………..20%
• Equity to total assets ratio………………………..…………..20%
• Equity to fixed assets…………………………………………….20%
• Times interest earned ratio...................................…20%
• Interest expenses to turnover and operating revenue ratio………………………………………………..………………….20%
Capital structure
(33.3%)
BIC Index: November 2017

• Source of data: ICAP DATA.
• Processing of enterprise sample: we excluded enterprises that:
– had no available financial data;
– reported negative equity;
– had no data available on the number of personnel;
– showed no turnover;
– had no available data for the cost of goods sold.
• Given the emphasis on SMEs*, we selected the enterprises that metthe following criteria:
– the number of employees does not exceed 250 persons; while
– their turnover does not exceed €50 million.
Description of BIC Index methodology: Selection of enterprise sample
* In line with the definition of SMEs given by the European Commission (Commission Recommendation 2003/361/EC).
38BIC Index: November 2017

• We examine all sectors of economic activity, according to the
STAKOD'08 (=NACE rev. 2) classification, except for the following:
– Κ: Financial and insurance activities
– O: Public administration and defense; compulsory social security
– Τ: Activities of households as employers; undifferentiated goods – and
services – producing activities of households for own use
– U: Activities of extraterritorial organizations and bodies
Description of the BIC Index methodology: Financial criteria
39BIC Index: November 2017

The examined sectors of the domestic economy and presentation of the samples of SMEs, 2007-2015 (a)
BIC Index: November 2017 40Source: Piraeus Bank Research, ICAP DATA
Data extraction period: May of each year, except for 2015: October
Codes STAKOD'08 (=NACE rev. 2) 2007 2008 2009 2010 2011 2012 2013 2014 2015
Α Agriculture, forestry and fi shing 249 289 280 254 261 223 233 246 231
Β Mining and quarrying 89 111 108 94 85 73 83 83 70
10 Manufacture of food products 1,014 1,044 1,035 984 991 931 951 994 923
11 Manufacture of beverages 177 180 180 168 165 160 154 159 151
12 Manufacture of tobacco products 12 9 10 9 10 9 9 9 8
13 Manufacture of texti les 166 166 165 157 138 120 114 116 99
14 Manufacture of wearing apparel 301 297 284 261 248 213 206 204 184
15 Manufacture of leather and related products 49 49 43 42 43 37 38 39 37
16Manufacture of wood and of products of wood and cork, except furniture;
manufacture of articles of s traw and pla i ting materia ls121 123 121 103 92 80 78 83 75
17 Manufacture of paper and paper products 140 144 144 141 142 138 124 128 121
18 Printing and reproduction of recorded media 218 226 214 196 182 156 151 163 161
19 Manufacture of coke and refined petroleum products 28 26 26 28 26 27 24 24 26
20 Manufacture of chemicals and chemical products 221 223 231 224 224 213 203 206 191
21Manufacture of bas ic pharmaceutica l products and pharmaceutica l
preparations51 52 51 49 56 48 44 47 44
22 Manufacture of rubber and plastic products 276 275 279 264 243 226 235 232 202
23 Manufacture of other non-metal l ic minera l products 478 473 464 415 387 334 332 325 278
24 Manufacture of bas ic metals 69 71 69 67 65 58 56 55 43
25 Manufacture of fabricated metal products , except machinery and equipment 535 537 521 481 463 417 411 415 383
26 Manufacture of computer, electronic and optica l products 63 63 62 61 59 53 58 61 60
27 Manufacture of electrica l equipment 141 142 147 137 130 122 114 121 118
28 Manufacture of machinery and equipment n.e.c. 220 222 218 208 193 196 184 183 177
29 Manufacture of motor vehicles , tra i lers and semi-tra i lers 35 35 37 35 30 25 20 27 18
30 Manufacture of other transport equipment 31 30 30 27 29 23 22 18 19
31 Manufacture of furniture 225 213 213 189 159 131 121 123 109
32 Other manufacturing 148 147 150 138 135 122 118 115 108
33 Repair and insta l lation of machinery and equipment 58 58 52 42 57 50 52 57 72
BIC Index: November 2017 41Source: Piraeus Bank Research, ICAP DATA
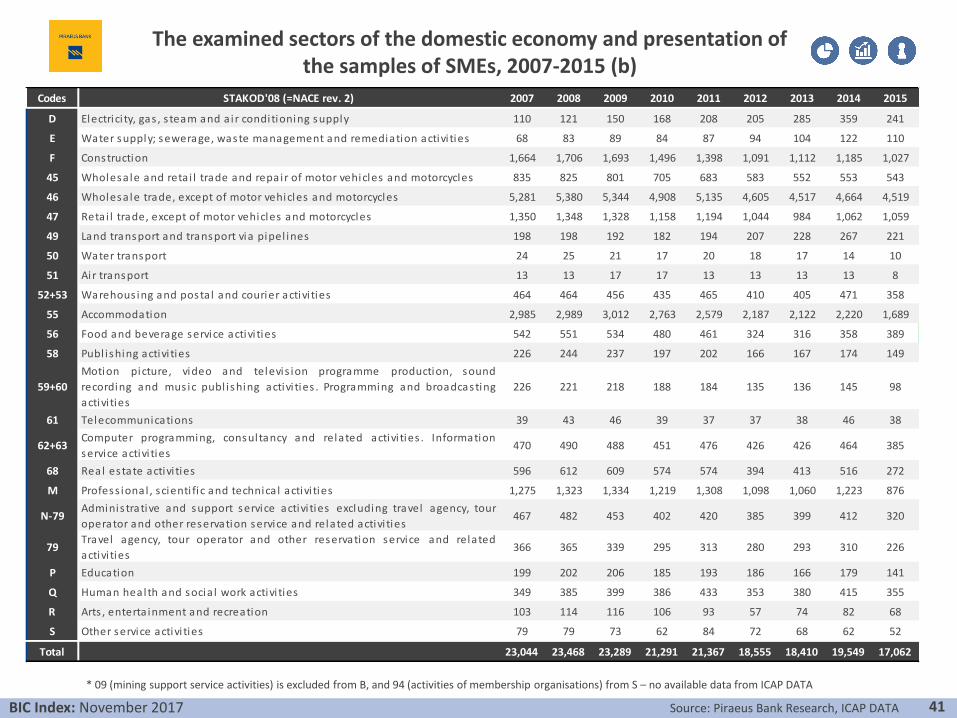
The examined sectors of the domestic economy and presentation of the samples of SMEs, 2007-2015 (b)
* 09 (mining support service activities) is excluded from B, and 94 (activities of membership organisations) from S – no available data from ICAP DATA
Codes STAKOD'08 (=NACE rev. 2) 2007 2008 2009 2010 2011 2012 2013 2014 2015
D Electrici ty, gas , s team and a ir conditioning supply 110 121 150 168 208 205 285 359 241
Ε Water supply; sewerage, waste management and remediation activi ties 68 83 89 84 87 94 104 122 110
F Construction 1,664 1,706 1,693 1,496 1,398 1,091 1,112 1,185 1,027
45 Wholesale and reta i l trade and repair of motor vehicles and motorcycles 835 825 801 705 683 583 552 553 543
46 Wholesale trade, except of motor vehicles and motorcycles 5,281 5,380 5,344 4,908 5,135 4,605 4,517 4,664 4,519
47 Retai l trade, except of motor vehicles and motorcycles 1,350 1,348 1,328 1,158 1,194 1,044 984 1,062 1,059
49 Land transport and transport via pipel ines 198 198 192 182 194 207 228 267 221
50 Water transport 24 25 21 17 20 18 17 14 10
51 Air transport 13 13 17 17 13 13 13 13 8
52+53 Warehous ing and postal and courier activi ties 464 464 456 435 465 410 405 471 358
55 Accommodation 2,985 2,989 3,012 2,763 2,579 2,187 2,122 2,220 1,689
56 Food and beverage service activi ties 542 551 534 480 461 324 316 358 389
58 Publ ishing activi ties 226 244 237 197 202 166 167 174 149
59+60
Motion picture, video and televis ion programme production, sound
recording and music publ ishing activi ties . Programming and broadcasting
activi ties
226 221 218 188 184 135 136 145 98
61 Telecommunications 39 43 46 39 37 37 38 46 38
62+63Computer programming, consultancy and related activi ties . Information
service activi ties470 490 488 451 476 426 426 464 385
68 Real estate activi ties 596 612 609 574 574 394 413 516 272
Μ Profess ional , scienti fic and technica l activi ties 1,275 1,323 1,334 1,219 1,308 1,098 1,060 1,223 876
Ν-79Adminis trative and support service activi ties excluding travel agency, tour
operator and other reservation service and related activi ties467 482 453 402 420 385 399 412 320
79Travel agency, tour operator and other reservation service and related
activi ties366 365 339 295 313 280 293 310 226
P Education 199 202 206 185 193 186 166 179 141
Q Human health and socia l work activi ties 349 385 399 386 433 353 380 415 355
R Arts , enterta inment and recreation 103 114 116 106 93 57 74 82 68
S Other service activi ties 79 79 73 62 84 72 68 62 52
Total 23,044 23,468 23,289 21,291 21,367 18,555 18,410 19,549 17,062
4b. Methodology of calculating BIC Rating System
BIC Index: November 2017 42

BIC Rating System*: distribution characteristics of the BIC Index scores 2007-2012
As shown in the histogram, the distribution of all scores of the BIC Index (50 sectors,
2007-2012) is almost symmetrical. It has an average of 36.07, a median of 36.52, a
standard deviation of 8.04. The maximum value is 73.66 and the minimum is 8.34 units.
Histogram and kernel distribution of the scores of BIC Index of 50 sectors for 2007-2012
BIC Index 2007-2012
Descriptive statistics of the BIC Index scores of 50 sectors for 2007-2012
* The methodology adopted is based on a similar methodology presented byKhramov V. and Lee J.R. (2013), The Economic Performance Index (EPI): an IntuitiveIndicator for Assessing a Country’s Economic Performance Dynamics in an HistoricalPerspective, IMF Working Paper WP/13/214, October 2013.
43Source: Piraeus Bank Research, ICAP DATA
N 300
mean 36.07
median 36.52
maximum 73.66
minimum 8.34
std. deviation 8.04
skewness 0.07
kurtosis 2.36
Descriptive Statistics
BIC Index: November 2017

BIC Rating System: threshold setting
In our approach, we divide the distribution into four (4) groups (quartiles) and
create a rating system, where the implemented score thresholds are close to the
distribution of the BIC Index scores 2007-2012.
BIC Index: November 2017 44Source: Piraeus Bank Research, ICAP DATA
PercentileBIC Index
Score
Implemented
score threshold
Top 25% >75 Above 40.401 40
Next 25% 50 Above 36.499 36
Next 25% 25 Above 31.643 32
Bottom 25% <25 all below

Structure of the BIC Rating System
In accordance with the implemented thresholds for the BIC Index scores, we have created
three (3) individual categories for each quartile, the intervals of which are symmetrical
around the median. Therefore, based on this approach, we present the following rating
system, which is based on the BIC Index scores 2007-2012.
BIC Rating System
BIC Index: November 2017 45
Score
rangeScore Rating
BIC Index
Performance
≥63 a+
[51-63) a
[40-51) a-
[39-40) b+
[37-39) b
[36-37) b-
[35-36) c+
[33-35) c
[32-33) c-
[24-32) d+
[16-24) d
<16 d-
<32 underperformers
≥40 outperfomers
36-40 good performers
32-36medium
performers
4c. Additional presentation of results, 2015
BIC Index: November 2017 46

BIC Index: further examination of sectoral performance, 2015
The sectors with the 5 largest positive and negative changes in the BIC Index ranking between 2014-2015
BIC Index: November 2017 47Source: Piraeus Bank Research, ICAP DATA
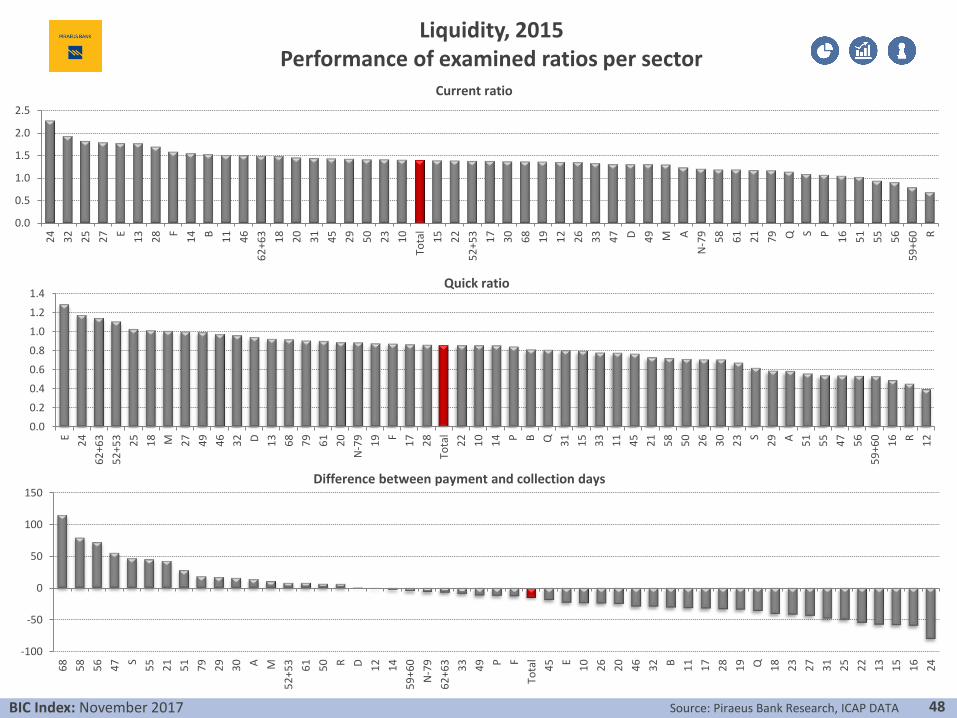
BIC Index: November 2017 48Source: Piraeus Bank Research, ICAP DATA
Liquidity, 2015Performance of examined ratios per sector
0.0
0.5
1.0
1.5
2.0
2.5
24
32
25
27 E
13
28 F
14 B 11
46
62
+63
18
20
31
45
29
50
23
10
Tota
l
15
22
52
+53
17
30
68
19
12
26
33
47 D 49 M A
N-7
9 58
61
21
79 Q S P 16
51
55
56
59
+60 R
Current ratio
0.0
0.2
0.4
0.6
0.8
1.0
1.2
1.4
E
24
62
+63
52
+53
25
18 M 27
49
46
32 D 13
68
79
61
20
N-7
9
19 F
17
28
Tota
l
22
10
14 P B Q 31
15
33
11
45
21
58
50
26
30
23 S
29 A 51
55
47
56
59
+60
16 R 12
Quick ratio
-100
-50
0
50
100
150
68
58
56
47 S
55
21
51
79
29
30 A M
52
+53
61
50 R D 12
14
59
+60
N-7
9
62
+63
33
49 P F
Tota
l
45 E
10
26
20
46
32 B 11
17
28
19 Q 18
23
27
31
25
22
13
15
16
24
Difference between payment and collection days

BIC Index: November 2017 49Source: Piraeus Bank Research, ICAP DATA
Efficiency, 2015Performance of examined ratios per sector (a)
0%
10%
20%
30%
40%
50%
60%
56
58
55
68
21 D 33
31
32
11 Q 50
62
+63 S
N-7
9 P 28
20 M 26
14
47
30
23
59
+60
Tota
l
18
52
+53
46 B 61 F
27
22 E
17
15
29
25
10
19
79
49
13
45 A 24
12
16 R 51
Gross profit margin
-25%
-20%
-15%
-10%
-5%
0%
5%
10%
15%
20%
D 50
33
29
32
N-7
9
30 P M 20 F
62
+63
19
55 E
22
21
25
68
17
11
Tota
l
79
10
46
28
49
47
45 A
52
+53
26
18
14 Q 56
12
24 S
27
51
61
31
58
23
15
13 B
59
+60
16 R
Net profit margin
-10%
0%
10%
20%
30%
40%
50%
60%
D 50
55
68
N-7
9
61
33
26
29
32 E
22
20
62
+63
11
30 F
25
28 P 21
18 M Q 31
Tota
l
12
17
19
15 A 23
10
49
52
+53
14
24
46 S
56
45
27
47
58
79
16
59
+60
51
13 B R
EBITDA margin

BIC Index: November 2017 50Source: Piraeus Bank Research, ICAP DATA
Efficiency, 2015Performance of examined ratios per sector (b)
-6%
-4%
-2%
0%
2%
4%
6%
8%
10%
33
50
29
32 P 79
19 M
62
+63
20
30
N-7
9
49
46
47
10
17
21 E
22
45 D F
25
Tota
l
11
28
56 A
52
+53
51
14
55
26
18
12 Q 24 S
27
68
61
31
58
23
15 B 13
59
+60
16 R
Return on total assets
-15%
-10%
-5%
0%
5%
10%
15%
20%
25%
30%
50
79
33
29 P M 32
62
+63
30
19
20
46
21
49
47
17
10
45
N-7
9 D E F
22
Tota
l
25
56
11
28 A 51
52
+53
26
14
55
18 Q 12 S
24
27
61
68
31
58
23
15
13 B R 16
59
+60
Return on equity
BIC Index: November 2017 51Source: Piraeus Bank Research, ICAP DATA
Capital structure, 2015Performance of examined ratios per sector (a)
0.0
0.5
1.0
1.5
2.0
2.5
3.0
3.5
24
68
13
27
N-7
9
22
55
18
25 R E F
12
33
32
19
29 S
23
49
20
Tota
l
52
+53
10
11
62
+63 Q 14
30
45 D 47
46 B 17
15
28
26
51
31
56 M P 50
16 A 21
61
58
59
+60
79
Debt to equity ratio
0%
10%
20%
30%
40%
50%
60%
70%
24
68
13
27
N-7
9
22
55
18
25 R E F
12
33
32
19
29 S
23
49
20
Tota
l
52
+53
10
11
62
+63 Q 14
30
45 D 47
46 B 17
15
28
26
51
31
56 M P 50
16 A 21
61
58
59
+60
79
Equity to total assets ratio
0%
50%
100%
150%
200%
46
27
32
24 F
79
14
62
+63
25
10
45 E
13
47
20
12
28
18
29 M 33
22
11
19
51
Tota
l
15
26
30
49
N-7
9
23 P 58
68
17 A S Q 31
21
52
+53
55
56 R 16
61 B D 50
59
+60
Equity to fixed assets ratio
Source: Piraeus Bank Research, ICAP DATABIC Index: November 2017 52
-5.0
0.0
5.0
10.0
15.0
20.0
25.0
33
56 P
N-7
9
62
+63
50
49 E
29
79 M 32
19
22
20
47
52
+53
25
61
11
10
30
17
21 D 24
Tota
l
46
51
55
18
26 F Q 45
68 S A 58
27
28
14
23
12
31
15
16
59
+60
13 R B
Times interest earned ratio
Capital structure, 2015Performance of examined ratios per sector (b)
0%
2%
4%
6%
8%
10%
12%
14%
56
51
33
79
49
47 P
52
+53
62
+63 B M 19
46
24 E
45
10
N-7
9 S
32
29
58
17
22
Tota
l
20
27
25
11
13
21
18
30 Q 14 A F
50
61
23
26
28
12
31
15
16 R 68
55
59
+60 D
Interest expenses to turnover and operating revenue ratio

BIC Index: November 2017 53
Disclaimer: This document is produced by the Economic Research & Investment Strategy Department of Piraeus Bank (hereinafter "the Bank"), which is supervised by the European CentralBank (ECB), in collaboration with the Bank of Greece and is sent or provided to third parties, without any obligation of its author. This document or any part of it should not be duplicated in anyway without the prior written consent of its author.The information or opinions included in this document are addressed to existing or potential clients in a general manner, without taking into account the particular circumstances, theinvestment objectives, the financial ability, the experience and/or knowledge of the potential recipients of this document and, as a result, they do not constitute or should not be consideredneither as a solicitation or offer for the conduct of transactions in financial instruments or currencies nor as a recommendation or advice for decision making in relation to those. Taking intoaccount the aforementioned, the recipient of the information contained in this document should proceed with his/her own research, analysis, and confirmation of the information which isincluded in this document and seek for independent and professional legal, tax and investment advice, before proceeding with any investment decision making.The information depicted in this document is relied on sources that the Bank considers to be reliable and is provided on an "as is" basis, however, the Bank cannot warrant as to their accuracyand completeness. The opinions and estimates herein are related to the trend of the local and international financial markets at the indicated date (prices at closing time) and are subject tochanges without any prior notice. Notwithstanding the above, the Bank might include in this document investment researches, which have been conducted by third persons. In this case, theBank does not modify those researches, but it presents them on an "as is" basis, therefore, no responsibility is assumed in relation to the content of the aforementioned investment researches.The Bank is under no duty to update the information contained in this document. Considering the above, the Bank, the members of its Board of Directors and the relevant persons assume noresponsibility for the information included in the present document and/or for the outcome of any investment decisions made according to such information.Piraeus Bank Group is an organisation with a significant presence in the Greek market and an increasing one in the international markets providing a wide range of investment services. In thecontext of investment services offered by the Bank and/or any other Piraeus Group companies in general, there might be cases whereby conflict of interests may arise in relation to theinformation provided herein. Reference should be made to the fact that the Bank, the relevant persons and/or other Piraeus Group companies indicatively:a. Are not subject to any prohibition in relation to trading on own account or in the course of providing portfolio management services prior to the publication of thisdocument or the acquisition of any shares prior to any public offering or the acquisition of any other securities.b. May offer upon remuneration investment banking services to issuers for whom this document may contain information.c. May participate to the issuers' share capital or acquire other securities issued by the aforementioned issuers or attract other financial interests from them.d. Might provide market making or underwriting services to issuers that might be mentioned in this document.e. Might have published papers the content of which is different or incompatible to the information presented herein.The Bank as well as the other Piraeus Group's companies have enacted, implement and maintain an effective policy, which prevents circumstances that may give rise to conflicts of interestsand the dissemination of any information among the departments ("chinese walls") and they also constantly comply with the provisions and regulations relevant to inside information andmarket abuse. Also, the Bank confirms that it doesn't have any kind of interest or conflict of interest with a) any other legal entity or person that could have participated in the preparation ofthe present document and b) with any other legal entity or person that couldn't have participated in the preparation of the present document, but had access to it before its publication.It is duly stated that: the investments described in the present document include investment risks, among which the risk of losing the entire capital invested. In particular, it is stated that;a. The figures presented herein refer to the past and that the past performance is not a reliable indicator of future performance.b. In case the figures refer to simulated past performance, that past performance is not a reliable indicator of future performance.c. The return on investments might be positively or negatively affected as a result of currency fluctuations, in case the figures are denominated in a foreign currency (otherthan Euro).d. Any forecasts in relation to future performance, may not be a reliable indicator of future performance.e. The tax treatment of the information as well as transactions pertained in this document, depends on each investor's individual circumstances and may be subject tochange in the future. As a result, the recipient should seek for independent advice in relation to the applicable tax legislation.The distribution of the present document outside Greece and/or to persons governed by foreign law may be subject to restrictions or prohibitions according to the applicable legislation.Therefore, the recipient of the present should seek for independent advice in relation to the applicable legislation, in order to look into such restrictions and/or prohibitions.