small and medium enterprise development experience and policy in
TRANSCRIPT
For comments, suggestions or further inquiries please contact:
Philippine Institute for Development StudiesSurian sa mga Pag-aaral Pangkaunlaran ng Pilipinas
The PIDS Discussion Paper Seriesconstitutes studies that are preliminary andsubject to further revisions. They are be-ing circulated in a limited number of cop-ies only for purposes of soliciting com-ments and suggestions for further refine-ments. The studies under the Series areunedited and unreviewed.
The views and opinions expressedare those of the author(s) and do not neces-sarily reflect those of the Institute.
Not for quotation without permissionfrom the author(s) and the Institute.
August 2004
The Research Information Staff, Philippine Institute for Development Studies3rd Floor, NEDA sa Makati Building, 106 Amorsolo Street, Legaspi Village, Makati City, PhilippinesTel Nos: 8924059 and 8935705; Fax No: 8939589; E-mail: [email protected]
Or visit our website at http://www.pids.gov.ph
Small and Medium EnterpriseDevelopment Experience and Policy
in Japan and the Philippines:Lessons and Policy Implications
Ronald Tamangan, Frances Josef and Cielito HabitoDISCUSSION PAPER SERIES NO. 2004-30

List of Projects under the Japan-Philippines Economic Partnership Research Project
Title of the Project Proponent
Impact analysis on the whole economy 1. Situationer on Japan-Philippines Economic Relations Erlinda Medalla 2. Philippine-Japan Bilateral Agreements: Analysis of Possible
Effects on Unemployment, Distribution and Poverty in the Philippines Using CGE-Microsimulation Approach
Caesar Cororaton
Impact analysis on specific sectors/ concerns 3. An Analysis of Industry and Sector- Specific Impacts of a
Japan-Philippines Economic Partnership AIM Policy Center
(Royce Escolar) 4. Prospects and Problems of Expanding Trade with Japan: A
Survey of Philippine Exporters Rosalina Palanca-Tan
5. Towards a Strategy for Manufactured Exports to Japan Peter Lee U and Ferdinand Maquito 6. Small and Medium Enterprise Development Experience and
Policy in Japan and the Philippines: Lessons and Policy Implications
Cielito F. Habito
7. Developing the Japanese Market for Philippine Tourism and Retirement Services: Prospects and Impediments
Winston Conrad Padojinog and Cherry Lyn Rodolfo
8. Prospects of Services Trade Liberalization in Japan-RP Bilateral Agreement
Gloria Pasadilla
9. Movement of Natural Persons Between the Philippines and Japan: Issues and Prospects
Tereso S. Tullao Jr.
10. Toward a Philippines-Japan Economic Partnership in Agriculture
Amelia Bello and Zenaida Sumalde
11. Philippine-Japan Economic Linkage: A Case Study of Cebu Victorina Zosa Special Studies 12. A Comparative Study of the Bilateral FTA Arrangements:
Applications to the Philippines John Lawrence Avila
13. Philippines-Japan Economic Partnership: Where is the Philippines in Japan's Plan?
Lydia N. Yu-Jose
14. Understanding Japan’s Motives for Pursuing an Economic Partnership Agreement with the Philippines
Ronald Rodriguez
15. Exploring Potentials of a Japan-Philippine Economic Partnership in Human Resource Development
Jose V. Camacho Jr., Jhoanna Alcalde, Nino Manalo, Rodger Valientes
16. The Dynamics of Philippines-Japan Economic Cooperation: The Case of Japan’s Official Development Assistance (ODA) in the Philippines
Jose V. Camacho Jr. Agham C. Cuevas
17. Preferential Rules of Origin for the Japan-Philippine Economic Partnership: Issues and Prospects
George Manzano
18. Philippine - Japan Free Trade Agreement: Analyzing the Potential Impact using a Computable General Equilibrium Model
Taeko Yasutake
Small and Medium Enterprise Development Experience and Policy in Japan and the Philippines: Lessons and Policy Implications
Ronald Tamangan, Frances Josef and Cielito Habito Ateneo Center for Economic Research and Development
Ateneo de Manila University
Paper prepared for the Japan-Philippines Economic Partnership Research Project
February 2004
ii
Table of Contents
Abstract v Executive Summary vi Introduction 1 1. Operational definitions 2 2. Overview of Philippine and Japanese SMEs 3 3. SMEs and their Contribution to the Economy 8 4. The Philippine SME Development Policy Experience 10 5. The Japanese SME Development Experience and the Historical Policy
Environment 23 6. Philippine SMEs in the Global Economy 35 7. Trade Cooperation with Japan: Policy Implications 44 Bibliography 46 Tables 49

iii
List of Tables
Table 1-1 Summary of Main Definitions of SMEs in ASEAN-5 49 Table 2-2 SME Definition by Employment and by Asset Size 49 Table 2-1 Number of Establishments, by Size Category and Industry: 2000 and 2002 50 Table 2-2 Share of Establishments to Total, by Size Category and Industry: 2000 and
2002 51 Table 2-3 Growth of Establishments, by Size Category and Industry: 2000 and 2002 52 Table 2-4 Number of Employees, by Size Category and Industry: 2000 and 2002 53 Table 2-5 Share of Employment to Total, by Size Category: and Industry 2000 and
2002 54 Table 2-6 Number of Employees, by Size Category and Industry: 2000 and 2002. 55 Table 2-7 Number of Establishments, by Size Category and Region: 2000 and 2002 56 Table 2-8 Share of Establishments to Total, by Size Category and Region: 2000 and
2002 57 Table 2-9 Growth of Establishments, by Size Category and Region: 2000 and 2002 58 Table 2-10 Number of Employees, by Size Category and Region: 2000 and 2002 59 Table 2-11 Shares of Employment to Total, by Size Category and Region: 2000 and 2002 60 Table 2-12 Growth of Employment, by Size Category and Region: 2000 and 2002 61 Table 2-13 SME's Export Orientation, 1994 62 Table 2-14 Export Orientation of SMEs and Large Enterprises With and Without Foreign
Ownership, 1994 63 Table 2-15 Number of business enterprises by industry and size (private), Selected Years 65 Table 2-16 Number of persons engaged by industry and size (private), Selected Years 66 Table 2-17 Number of Employees By Industry, 1999 67 Table 2-18 Main Financial Indicators, Profit Status and Main Financial Ratios of
Business Corporations for All Industries, Selected Years 67 Table 2-19 Main Financial Indicators, Profit Status and Main Financial Ratios of
Business Corporations for Manufacturing, Selected Years 68 Table 2-20 Main Financial Indicators, Profit Status and Main Financial Ratios of
Business Corporations for Wholesaling/Retailing, Selected Years 68 Table 2-21 Main Financial Indicators, Profit Status and Main Financial Ratios of
Business Corporations for Services, Selected Years 69 Table 5-1 Summary of Basic Differences Regarding SME Basic Law 70 Table 5-2 Number of Clusters, Average Cluster Size, and Average Firm Size, by
Industry, 1996 71 Table 5-3 Summary of Cluster Development Experience of 14 Japanese Locations 72 Table 5-4 Sources of Advantage in Japan's Clusters, by Industry (response rate in
percentage) 73

iv
Table 6-1 Total Philippine Exports, the Philippines Exports to Japan: Shares and Growth Rates, 1998-2002. 74
Table 6-2 Philippine Exportable Products to Japan: Japan's Import Index > 1and Philippine RCA > 1, 1999. 74
Table 6-3 Philippine Exportable Products to Japan: Japan's Import Index > 1and Philippine RCA < 1, 1999. 75
Table 6-4 Share of Philippine Exports in Japan's Imports, 2000.In Percent 76
v
Small and Medium Enterprise Development Experience and Policy in Japan and the Philippines: Lessons and Policy Implications
Ronald Tamangan, Frances Josef and Cielito Habito
Ateneo Center for Economic Research and Development Ateneo de Manila University
ABSTRACT
The role of SMEs in economic development has been well recognized. SMEs have been regarded as an important contributor to employment generation and wealth creation in a developing economy. Ironically, however, SMEs have been discriminated against considering a raft of issues. In almost all countries, there is either a separate policy statement for SMEs (or for micro or cottage industries) or a general industrial policy statement with some portions of it relating to SMEs. Philippine SME development policies that have been set in place may have been in light of major Philippine industrial development policies. Historically, the common thread that binds Philippine industrial policies has been the emphasis on policies regarding expansion of exports, increases in foreign investments, development of the private sector, and enhancement of domestic linkages. Moreover, there might have been industrial policies that may have undermined SME development because of inherent scale biases. Inroads regarding SME development have been realized in the economy thus far, but Philippine SMEs can still derive some lessons from the Japanese experience, particularly Japan’s practices regarding subcontracting and clustering. There is also a need to realize that it is now insufficient to address commonplace themes and roadblocks experienced by Philippine SMEs identified through historical experiences. Nowadays, it is inescapable to acknowledge that concerns regarding SMEs will have to be considered and addressed in light of globalization, which is most easily comprehended in terms of international trade. Bilateral trade cooperation is mutually beneficial. One way for Japan to encourage Philippine SME development, as part of bilateral trade cooperation, is to identify and open some Japanese markets to Philippine SME exports. Hence, sector (or even sub-sector) identification in general, and product identification in particular, is a necessary first step to this end.
Keywords: small and medium enterprises (SMEs), bilateral agreement, industrial policies

vi
EXECUTIVE SUMMARY
Small and medium enterprises (SMEs) have been recognized as the seedbed of employment, particularly in a developing economy such as the Philippines. Thus, SMEs have been regarded as having an important role in economic development. However, historical experience points to neglect and discrimination against them in terms of government attention, access to finance, management and marketing expertise and technology, to name a few. This has been particularly true in developing economies where large enterprises have usually been given the primary role in economic and industrial development.
The study follows the asset-based official definition as approved by the Small and Medium Enterprise Development Council (SMEDC) Resolution No. 1, Series of 2003. However, primary data gathered from the National Statistics Office (NSO) utilized the employment criterion. This criterion appears more practical for our purposes as it lends itself readily to international comparisons. Secondary data taken from Japanese sources may have also operationalized SMEs differently. With differences in operational definitions within an economy and even across economies, the vast majority of SMEs are relatively small and most SMEs employ less than 100 people. This reality, therefore, permits broad comparisons across economies despite internal operational differences among them. Philippine SMEs
Micro-enterprises dominated Philippine establishments in 2000-2002 with an average share of 91.5 percent. SMEs followed with an average share of about 8 percent, while the combined contribution of micro-enterprises and SMEs accounted for about an average of nearly 99 percent.
Most of the Philippine establishments during this time were into wholesale and retail trade (about 53-54 percent) and manufacturing (a little over 15 percent). These two sectors accounted for nearly 70 percent of the total Philippine establishments. Furthermore, nearly 60 percent of total employment was accounted for by both sectors.
Employees of micro-enterprises accounted for the largest share to total employment during this time, averaging about 38 percent of the total. SMEs accounted for about 24 percent on average. Micro, small and medium enterprises' collective share to total employment was an average of about 70 percent of the total employment, while micro, small and large enterprises accounted for an average of about 93-94 percent of the total (medium enterprises only accounted for about 6-7 percent on average during the period).
The concentration of the number of establishments and employment were in three regions, namely, NCR, Southern Tagalog and Central Luzon. About one-fourth of total establishments were found in the NCR, which together with Southern Tagalog and Central Luzon accounted for a little more than half of the total. These three regions also significantly contributed to the total number of establishments categorized by size. Employment was similarly

vii
concentrated in the three regions, accounting for about two-thirds of total employment. The NCR’s share to total employment was an average of about 40 percent.
The manufacturing sector has had the largest share to total exports and largest contribution in terms of census value added. Most of the export-oriented SMEs in the Philippines were under this sector. Tecson (2001) presented export-oriented SMEs with foreign ownership and without foreign ownership, using a 1994 special tabulation from the National Statistics Office. Export-oriented SMEs with foreign ownership were the following subsectors: furniture and fixtures; non-ferrous metal products; electrical machinery; professional and scientific equipment printing and publishing; paper and paper products; iron and iron products; wood and cork products; other manufactures; and wearing apparel. There were also export-oriented SMEs without foreign ownership. These SMEs were under the following subsectors: furniture and fixtures; electrical machinery; food; and leather and leather products. Japanese SMEs
SMEs have infused dynamism into the Japanese economy for many years now. Their characteristic flexibility and versatility have allowed for their quick adjustment in face of changing business environments. SMEs accounted for around 99 percent of total Japanese enterprises during the period 1986-1999. Likewise, SMEs’ share to total employment had also been consistent averaging nearly 80 percent.
The SMEs’ value added increased during the period 1998-2000. The value added coming from large enterprises had likewise increased. However, although the value added had generally increased, the contributions of SMEs and large enterprises to total manufacturing value added were decreasing. SMEs' contribution to the total value added was about 22 percent on average, while the contribution coming from large enterprises was about 16.5 percent on average.
Most analyses about SMEs contribution to economic development have focused on the manufacturing sector. This sector was the third largest employer of labor in 1999, contributing about 21 percent to total employment. Furthermore, SME employment in this sector accounted for over two-thirds of the total sectoral employment at 65 percent. Aside from this, the sector had the greatest value added compared to the other sectors of wholesaling and retailing, services, and construction.
The manufacturing value added had been increasing during 1998-2000, which was because of the increasing value added of both SMEs and large enterprises. Nevertheless, the contribution of SMEs to manufacturing value added had been decreasing. Still, however, SMEs contributed significantly to manufacturing value added: SMEs contributed an average of 28 percent, while large enterprises contributed an average of 19 percent.
The wholesaling/retailing had also experienced increasing value added during this period. SMEs had a higher average contribution to total industry value added: 13.5 percent on average for SMEs and 10.3 percent on average for large enterprises. Furthermore, the contribution to total value added had been decreasing for both SMEs and large enterprises.
viii
Similarly for the services sector, the period was witness to an increasing value added for
both SMEs and large enterprises. SMEs had a higher share to total industry value added at 30.6 percent on average, while that of large enterprises was at 22.3 percent on average. Moreover, large enterprises experienced increasing shares during this period.
Japanese SMEs have also been engaged in subcontracting arrangements. In the 1987 survey done by the Small and Medium Enterprises Agency (SMEA), about 55.8 percent of firms engaged in manufacturing worked as subcontractors. Large firms were dependent on the SME subcontractors for parts, components, and processes which were either too costly for them to undertake on their own or are too diverse to be handled by management. SMEs also have had an important position in a number of regional production networks, or clusters. As a matter of fact, subcontracting arrangements were found to be more successful in such clusters. The Philippine SME Development and Policy Experience
SME policies that have been set in place may have been in light of major industrial development policies of the Philippines. In almost all countries, there is either a separate policy statement for SMEs (or for micro or cottage industries) or a general industrial policy statement with some portions of it relating to this sector. The common thread that binds Philippine industrial policies across the time periods was the emphasis on policies regarding expansion of exports, increases in foreign investments, development of the private sector, and enhancement of domestic linkages.
The 1960s were witness to sparse policies and programs focused on SME development. There were only two notable policies/programs that were centrally focused on small enterprises, namely (1) the Cottage Industries Act, which recognized the importance of small enterprises in the grand scheme of industrial development, and (2) the training and service provision programs facilitated by the University of the Philippines to address the growing needs of small enterprises.
Formal planning regarding SME development started in the 1970s. For the first time, SMEs were given emphasis in the Philippine Development Plan (1972-1976) which included SME support or developmental programs on financial, technical and coordination assistance. SME Development strategies in the 1980s were more focused. In 1987, the Omnibus Investment Act was enacted as the key legislation for investments generation, whether foreign or local. Fiscal and other forms of incentives were given to projects identified under the Investment Priority Plan (IPP). A major policy of the Act was to encourage SMEs by providing assistance in the preparation of feasibility studies and sourcing of financial packages. Investments locating in "less developed areas" were given additional incentives. During the period 1988-1992, the Aquino administration set forth focal development strategies on financing, market improvement, technology improvement, technology transfer, and entrepreneurship.
The general SME development strategies adopted starting in the 1990s were on market access, export expansion, identification of specialization, entrepreneurship and management,
ix
technology and quality systems upgrade and domestic linkages. One important piece of legislation was the Magna Carta for Small Enterprises, passed into law in 1991 (RA 6977) and amended in 1997 (RA 8289). The Magna Carta was a landmark legislation, which reflected the objective to foster a dynamic SME sector, particularly rural and agri-based manufacturing ventures. The Magna Carta provided for 1) the creation of the Small and Medium Enterprise Development Council (SMEDC), the primary agency responsible for the facilitating and coordinating all national SME programs including programs with foreign funding, 2) the creation of the Small Business Guarantee and Finance Corporation (SBGFC), which provides alternative modes of financing for small enterprises, including but not limited to direct and indirect project lending, venture capital, financial leasing, secondary mortgage and rediscounting of loan papers to small businesses, and 3) the eight- percent mandatory bank channeled loan to SMEs (6 percent for small enterprises and 2 percent for medium enterprises).
This period was also witness to the first Republic Act that acknowledged the role of women entrepreneurs. An act providing assistance to women (RA 7882) was passed into law on February 20, 1995. This particular legislation recognized the special role of women in development and supported women entrepreneurs who were engaged in manufacturing, processing, service and trading businesses.
Considering all the inroads regarding formal SME development programs, various challenges in the area of human resource development, technology and R&D, and access to financing, to name but a few, remained. These concerns were addressed in the Philippine SME Development Strategy (1998), which had four strategic imperatives in SME development: 1) narrowing the focus on identified priority sectors; 2) promoting domestic linkages (backward and forward); 3) strengthening technology and R&D initiatives; and 4) improving access to finance.
The SMEDC had finalized the SME development strategy in 2000 that defined specific actions to address SME concerns regarding finance, information dissemination, information dissemination, marketing, exports promotion, human resource development and technology.
SMEs have remained challenged in the areas of human resource development, technology, access to financing, and in R&D. To address some of these concerns, the 2001-2004 Medium Term Development Plan (MTDP) outlines the government strategies to further accelerate development of small enterprises.
The most recent SME Development Plan of 2003-2004 acknowledges that the Philippine SMEs have to play in a global terrain. The general aim is to have a vibrant SME sector that provides strong domestic supply base for globally competitive industries. This shall be achieved through graduating micro and small enterprises to higher levels of business undertakings, upgrading their productivity and value-added capabilities, and strengthening of 20 accessible SME Centers nationwide. The highlights of the plan include training/HRD, market development, product development/technology intervention, advocacy for enabling environment, and financing
The Long-Term SME Development Plan has also been formulated to boost SME performance in the long term and lay the groundwork to develop sustainable and globally

x
competitive SME sector well beyond the programs already in place. More concretely, the Plan aims to increase the contribution of SMEs to the economy (employment, value added and exports) by at least 10 percent in the short to medium term (2004-2006) or double the growth of the Gross National Product (to truly claim as the economic engine of growth). The Japanese SME Development and Policy Experience
Japanese economic history validates the success of Japanese SMEs in having kept the
economy afloat. The strength of the policies of the Japanese government regarding SMEs was in the policies’ reactive nature. That is, appropriate and timely policies were implemented. Reconstruction period (1945-1954) Most of the Japanese SMEs began their operations in the period 1945-1954. Since large enterprises took a longer time to restart operations, SMEs reacted faster to provide the needs of the people during that time.
SMEs faced numerous external difficulties during this time. As a first measure to aid SMEs, the Japanese government established the Small and Medium Enterprise Agency (SMEA) in 1948. With the SMEA in place, the basic tools relating to financial resource, cooperatives, management consulting and guidance, and taxation to aid SMEs were carried out.
For sources of loans, the National Life Finance Corporation was established in 1949 to cater to SMEs by supplying short-term non-collateralized loans. The Japan Finance Corporation for Small Business was established in 1953 with government equity to supply fixed, long-term and low-interest funds for SMEs. Aside from these, the Small and Medium Enterprise Credit Insurance Law and the Credit Guarantee Association Law were passed in 1950 and 1953, respectively, to strengthen the financial weakness of SMEs. In this connection, the Law on the Cooperative Association of Small and Medium Enterprises was also passed in 1949 with the purpose of correcting the social and economical disadvantages of SMEs. With this law, SMEs proceeded to form cooperatives and groupings which increased their competitive stance in relation to the bigger enterprises.
Regarding management consulting and guidance, the first three measures carried out were the Management Consulting System (1948), the Consulting Desk for SMEs (1948), and the Registration System of SMEs Consultant (1952), all of which were deemed important for modernizing and rationalizing SMEs management. To improve the financial accounting of the SMEs, the “Blue-Returns” system of taxation was introduced in 1949. Under this system, SMEs were given tax merits if their tax returns were made with a certain quick formula of bookkeeping. The High Growth Period, the First Stage (1955-1962)
In the course of this fast growth period, large enterprises and SMEs went in two different paces of growth in terms of productivity, wages, technology and financing ability. As such, the

xi
period was also characterized by the “dual industrial structure” of the ‘advanced large-scale enterprises’ on one hand, and the ‘delayed SMEs’ on the other.
In the area of financial support for SMEs, the Law on Financial Assistance for Promoting Small and Medium Enterprises was enacted in 1956 with the aim of improving the productivity of SMEs through the usage of modern equipment. The Law Concerning the Organization of Small and Medium Enterprises was enacted in 1957 to establish an organization that would help businesses adjusts their activities. Finally, two laws relating to management consulting and guidance for SMEs were passed. The first law aimed to broadly diffuse management programs by the government (the Law on Organizing Commerce and Industry Association enacted in 1960). The second had the objective of preparing a systematic and efficient scheme of guidance for the rationalization of management and SMEs’ technological improvement whereby municipal governments play an active role.
Although subcontracting improved the efficiency and progress of technology of both the large enterprises and SMEs through specialization of tasks, many parent enterprises took advantage of their predominant position over subcontractors (SMEs) and engaged in unfair practices. To prevent abuse by large enterprises, the Law on the Prevention of Delay in the Payment of Subcontracting Charges and Related Matters (the Subcontractors’ Payment Law) was enacted in 1956. The High Growth Period, the Second Stage (1963-1972)
Measures towards SME development during this period were geared towards upgrading the industrial structure and strengthening the international competitiveness of SMEs.
The first law to be enacted during this period was the SME Basic Law which aimed to eliminate perceived disadvantages faced by SMEs, support their self-help efforts, improve their productivity and trading conditions, as well as improve the social status of their employees. The SME Basic Law was important in that it stipulated general descriptions of SMEs and consolidated in a single document all preceding laws. Another important law enacted during this period was the SME Modernization Promotion Law (or simply, the Promotion Law). This Law aimed to improve the productivity of SMEs by implementing a modernization plan for industries that either involved SMEs in a higher percentage or those wherein the productivity of those SMEs might require important measures for general upgrading in terms of industrial structure and competitiveness. In connection with this objective, the Law on Financial and Other Assistance for Small Business Modernization was also promulgated in 1963. This Law was to facilitate the promotion of upgrading industrial structure (i.e. joint businesses or grouping of factories or stores) and modernization of equipment for cooperatives. A loan program for upgrading expenditure was also made available by the Japan Small Business Promotion Corporation which was established in 1967.
The Law on Ensuring the Receipt of Orders from the Government and Other Public Agencies by Small and Medium Enterprises, was enacted in 1966 with the aim of correcting the business disadvantages of SMEs in response to the recession that developed in 1964. As regards
xii
correcting the disadvantages of SMEs, amendments on the Law on the Prevention of Delay in the Payment of Subcontracting Charges and Related Matters were passed to ensure that subcontracting enterprises were well protected from abusive parent enterprises. The Law on the Promotion of Subcontracting Small and Medium Enterprises was enacted in 1970. This Law aimed to modernize subcontracting enterprises because of the increasing importance of subcontracting arrangements brought about by heightened international competition.
There were also two measures carried out during this period. The first measure was in the area of improving their management skills through the provision on management consultant system in the SME Basic Law. And the second measure was to provide retirement money for the small-enterprise entrepreneur through the Small-Enterprise Mutual Relief Projects Law of 1965.
Finally, in response to the needs for a system to assist SMEs facing difficulty in obtaining funds from the open stock market, the Small Business Investment Company Limited Law was enacted in 1963, which made public capital available for long-term use. The Stable Growth Period (1973-1984)
Three institutions were established during this period. The Institute for Small Business Management and Technology was established in 1980 with the aim of developing human resources. The Information Center for Small and Medium Enterprises was opened in the Small Business Corporation to provide information services for management improvement. And the Regional Information Centers for Small and Medium Enterprises were also opened in prefectures with the aim of providing information and improving SMEs’ management skills. Transition Period, the First Stage (1985-1999)
With the start of the yen’s revaluation in 1985 and with an ongoing depression, the competitiveness of certain types of industries and particular regions where such industries agglomerated started to fall apart. Thus, the Temporary Law concerning Measures for Changing Business for Specific Small and Medium Enterprises was enacted in 1986. The objective was to specify the type of industries that would receive special aid during this period as well as to provide assistance to those who wanted to convert their businesses during this sluggish period. Aside from this, the Temporary Law Concerning Measures for Small and Medium Enterprises of Specific Regions was also enacted to promote the conversion of SMEs in certain regions heavily affected by the depression and yen revaluation.
The decrease in the start-up rate and the increase in the closure rate as well as the increasing unemployment during this period also became subjects of concern. As an attempt to correct this problem, the Temporary Law Concerning Measures for the Promotion of the Creative Business Activities of Small and Medium Enterprises was enacted in 1995. The Temporary Law intended to stimulate SMEs and individuals entering into new businesses or investing in research and development without necessarily specifying a particular type of industry.

xiii
The SME Modernization Law was enacted in 1963 to encourage the modernization of equipment of SMEs, among others. The aforementioned law was combined with the Temporary Law Concerning Measures for Smooth Adaptation to Structural Changes in Economy by Advancement of Specific Small and Medium Enterprises to New Fields, etc., which was enacted in 1993 with limited subjects of assistance. The combined law was called the new Law on Supporting Business Innovation of Small and Medium Enterprises. This new law was enacted in 1999 with the objective of aiding SMEs compete in the new environment that require advanced information technology, reduced costs, greater product quality and improved marketability of products. Transition Period, the Second Stage (2000-present )
Modern policies now build on the strengths of SMEs that are mainly due to their mobility and flexibility in providing small-lot production of a variety of products. The recent decline of the start-up rate, which has now gone even below the closure rate, provokes concern that it may hamper the metabolism and labor-absorbing capacity of the economy. It was against this backdrop that the new SME Basic Law (which was a revision and restructuring of the conventional SME policies drawn from the SME Basic Law) was drafted in December 1999. The key thrusts of the new Basic Law for SMEs were: 1) to promote self-sustaining enterprises by promoting business innovation and new business start-ups; 2) to enrich business resources by strengthening the management base of SMEs; and 3) to offer a safety net through facilitating adaptation to economic and social changes.
For the first goal, it was acknowledged that the economy could be revitalized by venture businesses led by entrepreneurial managers. However, there was also recognition that the risks for creating new businesses were great and that policies should be made to support daring enterprises in their self-help efforts. It was for these reasons that new capital markets called “MOTHERS” started operating in the Japanese financial market in November 1999 and “Nasdaq Japan” in June of 2000. Both measures expanded options for SMEs in raising funds for their business activities. Moreover, to promote the development of the bond market available to SMEs, a credit guarantee system for the issue of corporate bonds or privately placed bonds by SMEs was introduced. Finally, to support technological development, the government provided subsidies for new business development and spent money on SME-related research. Furthermore, the Small Business Innovation Research System (SBIR) provided support to SMEs up to the commercialization phase.
The goal of strengthening SMEs’ management base would be attained through government programs that would supplement SMEs’ weak managerial resources and improving SMEs’ business environment. The Japanese government established support centers that provided the so-called “One-Stop” assistance services in terms of both funds and non-material services on each national, prefectural, and local level. The government has also strengthened the position of the SME Management Consultant system in the area of human resource development. Previously, the system gave complementary assistance in public business diagnoses; however, the strengthened system could certify private business consultants with wide-ranging knowledge of SME businesses in general and advanced consultation skills.

xiv
Notwithstanding the capability of SMEs to be self-sustaining, the government recognizes
the occurrence of unexpected events outside the control of SMEs. These events may damage SMEs’ businesses through no fault of their own. In such cases, the government carries out emergency relief measures as a form of safety net to stabilize business conditions. Among these measures are long-implemented financial measures against disasters and measures to prevent chain-reaction bankruptcies. The government has also sped up corporate rehabilitation procedures by reviewing the Bankruptcy Law, which was criticized as being difficult to apply to SMEs. Aside from these, a new corporate rehabilitation scheme, the Civil Rehabilitation Law, was also introduced. The government as of late has plans of further increasing and strengthening safety measures, particularly in the areas of finance and credit guarantee. Philippine SMEs in the Global Economy and Policy Implications
Philippine SMEs have had consistent themes in terms of concerns and roadblocks throughout the years. These themes fall broadly under organization and management structure, market orientation, type of labor, sourcing of inputs, sources of capital and sources of technology. These themes have been regarded by many as primary factors in the rather static state of SMEs across time. Furthermore, domestic SME issues and concerns are now not entirely separate from issues related to globalization and trade liberalization. With globalization, priority measures have been considered to strengthen the SME sector.
The irreversible and inevitable process of globalization has enhanced economies’ opportunities for success, but it has also posed new risks to developing countries. As globalization is likely to continue at an accelerated pace, the implications for industrial development and restructuring in line with the requirements of globalization are wide-ranging and include both opportunities and challenges. That having been said, it should be noted, especially in the context of promoting SMEs through the bilateral partnership and cooperation with Japan, that a critical long-term policy challenge is how to manage globalization and creating new sources of growth by increasing SME exports.
Evidence reveals that about a small percentage of manufacturing SMEs are engaged in international activity. Economically they are important because they significantly contribute to exports, and thus to GDP. In theory, open regionalism will open further opportunities for increased trade, and thus for even more contribution to economic growth. In practice, there is a long way to go to free trade. But inroads have been experienced in terms of reduction of trade impediments to these SMEs. The main issue for SMEs is how to identify and take advantage of opportunities and how to resolve or avoid impediments quickly and cheaply.
One way by which trade cooperation with Japan can potentially help Philippine SMEs is
by way of Japan’s opening its doors to Philippine exports, particularly those products produced by SMEs. However, Philippine-Japan bilateral trade statistics presented in the study do not appear to be encouraging to Philippine SMEs. This is because exportable products, and even potential exportable ones, appear to be generally produced by large manufacturing firms. This is
xv
true for products of industrial manufactures, particularly electronics, which account for a large percentage of Philippine exports to Japan. In addition, the fresh produce and vegetables and marine products that Japan imports from the Philippines come mainly from large enterprises.
The economic benefits of more active intra-regional trade and investment flows in general, and bilateral trade agreements in particular, as means to spur the growth of a modern, export-oriented SME sector remains to be fully realized. The pursuit of regional cooperation in SME development is based on the premise that this will enable SMEs to take advantage of economies of scale and scope. Local cooperatives have historically been viewed as an instrument that allows SMEs to achieve economies of scale in marketing and purchasing. Regional cooperation can extend this process, enabling local SMEs to effectively take advantage of scale economies. Subcontracting systems at a regional level can be employed, thus promoting closer interface and interdependence between large enterprises and SMEs. However, it is essential to identify priority industries in formulating cooperation measures.
Thus, it is first necessary to identify specific SME industry with export potential. Once such identification is done, each industry could be closely evaluated to see where and how it needs assistance in terms of product development, standardization, technology upgrading and skills development. Furthermore, once these industries are identified for assistance, initiatives could be launched to develop arrangements through which market identification schemes can be designed for complementary exports. In the area of forging linkages between large industries and SMEs, specific industries from Japan can be studied to learn and understand how such linkages were developed, risks encountered and reasons for success. Technology flow, technical and financial assistance, improved supply and marketing arrangements, promotion of industrial activities and training of personnel are a few areas where such schemes may be formulated to foster such cooperation.
Cooperation measures would also have to be supplemented and complemented by measures at the national level, particularly by removing those barriers that hinder SME growth. These measures would broadly include removal of obstacles in obtaining access to inputs such as technology, credit and training, reforming tariff structures and removing quotas, introducing realistic interest rates and dismantling physical controls on size and output.

Small and Medium Enterprise Development Experience and Policy in Japan and the Philippines: Lessons and Policy Implications
Ronald Tamangan, Frances Josef and Cielito Habito Ateneo Center for Economic Research and Development
Ateneo de Manila University Introduction Small and medium enterprises (SMEs) have played an important role in industrial production in particular, and economic growth in general in less developed, developing and transitional economies worldwide. They have generally provided the bulk of entrepreneurs and employment in these economies, and the necessary foundations for sustained economic growth and rising incomes. Ironically, however, SMEs in these economies have usually been neglected and even discriminated against in terms of government attention, access to finance, management and marketing expertise and technology, among others, relative to large enterprises. This has been particularly true in developing economies where large enterprises have usually been given the primary role in economic and industrial development. Policies and programs have been formulated across economies to further develop and strengthen the SME sector. SME policies and programs are manifold and vary according to specific country experiences and requirements, and generally address enhancement of exports, market development, furthering the use of technology and credit access. In this age of globalization, policies directed at increasing the competitiveness of SMEs need to have an outward orientation. SMEs need to look beyond domestic markets and become export oriented as well. Accordingly, the policy framework for SME development needs to deal with globalization and international competitiveness of SMEs. This study has three major objectives. First, it aims to document the historical SME development policy experience in the Philippines and Japan. Second, it attempts to draw useful lessons and policy implications from the Japanese experience for the Philippines. And third, it explores and analyzes opportunities for trade cooperation between the two countries in further fostering Philippine SME development. Although the study focuses on the partnership between Japan and the Philippines, discussions on the relevance and benefits of international cooperation are discussed in light of globalization, particularly in international trade. Thus, bilateral cooperation programs between countries or even regional cooperation programs serve as points of departure for analyses and discussions regarding international competitiveness of SMEs. The first section discusses the operational definition of SMEs in the Philippines and the definition employed in this study. The second section then deals with the current state of SMEs in the Philippines and Japan. For the Philippines, secondary data from the National Statistics Office (NSO) List of Establishments employed. Data on Japanese SMEs were taken from available published reports of the Ministry of Economy, Trade and Industry (METI). The third section reviews the economic literature on SMEs, particularly on the contributions of SMEs to the economy. The fourth and fifth sections discuss the historical SME development policy experiences of the Philippines and Japan respectively. Policies relating to SMEs in both countries are either SME-specific
2
or industry-wide in scope, with specific provisions relating to the SME sector. The sixth section presents issues confronting SMEs, specifically issues on global competitiveness. This section presents the case and the argument for free trade as gathered from the profuse literature of SMEs. This section also presents some statistics and discussions on the bilateral trade between the Philippines and Japan. And lastly, the seventh section presents policy discussions. 1. Operational Definitions The basic SME definition differs widely across countries. For instance, SMEs across ASEAN-5 are defined differently in terms of employment, assets, shareholder funds, sales and even paid up capital (See Table 1-1). Thus, depending on the criterion selected, the same firm may be classified as "small" under one criterion and as "medium" under another. As such, broad comparisons of SMEs across different countries may not be entirely appropriate because of the varied operational definitions employed. In highlighting these differences, it must be noted that the definitions adopted by countries do not in practice fundamentally affect the important issues facing and surrounding SMEs. Although the definitions vary, they have one thing in common: The vast majority of SMEs are relatively small and most SMEs employ less than 100 people. This permits broad comparisons across economies despite internal differences among them. The Philippines employs two criteria in operationally defining SMEs, namely, employment and asset size. Table 1-2 presents the criteria for size categories of Philippine firms. The employment-based definition has come to be the most widely accepted. Initially, enterprises with 1-99 employees were categorized as small, while enterprises with 100-199 employees were categorized as medium. This was subsequently modified such that small enterprises included those with 1-49 employees, medium covered those with 50-99 employees and large enterprises are those with 100 or more employees. Production units with 1-9 workers are collectively referred to as household industry or micro-enterprises and fall outside the SME designation. Thus, the recognized size categories for the Philippines are: Micro, 1-9 employees; Small, 10-99 employees; Medium, 100-199 employees; and Large, 200 and over employees. Although definitions based on asset size are not as commonly employed as definitions based on employment, the Philippines also utilizes the value of assets as a criterion of size (see Table 1-2). However, using asset size as a criterion for size classification may have a serious drawback in that continual adjustment of the definition may be necessary because of changes in the price level. In addition, comparison across economies may not be appropriate or would be questionable at best if asset values would be converted into a common currency, say in US dollars (Tecson 1990). This study employs the two definitions. Although it follows the asset-based official definition as approved by the Small and Medium Enterprise Development Council (SMEDC) Resolution No. 1, Series of 2003, primary data taken from the National Statistics Office (NSO) List of Establishments utilized the employment criterion. This criterion appears more practical for our purposes as it lends itself readily to international comparisons. However, secondary data taken from different Japanese
3
publications and agencies might have employed different operational definitions. Still, comparisons are permissible because of the fact that most SME employ less than 100 people, as it were. 2. Overview of Philippine and Japanese SMEs Philippine SMEs
Number of Establishments
The period 2000-2002 was marked with economic difficulties, not just domestically but also internationally. This perhaps could have been one reason for the decline in the total number of Philippine establishments during the said period. In 2000, the total number of establishments was 820,960. This number decreased to 809,271 in 2002. This decline represented a 0.71 percent decrease in terms of compound growth from the earlier period (see Tables 2-1 and 2-3). Table 2-2 reveals that micro-enterprises dominated Philippine establishments, with shares of about 91 percent and 92 percent in 2000 and 2002, respectively. Small enterprises followed with about 7 to 8 percent share. It is noticeable that the share of each enterprise to the total marginally decreased during this period, except for micro-enterprises. Although the tables do not present the latter half of the 1990s, the 2000-2002 situation was similar to the situation in the latter half of the 1990s in that small, medium and large enterprises had been on the decline and micro-enterprises had been consistently, although marginally, increasing1. If one were to consider the total number of establishments for micro-enterprises and SMEs, it would account for about an average of 98 to 99 percent of the total during the period. Most of the Philippine establishments during the period were into wholesale and retail trade (about 53-54 percent) and manufacturing (a little over 15 percent). These two sectors accounted for nearly 70 percent of the total Philippine establishments during the period. In addition, these two sectors accounted for about 70 percent of the total micro-enterprises during the said period: about 55 percent for wholesale and retail trade and 15 percent for manufacturing (see Table 2-2.). The dominance of these two sectors was apparent in the other size categories. Moreover, as the size increases, the share of manufacturing to the total for each size category increases. The general, albeit marginal, decline in the total number of establishments would translate into lower employment and lower output that would have been otherwise produced. Small, medium and large enterprises had significant declines at about 5 to 6 percent, while micro-enterprises had a 0.29 percent decline. Moreover, almost all sectors experienced a decline in terms of growth during this period, except for financial intermediation. The growth in financial intermediation was largely ascribed to the growth of this sector in the micro-size category, as this sector had increasingly negative
1 See JICA and DTI (2003).
4
growths given the other size categories. Construction (8.75 percent), followed by mining and quarrying (6.74 percent) and electricity, gas and water (6.55 percent) experienced the largest declines. The wholesale and retail trade and manufacturing sectors had the smallest decline in terms of growth at 0.35 percent and 1 percent, respectively.
Number of Employees
The general although gradually declining trend presented above is again obvious if one were to take a look at employment in the size categories. Total employment in 2000 and 2002 declined by 4.37 percent, from 5,902,186 in 2000 to 5,397,521 in 2002 (see Tables 2-4 and 2-6). Micro, small and medium enterprises' collective share to total employment was an average of about 70 percent of the total, while micro, small and large enterprises accounted for an average of about 93-94 percent of total employment (medium enterprises only accounted for about 6-7 percent on average during the period). Employees of micro-enterprises accounted for the largest share to total employment during this time, averaging about 38 percent of the total. Shares, particularly in 2000, reveal strong contributions from micro and large enterprises, where micro had 36.68 percent, small had 25.79 percent and large had 30.47 percent. The share of micro-enterprises to total employment in 2002 increased to 39.84 percent of total. The rest of the size categories, however, experienced insignificant declines in shares in total employment (see Table 2-5). Nearly 60 percent of total employment was accounted for by both the wholesale and retail trade (30 percent) and manufacturing (about 27 percent) sectors in 2000. A similar trend occurred in 2002, as the wholesale and retail trade and manufacturing sectors had the largest contributions to total employment. In 2002, these sectors' collective share to total employment was about 56 percent, which was marginally lower than the collective share in 2000. Noticeable during the period was the increasing shares of the manufacturing sector and the decreasing shares of the wholesale and retail trade sector considering larger size categories. Table 2-5 reveals that the wholesale and retail trade sector was dominant in the micro category and the manufacturing sector in large. Furthermore, the transportation and construction and real estate sectors had increasing shares given larger size-categories. Table 2-6 shows that total employment decreased by 4.37 percent from 2000 to 2002, as mentioned above. Size categories that contributed largely to this decline in employment were small (7.32 percent), medium (5.70 percent) and large (6.58 percent) enterprises. Furthermore, almost all of the sectors experienced declines in employment except for mining and quarrying. The largest declines in micro-enterprises came from electricity and water (12.05 percent), mining and quarrying (9.78 percent), construction (6.53 percent) and agriculture (4.86 percent), while the largest declines in the small-sized category were from fishery (10.84 percent), real estate, etc. (9.35 percent), manufacturing (8.75 percent), wholesale and retail trade (8.43 percent), transport storage and communication (7.40 percent) and agriculture (6.53 percent). For medium-

5
sized firms, they were from agriculture (10 percent), manufacturing (8.96 percent), mining and quarrying (7.31 percent), other community, etc. (6.90 percent), wholesale and retail trade (5.93 percent) and construction (5.41 percent). And for large-sized enterprises, the significant declines were from wholesale and retail trade (26.04 percent), real estate (7.01 percent), manufacturing (6.52 percent), construction (6.45 percent) and electricity, gas and water (5.22 percent).
Geographical Distribution Looking at the geographical distribution of Philippine establishments, a little over 50 percent of all establishments were found in the NCR (24.43 percent), Southern Tagalog (17.79 percent) and Central Luzon (10.78 percent) in 2000. This trend was again encountered in 2002 as the three provinces had about 52 percent share of the total, with NCR at 24.10 percent, Southern Tagalog at 17.64 percent and Central Luzon at 10.97 percent. (see Tables 2-7 and 2-8). Considering this short period, one can say that about 25 percent of the total establishments were found in the NCR, and that Philippine establishments were concentrated in very few provinces. This regional concentration is evident looking at the shares with respect to size categories. The NCR, Southern Tagalog and Central Luzon had the highest contributions considering the size classifications. However, for large enterprises, Central Visayas' share to total large enterprises was on the average about 7-8 percent during the period, surpassing that of Central Luzon's. Table 2-8 shows that NCR contributed around 22 percent of total micro enterprises and about 48-50 percent of large enterprises. One can therefore say that large enterprises were rather concentrated in the NCR during the period. The general decline in the total number of establishments was very evident in the negative growth rates in Table 2-9. Almost all regional establishments categorized by size experienced negative growths, except for Northern Mindanao, Socsksargen and ARMM. The most significant growth in the number of regional establishments across size categories was experienced by ARMM. In the ARMM, micro-enterprises grew at 39.48 percent, small at 65.45 percent, medium at 52.75 percent and large at 45.77 percent. Regional employment follows the pattern of regional distribution of establishments. Looking at Tables 2-9 and 2-10, employment was again concentrated in three regions, namely the NCR (40.06 percent), Southern Tagalog (15.68 percent) and Central Luzon (8.28 percent). Collectively, these regions accounted for about two-thirds of total employment. This trend is maintained in 2002 with marginal increases and decreases. Thus, these tables reveal that regional employment is largely concentrated in the NCR with an average of about 40 percent during this period. In terms of size categories, the general trend was that micro enterprises largely contributed to total employment at 36.68 percent, followed by large enterprises at 30.47 percent, small at 25.79 percent and medium at 7.06 percent. Noticeable in 2002 was the increase in micro's contribution to total employment at 39.84 percent, while the rest of the size categories experienced decreases in their shares.

6
The growth of regional establishments had been altogether dismal during the period. The fastest growing regions during the said period were ARMM (40.33 percent) and Northern Mindanao (8.66 percent). Another region that posted positive growth, albeit insignificant, was Central Luzon (0.12 percent). The rest of the provinces experienced negative growth during the said period. The growth experiences were consistent with the general outcome regarding the number of establishments during the period (see Table 2-9). In terms of geographical distribution of employment, Tables 2-10, 2-11 and 2-12 reveal consistent findings as above. Regionally, the NCR, Southern Tagalog and Central Luzon had the three highest contributions to total employment at 40.06 percent, 15.68 percent and 8.28 percent, respectively. The trends were consistent across size categories. Moreover, it was evident that the NCR employment shares had been increasing during the period given larger size categories, while Southern Tagalog and Central Luzon had decreasing shares. In terms of regional employment growth, only ARMM and Northern Mindanao posted positive growth rates: about 46 percent and 5 percent, respectively. The rest of the region generally experienced negative growths, an outcome which was consistent with the rest of the size categories, except notably for Socsksargen which had positive growth rates for micro (11.55 percent), small (11.66 percent) and medium (1.10 percent) size-categories (see Table 2-12).
Export Orientation The manufacturing sector has had the largest contribution to total exports for many years now. Furthermore, this sector has had the largest share in terms of census value added. Although the data presented and discussed here are rather dated, there is not much change in terms of the general trend with respect to the importance of the manufacturing sector in terms of export orientation and census value added. Most of the data with regard to export orientation and census value added are rather aggregative. Tecson (2001) presented a 1994 special tabulation from the National Statistics Office (NSO) which detailed export orientation of the three-digit classification under the manufacturing sector. The special tabulation was culled from the NSO's Census of Establishments, which was undertaken in 1994. The data (see Table 2-13) revealed that the following sub-sectors had highest export-to-output ratio: 1) professional and scientific equipment (70.61 percent); 2) non-ferrous metal (68.97 percent); 3) electrical machinery (64.54 percent); 4) furniture, metals (56.70 percent); and 5) machinery, exc. electrical (53.25 percent). A high direct exports to output ratio means that the sub-sector is export-oriented. Table 2-14 reveals that about 53 percent of the manufacturing sector originated from enterprises without foreign ownership. These “wholly” domestic enterprises exported about 34 percent of total manufacturing exports, while enterprises with foreign equity accounted for about 66 percent of total manufacturing exports. Among “wholly” domestic enterprises, 64 percent of manufacturing output and 44 percent of manufacturing exports originated from SMEs. Among manufacturing sector firms with foreign ownership, 34 percent of total output and 66 percent of manufacturing exports
7
were produced by SMEs. The data seemed to present that an important segment of SMEs in the manufacturing sector was able to compete successfully in exports market. There were SMEs with foreign ownership that had a high degree of export orientation. These export-oriented subsectors were: furniture and fixtures; non-ferrous metal products; electrical machinery; professional and scientific equipment printing and publishing; paper and paper products; iron and iron products; wood and cork products; other manufactures and wearing apparel. There were also industries with SMEs without foreign ownership with a high degree of export orientation, such as furniture and fixtures, electrical machinery, food, and leather and leather products. Japanese SMEs SMEs have played a very important role in the Japanese economy. They have infused dynamism into the Japanese economy for many years. Their characteristic flexibility and versatility have allowed for them to quickly adjust to changing business environments faster and more effectively than larger enterprises. This has probably been the reason for the relatively constant share2 of SMEs in the total number of enterprises in Japan for the period 1986-1999, fluctuating between a high of 99.7 percent in 1999 and a low of 99.4 percent in 1991 and 1996 (see Table 2-15). Likewise, its share of employment for business establishments has also been consistent during the said period, although the range of fluctuation is slightly larger from 77.6 percent in 1996 to 80.6 percent in 1999 (see Table 2-16).
The manufacturing sector3 was the third largest employer of labor among all types of industries in 1999 (see Table 2-17). The sector contributed about 21 percent to total employment. Furthermore, SME employment in this sector accounted for over two-thirds of the total at 65 percent. This trend was evident in other major sectors as well. The concentration of employment was in the SMEs, with shares to total industry employment ranging from about 70 percent to 77 percent. Aside from this, the manufacturing industry has the greatest value added compared to the other industries of wholesaling and retailing, services, and construction. It is for these reasons that most analyses regarding the contribution of SMEs in the development of the economy have focused on the manufacturing industry.
Table 2-18 reveals that value added from all industries had increased from 1998 to 2000. Furthermore, SMEs' value added increased from 1998 to 2000. The value added coming from large enterprises had likewise increased during this period. However, although the value added had generally increased, the contributions of SMEs and large enterprises to total manufacturing value added were decreasing during the period. SME's contribution to the total value added was about 22 percent on average during the period, while the contribution coming from large enterprises was about 16.5 percent on average during the period. Looking at the manufacturing sector (see Table 2-19), the manufacturing value added had been increasing during this period, which was because of the increasing value added of both SMEs and large enterprises. The table also reveals, in addition, that 2 This is defined as the sum of the number of companies and the number of self-employed. 3 As reported, the manufacturing sector includes ‘construction’ and the residual ‘other non-primary industries.

8
although SME value added had been increasing, contribution to manufacturing value added had been decreasing during the period. Still, however, SMEs contributed significantly to manufacturing value added. This was because SMEs contributed an average of 28 percent, while large enterprises contributed an average of 19 percent. Table 2-20 presents the wholesaling/retailing sector. This sector's value added had been increasing during this period. The table shows that SMEs had a higher average contribution to total industry value added: 13.5 percent for SMEs and 10.3 percent for large enterprises. Furthermore, it reveals that the contribution to total value added had been decreasing for both SMEs and large enterprises. Similarly for the services sector (see Table 2-21), the period was witness to an increasing value added for both SMEs and large enterprises. SMEs had a higher share to total industry value added at 30.6 percent on average, while that of large enterprises was at 22.3 percent on average. Moreover, large enterprises experienced increasing shares during this period. The value-added ratio for manufacturing, and for all industries for that matter, largely revealed a declining trend during the three-year period. This might be an indication of the effect that globalization and the entailing shift of production activities outside Japan had on the quality of production in the country.
With regard to the size of SMEs, a study on the entry of SMEs in relation to economic dynamism in Japan4 has shown that SMEs of the smallest size group (1-4 employees) saw a decline in their number beginning in the mid-1980s. The larger SMEs displayed a continuous growth in number with the relatively larger SMEs of 5-299 employees increasing from 2.1 million to 2.4 million during the 1957-96 period. This lends support to the theory that the post-World War II (WW II) environment had successfully caused a shift from micro SMEs to relatively larger SMEs. Japanese SMEs have also played an important role as subcontractors. In the 1987 survey done by the Small and Medium Enterprises Agency (SMEA), about 55.8% of firms engaged in manufacturing worked as subcontractors. Large firms have been very dependent on the SME subcontractors for parts, components, and processes which are either too costly for them to undertake on their own or are too diverse to be handled by management. SMEs also have an important position in a number of regional production networks, or clusters, that are the source of strength of economic activity for a number of regions in Japan. As a matter of fact, subcontracting arrangements are found to be more successful in such clusters. 3. SMEs and Their Contribution to the Economy The literature on Philippine SMEs has been diverse and profuse. The late 1950s to the early 1970s had investigations that largely focused on describing the broad features and the special characteristics of SMEs. Early investigators using aggregative data inferred that small enterprises are less capital intensive than large enterprises, and that capital
4 Kawai, Hiroki and Urata, Shujiro (2001)
9
intensity appeared to be industry specific rather than a firm size specific. The 1970s to the 1990s saw studies on the role of SMEs in employment provision, reflecting the growing realization that development policies had failed to deal effectively with the problems of unemployment and poverty, particularly in developing economies, i.e. Vepa (1971 and 1975). In addition, the 1990s gave research focus on issues about SMEs playing in an increasingly integrated global economy. However, throughout the vast SME literature, a common position surfaces. Although this position may not be grounded on economic efficiency5, SMEs have, time and again, been regarded as important in employment creation, particularly in an economy with abundant unskilled labor. One therefore could expect that where SMEs account for a truly large share of macroeconomic activity, the contribution of SMEs to aggregate output and employment growth might be substantial or even profound. Given SMEs low capital requirement, they are believed to stimulate growth of numerous indigenous enterprises with wide regional dispersal. They are therefore instrumental in promoting "balanced growth, more equitable income distribution, as well as the diversification of the industrial structure" (ADB 1990). International experience indicates that even under the most competitive conditions, unorganized and small business enterprises not only provide major employment opportunities but also survive alongside the highly organized sector. As regards Asian countries, in 1990 SMEs accounted for 95 percent of establishments in Bangladesh, 98 percent in Thailand, 93 percent in Malaysia, 70 percent in Indonesia and 80 percent in the Philippines (Das 2003). SMEs also have a role to play in export promotion. The literature acknowledges that SMEs play a significant role in the first or early phase of an export-oriented industrialization strategy by supplying low-cost labor-intensive products such as textiles, garments, leather goods, and other consumer products. As SMEs begin to modernize, they have been active in producing light engineering goods, simple machinery, machine tools, domestic appliances and construction hardware. Currently, SMEs are exporting a wide variety of products and continue to play a crucial role in generating and diversifying exports. Although the developing countries' exports are mostly labor-intensive, as economies of the region are undergoing industrial restructuring of varying kinds with emphasis on the private sector as the engine of growth, the importance of SMEs in exports has taken on a new dimension, but has not altogether changed. A major implication of a rather dated study still resonates today. Hoselitz (1959) and Hoselitz and Anderson (1982) documented firm-growth patterns, and highlighted a relationship between the development process and firm-size contribution to aggregate growth. According to Hoselitz et al. the first phase of development is usually characterized by the predominance of "household industries", while the second phase of 5 It has been argued that public policy should be designed to encourage the growth of SMEs because of the increase in employment and improvement in income distribution which may ensue. This raises the question of efficiency of SMEs. If SMEs are as efficient as large enterprises, then there is no problem. However, if SMEs are less efficient producers than large enterprises, then employment is being bought at the expense of output and the value of the trade-off has to be explicitly considered.
10
development by accelerating growth of SMEs. Lastly, the third phase of development is marked by the contraction of household industries which is supplanted by large enterprises at this stage. SMEs make a valuable contribution as subcontractors to large enterprises, which often tend to be transnational corporations (TNCs). They produce parts and components for large enterprises using local resources and skills. In light of economic fluctuations, they act as shock absorbers for the large enterprises, adjusting their own employment and production levels to reflect changes in demand and supply conditions. In these ways, they add to the flexibility and viability not only of the large enterprise sector but also of the entire economy (Dhungana 2003) The literature presents development phases that indirectly underscores the firm-size contribution to the overall economy. In particular, one can look to the second and third phases as having the most impact on the economy. Relatively recent investigations posited that the growth of SMEs and their eventual graduation into large enterprises would have positive impacts on the economy in that this process of evolution and graduation can help improve the entrepreneurial and managerial class and even boost capital formation. Such processes can create the basis for transformation of an economy from one using traditional and outmoded techniques to one using modern and efficient technology (Hooley and Ahmad 1990). 4. The Philippine SME Development Policy Experience This section deals with the development experience of Philippine SMEs from the 1940s to the present. It presents major policies that were set in place with the objective (both directly and indirectly) of furthering the development of SMEs. The Philippine industrial development experience foregrounds the discussion on specific SME development policies and programs. This is because SME policies that have been set in place may have been in light of major industrial development policies of the Philippines. Thus, the Philippine SME development experience will be discussed under the over-arching Philippine industrial development experience. Philippine Industrial Development Experience: An Overview6 The 1935 Philippine Constitution first recorded the national commitment to industrial progress. The Philippine government set out policies with the objective of setting the Philippine economy on course to industrial progress. The succeeding periods in Philippine economic history have been witnesses to the general persuasion that industrial progress is important to economic advance. The common thread that binds industrial policies across the time periods was the emphasis on policies regarding expansion of exports, increases in foreign investments, development of the private sector, and enhancement of domestic linkages.
6 The Philippines' industrial development experience is not discussed in light of the political and social conditions of the periods in question.

11
The positive impacts of reconstruction programs, in response to the negative impacts of World War II (WW II), marked the period covering 1946 to mid 1960s. The leitmotifs of this period were the country's overvalued exchange rate and the import-substitution strategies adopted by the national government. Throughout this period, the government set programs in place to encourage domestic investment, particularly the regulation of interest rates. Moreover, during this time, the government saw the importance of not only encouraging domestic investment but also foreign investments. Policymakers thus set out specialized incentives to lure foreign investments. The 1950s was witness to a good number of growing industries. The government then set up the Industrial Guarantee and Loan Fund (IGLF), with fund infusion from the USAID, which fuelled growing industries. National incentive policies were set in place to support selected industries. As examples, the Basic Industries Law provided tax exemption for machinery importations for industries like food, plywood, veneer and textiles; the Mining Act provided support for the mining industries; and the Textile Act was set in place to aid textile companies. During this period, the Investments Incentives Act granted fiscal and other incentives for priority firms registered with the Board of Investments, specifically for those introducing new products and processes and for those expanding capacities for domestic and export requirements. The liberalization of import controls and the devaluation of exchange rates, which were resorted to in the 1950s, resulted in the influx of imported manufactured goods, which had adversely affected the manufacturing sector. Consequently, the latter half of the 1960s saw a major shift in the Philippines' industrialization program. The strategy shifted from import-substitution production to the establishment of export-oriented industries. Policies were set in place to support the foreign exchange requirements of imported raw materials, primarily agriculture and mineral-based commodities. The 1970s had seen the continued emphasis on the expansion of exports. The Export Incentive Act was enacted during this period. This Act was deemed complementary to the investment incentive policy set in place by the national government. Moreover, additional incentives were granted for export-oriented industries and provided for rural locators in light of industrial dispersal policy. Hence, export-oriented industries bloomed, but there were few locators to the countryside because of inadequate infrastructure required for operations. The economic developments in the latter half of the 1980s were undoubtedly brought about by the transition from martial rule and the democratic reforms that were set in place. As a result of positive political developments, this period, particularly during the Aquino regime, was witness to wide-ranging economic-related reforms and government reforms and reorganization. There was even an emphasis on the government's commitment to private sector development. This emphasis was declared in the 1987 Philippine Constitution. Major government reforms and structuring programs were geared towards reinforcing the Philippines' industrialization program. For instance, foreign direct investments (FDI) were encouraged and foreign investments in the Philippines were permitted in virtually all areas of economic activity. It was notable that structural adjustment programs were instituted for capital-intensive industries. Policymakers during this time
12
had also instituted reform programs that were based on development principles. Notably, the industrial dispersal program to address poverty, employment and distribution of income was considered. The trade liberalization, tariff reduction and deregulation of interest rates to enhance competition, furthered international trade and encouraged domestic investment, respectively. Privatization programs were set forth to remove not only government intervention in many government industries but also to transfer control and ownership. Clustering and estate development programs to promote grouping of industries, which can provide more value-added services, facilitate economies of scale and utilize industrial infrastructure. Although these programs had strong developmental bases, it could be said that these programs were very much in line with the period's industrialization program. Significant economic strides were experienced during the 1990s, which was essentially the Ramos period. When the Ramos government assumed leadership in 1992, the major policy thrust was towards revitalizing the economy and a renewed attention on a focused Social Reform Agenda. The goal set by the 1993-1998 Medium Term Development Plan was on the direction of jumpstarting and pushing the economy to the "newly industrializing country" (NIC) status in 2000. Dubbed as the Philippines 2000 strategy, the Plan envisaged to improve the quality of life of every Filipino through global excellence and people empowerment. Global excellence meant producing world-class products and services in both domestic and international markets and expanding markets and opportunities, which would thus facilitate job creation, improvement in labor skills and managerial techniques and other innovations. People empowerment was deemed attainable through development of human resources by education, training, improved basic services in health and nutrition, increased access to productive resources and the diffusion of technology. Liberalization and deregulation programs were also undertaken in light of the government's industrial development thrust. Moreover, investment strategies and export expansion programs were set in place. Two investment strategies to meet the NIC status were pursued: first was a strategy that would encourage inflows of foreign direct investment, and secondly, a strategy that would adopt an integrated development assistance for small-scale enterprises. Regarding expansion of exports, the Export Development Act was enacted in 1994. This Act stipulated that the government and the private sector work to jointly transform the Philippines into an exporting nation. That exporting is not just a sectoral concern but the key to national survival and the means through which the economic goals of increased employment and enhanced incomes can be expeditiously achieved. Moreover, export winners, market positioning and specific action plans were identified as part of the Philippine Export Development Plan (1993-1998) which set forth the basic programs of the export program. Programs regarding export expansion altogether underscored the important place of export expansion as a driver of economic growth and as a facilitator of trade-driven investments and technology transfer, and it could also lead to a shifting from labor-intensive to skills-intensive industries. The 1997 Asian Financial Crisis dealt the Philippine economy with a heavy blow. Although, the Philippines was one of the least affected in the Asian region during the immediate aftermath of the crisis, this situation was, however, reversed during the Estrada administration. The industrialization policy, which may have in part taken into
13
account the impact of the financial crisis, gave emphasis on the development of rural industries and village enterprises and stressed that clustering of industries was the key strategy intended for industrial growth. The industrial development strategy during the period 2001-2004 is anchored on private sector development and on the capacity of domestic industries to compete globally in terms of exports and support services. It emphasizes the need to increase the value-added of industries, diversify strategies in terms of products and markets, develop a strong local base, and enhance domestic linkages. It also acknowledges that a macroeconomic framework, which promotes competitiveness, efficiency, innovation and entrepreneurship, is fundamental to private sector development. And it puts in context the national strategy to achieve bigger goals of employment generation, countryside development, and upgrading of living standards. Philippine SME Development Policy7 Experience As it were, the Philippine industrial development policy experience foregrounds the discussion on the SME development policy experience. In almost all countries, there is either a separate policy statement for SMEs (or for micro or cottage industries) or a general industrial policy statement with some portions of it relating to this sector. In so far as the aforementioned discussion on industrial policy remained on the broad level, it nevertheless suggests that these policies have had positive impacts on SME development. One can also explore the possibility that some policies and programs have been partial to large enterprises. In many developing economies, SMEs contribute significantly to GDP growth, employment generation and poverty alleviation. However, SMEs have faced a number of problems and constraints which include the following, among others: ! Lower productivity and outdated technology; ! Lack of skilled labor and managerial skill; ! Constraints on infrastructure; ! Low economies of scale; ! Lack of modern marketing; ! High cost of domestic credit and lack of foreign investment; and ! Increased competition
1960s Industrial policies after WW II have slowly but substantially changed throughout the years. From 1946 to mid-1960s, the development of the industrial sector was achieved through a conscious strategy of import substitution that catered to the domestic market. The government embarked on a program to rehabilitate the economy during the early post-war period. Focus was on large-scale enterprises and import-intensive industries. Policies included import controls, low interest rate, low foreign exchange rate and specialized incentives to attract foreign investments.
7 Information regarding the policies discussed came from the Bureau of Small and Medium Enterprises Development (BSMED).

14
The 1960s was witness to sparse policies and programs focal to SME development. There were only two notable policies/programs that were centrally focus on small enterprises. Firstly, the Cottage Industries Act during this period was the first to recognize the importance of small enterprises in the grand scheme of industrial development. With this Act, tax incentives were extended to small enterprises registered with the National Cottage Industries Development Authority (NACIDA). Secondly, training and service provision programs were undertaken to address the growing needs of small enterprises. These programs, which were facilitated by the University of the Philippines, came into existence with the support of the Netherlands government.
1970s By the second half of the 1960s, when traditional exports like coconut, gold and chromite could no longer support foreign exchange requirements of the growing imports, the government shifted from import-substitution strategy to export-oriented industries. Thus the creation of the Investments and Incentives Act was passed into law with the Board of Investments as lead agency. In 1970, the Export Incentives Act was enacted. The importance of SMEs was recognized at the onset of 1970s amidst the worst oil crisis that crippled energy-intensive industries. Formal planning for the development of SMEs came about after an International Labour Organization (ILO) mission in the early 1970s. For the first time, SMEs were given emphasis in the Philippine Development Plan (1972-1976). The general features support or developmental programs were as follows: ! Substantial increase of financial resources available to SMEs; ! Provision of technical assistance on a regional basis; and ! Establishment of NACIDA to implement and coordinate all programs of assistance
to SMEs. Accordingly, the 1970s was hailed as the growth period for SMEs. Mentioned below were several reasons why SMEs grew in number in the 1970s and why this period was hailed as the growth era for SMEs: ! A number of credit programs were made available to SMEs and loans from
multilateral lending agencies were infused into the sector. Particularly, long-term supervised credit was made available by the Social Security System (SSS) to SMEs. Loans from the World Bank-IBRD were used to re-orient the IGLF for re-lending to SMEs. And loans from the Development Bank of the Philippines (DBP) were extended to SMEs.
! The Medium and Small Industries Coordinated Action Program (MASICAP) was
created to mobilize SME creation. This program served as a link between entrepreneurs and the financing institutions.

15
! The Department of Industry was created in 1974. It took over the MASICAP and soon after established the Small Business Assistance Centers (SBAC) to provide SMEs services in the regional areas. Funding support for the establishment of the centers came from the World Bank—International Bank for Reconstruction and Development (WB-IBRD).
! The Commission on Small and Medium Industries was formed during this time. It
governed the operations of agencies and implementation of programs in small enterprise development. This central organization was in existence until 1981, and its functions and programs were assumed by other agencies thereafter.
! The 1979 Investment Promotion Act, among others, provided support to SMEs,
particularly in non-traditional export sectors to promote employment. This Act introduced training and other services into SME programs.
However, despite the increase in the number of SMEs during the period, household industries and the SMEs did not grow as significantly as large enterprises did. Hence the perception that the 1970s is the growth era for SMEs is a misnomer. One can look to three reasons behind the above-mentioned eventuality. First, in spite of the incentives and the services extended to SMEs during this period, very few SMEs made use of the incentives and services made available to them. Second, incentives and investments during this period favored big enterprises. And last, formal lending bodies had very little involvement in SMEs because of the perceived risks and the high costs associated in processing and supervising the projects.
1980s The above discussion on broad industrial policies during the 1980s, particularly during the Aquino administration, may point to an implicit preference to large enterprises. The incentives extended to SMEs went through the same route as incentives extended to large enterprises. Although there was a categorical development focus on SMEs and countryside development, liberalization efforts during this period placed pressures on SMEs that had difficulty in coping with spiraling interests and the more competitive business environment. Focal SME Development Strategies (1988-1992) adopted by the Aquino administration include the following: ! Strategies on financing. The strategy aimed to ease SMEs' access to financing,
through reduction of paperwork and processing requirements, review of interest rates, and matching of programs to SME needs.
! Strategies on market improvement. The strategy had the objective of improving
market access and expanding the domestic markets of SME products. This objective was going to be achieved through provision of common market facilities, subcontracting linkages, market intelligence and information access, identification of local market centers, and rural transport facilities. The strategy also aimed to provide support to exporters through financing and guarantees, improved shipping services, further training to exporters and improvement of exporting procedures.
16
! Strategies on improving technology transfer. The strategy had the objective of
improving production by transfer of technology. This objective was to be attained through the creation of technology centers and common service facilities, provision of information on applied production systems, provision of awards and incentives to outstanding entrepreneurs and designers, and the creation of new products with greater indigenous values. In addition, the utilization of available local raw materials was emphasized.
! Strategies on entrepreneurship. The strategy aimed to encourage micro industries
as catalyst for entrepreneurship. There were also SME support programs instituted during the period. These programs were largely on private sector development, regional enterprise development, and entrepreneurship. Moreover, these programs were funded by the United States Agency for International Development (USAID), the United Nations Development Program-United Nations Industrial Development Organization (UNDP-UNIDO) and the Canadian International Development Agency (CIDA). In 1987, the Omnibus Investment Act was enacted as the key legislation for investments generation, whether foreign or local. Fiscal and other forms of incentives were given to projects identified under the Investment Priority Plan (IPP). A major policy of the Act was to encourage SMEs by providing assistance in the preparation of feasibility studies and sourcing of financial packages. Investments locating in "less developed areas" were given additional incentives. Towards decentralization of SMEs to the countryside, the Board of Investments was very active in coordinating with local entrepreneurs and government units in investment promotion.
1990s - Present SME policies in the 1990s were more focused, directed and sweeping. Clearly, policies in the 1990s drew from the experiences of SMEs in the past. The general SME development strategies adopted during this period were on market access, export expansion, identification of specialization, entrepreneurship and management, technology and quality systems upgrade and domestic linkages. One important piece of legislation, which formally acknowledged the importance of SMEs, was the Magna Carta for Small Enterprises, passed into law in 1991 (RA 6977) and amended in 1997 (RA 8289). The Magna Carta was a landmark legislation, which reflected the objective to foster a dynamic SME sector, particularly rural and agri-based manufacturing ventures. Three principles in setting the pace of SME development served as guides for the Magna Carta. These are minimal set of rules and simplification of procedures and requirements, participation of private sector in the implementation of SME policies and programs, and coordination of government efforts. Moreover, there were three major provisions contained in the Magna Carta, namely:
17
1. creation of the Small and Medium Enterprise Development Council (SMEDC), the primary agency responsible for the facilitating and coordinating all national SME programs including programs with foreign funding;
2. creation of the Small Business Guarantee and Finance Corporation, which
provides alternative modes of financing for small enterprises, including but not limited to direct and indirect project lending, venture capital, financial leasing, secondary mortgage and rediscounting of loan papers to small businesses; and
3. eight- percent mandatory bank channeled loan to SMEs (6 percent for small
enterprises and 2 percent for medium enterprises). This period was also witness to the first Republic Act that acknowledged the role of women entrepreneurs. An act providing assistance to women (RA 7882) was passed into law on February 20, 1995. This particular legislation recognized the special role of women in development and supported women entrepreneurs who were engaged in manufacturing, processing, service and trading businesses. Under this program, government financing institutions (GFIs) like the Landbank of the Philippines (LBP) and the Development Bank of the Philippines (DBP) were mandated to provide assistance to 1) non-governmental organizations (NGOs) engaged in developing women’s enterprises to a limit of P2 million, provided that the NGOs has an operating track record of a year; 2) existing women enterprises to the upper limit of P50,000; and 3) potential women entrepreneurs with sufficient training up to a limit of P25,000 each. Considering all the inroads regarding formal SME development programs, various challenges in the area of human resource development, technology and R&D, and access to financing, to name but a few, remained during this period. These concerns were addressed in the Philippine SME Development Strategy (1998). The 1998 development strategy had four guiding principles for SME development, namely, viability, sustainability and private sector initiatives. Furthermore, it hinged on sound partnership between the government and the private sector, the complementarity ensured by three governing bodies on enterprise development: 1. the Export Development Council (EDC), which oversees the implementation of
Philippine Export Development Plan; 2. the Industry Development Council (IDC) which implements the Philippine
Industrial Development Plan and develops enterprises with high technology requirements; and
3. the Small and Medium Enterprise Development Council (SMEDC) which oversees
policies and programs on SMEs and coordinates with both EDC and IDC in drawing-up its priority industries.
Accordingly, the development strategy prioritized four strategic imperatives in SME development: 1. Narrowing the focus on identified priority sectors. Efforts to focus on "vital
few" that demonstrated strong growth and export potential.

18
2. Promoting mutually beneficial linkages among small and large firms. This
strategy promoted industrial-subcontracting exchange schemes, strengthening SME associations, establishment of linkages and cooperation between small, medium and large firms.
3. Strengthening technology and R&D initiatives. This strategy aimed to boost
efforts of different agencies in examining and controlling technologies that would benefit SMEs, in promoting the use of quality standards, and in fast-tracking the full operationalization of APEC Center for Technology Exchange and Training for SMEs (ACTETSME) as a resource center for information networking, mobilization of training opportunities, and upgrading technical know-how. It also aimed to create, expand and improve curricular training programs in entrepreneurship, management, and technical skills for SMEs and develop appropriate materials for such training programs. The identification of HRD requirements in specific industries and the provision of facilities/resources for skills training in special economic zones were parts of the strategy.
4. Improving Access to Finance. This strategy aimed to develop innovative
financing schemes using non-traditional sources and schemes such as cooperatives and associations, and, equity financing and venture capital respectively.
The latter part of the 1990s saw an intensified focus on export expansion. The 1999-2001 Philippine Export Development Plan (PEDP) provided the guide to boost export performance and lay the groundwork to develop a sustainable and globally competitive export industry. It emphasized the synergy and complementation among the various programs and initiatives to create a unified and cohesive agenda. The Plan defined roles and commitments of both government and the private sector. It emphasized the need to implement what have, for some time now, remained mostly on paper, and to evaluate such efforts with clear objectives. The EDC was to oversee the implementation of the Plan. The export-led agenda was supported by the following general strategies: 1. Provision of a macroeconomic environment that promotes competitiveness,
efficiency, and entrepreneurship. This included maintenance of a low and stable domestic inflation rate, competitive exchange rate, and favorable interest rate policy.
2. Improving market access and market presence. The strategy was to open up of
new markets by acceding to various multilateral agreements such as the ASEAN Free Trade (AFTA), Asia-Pacific Economic Cooperation (APEC) and the World Trade Organization (WTO).
3. Developing a competitive export base. The PEDP presented a comprehensive
Export Policy Agenda and outlined specific policy directions and initiatives necessary to support the export drive. These specific policy directions and initiatives were generally on:
19
! Financing; ! Investment and incentives; ! Cost of doing business; ! Agricultural policies; ! Technology agenda; ! Education and training; ! Employment policy, labor and productivity; ! Competition policy, liberalization, and international commitments; and ! Institutional framework
4. Information as core trade development service. The Plan called for the
strengthening of primary focal points for delivering information services related to export such as the Philippine Trade Information and Network Systems (PHILTINS) and, One Stop Export Information Assistance Center (EXPONET). It also aims to electronically link up all Department of Trade and Industry offices and commercial posts around the world to facilitate information exchange.
The PEDP also laid out programs on: ! Clustering of industries; ! Formulating a policy framework for service exports; ! Developing backward linkages for exports; ! Promotion of "global" companies—competitiveness upgrading; ! Product search program; ! Promotion of standards such as ISO 9000 and 14000 series; ! Promotion of information management; ! Conduct of bilateral and multilateral programs; ! Investment promotion; and ! Identification of materials support clusters. There were other initiatives during the period worth mentioning. The SMEDC had finalized the SME development strategy in 2000 that defined specific actions to address SME concerns. The strategies were with regard to the following: ! Finance. Increase and widen the access of SMEs. Promote active participation of
industry/trade/ professional associations and provincial SMEDCs in helping SMEs access financing from banks; holding SME financing fairs; and establishment of venture capital corporations.
! Information. Operationalize pro-active, efficient, comprehensive, reliable
information delivery systems for competitive SME planning and increased productivity.
! Align databases according to SMEs needs. Promote Information Technology (IT)
and e-commerce. Speed up development of websites among industry and local associations, and government agencies, and syndicate hyperlinking of their databases. Develop complete "one-stop" SME Website.
! Marketing. Expand market share of selected sectors such as garments.
20
! Promote furniture, processed food, gifts, toys, and household things (GTH),
and services sectors. Pursue trade promotions such as fairs, missions and promote IT/E-commerce in doing business.
! Human Resource Development. Increase the number of competent owners-
managers and workers of SMEs. Conduct benchmarking, documentation of best approaches in Human Resource Development, policy advocacy, training needs assessment and client targeting.
! Technology. Enhance productivity and competitiveness of SMEs through the
effective and judicious application of technologies and related resources. ! Upgrade database systems on technologies (including experts' services) for
SMEs. Match technology requirements of SMEs with existing programs/resources and, conduct benchmarking activities.
After more than two decades of attention and support, SMEs have experienced highs and lows, the Asian crisis and political changes. The sector's capacity to live up to its promise as an engine of growth has been undermined by many impediments. With exceptional few export-oriented firms, many firms were characterized by low levels of productivity and efficiency and inability to attain economies of scale and power to influence prices, volumes, distributions and markets. They have remained challenged in the areas of human resource development, technology, access to financing, and R&D. To address some of the concerns, the 2001-2004 Medium Term Development Plan (MTDP) outlines the government strategies to further accelerate development of small enterprises. The strategies in the MTDP are: ! Review SME laws, national and local policies to create a competitive environment.
Plans, policies and programs will be reviewed to address global developments and economic difficulties.
! Improve the banks' capability to understand and service the special needs of small
borrowers. ! Pursue innovative alternative sources of finance, like capital markets. ! Pursue clustering to develop SMEs in the rural areas. ! Take advantage of full potentials of ICT and e-commerce for use of SMEs,
including provision of distance learning modes such as correspondence, computer-based/online training.
! Provide franchising fairs and consulting caravans for on site consultations.
21
! Set in place a National Business Registry to track business firms from the start to closure and have an up-to-date picture of status, locations and base data on business firms.
! Set in place SME centers to become the coordination point for access to
information, training, advisory and other services. The most recent SME Development Plan in 2003-2004 acknowledges that the Philippine SMEs have to play in a global terrain. The general aim is to have a vibrant SME sector that provides strong domestic supply base for globally competitive industries. This shall be achieved through graduating micro and small enterprises to higher levels of business undertakings, upgrading their productivity and value-added capabilities, and strengthening of 20 accessible SME Centers nationwide. The Plan shall be achieved through comprehensive approach to SME development, localized plans and implementation of nationally directed projects. The highlights of the plan include: 1. Training/HRD. Streamlining of training programs and standardizing fees and
promotion; deployment of SME business counselors; and review of academic curricula to promote entrepreneurship.
2. Market development. Launching of SME Opportunities Caravan and enhancing
support to trade fairs and missions, display corner, matching services and consolidation of production inputs for SMEs.
3. Product development/technology intervention. Product clinics and advisory
services for standards conformity; alternative uses of indigenous raw materials, training to sustain quality raw material inputs; strengthening sharing of facilities.
4. Advocacy for enabling environment. Strengthening the monitoring and
implementation of BMBE Law; harmonizing and simplifying business registration; and reducing cost of doing business by rationalizing rules and regulations.
5. Financing. Acceleration of SME Unified Lending Program for National Growth
(SULONG) with common lending guidelines and rates, standardized accreditation of rural and thrift banks and P10 billion infusions from GFIs; One-Town-One Product-One Million Program; and credit bureau and credit scoring for SMEs.
Recently, the Long-Term SME Development Plan has also been formulated to boost SME performance in the long term and lay the groundwork to develop sustainable and globally competitive SME sector well beyond the programs already in place. It shall map out the synergy and complementation among the various programs and initiatives that have either been started or thought of before, to create a unified and cohesive agenda. It shall implement programs on the basis of available resources and build on some realistic and potential support. It shall be framed on the basis of consensus building and ownership of the Plan of the various stakeholders involved.
22
More concretely, the Plan aims to increase the contribution of SMEs to the economy (employment, value added and exports) by at least 10 percent in the short to medium term (2004-2006) or double the growth of the Gross National Product (to truly claim as the economic engine of growth). In addition, it aims to define and select specific and realistic strategies that shall fit the timeframe to accomplish the following: ! establish a more accurate information on SMEs; ! have an up-to-date picture of SME status, with priorities on identified focus
clusters/sectors, to develop specific action programs and a framework for implementation;
! build in flexibility to allow emerging opportunities and challenges to be addressed
in the Plan; and ! develop micro-enterprise development component program appropriate to the plan;
and ! identify program for growth-oriented micro-enterprises to be led to the SME
category.
The Role of Micro Enterprises The Philippines, like other developing economies in the Asean region, has a large and dynamic underground sector, or the so-called informal sector. This sector has always been characterized as home-based in the urban areas and community-based in the countryside. It has employed indigenous skills and raw materials, catered to limited markets and served as intermittent or supplementary source of livelihood to a lot of households. Over time, enterprises under this sector have grown to become SMEs while others remained as they were, perpetuating a traditional craft with decreasing supply of raw materials. . Recognizing the potential of the informal sector not only as a source of government revenue but also as provider of jobs in the countryside, the Philippine Congress passed the first Countryside and Barangay Business Enterprises (CBBEs) law or Kalakalan 20 in 1989. The applicability of the incentives under the law expired in 1999. Expectations regarding the law’s outcome were not met. The National Economic Development Authority (NEDA) reported that CBBEs faced problems in financing, access to raw materials and skilled labor and high CBBE fees. The laws and its benefits were not properly disseminated to the intended beneficiaries by local government units. Considering the failure of the first law and noting the problems encountered, the second CBBE law was passed on July 24, 1998. For the second law, CBBEs were defined as enterprises having assets P500,000 and below. The law, which took effect for a period of five years, provided for the promotion of this sector without bureaucratic restrictions. Exemptions from government rules and regulations were granted to CBBEs. Incentives given were for any business entity with members or employees not more than 20.

23
5. The Japanese SME Development Experience and the Historical Policy
Environment
It is a well-established fact that Japan hosts the largest number of small- and medium-sized enterprises (SMEs) among industrialized countries (Hideki 2001). This distinct property of the Japanese economy has made it the subject of many studies regarding economic development, especially since it provides a stark contrast to the United States’ economy, which is mostly driven by large enterprises. This lends support to the claim that there is truly no unique pattern of development and what may work for one country, may not work for another. Japanese economic history validates the success of Japanese SMEs in having kept the economy afloat. It is for this reason that we include the historical review of Japan’s SME policies in relation to the country’s economic development. As one would observe in a short while, the strength of the policies of the Japanese government regarding SMEs was in the policies’ reactive nature. That is, appropriate and timely policies were implemented. The Reconstruction Period (1945-1954) Perhaps as a natural consequence of the war, most of the Japanese SMEs began their operations in the period 1945-1954, also called as the Reconstruction Period of Japan. Since large enterprises took a longer time to restart operations, SMEs reacted faster to provide the needs of the people during that time. This is not to say that problems related to operations were less for these SMEs. On the contrary, SMEs faced numerous external difficulties such as lack of materials for production, severe inflation, and preferred distribution of materials to weighty large-scale industries, as the government then tried to revive the economy. Aside from these, SMEs had also internal problems ranging from low management level to lack of technology and funding to aimless investment and production. As a first measure to aid SMEs during this period, the Japanese government established the Small and Medium Enterprise Agency (SMEA) in 1948. The SMEA was established shortly after the Act Concerning Prohibition of Private Monopoly and Maintenance of Fair Trade and the Law for Elimination of Excessive Concentration of Economic Power were passed in 1947. With the SMEA in place, the basic tools relating to financial resource, cooperatives, management consulting and guidance, and taxation to aid SMEs were also carried out. For sources of loans, the National Life Finance Corporation was established in 1949 to cater to SMEs, which had been in difficult financial situations, by supplying short-term non-collateralized loans. The Japan Finance Corporation for Small Business was established in 1953 with government equity to supply fixed, long-term and low-interest funds for SMEs, which private institutions had general difficulty in supplying. Aside from these, the Small and Medium Enterprise Credit Insurance Law and the Credit Guarantee Association Law were passed in 1950 and 1953, respectively, to strengthen the financial weakness of SMEs. In this connection, the Law on the Cooperative Association of Small and Medium Enterprises was also passed in 1949 with the purpose
24
of correcting the social and economical disadvantages of SMEs. With this law, SMEs proceeded to form cooperatives and groupings which increased their competitive stance in relation to the bigger enterprises. Regarding management consulting and guidance, the first three measures carried out were the Management Consulting System (1948), the Consulting Desk for SMEs (1948), and the Registration System of SMEs Consultant (1952), all of which were deemed important for modernizing and rationalizing SMEs management. Subsidies were given to municipal governments to promote the guidance program. To improve the financial accounting of the SMEs, the “Blue-Returns” system of taxation was introduced in 1949. Under this system, SMEs were given tax merits if their tax returns were made with a certain quick formula of bookkeeping. This cured the problem of the incomplete bookkeeping of SMEs that became the practice in the chaos after the war, given the fear of being overtaxed by the government. The High Growth Period, the First Stage (1955-1962) With the generous treatment given to enterprises throughout the reconstruction period, the Japanese economy was able to recover to almost pre-War level and SMEs and large enterprises alike became very active. Additional productions spurred additional productions such that this period was characterized as a high-growth period. However, in the course of this fast growth, large enterprises and SMEs went in two different paces of growth in terms of productivity, wages, technology and financing ability. As such, the period was also characterized by the “dual industrial structure” of the ‘advanced large-scale enterprises’ on one hand, and the ‘delayed SMEs’ on the other (SME Agency, METI 2002). It was in the context of this dual industrial structure that the measures on SMEs were drawn in this period. In the area of financial support for SMEs, the Law on Financial Assistance for Promoting Small and Medium Enterprises was enacted in 1956 with the aim of improving the productivity of SMEs through the usage of modern equipment. Through this law, municipal governments started loaning funds necessary for modernizing equipment in their areas. Strengthening of SME organizations was also included in the agenda. Accordingly, the Law Concerning the Organization of Small and Medium Enterprises was enacted in 1957 to establish an organization that would help businesses adjusts their activities. Finally, two laws relating to management consulting and guidance for SMEs were passed. The first law aimed to broadly diffuse management programs by the government (the Law on Organizing Commerce and Industry Association enacted in 1960). The second had the objective of preparing a systematic and efficient scheme of guidance for the rationalization of management and SMEs’ technological improvement whereby municipal governments play an active role. Aside from the traditional problems of providing financial resources, promoting cooperatives, and giving guidance and management, the government had also implemented counter-measures for the diffusion of the subcontracting division of labor (which developed during this high growth period) between large (parent) enterprises and SMEs, especially in the industries of electrical machinery and transportation machinery. Although subcontracting improved the efficiency and progress of technology of both the large enterprises and SMEs through specialization of tasks,

25
many parent enterprises took advantage of their predominant position over subcontractors (SMEs) and engaged in unfair practices, such as delaying or reducing payment for subcontractors or infringing their benefits. To prevent such abuse by large enterprises, the Law on the Prevention of Delay in the Payment of Subcontracting Charges and Related Matters (the Subcontractors’ Payment Law) was enacted in 1956. The High Growth Period, the Second Stage (1963-1972) The 1960s witnessed the dawn of the opening of the Japanese market for trading and foreign investors. During this period, the promotion of SMEs was considered as a minimum requirement to achieve the balanced development of the national economy. Furthermore, measures towards SME development during this period were geared towards upgrading the industrial structure and strengthening the international competitiveness of SMEs. The first law to be enacted during this period was the SME Basic Law which aimed to eliminate perceived disadvantages faced by SMEs, support their self-help efforts, improve their productivity and trading conditions, as well as improve the social status of their employees. The SME Basic Law was important in that it stipulated general descriptions of SMEs and consolidated in a single document all preceding laws. Another important law enacted during this period was the SME Modernization Promotion Law (or simply, the Promotion Law). This Law aimed to improve the productivity of SMEs by implementing a modernization plan for industries that either involved SMEs in a higher percentage or those wherein the productivity of those SMEs might require important measures for general upgrading in terms of industrial structure and competitiveness. In connection with this objective, the Law on Financial and Other Assistance for Small Business Modernization was also promulgated in 1963. This Law was to facilitate the promotion of upgrading industrial structure (i.e., joint businesses or grouping of factories or stores) and modernization of equipment for cooperatives. A loan for upgrading expenditure was also made available by the Japan Small Business Promotion Corporation which was established in 1967. A peculiar law, the Law on Ensuring the Receipt of Orders from the Government and Other Public Agencies by Small and Medium Enterprises, was enacted in 1966 with the aim of correcting the business disadvantages of SMEs in response to the recession that developed in 1964. Under the said law, the government is obliged to set up a target amount of orders (official demands priority) for SMEs year by year. As regards correcting the disadvantages of SMEs, amendments on the Law on the Prevention of Delay in the Payment of Subcontracting Charges and Related Matters were passed to ensure that subcontracting enterprises were well protected from abusive parent enterprises. The Law on the Promotion of Subcontracting Small and Medium Enterprises was enacted in 1970. This Law aimed to modernize subcontracting enterprises because of the increasing importance of subcontracting arrangements brought about by heightened international competition. There were also two measures carried out during this period. The first measure was in the area of improving their management skills through the provision on management consultant system in the SME Basic Law. And the second measure was to provide
26
retirement money for the small-enterprise entrepreneur through the Small-Enterprise Mutual Relief Projects Law of 1965. Finally, in response to the needs for a system to assist SMEs facing difficulty in obtaining funds from the open stock market, the Small Business Investment Company Limited Law was enacted in 1963, which made public capital available for long-term use. The Stable Growth Period (1973-1984) As the first oil crisis hit the country in 1973, the Japanese economy shifted from having high-growth to having stable growth. In response to this change, SME policies shifted from that of promoting modernization in equipment and management resources to that of developing “soft” management resources, which involved improving technical skills, manpower resource, and information. Accordingly, three institutions were established during this period. The Institute for Small Business Management and Technology was established in 1980 with the aim of developing human resources. The Information Center for Small and Medium Enterprises was opened in the Small Business Corporation to provide information services for management improvement. And the Regional Information Centers for Small and Medium Enterprises were also opened in prefectures with the aim of providing information and improving SMEs’ management skills. Transition Period, the First Stage (1985-1999) With the start of the yen’s revaluation in 1985 and an ongoing depression, the competitiveness of certain types of industries and particular regions where such industries agglomerated started to fall apart. Thus, the Temporary Law concerning Measures for Changing Business for Specific Small and Medium Enterprises was enacted in 1986. The objective was to specify the type of industries that would receive special aid during this period as well as to provide assistance to those who wanted to convert their businesses during this sluggish period. Aside from this, the Temporary Law Concerning Measures for Small and Medium Enterprises of Specific Regions was also enacted to promote the conversion of SMEs in certain regions heavily affected by the depression and yen revaluation. With the economic bubble finally bursting in 1992, the inflexibility of the Japanese economy, as evidenced by the decrease in the start-up rate and the increase in the closure rate as well as the increasing unemployment during this period, became the subject of concern (Kawai & Urata 2001). As an attempt to correct this problem, the Temporary Law Concerning Measures for the Promotion of the Creative Business Activities of Small and Medium Enterprises was enacted in 1995. The Temporary Law intended to stimulate SMEs and individuals entering into new businesses or investing in research and development without necessarily specifying a particular type of industry. The SME Modernization Law was enacted in 1963. Among others, the aim was to encourage the modernization of equipment of SMEs. The aforementioned law was combined with the Temporary Law Concerning Measures for Smooth Adaptation to

27
Structural Changes in Economy by Advancement of Specific Small and Medium Enterprises to New Fields, etc., which was enacted in 1993 with limited subjects of assistance. The combined law was called the new Law on Supporting Business Innovation of Small and Medium Enterprises. This new law was enacted in 1999 with the objective of aiding SMEs compete in the new environment that require advanced information technology, reduced costs, greater product quality and improved marketability of products. Transition Period, the Second Stage (2000- ) Until the end of 1999, the Japanese government based its SME policies on the former SME Basic Law enacted in 1963. The premise of the basic law was that the SMEs were small in size but large in number, old-fashioned and undifferentiated, and particularly weak. As such, SMEs needed special policies to support their growth. Consequently, conventional SME policies has been basically aimed at closing the gap between SMEs and large enterprises through pursuing the scale merit of SMEs while developing a uniform modernization policy for each industry. However, with the changing environment brought about by the growth and maturation of the economy, diversification of consumer needs, the information technology revolution, and the progress of globalization, the traditional view of SMEs and the past policy tools no longer fits the actual situation of SMEs. Instead of focusing on the disadvantages of SMEs caused by their size, modern policies now build on the strengths of SMEs that are mainly due to their mobility and flexibility in providing small-lot production of a variety of products that are in demand in the current quick-changing economic environment. Also, the recent decline of the start-up rate, which has now gone even below the closure rate, provokes concern that it may hamper the metabolism and labor-absorbing capacity of the economy. It was against this backdrop that the new SME Basic Law (which was a revision and restructuring of the conventional SME policies drawn from the SME Basic Law) was drafted in December 1999. Table 5-1 summarizes the basic differences of the Previous SME Basic Law and the New SME Basic Law. As can be read from the table, the key thrusts of the new Basic Law for SMEs are: ! to promote self-sustaining enterprises by promoting business innovation and new
business start-ups; ! to enrich business resources by strengthening the management base of SMEs; and ! to offer a safety net through facilitating adaptation to economic and social changes. For the first goal, it was acknowledged that the economy could be revitalized by venture businesses led by entrepreneurial managers who can take risks in developing new products and services or new production methods or management methods. However, there was recognition that the risks for creating new businesses were great and that policies should be made to support daring enterprises in their self-help efforts. It was for these reasons that new capital markets called “MOTHERS” started operating in the Japanese financial market from November 1999 and “Nasdaq Japan” from June of 2000. Both measures expanded options for SMEs in raising funds for their business activities. Moreover, to promote the development of the bond market available to

28
SMEs, a credit guarantee system for the issue of corporate bonds or privately placed bonds by SMEs was introduced. Finally, to support technological development, the government provided subsidies for new business development and spent money on SME-related research. Furthermore, the Small Business Innovation Research System (SBIR) provided support to SMEs up to the commercialization phase. The goal of strengthening SMEs’ management base would be attained through government programs that would supplement SMEs’ weak managerial resources and improving and improve SMEs’ business environment. The conventional view of developing business activities through improvement of “material” managerial resources has been replaced by the recognition of the increasing importance of “non-material” managerial resources. With this shift in view, the government sought the cooperation of the private sector in providing business expertise, technologies, and information and human resources. To illustrate, the Japanese government established support centers that provided the so-called “One-Stop” assistance services in terms of both funds and non-material services on each national, prefectural, and local level. Support centers made the most out of the skills and abilities of professionals in the private sector. This outcome was achieved through the setting up of and integration of networks of local public entities and various private SME support organizations, which offer information and advice on policy measures, as well as assisting with business and technological problems of SMEs in one place. The government has also strengthened the position of the SME Management Consultant system in the area of human resource development. Previously, the system only gave complementary assistance in public business diagnoses; however, the strengthened system could certify private business consultants with wide-ranging knowledge of SME businesses in general and advanced consultation skills. Notwithstanding the capability of SMEs to be self-sustaining, the government recognizes the occurrence of unexpected events outside the control of SMEs. Some of these events are sudden change in the trade structure or exchange rate, restrictions in the supply of raw materials, occurrence of a great disaster, chain-reaction bankruptcy triggered by the collapse of a large enterprise, to name a few. These events may damage SMEs’ businesses through no fault of their own. In such cases, the government carries out emergency relief measures as a form of safety net to stabilize business conditions. Among these measures are long-implemented financial measures against disasters and measures to prevent chain-reaction bankruptcies. The government has also sped up corporate rehabilitation procedures by reviewing the Bankruptcy Law, which was criticized as being biased against SMEs. Aside from these, a new corporate rehabilitation scheme, the Civil Rehabilitation Law, was also introduced. The government as of late has plans of further increasing and strengthening safety measures, particularly in the areas of finance and credit guarantee. These measures arm the SMEs to deal with adverse situations, such as the high frequency of both bankruptcies of large enterprises and major natural disasters in the country, among others, more effectively and promptly. It has often been said with good reason that policy development is one thing and implementation is another. It remains to be seen therefore, what the result of all these
29
policies on SMEs have been in Japan. Due to the time and data constraints, however, the analysis regarding this matter would be limited to seeing the current status of Japanese SMEs. In particular, the profile of their size, use of labor and value added as well as other indicators presented above may be used as measures of the dynamism (or lack of it) that SMEs provide to the economy. Japanese SMEs Best Practices If there were anything to be envied about the experience of Japanese SMEs that has called much attention, it would be their wide use of government-supported subcontracting and clustering.
Subcontracting (Shitauke)
The development of SMEs' linkages with larger enterprises have played a significant role in the highly successful business practices of the vertically integrated Japanese "keiretsu" financial-industrial groups during most of the post-war period. Similarly, linkages appear to have been important in the recent successes of township and village enterprises (TVE) in China. Another quite different synergistic relationship, based on both horizontal and vertical linkages, is represented by the kind of local cooperative/competitive development common for a long time in Europe and North America, but only recently dignified with the titles "industrial district" and "cluster" (McIntyre 2001). Subcontracting SMEs are those which have integral links with a larger foreign firm or to a domestic firm which is exporting. Subcontracting has helped the dispersal of industry and growth of SMEs and rural non-farm sector in many countries. The most successful example of subcontracting from large urban areas to small rural entrepreneurs is in Japan. The division of responsibility and resources in keeping with its economic propensity has given Japan an unparalleled global edge. Its success is attributed to expanding demand, limited capital, low basic skills and paternalistic relationships—i.e. big businesses share the production process, technology and innovation with SMEs. In the Japanese economy, subcontracting has been regarded as an important source of efficiency and competitiveness for industries such as textiles, general machinery, electric machinery, and automobiles (Fukunari 2001). By dividing the production process into small, specialized tasks, larger firms called ‘parent firms’ were able to exploit the efficiency of each individual subcontractor by allowing them to choose the scale of production appropriate for their tasks. Large Japanese enterprises have been particularly active in internationalizing their subcontracting networks through Asia in recent years. This has had the effect of increasingly integrating the traditional manufacturing part of the Japanese economy with its Asian suppliers. This is not a static process. As each economy becomes more developed and as costs rise, subcontractors need to move on to another lower cost base, or to move up the market to higher quality subcontracting. This brings forth a raft of issues with the main issue for the firm of how to remain competitive and for the

30
governments, how to ensure a reliable and efficient subcontractor industry, and how to help their subcontracting SMEs adjust and remain competitive. Thailand, Malaysia and Indonesia have adopted the Japanese model with variations to suit each nation's cultural and social environment. In Thailand for instance, large companies are allowed to develop ancillaries, which can operate within the same factory premises and yet are entitled to have independent recruitment, wage structure and service conditions. According to Japan's Ministry of International Trade and Industry (MITI), subcontracting is defined as follows: “A contractual arrangement between a firm and a ‘parent’ firm with larger capital or larger number of employees. The former firm is commissioned to produce products, parts, attachments, materials, or components used as inputs in the parent firm’s production, or to produce or repair facilities, equipment, tools and others which the parent firm uses in production. When a firm purchases non-customized parts, components, and others through a usual marketing channel, it is not regarded as subcontracting. In subcontracting, a parent firm orders the work directly to a subcontractor with assigned plan, quality, specifications, form, design, among others.” From the aforementioned discussions, it seems that all countries engage in subcontracting in one way or the other. What makes the Japanese practice of subcontracting special is its prevalence and almost default arrangement in production of labor-intensive or multi-layered production goods. How did this come to be? Kimura (2001) posited that the traditional Marxian view can shed light on the evolution of the subcontracting processes in Japan. This view regards large firms as having monopsonic power in determining prices, imposing requirements on product quality and delivery, and using small firms as buffer for business fluctuations. However, in the 1970s and 1980s, this traditional view of the dualistic structure in labor and capital markets for small and large firms started to break down with the increase in confidence of the Japanese on their economy. This is when the efficiency-enhancing nature of the subcontracting system was highlighted and used as the explanation for its wide usage. Among the acknowledged benefits of subcontracting were: 1) it saves costs to search and select new suppliers, 2) it is a good way of enhancing quality and reducing costs of the parent firm, 3) it successfully provides incentives for subcontractors’ investment on relation-specific assets, 4) it offers an efficient risk-sharing system, and 5) it sometimes is a good way of maintaining relationship by a certain amount of share holding. The dualistic structure of large enterprises and SMEs in the latter half of the 1940s and the 1950s may provide a historical explanation as to the emergence of subcontracting. This structure led large firms, who were the ones with greater direct access to foreign technology and export marketing channel, to subcontract SMEs who then had an abundant supply of labor, probably as a result of the disrupting effects of the war. This situation was complemented by the government's active promotion of SMEs through policies on financial arrangements (especially with regard to compensating liquidity constraints), managerial practice and technology, cooperative organizations, modernization scheme through advice, and tax concessions as well as protection against competition given to certain industries.
31
During the high-growth period of 1955-1973, SMEs were able to benefit from technological assistance given to them by their parent firms because of the long-term character of subcontracting arrangements. This resulted in their financial stability during this period. However, after 1973, the Japanese economy faced slower growth rates and scarcity of labor prevailed, while SMEs were gaining human capital, improving their technologies, and becoming more vigorous in their entrepreneurship. With these positive SME developments, the financial sector gradually removed their liquidity constraints. The 1980s, however, saw a different story. As the globalization of Japanese firms progressed, SMEs faced difficulties in finding new customers when their parent firms transferred production locations in other countries. Nevertheless, there were also a minority that were lucky enough to get foreign direct investments leading to their growth and graduation from subcontracting arrangements. So what factors, if present, increases the likelihood of subcontracting arrangements to be undertaken in the present times? First of all, mention must be made of the difference in the importance of subcontracting from industry to industry. Labor-intensive production processes such as textiles and clothing and multi-layered vertical production flows such as machinery industries are the ones that extensively use subcontracting arrangements. The result of a regression model (Kimura 2001) which made use of the 1994 Basic Survey of Business Structure and Activity compiled by MITI revealed that firm-size is inversely associated with the likelihood of firms to engage in subcontracting activities. Larger firms are less likely to accept work as a subcontractor and the probability of hiring subcontractors increases as firm-size increases. However, the aforementioned regression result does not preclude the fact that small firms employ subcontractors. Firms using subcontractors de-internalize a part of their activities and usually concentrate on the downstream activities of the value chain, while firms working as a subcontractor concentrate on production activities. In addition, firms utilizing subcontractors tend to internalize exporting activities and research and development, while firms working as a subcontractor are likely to de-internalize these activities. Finally, affiliates of foreign firms with a high proportion of foreign shares are more likely to use subcontractors and unlikely to work as subcontractors. The study ends with a note that although subcontracting continues to be prevalent in the Japanese industrial organization, it is no longer viewed as a necessary source of strength of firms in the 1990s. Nonetheless, the importance of subcontracting still remains if only for being effective in keeping the economy alive by supporting the entry of firms in certain industries. Since parent firms often encourage their employees to start new business and to be engaged in subcontracting relationship with them, new firms can avoid substantial initial investment because subcontracting allows them to specialize in a particular process that they are competitive in. With a consistent pool of small enterprises specializing in specific tasks, clustering is also likely to be formed.

32
Clustering8 Along with the large number of SMEs and the wide-use of subcontracting arrangements, clustering is also an important feature of Japan’s industrial organization. This claim is supported by the fact that in the 1996 SMEA survey, a total of 537 clusters existed throughout Japan (see Table 5-2 for breakdown), which is quite an appreciable number of groups of firms.
Porter (1998) defined clusters as geographic concentrations of interconnected companies and institutions in a particular business field. However, not all clusters are the same and their distinctions result from the historical circumstances, demand conditions, supporting industries, and competitive conditions that brought about their evolution. Nonetheless, in a study of 14 major cases of export-oriented manufacturing clusters in Japan, some common characteristics were found to have caused the birth of these clusters. A summary of the cluster development experience of the fourteen manufacturing clusters is found in Table 5-3. One of the basic drivers of cluster formation is the historical context surrounding the region in which these clusters are formed. Firstly, there are clusters that have already been known for the products that they specialized in, even before they modernized their manufacturing systems. This was particularly true for Kiryuu, Komatsu, Tsubame, and Nishiwaki clusters. Secondly, there are those that chanced upon unexpected contractions in supply of other countries of the product they were manufacturing. For instance, Tsubame’s success in exporting silverware was partly caused by the contraction of silverware supply in the United States and Europe. Lastly, there are those which benefited from an increase in demand for the items they specialized in, i.e., Ishikawa and Itabashi clusters. As a concrete example, Gifu’s success in apparel could be traced from the sale of used-clothes in front of the train station after WWII. Furthermore, availability of raw materials either in the cities themselves (i.e. Seto) or in neighboring cities (i.e. Gifu and Sanjo) also contributed to the development of clusters in some locations. The second factor that can also be linked to historical circumstance is the presence of large assemblers that manufacture products through assembly-type operations, stimulating the entry and growth of other firms to supply parts and related products to them. For example, the machinery cluster in Komatsu influenced firms in the area to shift from silk production to production of construction machinery. Another good example is the cluster in Ota wherein the conversion of a part of Nakajima Aircraft (divested after WWII) to Fuji Heavy Industries resulted in the formation of a network of auto part suppliers in the city. The third factor, which is also related to the availability of raw material in the region, is the prior existence of supporting industries where clusters form. This is exhibited by Nakajima Aircraft when it nurtured such network of supporting and related industries before the war so that Fuji Heavy Industries did not have too much difficulty especially in recruiting labor fit for its production. The binocular clusters of Itabashi had optical equipment and precision instrument manufacturers in the region prior to its rise as a
8 This is largely taken from Yamawaki (2001)

33
major producer of binoculars, which attracted makers to enter the region. As aforementioned, supporting industries need not be in the region or location to spur the formation of clusters. The presence of supporting industries in neighboring cities has supported and helped in maintaining clusters in other locations. For instance, the hand tool cluster in Sanjo has received much support from the silverware industry in Tsubame, which made use of specialized skills in metal working, forging, processing and polishing; and the apparel cluster in Gifu has received support from nearby cities as well. The fourth factor leading to the formation of clusters is the availability of pooled labor market for part-time workers. This was displayed by the apparel cluster in Gifu which made use of a large pool of part-time female workers who offered the needed skills while minimizing the disadvantages caused by cyclical demand. The same can be said about the textile clusters in Ishikawa and Fukui both of which, being situated in agricultural sectors, took advantage of the existence of a large pool of part-time workers. It must be noted, however, that the skills that these laborers offer are lower than those of regular workers because these laborers normally work as subcontractors for first-tier and/or second-tier suppliers that mostly require labor-intensive work. The fifth factor is the reduction in transportation cost. This is well illustrated by the furniture cluster in Morodomi. With the building of the toll bridge over the Chikugo River around 1955, Morodomi was connected to the city of Ohkawa which was already a major producer of furniture then and was in search of new locations to expand its manufacturing base. With the new bridge significantly reducing transportation costs required to travel between these two cities, furniture makers in Ohkawa moved into Morodomi and invested in new capacity. The number of furniture firms in Morodomi further increased in 1966 when the toll of the bridge was eliminated. The sixth factor is the regional government policy with regard to supporting cluster formation. The best example of this is the Ishikawa and Fukui prefectures, both of which took initiatives to nurture and modernize their textile industries in order to develop their regional economies. Fukui’s prefecture was also responsible for the birth of the eyeglass frames clusters in Sabae, as it designed the start-up operations in the Sabae cluster. Perhaps, the most important policy tool used by Japan’s prefecture governments was the establishment of public testing and research centers, and technology centers which guided and fostered the technological developments of particular products. Between 1894 and 1926, a total of 41 public testing and research centers and technology centers were established in different prefectures to promote technological development in textiles, ceramics, agriculture, chemicals, and food. The importance of such centers in providing technological guidance and consulting, testing and inspection, research and development, seminars, and dissemination of information on latest technologies and products have always been recognized. The establishment of such centers continued in subsequent periods leading to the opening of 46 centers during the 1927-45 period and another 57 centers during the 1946-1964 period. Nowadays, there has been increased importance placed on local institutions such as local trade associations, wholesaler associations, local chambers of commerce, and prefectural technical centers on product
34
and technological information dissemination. Finally, the transfer of technology from other locations, whether foreign or domestic, has also proven to be an important cause of cluster formation. The textile clusters in Fukui and Nishiwaki imported technologies from other textile clusters in Japan. The same applies to Sabae’s eyeglass frame cluster, which imported the related technologies and skills from Tokyo and Osaka. Among the importers of foreign technologies are Kiryu (which procured the Jacquard technology from abroad) and Itabashi (which imported technology, related to the production of binoculars, from Germany). The seven factors are by no means substitutes to one another and, in many cases, have actually been found to be complementary to each other. The list is not exhaustive of all the possible reasons for cluster formation. It merely presents the seemingly important factors that brought about the birth of the 14 major clusters in Japan. Interestingly, these factors are consistent with those derived from the experiences of the United States and Europe with regard to cluster formation. However, Yamawaki (2001) posited that albeit consistent with international experiences regarding clustering, notable differences that make the experience distinctively Japanese are: ! it makes extensive use of subcontracting; ! it encourages a hierarchical relationship between manufacturers and multiple layers
of suppliers; ! it supports proliferation of small size of suppliers; ! it gives prime importance to on-the-job-training; ! it is characterized by a low degree of labor mobility of skilled workers between
firms; ! it gives preference for internal labor markets to external labor markets to allocate
human resources; and ! it engages the establishment of various institutions such as trade associations,
business associations, and wholesalers associations in its information campaign. Clustering arrangement brings benefit to member firms. According to Marshall (1920) and Krugman (1991), the three advantages of concentrate-production are in terms of labor market pooling, specialized inputs, and technological spillovers. A survey of 537 clusters conducted by the SMEA in 1996 revealed the respondents perceived advantages regarding cluster membership. A summary is presented in Table 5-4. The survey results also reveal two distinctive sources that were laid out by Marshall and Krugman as being applicable to the Japanese experience: specialized inputs (represented by the category “specialization/division of labor”) and technological spillovers (represented by the category “diffusion of technology and technological cooperation”). This finding suggests that agglomeration occurs in the Japanese clusters. This is because the clusters can support suppliers that possess specialized complementary skills. Manufacturers can benefit from the existence of specialized suppliers through division of labor. Suppliers can choose the optimal combinations of technologies for a wide range of products, especially in a changing global economic environment characterized by individualistic consumers demanding a wide variety of high-quality products to be

35
provided in the shortest time possible9. Although the advantage of division of labor can also be exhibited by subcontracting firms that are not necessarily situated in the same location, the benefits of efficient organization are enjoyed more if firms are located near each other. Another major motivation for forming clusters is the benefit of technology and information spilling over between nearby firms. As was pointed out earlier, the importance of regional institutions in facilitating spillovers is not trivial. This is why public technical centers are actively engaged in offering technical consulting services and seminars and disseminating information on new technology and product in its prefectures. Likewise, local chambers of commerce, trade associations, and business organizations coordinate business activities within clusters and provide needed information. The results of the SMEA survey also provides a sketch of an explanation as to why a pooled labor market for skilled workers is not an important source of advantage in Japanese firms. The answer is gleaned from the way skills are created and developed in Japanese firms and how these skills are allocated among firms in Japan. Koike (1988) posited that it is a common notion that on-the-job training is the most commonly used method to train workers in Japanese corporations in the belief that most skills are learned only by doing. Hence, most of the skills are firm specific or plant specific. This explains why the possible advantage of labor pooling is not commonly perceived by Japanese firms since in order to become an advantage for the cluster, skilled workers must be mobile and be able to use their skills in other firms. As a result, internal markets (of being “stuck” to a certain skill) became the avenues by which firms choose their laborers and at the same time, influence the workers to stay with the same firm until retirement. 6. Philippine SMEs in the Global Economy Over the past years, the government of the Philippines has intensified its effort to provide policy climate and support mechanisms for SMEs. The roles of SMEs in employment generation and wealth creation have been emphasized and acknowledged as evidenced by the intensification of developmental policies for SMEs. If one is to compare the assistance the government has extended to the SME sector during the years after World War II until around the mid 1980s, the government has done a remarkable job in acknowledging the importance of SMEs through SME promotion. As aforementioned, the period from 1940s to the 1990s saw the proliferation of SME support programs but with little positive results. Beginning in the late 1980s and early 1990s, there were significant efforts to intensify SME programs, as it were. The Philippine government has passed Republic Act 6977 or the Magna Carta for SMEs to address the problem of uncoordinated programs for SMEs. The law established two major SME institutions: the SME Development Council or simply SMED Council; and the Small Business Guarantee Finance Corporation or SBGFC. In terms of access to low cost financing, some P164.2 billion was set aside for SME Enterprise Credit by the end of 2002. This amount set aside for just that year was about 10 times more than the previous bank lending channeled to SMEs which amounted to only P16.1 billion over forty years prior to the promulgation of RA 6977 in 1991. The Philippine government
9 The Yokohama Industrial Institute (1991).
36
has also continued to pursue programs to help SMEs in finding market niches and in providing human resource training. The establishment of the APEC Center for Technology Exchange and Training for SMEs (ACTETSME) signaled its commitment to build better operating environment for the sector. The Philippine SMEs have had consistent themes in terms of concerns and roadblocks throughout the years. These themes fall broadly under organization and management structure, market orientation, type of labor, sourcing of inputs, sources of capital and sources of technology. These concerns and roadblocks have been regarded by many as primary factors in the rather static state of SMEs across time. Furthermore, domestic SME issues and concerns are not entirely separate from issues related to globalization, trade liberalization and SMEs. With the impacts of globalization and its manifestations, additional measures have been considered as priorities to strengthen the SME sector. At the national level, the development of SMEs calls for various policies regarding the following to further develop the sector and to help it in the face of heightened competition: ! Marketing. Sectors with a competitive advantage need to be identified and sector-
specific innovative marketing support devised. SMEs need to be promoted as ideal destinations for franchising and outsourcing.
! Technology. Technology upgrading becomes a key parameter of competitiveness.
It is necessary to focus on enhancing technology information through a technology bank and facilitating technology transfers through soft financing and capital subsidy scheme. Furthermore, transfer of technology to SMEs can also be facilitated by suitable arrangements such as, for example, regional information networks, subcontracting and networking, and the provision of timely and adequate finance to SMEs
! Management skills upgrading. The spillover technological effects of
technological transfer benefits local human capital as well. There is a need to upgrade skills of people in this sector, provide adequate training in terms of current, efficient management practices and information on cost-effective yet efficient way of doing work-related matters to help them keep up with heightened competition.
! Infrastructure. Power, water, industrial estates, roads, telecommunications and a
clean environment are some of the more critical aspects of infrastructure for doing business. Production and commerce are heavily dependent on these inputs. Improvement in infrastructure facilities for SMEs is necessary to enhance their efficiency and productivity.
! Clusters. Clusters have the potential to be springboards of core competencies. The
creation of common facilities, upgrading of infrastructure, demonstration projects, capacity building, strengthening of association, targeted credit delivery and brand building are activities that should be built around clusters. Moreover, cluster development has to be accorded priority. The program needs support in the form of

37
adequate infrastructure for the clusters and active involvement of industry associations in the maintenance of these clusters.
! Linkages. Adequate backward and forward linkages need to be established between
small and large units in terms of subcontracting, production sharing and manufacture of parts.
! Access to information. Databases on market-related and financing-related
information need to be identified and made accessible in a user-friendly manner. Moreover, suitable measures should be taken to enhance the access of the SME sector to information particularly relating to external markets and foreign investment.
! Innovative financing techniques. There is a need to develop innovative financing
measures such as setting up venture capital funds, leasing companies, mortgage finance companies, factoring companies, trade credit suppliers and microfinance.
! Microfinance. The development of microfinance promotes economic growth,
thereby contributing to poverty alleviation. Not only does financial development foster economic growth and create employment opportunities for the poor, but it also helps to mobilize savings.
! Industrial dispersion. The process of industrialization should be extended to the
countryside because much of the existing growth of SMEs has taken place in and around the metropolitan areas.
SMEs, Globalization and International Trade The inevitable and irreversible process of globalization has enhanced the opportunities for success, but it has also posed new risks to developing countries. Thus, economies worldwide need to capitalize the positive aspects of globalization and mitigate its negative consequences. Globalization has many faces; however, it is easily comprehended in economic and financial terms. In this sense, it deals with the broadening and deepening linkages of national economies into a worldwide market for goods, services and capital. Perhaps the most prominent face of globalization is the rapid integration of production and financial markets over the last decade. As a result of a revolution in telecommunications and information technologies, the last 15 years have seen dramatic increases in trade linkages and cross-border capital flows, as well as radical changes in the form, structure and location of production. It has to be underscored that the process of globalization and liberalization has assisted firms in operating across national boundaries, affecting thereby the pace and the whole process of industrial development. There is increasing realization that the opening of global markets through trade liberalization is not only making it easier for firms to extend their operations beyond national boundaries but also providing greater potential for expansion and growth. However, not all countries benefit from globalization and liberalization. This is because the situation requires competitive capacity and

38
additional resources for investment, in addition to technological and marketing linkages to promote rapidly changing and high-quality products and services. This is where the importance of global production networks lies. It is essential that all countries and economies be somehow linked and integrated into such production networks so that sustainable regional and global production structures could be created for everyone to play mutually beneficial economic roles. Despite the adverse effects of the economic crisis in 1997, countries worldwide continued with their commitment to liberalization and globalization. SMEs account for a large percentage of industrial establishments in Asia. Currently, these SMEs are facing a serious shortage of capital, markets and professional management, to name but a few. Accordingly, countries in Asia have started and continued special programs for the development and technology upgrading of SMEs. These programs provide emphasis on the development of physical infrastructure, especially public utility, research and development and technical-oriented infrastructure, which are particularly needed by the SMEs and human infrastructure. Moreover, countries also continued efforts to move from resource-based and labor-intensive types of industries to skill- and knowledge-based and medium- and high-technology industries; they also liberalized foreign investment policies to attract more foreign direct investments and portfolio investments. As globalization is likely to continue at an accelerated pace, the implications for industrial development and restructuring in line with the requirements of globalization are wide-ranging and include both opportunities and challenges. That having been said, it should be noted, especially in the context of promoting SMEs through the bilateral trade partnership and cooperation with Japan, that a critical long-term policy challenge is how to manage globalization and creating new sources of growth by increasing SME exports. The enormous potential for SMEs to contribute to economic development will be undermined if SMEs will not be able to take advantage of the attendant opportunities and competitive pressures that a global economy brings. There are SMEs which are either not growth-oriented or do not succeed in growing and have no international activity (see Tecson 2001). These SMEs make a rather static contribution to the economy. Although they employ a significant proportion of people, they do not contribute a lot to employment growth. Many only have a relatively short life expectancy, about 3-5years, although this depends on the economy. Many of these SMEs are at risk in face of increasing international competition. The main issue that governments face is how to assist them to be competitive. Evidence suggests that a high percentage of net job creation and a much long-term economic dynamism are attributable to a small proportion of SMEs that are growth oriented and entrepreneurial. Providing these SMEs with international opportunities is important because they are potentially a major source of long-term sustainable economic growth. At present most of the international entrepreneurial SMEs are in more advanced economies, but this is likely to change. In many cases, most of the products produced by these SMEs have a strong "services" element; an important implication, therefore, is that internationalization requires some form of physical presence through foreign direct investments, or by alliances and franchises.
39
Evidence also reveals that about a small percentage of manufacturing SMEs are engaged in international activity. Economically they are important because they significantly contribute to exports, and thus to GDP. In theory, open regionalism will open further opportunities for increased trade, and thus for even more contribution to economic growth. In practice, there is a long way to go to free trade. But inroads have been experienced in terms of reduction of trade impediments to these SMEs. The main issue for SMEs is how to identify and take advantage of opportunities and how to resolve or avoid impediments quickly and cheaply. Mentioned below are issues that need to be considered and addressed: ! Access to markets. Relatively minor impediments can be a major barrier to SME
international trade. The impediments may be attributable as much to cultural differences and business practices, as to intentional government policy.
! Simplified standardized customs procedures. Standardizing customs procedures
and allowing electronic submission and handling documents has been effective in reducing transactions costs associated with SME international trade.
! Human Resource Development. SMEs engaged in international trade need better
management skills, especially in areas of risk management, cultural understanding, export management, and trade financing.
! Swift resolution of disputes. SMEs cannot usually afford to engage in prolonged
and expensive legal disputes. ! Trade finance and credit guarantee. SMEs frequently have difficulty in
obtaining trade finance and credit guarantees at rates approximating the real risk. Some economies have specialist SME credit providers or programs to help address the problem.
! Trade facilitators. A number of private sector companies play an important role in
facilitating SME trade. For example, trading companies, such as the Japanese Sogo Sosha, play an important role in linking SME suppliers to larger markets. Even SMEs themselves can often act as specialist facilitators to other SMEs or via networking group.
! Export promotion and assistance. Many economies in the region provide export
assistance to increase the competitiveness of their SME exporters. It is possible for these measures to have distorting effects on the pattern of trade and resource use.
! Tariffs and non-tariff restrictions. Undesirable tariffs and non-tariff restrictions
on their products must be removed to enhance the export potential of SMEs since SMEs are most vulnerable to trade protectionism and exchange rate fluctuations.
With current developments, there is a need for individual economies to set up focal points for SMEs at the national level which are linked to other similar focal points in neighboring countries in the region and even outside the region. Such linkages provide for quick and efficient information exchange on trade and investment opportunities for
40
SMEs. Such focal points could also provide training and information on sources of technology and finance and act as instigator for setting up and strengthening linkages among SMEs under cooperative marketing, joint manufacturing arrangements, and linkages of various kinds between SMEs and large enterprises, both domestic and foreign. Governments in developing countries should also adopt a comprehensive set of selective support measures for linkages between SMEs and large enterprises. Business associations should also figure in importantly in facilitating such linkages, as well as networking of SMEs. This is because networking can play an important role in supporting SMEs in marketing their products. Networking is of many types. However, vertical (aimed at finding complementary activities in the development of a new product) and knowledge networks (associations geared at solving a common technology or market information) are more relevant in the current context. Furthermore, the globalization process has called for a drastic re-orientation in terms of domestic economic policy issues, calling for a change in the government's role towards SMEs. One of the principal measures in support of the SMEs would have to involve the attenuation of macroeconomic and sectoral policy biases against SMEs which have accumulated over the years in developing economies10. The elements of these policies and their consequences are fairly well known. Trade and exchange rate policies in support of rapid industrialization efforts often give rise to overvalued exchange rates, which make the exports of SMEs non-competitive in international markets. Tariffs and taxation are important policy elements in all countries. However, it has been found that in most cases they benefit large enterprises and not SMEs. It has been established that import regimes (including tariff rates) are inherently biased in favor of large industry. As far as tax concessions are concerned, only in few countries like India does tax exemption from central excise tax seems to be directed to SMEs. In most other countries, tax exemptions seem to be given on the basis of considerations other than size. Investment incentives are generally scale-based, favoring large enterprises and projects and capital-intensive production techniques over small-scale and labor-intensive technologies. And there are macroeconomic policies that tend to protect large enterprises against competition from SMEs. Philippine Exportable Products to Japan11
Selected Philippine-Japan Bilateral Trade Statistics Recent Philippine-Japan bilateral trade statistics (see Table 6-1) reveal that Philippine exports to Japan is growing at a slower rate than do total Philippine exports during the period 1998-2002. While overall Philippine exports grew by an average of 8 percent during this period, exports to Japan grew by 5 percent. The growth in total Philippine
10 Please see Tecson (2001) for a more comprehensive discussion on these biases. The long and short of it is that there were policies set in the past that had negative impacts, to an extent, on SME development. 11 This sub-section is largely taken from rather recent findings of Palanca-Tan (2003), whose trade data came from the Department of Trade and Industry (DTI), the National Asia Pacific Economic and Scientific (NAPES) Database and the Personal Computer-Trade Analysis (PC-TAS) of the International Trade Center UNCTAD / WTO.

41
exports was largely attributed to the strong export performance of “Industrial Manufactures” During this period, the dominant Philippine export to Japan was “Industrial Manufactures”, with a share of about 73 percent. This was followed by “Machineries” (8.18 percent), “Food and Food Preparations“ (8 percent), “Resource-Based Products” (6.52 percent), “Consumer Manufactures” (6.38 percent) and “Special Transactions” (5.73 percent). It is important to mention that the largest contributor to the share of “Industrial Manufactures” was electronics, which accounted for around 60 percent of the total. The strong performance of the electronics sector, as expected, came from semiconductor exports and electronic data processing. Furthermore, fresh produce and vegetables contributed a little more than half to the share of “Foods and Food Preparations”, while marine products, mainly shrimps and prawn, accounted for about 3 percent. Tuna export had been in the decline in recent years. Looking at the growth of Philippine exports to Japan, there were only three major sectors that experienced positive export growth. These were “Special Transactions” (9.28 percent), “Industrial Manufactures” (8.32 percent), and “Machineries” (3.84 percent). The rest of the major sectors had declines in exports. Although “Food and Food Preparations” posted negative growth, it is noteworthy to mention that “Fresh Produce” (under “Foods and Food Preparations”) had positive export growth at 2.97 percent. This, however, could not help alleviate the performance of its major sector. According to Palanca-Tan (2003), “Japan absorbed about 15 percent of Philippine exports in 1998-2002. It was the single biggest buyer of Philippine shrimps and prawns (71 percent) and fresh fruits and vegetables (60 percent) during the period. A fourth to a third of Philippine exports of transport equipment and automotive parts as well as electronic products such as data processing, telecommunications and automotive electronics were destined for Japan.” However, Japan had a remarkably lower share of about 10% in our semiconductor exports. And even smaller were the shares of Japan in Philippine processed food (7 percent) exports and consumer goods (8 percent) exports.
Prospects for Philippine Exports to Japan Palanca-Tan (2003) presented and identified Philippine exportable products to Japan. The methodology used was that of Balassa’s revealed comparative advantage (RCA) index. Moreover, an import index was computed to identify products that the Japanese source externally. Products which are prospects for exports to Japan, therefore, are those having an import index greater than one, Philippine RCA greater than one, and in addition, with Philippine RCA greater than Japan RCA. Table 6-2 lists the said products with 1999 RCA and Import Indexes values. These products are:
1. fish fresh simply preserved 2. fish etc. tinned prepared 3. fruit fresh nuts fresh dry 4. fruit preserved prepared 5. fuel wood charcoal
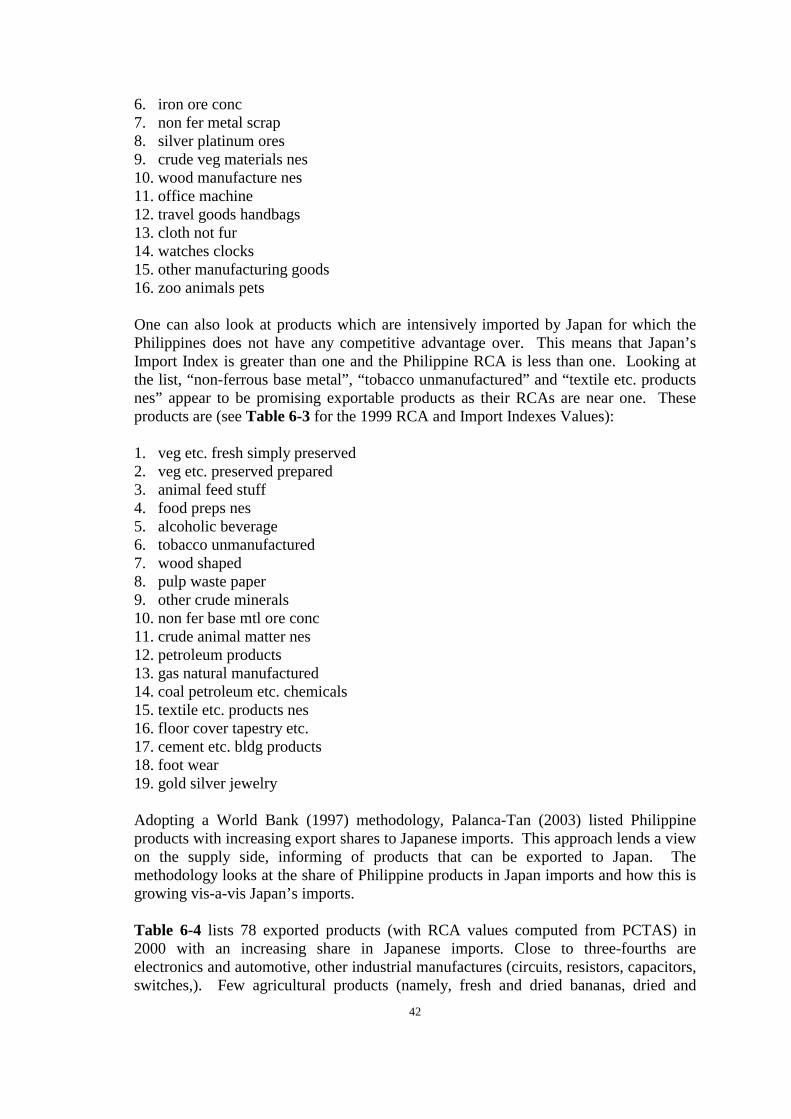
42
6. iron ore conc 7. non fer metal scrap 8. silver platinum ores 9. crude veg materials nes 10. wood manufacture nes 11. office machine 12. travel goods handbags 13. cloth not fur 14. watches clocks 15. other manufacturing goods 16. zoo animals pets
One can also look at products which are intensively imported by Japan for which the Philippines does not have any competitive advantage over. This means that Japan’s Import Index is greater than one and the Philippine RCA is less than one. Looking at the list, “non-ferrous base metal”, “tobacco unmanufactured” and “textile etc. products nes” appear to be promising exportable products as their RCAs are near one. These products are (see Table 6-3 for the 1999 RCA and Import Indexes Values):
1. veg etc. fresh simply preserved 2. veg etc. preserved prepared 3. animal feed stuff 4. food preps nes 5. alcoholic beverage 6. tobacco unmanufactured 7. wood shaped 8. pulp waste paper 9. other crude minerals 10. non fer base mtl ore conc 11. crude animal matter nes 12. petroleum products 13. gas natural manufactured 14. coal petroleum etc. chemicals 15. textile etc. products nes 16. floor cover tapestry etc. 17. cement etc. bldg products 18. foot wear 19. gold silver jewelry Adopting a World Bank (1997) methodology, Palanca-Tan (2003) listed Philippine products with increasing export shares to Japanese imports. This approach lends a view on the supply side, informing of products that can be exported to Japan. The methodology looks at the share of Philippine products in Japan imports and how this is growing vis-a-vis Japan’s imports. Table 6-4 lists 78 exported products (with RCA values computed from PCTAS) in 2000 with an increasing share in Japanese imports. Close to three-fourths are electronics and automotive, other industrial manufactures (circuits, resistors, capacitors, switches,). Few agricultural products (namely, fresh and dried bananas, dried and
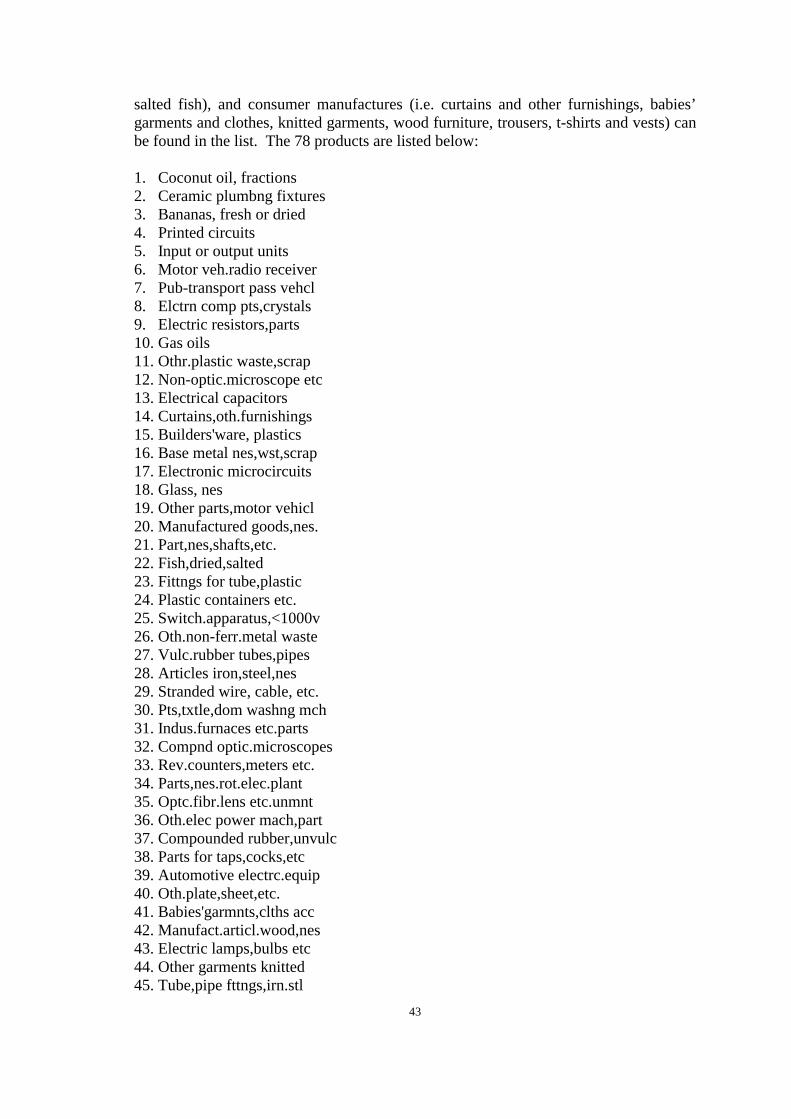
43
salted fish), and consumer manufactures (i.e. curtains and other furnishings, babies’ garments and clothes, knitted garments, wood furniture, trousers, t-shirts and vests) can be found in the list. The 78 products are listed below:
1. Coconut oil, fractions 2. Ceramic plumbng fixtures 3. Bananas, fresh or dried 4. Printed circuits 5. Input or output units 6. Motor veh.radio receiver 7. Pub-transport pass vehcl 8. Elctrn comp pts,crystals 9. Electric resistors,parts 10. Gas oils 11. Othr.plastic waste,scrap 12. Non-optic.microscope etc 13. Electrical capacitors 14. Curtains,oth.furnishings 15. Builders'ware, plastics 16. Base metal nes,wst,scrap 17. Electronic microcircuits 18. Glass, nes 19. Other parts,motor vehicl 20. Manufactured goods,nes. 21. Part,nes,shafts,etc. 22. Fish,dried,salted 23. Fittngs for tube,plastic 24. Plastic containers etc. 25. Switch.apparatus,<1000v 26. Oth.non-ferr.metal waste 27. Vulc.rubber tubes,pipes 28. Articles iron,steel,nes 29. Stranded wire, cable, etc. 30. Pts,txtle,dom washng mch 31. Indus.furnaces etc.parts 32. Compnd optic.microscopes 33. Rev.counters,meters etc. 34. Parts,nes.rot.elec.plant 35. Optc.fibr.lens etc.unmnt 36. Oth.elec power mach,part 37. Compounded rubber,unvulc 38. Parts for taps,cocks,etc 39. Automotive electrc.equip 40. Oth.plate,sheet,etc. 41. Babies'garmnts,clths acc 42. Manufact.articl.wood,nes 43. Electric lamps,bulbs etc 44. Other garments knitted 45. Tube,pipe fttngs,irn.stl
44
46. Furniture,nes,of wood 47. Automatic control instrt 48. Plstc sheet etc.self-adh 49. Locks,safes,strong boxes 50. Trousers, breeches etc. 51. Soap 52. T-shirts,othr.vests knit 53. Line telephone etc.equip 54. Estrs,inorganic acid,etc 55. Photo,cine.equipment nes 56. Zinc,chrom.iron etc.oxid 57. Mch-tools,special.indust 58. Instruments,analysis etc 59. Electric.motors<=37.5w 60. Sacks,bags,txtl.material 61. Float,ground,plshd.glass 62. Non-refractory brick,etc 63. Elect machnery,equip,nes 64. Metal fencing,gauze etc. 65. Welding,brazing etc.mach 66. Screws,bolts,nuts,irn.st 67. Containers,etc.of paper 68. Digital computers 69. Monocarboxylic acids,drv 70. Drawing,measurg.instrmnt 71. Spraying machinery etc. 72. Lenses,prisms,etc.mountd 73. Chem.products etc.nes 74. Parts,paper mill etc.mch 75. Mach.tools,metal removal 76. Parts,nes,aircraft,equip 77. Medicaments, nes 78. Chem.elmnts for electrnc
7. Trade Cooperation with Japan: Policy Implications Trade cooperation between the Philippines and Japan, and the attendant goal of export expansion for both sides, will undoubtedly have beneficial impacts on the economy. One way by which trade cooperation with Japan can potentially help Philippine SMEs is by way of Japan’s opening its doors to Philippine exports, particularly those products produced by SMEs. However, Philippine-Japan bilateral trade statistics presented above do not appear to be encouraging to Philippine SMEs. This is because exportable products, and even potential exportable ones, appear to be generally produced by large manufacturing firms. This is true for products of industrial manufactures, particularly electronics, which account for a large percentage of Philippine exports to Japan. In addition, the fresh produce and vegetables and marine products that Japan imports from the Philippines come mainly from large firms that have close contacts with Japanese Sogo soshas (trading companies such as Marubeni, Mitsubishi and Mitsui, etc.) which acts as liaison to Japanese importers.
45
The economic benefits of more active intra-regional trade and investment flows in general, and bilateral trade agreements in particular, as means to spur the growth of a modern, export-oriented SME sector remains to be fully realized. The pursuit of regional cooperation in SME development is based on the premise that this will enable SMEs to take advantage of economies of scale and scope. Local cooperatives have historically been viewed as an instrument that allows SMEs to achieve economies of scale in marketing and purchasing. Regional cooperation can extend this process, enabling local SMEs to effectively take advantage of scale economies. Subcontracting systems at a regional level can be employed, thus promoting closer interface and interdependence between large enterprises and SMEs. However, it is essential to identify priority industries in formulating these cooperation measures. It is first necessary, therefore, to identify specific SME industry with export potential. Once such identification is done, each industry could be closely evaluated to see where and how it needs assistance in terms of product development, standardization, technology upgrading and skills development. Furthermore, once these industries are identified for assistance, initiatives could be launched to develop arrangements through which market identification schemes can be designed for complementary exports. In the area of forging linkages between large industries and SMEs, specific industries from Japan can be studied to learn and understand how such linkages were developed, risks encountered and reasons for success. Technology flow, technical and financial assistance, improved supply and marketing arrangements, promotion of industrial activities and training of personnel are a few areas where such schemes may be formulated to foster such cooperation. Cooperation measures would also have to be supplemented and complemented by measures at the national level, particularly by removing those barriers that hinder SME growth. These measures would broadly include removal of obstacles in obtaining access to inputs such as technology, credit and training, reforming tariff structures and removing quotas, introducing realistic interest rates and dismantling physical controls on size and output.
46
BIBLIOGRAPHY
I. Articles, Books, Researches, Etc. Alfonso, Oscar M. (Ed.) (2001).Bridging the Gap. Quezon City: Small Enterprises
Research and Development Foundation, Inc. Carlos, A. (1972). A Report on the Smaller Enterprise Management and Development
Training Courses Held at the Osaka International Training Center, Overseas Technical Cooperation Agency, Japan from January 10, 1972 to March 27, 1972. Unpublished report, UP-ISSI, Philippines.
Hall, C. (1995). APEC and SME Policy: Suggestions for an Action Agenda. Australian
APEC Study Center Network. III. Japan International Cooperation Agency (JICA) and Department of Trade and Industry
(DTI) (2003). Interim Report for Support Program for SME Development Plan in the Republic of the Philippines. Tokyo: UNICO International Corporation. July.
Japan-Philippines Economic Partnership Agreement. Working Draft as of 21 April
2003. Japan Small Business Corporation International Affairs and Research Dept. Steps to
Globalization of Small and Medium Enterprise Management. Tokyo: Japan Small Business Corporation.
Japan Small Business Research Institute (1997, December). A Study of SMEs’
Internationalization Strategies (Synopsis). Tokyo: Japan Small Business Research Institute.
Philippine Chamber of Commerce and Industry (1994, October). Impact of Kalakalan 20:
Results of the National Survey Conducted by the Philippine Chamber of Commerce and Industry.
Palanca-Tan, Rosalina. (2003). Prospects and Problems of Expanding Trade With
Japan: A Survey of Philippine Exporters. Unpublished Preliminary Report. Small and Medium Enterprise Agency, MITI. (1990, March). Outline of the Small and
Medium Enterprise Policies of the Japanese Government. Tokyo: Small and Medium Enterprise Agency.
Small and Medium Enterprise Agency, MITI. (1975). The Shift to an Economy of Slow
Growth and Small Business. White Paper on Small and Medium Enterprises in Japan. Tokyo: MITI.

47
Small and Medium Enterprise Agency (1981). White Paper on Small and Medium Enterprises in Japan. Tokyo: MITI.
The Yokohama Industrial Institute (1991, March). Improving Management Strategy
and Productivity of Small and Medium-Sized Companies. Yokohama, Japan. Trade and Industry Information Center (1996). Small Business in the Philippines.
Makati: Bureau of Small and Medium Business Development, DTI. II. From the Worldwide Web: ASEAN-EU Partenariat ’97. ASEAN SMEs: Small and Medium Industries in the
Philippines.<http://aeup.brel.com/sme/sme.html> Berry, A., and Rodriguez, E. (2001). Dynamics of Small and Medium Enterprises in a
Solow-Growth Economy: The Philippines in the 1990s. Washington, D.C.: The International Bank for Reconstruction and Development/The World Bank. <www.worldbank.org/wbi/publications/wbi3718.pdf>
Chan Robles Virtual Law Library. Republic Act No.8289 Amending Republic Act
No.6977; R.A. 6810. The ChanRobles Group. <http://www.chanrobles.com/republicactno8289.htm>
Itoh, M., & Urata, S. (1993). Small and Medium Size Enterprise Support Policies in
Japan. The World Bank. <http://econ.worldbank.org/files/457_wps1403.pdf> Kawai, H., and Urata, S. (2001). Entry of Small and Medium Enterprises and
Economic Dynamism in Japan. Washington, D.C.: The International Bank for Reconstruction and Development/The World Bank. <http://wb.rcsme.ru/eng/>
Kimura, F. (2001). Subcontracting and the Performance of Small and Medium Firms
in Japan. Washington, D.C.: The International Bank for Reconstruction and Development/The World Bank. <www.worldbank.org/wbi/publications/wbi37192.pdf>
Lagua, B. SME Characteristics and Statistical Needs in the Philippines. Powerpoint
Presentation. <www.oecd.org/dataoecd/3/49/15004719.ppt> Small and Medium Enterprise Agency, METI. Outline of Japan’s SME Policies.
<http://www.sme.ne.jp/policies/menu.html> Small and Medium Enterprise Agency. (1999). Toward and Age of Business Innovation
and New Start-ups. 1999 White Paper on SME in Japan. <http://www.chusho.meti.go.jp/sme_english/wp1999/>

48
SME Agency (ed.). (2002). The Age of the Local Entrepreneur—Birth, Growth and Revitalization of the National Economy. Data only. White Paper on Small and Medium Enterprises in Japan 2002. <http://www.chusho.meti.go.jp/hakusyo/h14/download/2002english_WP.pdf>
Yamawaki, Hideki. (2001). The Evolution and Structure of Industrial Clusters in
Japan. Washington, D.C.: The International Bank for Reconstruction and Development/The World Bank. <www.worldbank.org/wbi/publications/wbi37183.pdf>
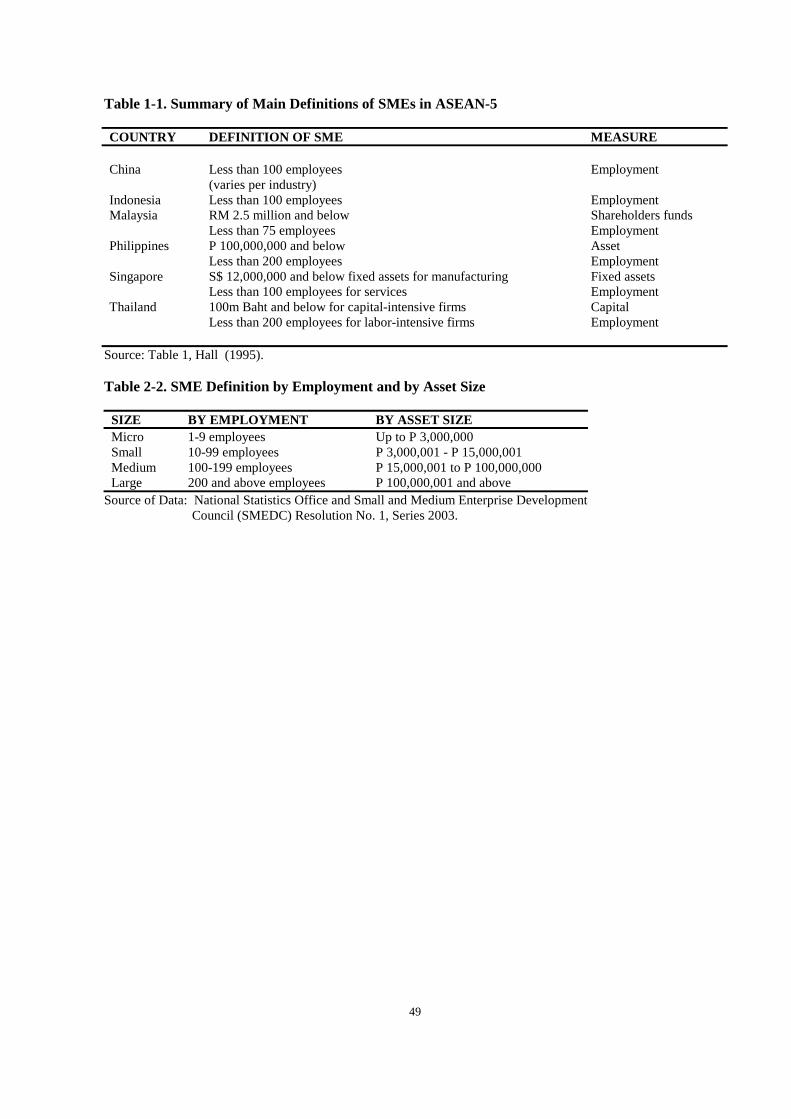
49
Table 1-1. Summary of Main Definitions of SMEs in ASEAN-5
COUNTRY DEFINITION OF SME MEASURE China
Less than 100 employees (varies per industry)
Employment
Indonesia Less than 100 employees Employment Malaysia RM 2.5 million and below
Less than 75 employees Shareholders funds Employment
Philippines P 100,000,000 and below Less than 200 employees
Asset Employment
Singapore S$ 12,000,000 and below fixed assets for manufacturing Less than 100 employees for services
Fixed assets Employment
Thailand 100m Baht and below for capital-intensive firms Less than 200 employees for labor-intensive firms
Capital Employment
Source: Table 1, Hall (1995).
Table 2-2. SME Definition by Employment and by Asset Size
SIZE BY EMPLOYMENT BY ASSET SIZE Micro 1-9 employees Up to P 3,000,000 Small 10-99 employees P 3,000,001 - P 15,000,001 Medium 100-199 employees P 15,000,001 to P 100,000,000 Large 200 and above employees P 100,000,001 and above
Source of Data: National Statistics Office and Small and Medium Enterprise Development Council (SMEDC) Resolution No. 1, Series 2003.
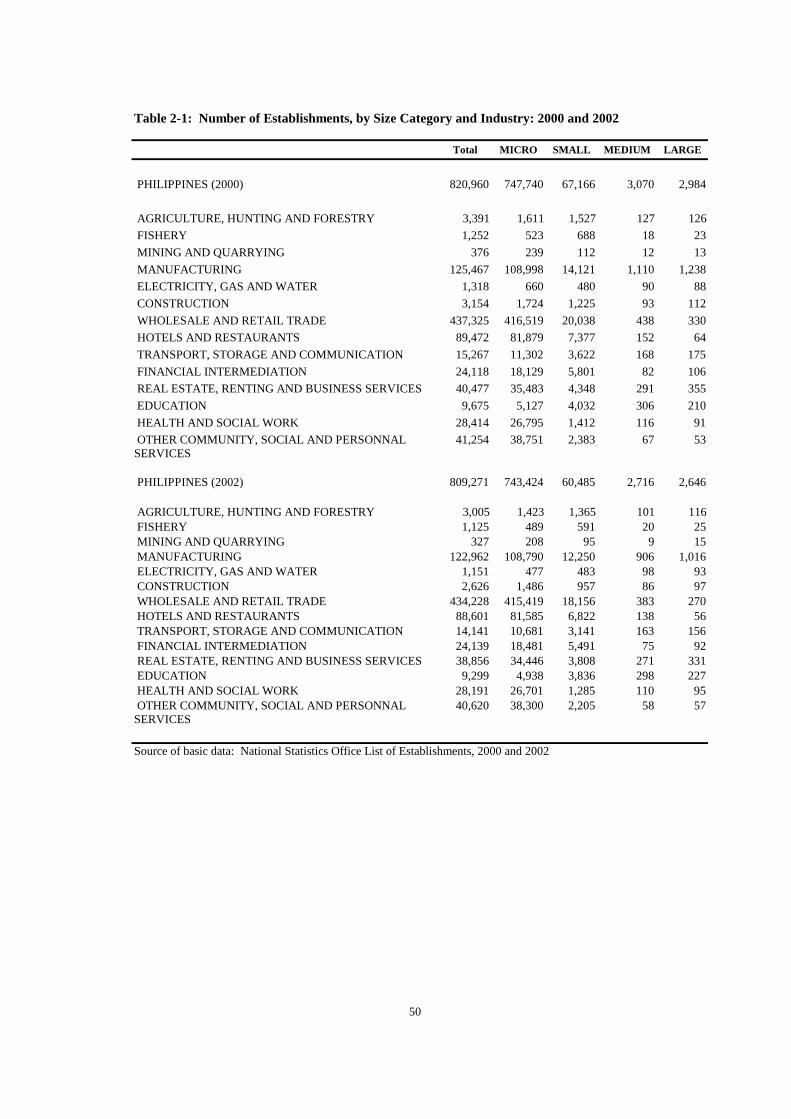
50
Table 2-1: Number of Establishments, by Size Category and Industry: 2000 and 2002
Total MICRO SMALL MEDIUM LARGE
PHILIPPINES (2000) 820,960 747,740 67,166 3,070 2,984
AGRICULTURE, HUNTING AND FORESTRY 3,391 1,611 1,527 127 126 FISHERY 1,252 523 688 18 23 MINING AND QUARRYING 376 239 112 12 13 MANUFACTURING 125,467 108,998 14,121 1,110 1,238 ELECTRICITY, GAS AND WATER 1,318 660 480 90 88 CONSTRUCTION 3,154 1,724 1,225 93 112 WHOLESALE AND RETAIL TRADE 437,325 416,519 20,038 438 330 HOTELS AND RESTAURANTS 89,472 81,879 7,377 152 64 TRANSPORT, STORAGE AND COMMUNICATION 15,267 11,302 3,622 168 175 FINANCIAL INTERMEDIATION 24,118 18,129 5,801 82 106 REAL ESTATE, RENTING AND BUSINESS SERVICES 40,477 35,483 4,348 291 355 EDUCATION 9,675 5,127 4,032 306 210 HEALTH AND SOCIAL WORK 28,414 26,795 1,412 116 91 OTHER COMMUNITY, SOCIAL AND PERSONNAL SERVICES
41,254 38,751 2,383 67 53
PHILIPPINES (2002) 809,271 743,424 60,485 2,716 2,646
AGRICULTURE, HUNTING AND FORESTRY 3,005 1,423 1,365 101 116 FISHERY 1,125 489 591 20 25 MINING AND QUARRYING 327 208 95 9 15 MANUFACTURING 122,962 108,790 12,250 906 1,016 ELECTRICITY, GAS AND WATER 1,151 477 483 98 93 CONSTRUCTION 2,626 1,486 957 86 97 WHOLESALE AND RETAIL TRADE 434,228 415,419 18,156 383 270 HOTELS AND RESTAURANTS 88,601 81,585 6,822 138 56 TRANSPORT, STORAGE AND COMMUNICATION 14,141 10,681 3,141 163 156 FINANCIAL INTERMEDIATION 24,139 18,481 5,491 75 92 REAL ESTATE, RENTING AND BUSINESS SERVICES 38,856 34,446 3,808 271 331 EDUCATION 9,299 4,938 3,836 298 227 HEALTH AND SOCIAL WORK 28,191 26,701 1,285 110 95 OTHER COMMUNITY, SOCIAL AND PERSONNAL SERVICES
40,620 38,300 2,205 58 57
Source of basic data: National Statistics Office List of Establishments, 2000 and 2002
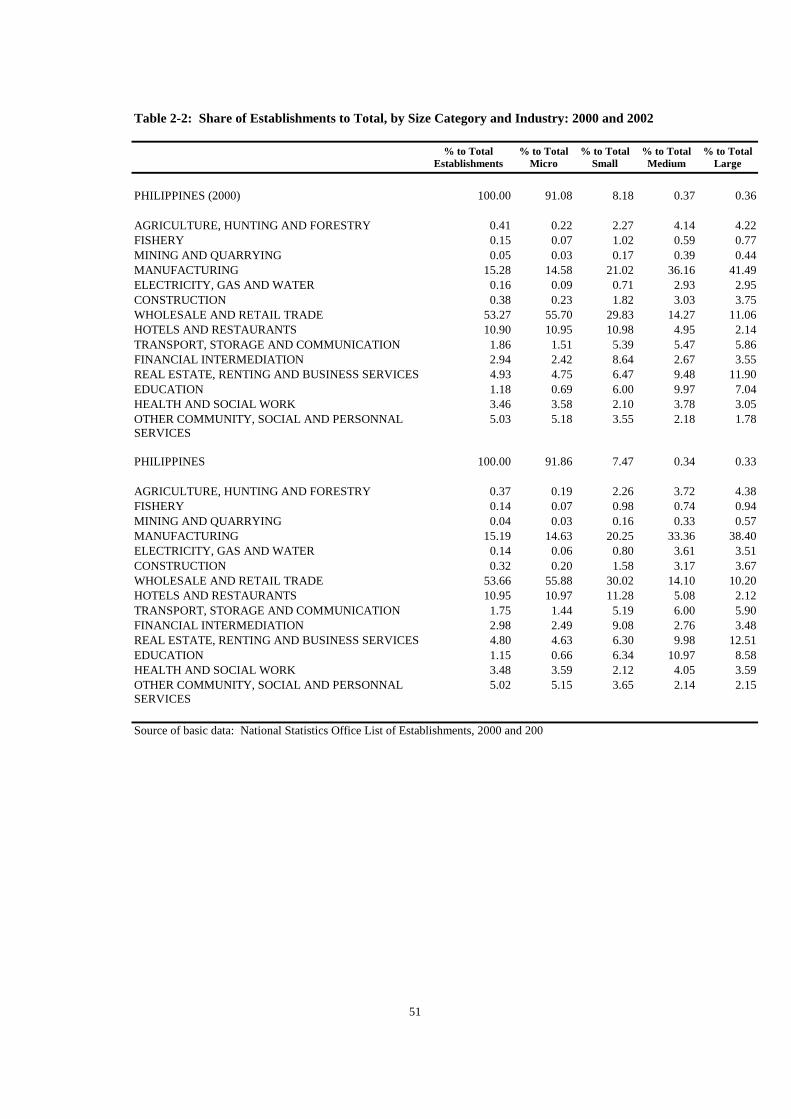
51
Table 2-2: Share of Establishments to Total, by Size Category and Industry: 2000 and 2002
% to Total Establishments
% to Total Micro
% to Total Small
% to Total Medium
% to Total Large
PHILIPPINES (2000) 100.00 91.08 8.18 0.37 0.36
AGRICULTURE, HUNTING AND FORESTRY 0.41 0.22 2.27 4.14 4.22 FISHERY 0.15 0.07 1.02 0.59 0.77 MINING AND QUARRYING 0.05 0.03 0.17 0.39 0.44 MANUFACTURING 15.28 14.58 21.02 36.16 41.49 ELECTRICITY, GAS AND WATER 0.16 0.09 0.71 2.93 2.95 CONSTRUCTION 0.38 0.23 1.82 3.03 3.75 WHOLESALE AND RETAIL TRADE 53.27 55.70 29.83 14.27 11.06 HOTELS AND RESTAURANTS 10.90 10.95 10.98 4.95 2.14 TRANSPORT, STORAGE AND COMMUNICATION 1.86 1.51 5.39 5.47 5.86 FINANCIAL INTERMEDIATION 2.94 2.42 8.64 2.67 3.55 REAL ESTATE, RENTING AND BUSINESS SERVICES 4.93 4.75 6.47 9.48 11.90 EDUCATION 1.18 0.69 6.00 9.97 7.04 HEALTH AND SOCIAL WORK 3.46 3.58 2.10 3.78 3.05 OTHER COMMUNITY, SOCIAL AND PERSONNAL SERVICES
5.03 5.18 3.55 2.18 1.78
PHILIPPINES 100.00 91.86 7.47 0.34 0.33
AGRICULTURE, HUNTING AND FORESTRY 0.37 0.19 2.26 3.72 4.38 FISHERY 0.14 0.07 0.98 0.74 0.94 MINING AND QUARRYING 0.04 0.03 0.16 0.33 0.57 MANUFACTURING 15.19 14.63 20.25 33.36 38.40 ELECTRICITY, GAS AND WATER 0.14 0.06 0.80 3.61 3.51 CONSTRUCTION 0.32 0.20 1.58 3.17 3.67 WHOLESALE AND RETAIL TRADE 53.66 55.88 30.02 14.10 10.20 HOTELS AND RESTAURANTS 10.95 10.97 11.28 5.08 2.12 TRANSPORT, STORAGE AND COMMUNICATION 1.75 1.44 5.19 6.00 5.90 FINANCIAL INTERMEDIATION 2.98 2.49 9.08 2.76 3.48 REAL ESTATE, RENTING AND BUSINESS SERVICES 4.80 4.63 6.30 9.98 12.51 EDUCATION 1.15 0.66 6.34 10.97 8.58 HEALTH AND SOCIAL WORK 3.48 3.59 2.12 4.05 3.59 OTHER COMMUNITY, SOCIAL AND PERSONNAL SERVICES
5.02 5.15 3.65 2.14 2.15
Source of basic data: National Statistics Office List of Establishments, 2000 and 200
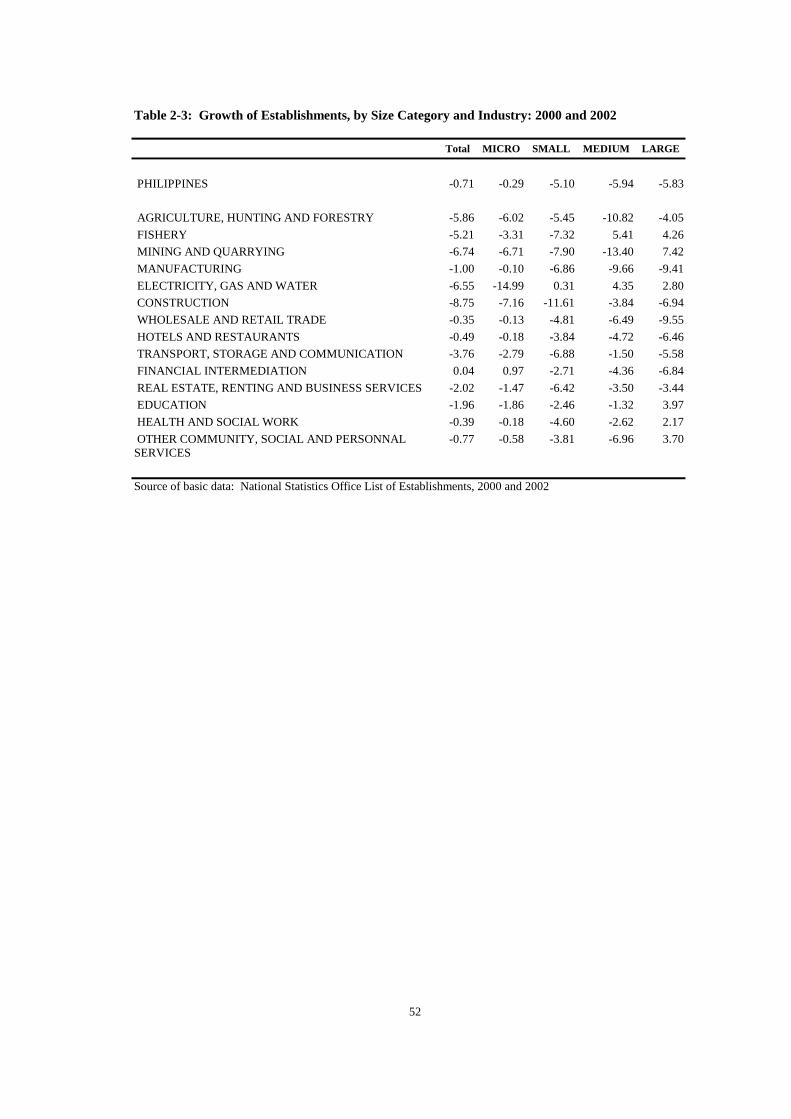
52
Table 2-3: Growth of Establishments, by Size Category and Industry: 2000 and 2002
Total MICRO SMALL MEDIUM LARGE
PHILIPPINES -0.71 -0.29 -5.10 -5.94 -5.83
AGRICULTURE, HUNTING AND FORESTRY -5.86 -6.02 -5.45 -10.82 -4.05 FISHERY -5.21 -3.31 -7.32 5.41 4.26 MINING AND QUARRYING -6.74 -6.71 -7.90 -13.40 7.42 MANUFACTURING -1.00 -0.10 -6.86 -9.66 -9.41 ELECTRICITY, GAS AND WATER -6.55 -14.99 0.31 4.35 2.80 CONSTRUCTION -8.75 -7.16 -11.61 -3.84 -6.94 WHOLESALE AND RETAIL TRADE -0.35 -0.13 -4.81 -6.49 -9.55 HOTELS AND RESTAURANTS -0.49 -0.18 -3.84 -4.72 -6.46 TRANSPORT, STORAGE AND COMMUNICATION -3.76 -2.79 -6.88 -1.50 -5.58 FINANCIAL INTERMEDIATION 0.04 0.97 -2.71 -4.36 -6.84 REAL ESTATE, RENTING AND BUSINESS SERVICES -2.02 -1.47 -6.42 -3.50 -3.44 EDUCATION -1.96 -1.86 -2.46 -1.32 3.97 HEALTH AND SOCIAL WORK -0.39 -0.18 -4.60 -2.62 2.17 OTHER COMMUNITY, SOCIAL AND PERSONNAL SERVICES
-0.77 -0.58 -3.81 -6.96 3.70
Source of basic data: National Statistics Office List of Establishments, 2000 and 2002
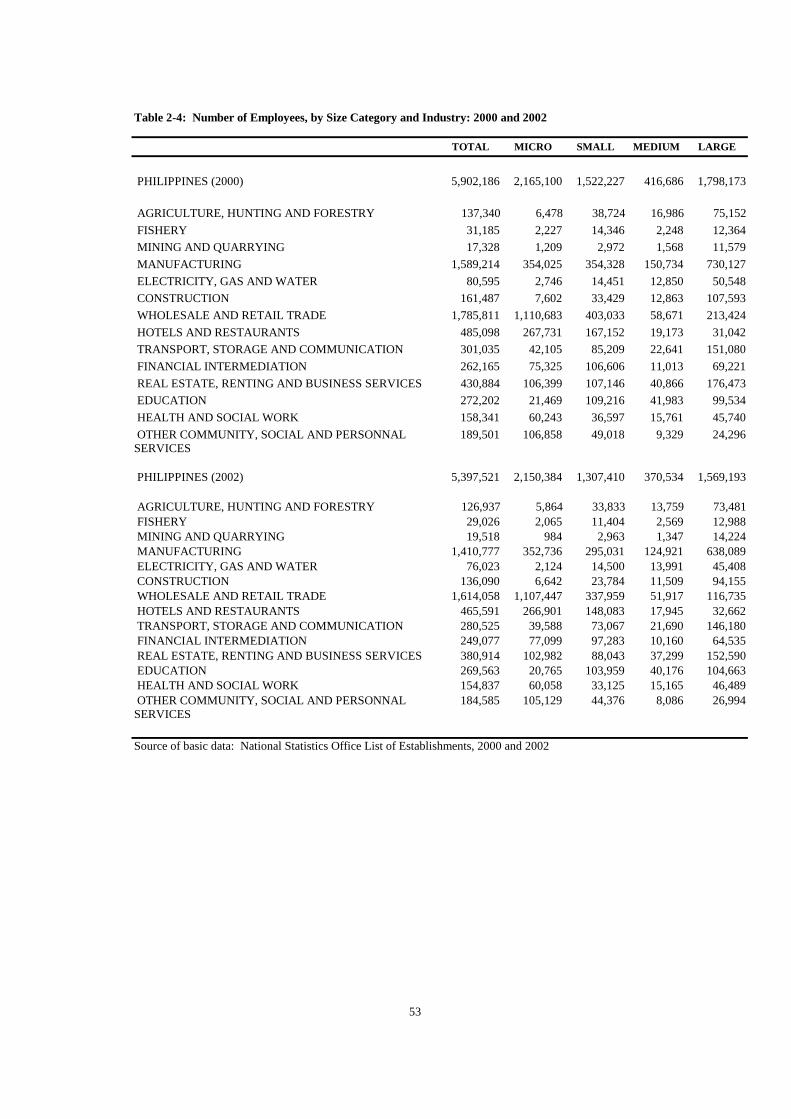
53
Table 2-4: Number of Employees, by Size Category and Industry: 2000 and 2002
TOTAL MICRO SMALL MEDIUM LARGE
PHILIPPINES (2000) 5,902,186 2,165,100 1,522,227 416,686 1,798,173
AGRICULTURE, HUNTING AND FORESTRY 137,340 6,478 38,724 16,986 75,152 FISHERY 31,185 2,227 14,346 2,248 12,364 MINING AND QUARRYING 17,328 1,209 2,972 1,568 11,579 MANUFACTURING 1,589,214 354,025 354,328 150,734 730,127 ELECTRICITY, GAS AND WATER 80,595 2,746 14,451 12,850 50,548 CONSTRUCTION 161,487 7,602 33,429 12,863 107,593 WHOLESALE AND RETAIL TRADE 1,785,811 1,110,683 403,033 58,671 213,424 HOTELS AND RESTAURANTS 485,098 267,731 167,152 19,173 31,042 TRANSPORT, STORAGE AND COMMUNICATION 301,035 42,105 85,209 22,641 151,080 FINANCIAL INTERMEDIATION 262,165 75,325 106,606 11,013 69,221 REAL ESTATE, RENTING AND BUSINESS SERVICES 430,884 106,399 107,146 40,866 176,473 EDUCATION 272,202 21,469 109,216 41,983 99,534 HEALTH AND SOCIAL WORK 158,341 60,243 36,597 15,761 45,740 OTHER COMMUNITY, SOCIAL AND PERSONNAL SERVICES
189,501 106,858 49,018 9,329 24,296
PHILIPPINES (2002) 5,397,521 2,150,384 1,307,410 370,534 1,569,193
AGRICULTURE, HUNTING AND FORESTRY 126,937 5,864 33,833 13,759 73,481 FISHERY 29,026 2,065 11,404 2,569 12,988 MINING AND QUARRYING 19,518 984 2,963 1,347 14,224 MANUFACTURING 1,410,777 352,736 295,031 124,921 638,089 ELECTRICITY, GAS AND WATER 76,023 2,124 14,500 13,991 45,408 CONSTRUCTION 136,090 6,642 23,784 11,509 94,155 WHOLESALE AND RETAIL TRADE 1,614,058 1,107,447 337,959 51,917 116,735 HOTELS AND RESTAURANTS 465,591 266,901 148,083 17,945 32,662 TRANSPORT, STORAGE AND COMMUNICATION 280,525 39,588 73,067 21,690 146,180 FINANCIAL INTERMEDIATION 249,077 77,099 97,283 10,160 64,535 REAL ESTATE, RENTING AND BUSINESS SERVICES 380,914 102,982 88,043 37,299 152,590 EDUCATION 269,563 20,765 103,959 40,176 104,663 HEALTH AND SOCIAL WORK 154,837 60,058 33,125 15,165 46,489 OTHER COMMUNITY, SOCIAL AND PERSONNAL SERVICES
184,585 105,129 44,376 8,086 26,994
Source of basic data: National Statistics Office List of Establishments, 2000 and 2002

54
Table 2-5: Share of Employment to Total, by Size Category: and Industry 2000 and 2002
% to Total Establishments
% to Total Micro
% to Total Small
% to Total Medium
% to Total Large
PHILIPPINES (2002) 100.00 36.68 25.79 7.06 30.47
AGRICULTURE, HUNTING AND FORESTRY 2.33 0.30 2.54 4.08 4.18 FISHERY 0.53 0.10 0.94 0.54 0.69 MINING AND QUARRYING 0.29 0.06 0.20 0.38 0.64 MANUFACTURING 26.93 16.35 23.28 36.17 40.60 ELECTRICITY, GAS AND WATER 1.37 0.13 0.95 3.08 2.81 CONSTRUCTION 2.74 0.35 2.20 3.09 5.98 WHOLESALE AND RETAIL TRADE 30.26 51.30 26.48 14.08 11.87 HOTELS AND RESTAURANTS 8.22 12.37 10.98 4.60 1.73 TRANSPORT, STORAGE AND COMMUNICATION 5.10 1.94 5.60 5.43 8.40 FINANCIAL INTERMEDIATION 4.44 3.48 7.00 2.64 3.85 REAL ESTATE, RENTING AND BUSINESS SERVICES
7.30 4.91 7.04 9.81 9.81
EDUCATION 4.61 0.99 7.17 10.08 5.54 HEALTH AND SOCIAL WORK 2.68 2.78 2.40 3.78 2.54 OTHER COMMUNITY, SOCIAL AND PERSONNAL SERVICES
3.21 4.94 3.22 2.24 1.35
PHILIPPINES (2002) 100.00 39.84 24.22 6.86 29.07
AGRICULTURE, HUNTING AND FORESTRY 2.35 0.27 2.59 3.71 4.68 FISHERY 0.54 0.10 0.87 0.69 0.83 MINING AND QUARRYING 0.36 0.05 0.23 0.36 0.91 MANUFACTURING 26.14 16.40 22.57 33.71 40.66 ELECTRICITY, GAS AND WATER 1.41 0.10 1.11 3.78 2.89 CONSTRUCTION 2.52 0.31 1.82 3.11 6.00 WHOLESALE AND RETAIL TRADE 29.90 51.50 25.85 14.01 7.44 HOTELS AND RESTAURANTS 8.63 12.41 11.33 4.84 2.08 TRANSPORT, STORAGE AND COMMUNICATION 5.20 1.84 5.59 5.85 9.32 FINANCIAL INTERMEDIATION 4.61 3.59 7.44 2.74 4.11 REAL ESTATE, RENTING AND BUSINESS SERVICES
7.06 4.79 6.73 10.07 9.72
EDUCATION 4.99 0.97 7.95 10.84 6.67 HEALTH AND SOCIAL WORK 2.87 2.79 2.53 4.09 2.96 OTHER COMMUNITY, SOCIAL AND PERSONNAL SERVICES
3.42 4.89 3.39 2.18 1.72
Source of basic data: National Statistics Office List of Establishments, 2000 and 2002.
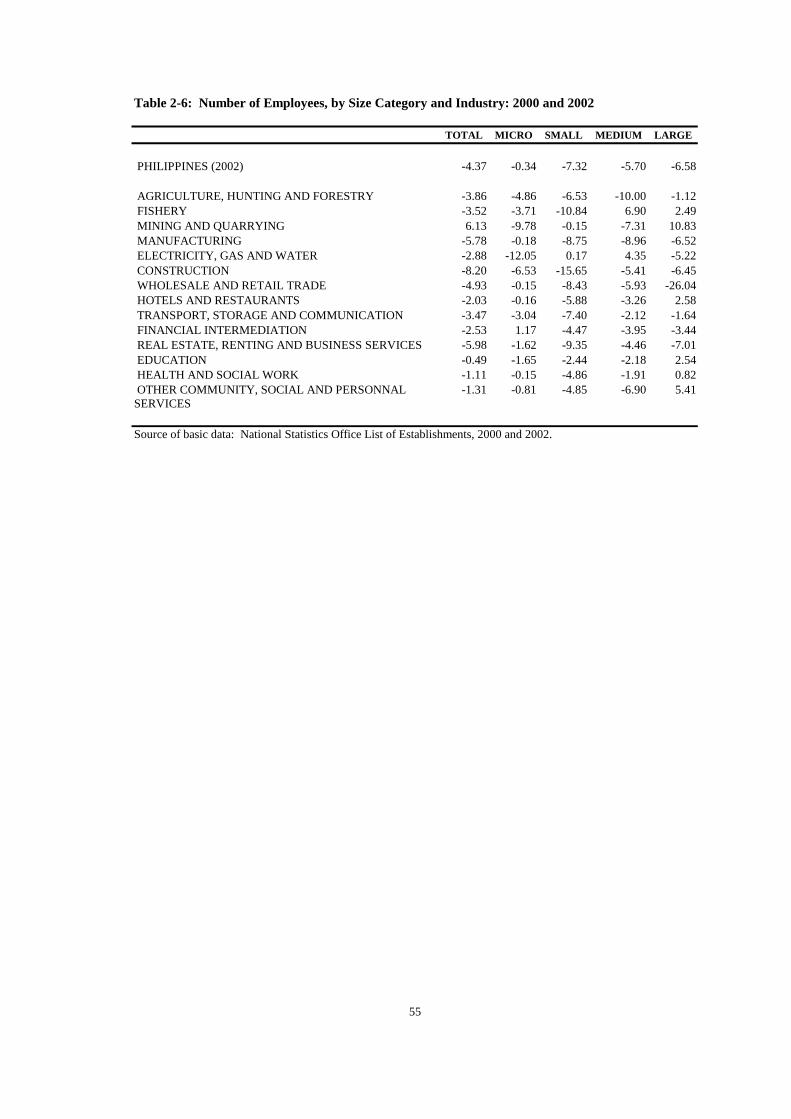
55
Table 2-6: Number of Employees, by Size Category and Industry: 2000 and 2002
TOTAL MICRO SMALL MEDIUM LARGE
PHILIPPINES (2002) -4.37 -0.34 -7.32 -5.70 -6.58
AGRICULTURE, HUNTING AND FORESTRY -3.86 -4.86 -6.53 -10.00 -1.12 FISHERY -3.52 -3.71 -10.84 6.90 2.49 MINING AND QUARRYING 6.13 -9.78 -0.15 -7.31 10.83 MANUFACTURING -5.78 -0.18 -8.75 -8.96 -6.52 ELECTRICITY, GAS AND WATER -2.88 -12.05 0.17 4.35 -5.22 CONSTRUCTION -8.20 -6.53 -15.65 -5.41 -6.45 WHOLESALE AND RETAIL TRADE -4.93 -0.15 -8.43 -5.93 -26.04 HOTELS AND RESTAURANTS -2.03 -0.16 -5.88 -3.26 2.58 TRANSPORT, STORAGE AND COMMUNICATION -3.47 -3.04 -7.40 -2.12 -1.64 FINANCIAL INTERMEDIATION -2.53 1.17 -4.47 -3.95 -3.44 REAL ESTATE, RENTING AND BUSINESS SERVICES -5.98 -1.62 -9.35 -4.46 -7.01 EDUCATION -0.49 -1.65 -2.44 -2.18 2.54 HEALTH AND SOCIAL WORK -1.11 -0.15 -4.86 -1.91 0.82 OTHER COMMUNITY, SOCIAL AND PERSONNAL SERVICES
-1.31 -0.81 -4.85 -6.90 5.41
Source of basic data: National Statistics Office List of Establishments, 2000 and 2002.
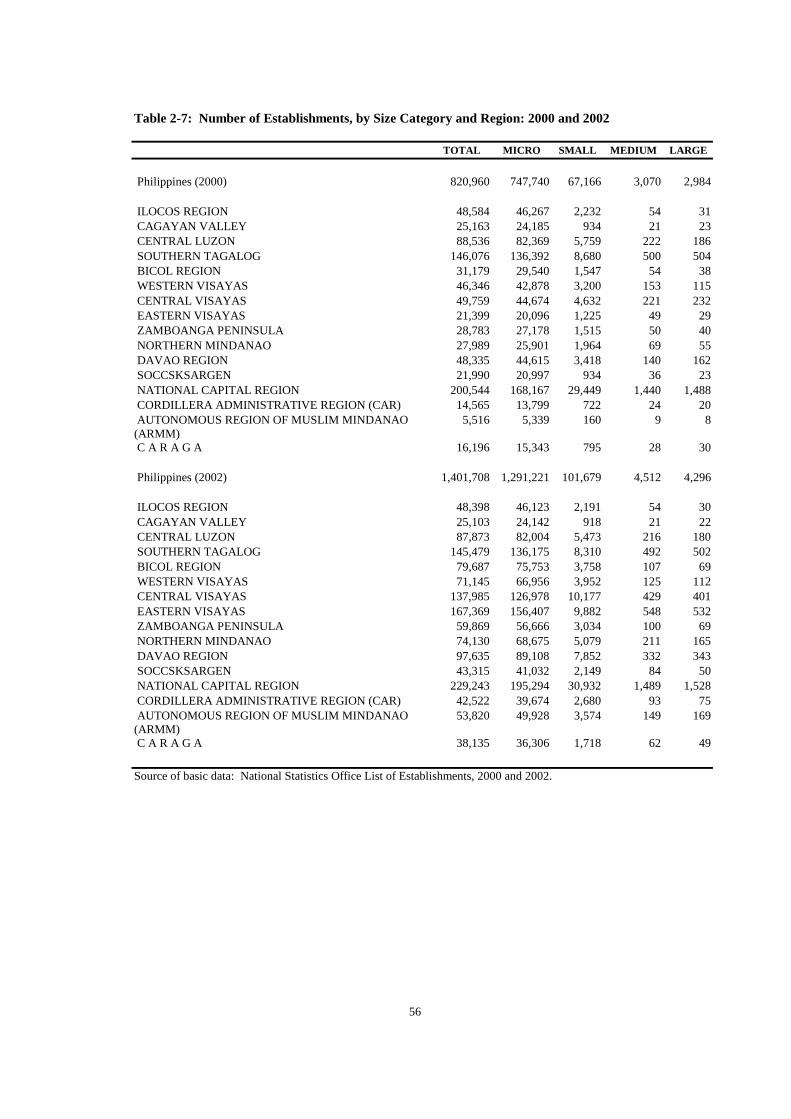
56
Table 2-7: Number of Establishments, by Size Category and Region: 2000 and 2002
TOTAL MICRO SMALL MEDIUM LARGE
Philippines (2000) 820,960 747,740 67,166 3,070 2,984
ILOCOS REGION 48,584 46,267 2,232 54 31 CAGAYAN VALLEY 25,163 24,185 934 21 23 CENTRAL LUZON 88,536 82,369 5,759 222 186 SOUTHERN TAGALOG 146,076 136,392 8,680 500 504 BICOL REGION 31,179 29,540 1,547 54 38 WESTERN VISAYAS 46,346 42,878 3,200 153 115 CENTRAL VISAYAS 49,759 44,674 4,632 221 232 EASTERN VISAYAS 21,399 20,096 1,225 49 29 ZAMBOANGA PENINSULA 28,783 27,178 1,515 50 40 NORTHERN MINDANAO 27,989 25,901 1,964 69 55 DAVAO REGION 48,335 44,615 3,418 140 162 SOCCSKSARGEN 21,990 20,997 934 36 23 NATIONAL CAPITAL REGION 200,544 168,167 29,449 1,440 1,488 CORDILLERA ADMINISTRATIVE REGION (CAR) 14,565 13,799 722 24 20 AUTONOMOUS REGION OF MUSLIM MINDANAO (ARMM)
5,516 5,339 160 9 8
C A R A G A 16,196 15,343 795 28 30
Philippines (2002) 1,401,708 1,291,221 101,679 4,512 4,296
ILOCOS REGION 48,398 46,123 2,191 54 30 CAGAYAN VALLEY 25,103 24,142 918 21 22 CENTRAL LUZON 87,873 82,004 5,473 216 180 SOUTHERN TAGALOG 145,479 136,175 8,310 492 502 BICOL REGION 79,687 75,753 3,758 107 69 WESTERN VISAYAS 71,145 66,956 3,952 125 112 CENTRAL VISAYAS 137,985 126,978 10,177 429 401 EASTERN VISAYAS 167,369 156,407 9,882 548 532 ZAMBOANGA PENINSULA 59,869 56,666 3,034 100 69 NORTHERN MINDANAO 74,130 68,675 5,079 211 165 DAVAO REGION 97,635 89,108 7,852 332 343 SOCCSKSARGEN 43,315 41,032 2,149 84 50 NATIONAL CAPITAL REGION 229,243 195,294 30,932 1,489 1,528 CORDILLERA ADMINISTRATIVE REGION (CAR) 42,522 39,674 2,680 93 75 AUTONOMOUS REGION OF MUSLIM MINDANAO (ARMM)
53,820 49,928 3,574 149 169
C A R A G A 38,135 36,306 1,718 62 49
Source of basic data: National Statistics Office List of Establishments, 2000 and 2002.

57
Table 2-8: Share of Establishments to Total, by Size Category and Region: 2000 and 2002
% to Total Establishment
% to Total Micro
% to Total Small
% to Total Medium
% to Total Large
PHILIPPINES (2000) 100.00 91.08 8.18 0.37 0.36
ILOCOS REGION 5.92 6.19 3.32 1.76 1.04 CAGAYAN VALLEY 3.07 3.23 1.39 0.68 0.77 CENTRAL LUZON 10.78 11.02 8.57 7.23 6.23 SOUTHERN TAGALOG 17.79 18.24 12.92 16.29 16.89 BICOL REGION 3.80 3.95 2.30 1.76 1.27 WESTERN VISAYAS 5.65 5.73 4.76 4.98 3.85 CENTRAL VISAYAS 6.06 5.97 6.90 7.20 7.77 EASTERN VISAYAS 2.61 2.69 1.82 1.60 0.97 ZAMBOANGA PENINSULA 3.51 3.63 2.26 1.63 1.34 NORTHERN MINDANAO 3.41 3.46 2.92 2.25 1.84 DAVAO REGION 5.89 5.97 5.09 4.56 5.43 SOCCSKSARGEN 2.68 2.81 1.39 1.17 0.77 NATIONAL CAPITAL REGION 24.43 22.49 43.85 46.91 49.87 CORDILLERA ADMINISTRATIVE REGION (CAR) 1.77 1.85 1.07 0.78 0.67 AUTONOMOUS REGION OF MUSLIM MINDANAO (ARMM)
0.67 0.71 0.24 0.29 0.27
C A R A G A 1.97 2.05 1.18 0.91 1.01
PHILIPPINES (2002) 100.00 92.12 7.25 0.32 0.31
ILOCOS REGION 5.95 6.18 3.41 2.14 1.44 CAGAYAN VALLEY 3.08 3.23 1.50 0.70 0.76 CENTRAL LUZON 10.97 11.21 8.39 6.77 6.08 SOUTHERN TAGALOG 17.64 18.03 13.06 14.40 16.33 BICOL REGION 3.82 3.94 2.45 1.99 1.47 WESTERN VISAYAS 5.65 5.71 4.98 5.49 3.82 CENTRAL VISAYAS 6.06 5.98 6.90 7.70 8.43 EASTERN VISAYAS 2.61 2.68 1.78 1.55 0.98 ZAMBOANGA PENINSULA 3.29 3.41 2.04 1.51 1.36 NORTHERN MINDANAO 4.08 4.14 3.49 3.09 2.23 DAVAO REGION 4.42 4.41 4.53 4.34 4.88 SOCCSKSARGEN 3.26 3.39 1.87 1.33 1.59 NATIONAL CAPITAL REGION 24.10 22.43 42.49 46.58 48.41 CORDILLERA ADMINISTRATIVE REGION (CAR) 1.76 1.81 1.14 0.81 0.72 AUTONOMOUS REGION OF MUSLIM MINDANAO (ARMM)
1.34 1.40 0.72 0.77 0.64
C A R A G A 1.97 2.03 1.25 0.85 0.87
Source of basic data: National Statistics Office List of Establishments, 2000 and 2002.
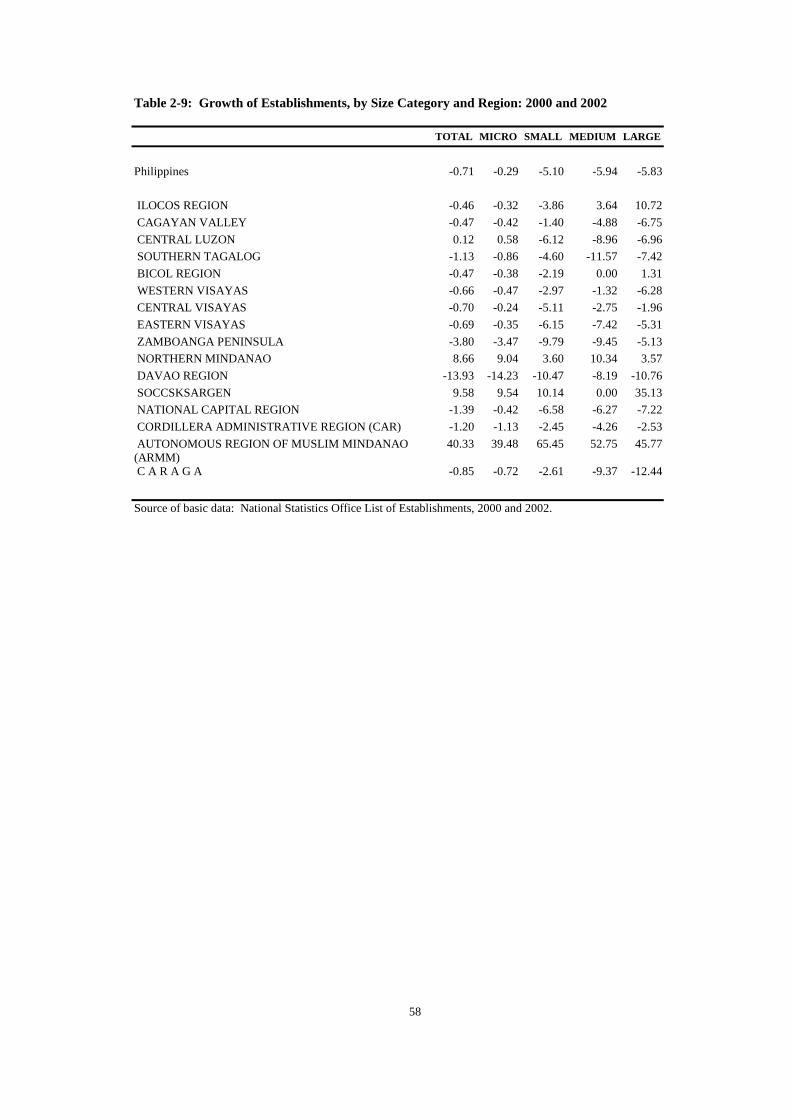
58
Table 2-9: Growth of Establishments, by Size Category and Region: 2000 and 2002
TOTAL MICRO SMALL MEDIUM LARGE
Philippines -0.71 -0.29 -5.10 -5.94 -5.83
ILOCOS REGION -0.46 -0.32 -3.86 3.64 10.72 CAGAYAN VALLEY -0.47 -0.42 -1.40 -4.88 -6.75 CENTRAL LUZON 0.12 0.58 -6.12 -8.96 -6.96 SOUTHERN TAGALOG -1.13 -0.86 -4.60 -11.57 -7.42 BICOL REGION -0.47 -0.38 -2.19 0.00 1.31 WESTERN VISAYAS -0.66 -0.47 -2.97 -1.32 -6.28 CENTRAL VISAYAS -0.70 -0.24 -5.11 -2.75 -1.96 EASTERN VISAYAS -0.69 -0.35 -6.15 -7.42 -5.31 ZAMBOANGA PENINSULA -3.80 -3.47 -9.79 -9.45 -5.13 NORTHERN MINDANAO 8.66 9.04 3.60 10.34 3.57 DAVAO REGION -13.93 -14.23 -10.47 -8.19 -10.76 SOCCSKSARGEN 9.58 9.54 10.14 0.00 35.13 NATIONAL CAPITAL REGION -1.39 -0.42 -6.58 -6.27 -7.22 CORDILLERA ADMINISTRATIVE REGION (CAR) -1.20 -1.13 -2.45 -4.26 -2.53 AUTONOMOUS REGION OF MUSLIM MINDANAO (ARMM)
40.33 39.48 65.45 52.75 45.77
C A R A G A -0.85 -0.72 -2.61 -9.37 -12.44
Source of basic data: National Statistics Office List of Establishments, 2000 and 2002.
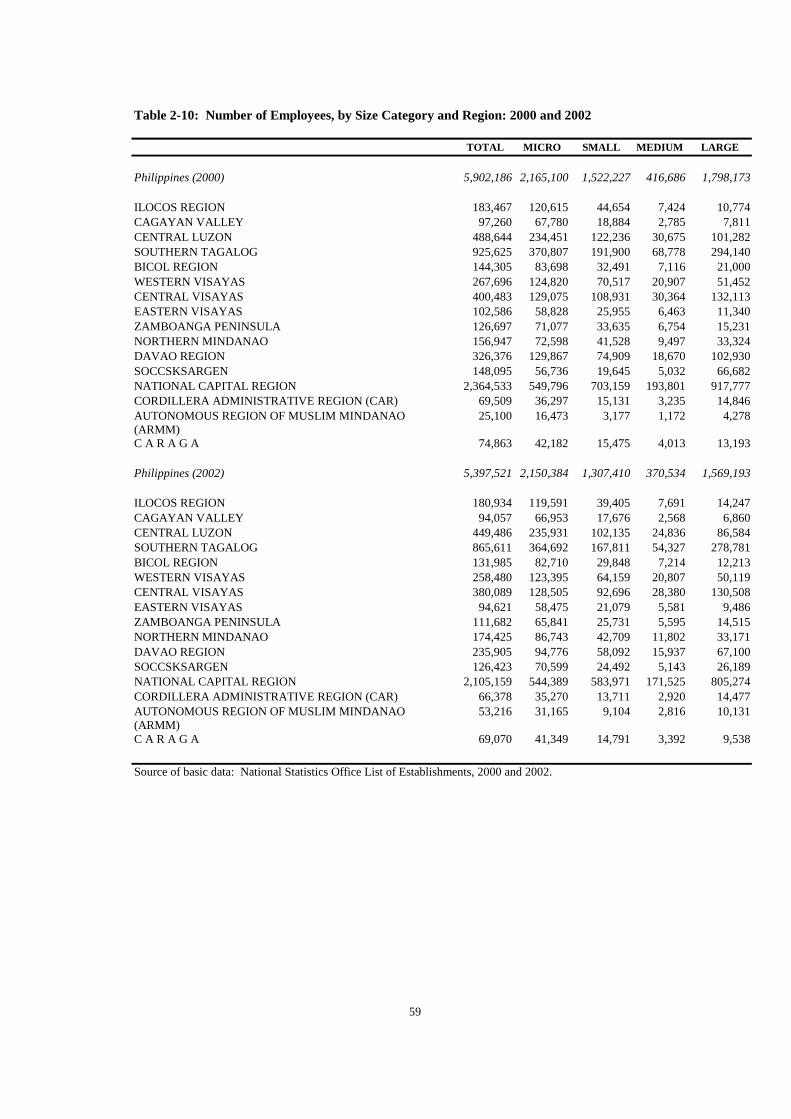
59
Table 2-10: Number of Employees, by Size Category and Region: 2000 and 2002
TOTAL MICRO SMALL MEDIUM LARGE
Philippines (2000) 5,902,186 2,165,100 1,522,227 416,686 1,798,173
ILOCOS REGION 183,467 120,615 44,654 7,424 10,774 CAGAYAN VALLEY 97,260 67,780 18,884 2,785 7,811 CENTRAL LUZON 488,644 234,451 122,236 30,675 101,282 SOUTHERN TAGALOG 925,625 370,807 191,900 68,778 294,140 BICOL REGION 144,305 83,698 32,491 7,116 21,000 WESTERN VISAYAS 267,696 124,820 70,517 20,907 51,452 CENTRAL VISAYAS 400,483 129,075 108,931 30,364 132,113 EASTERN VISAYAS 102,586 58,828 25,955 6,463 11,340 ZAMBOANGA PENINSULA 126,697 71,077 33,635 6,754 15,231 NORTHERN MINDANAO 156,947 72,598 41,528 9,497 33,324 DAVAO REGION 326,376 129,867 74,909 18,670 102,930 SOCCSKSARGEN 148,095 56,736 19,645 5,032 66,682 NATIONAL CAPITAL REGION 2,364,533 549,796 703,159 193,801 917,777 CORDILLERA ADMINISTRATIVE REGION (CAR) 69,509 36,297 15,131 3,235 14,846 AUTONOMOUS REGION OF MUSLIM MINDANAO (ARMM)
25,100 16,473 3,177 1,172 4,278
C A R A G A 74,863 42,182 15,475 4,013 13,193
Philippines (2002) 5,397,521 2,150,384 1,307,410 370,534 1,569,193
ILOCOS REGION 180,934 119,591 39,405 7,691 14,247 CAGAYAN VALLEY 94,057 66,953 17,676 2,568 6,860 CENTRAL LUZON 449,486 235,931 102,135 24,836 86,584 SOUTHERN TAGALOG 865,611 364,692 167,811 54,327 278,781 BICOL REGION 131,985 82,710 29,848 7,214 12,213 WESTERN VISAYAS 258,480 123,395 64,159 20,807 50,119 CENTRAL VISAYAS 380,089 128,505 92,696 28,380 130,508 EASTERN VISAYAS 94,621 58,475 21,079 5,581 9,486 ZAMBOANGA PENINSULA 111,682 65,841 25,731 5,595 14,515 NORTHERN MINDANAO 174,425 86,743 42,709 11,802 33,171 DAVAO REGION 235,905 94,776 58,092 15,937 67,100 SOCCSKSARGEN 126,423 70,599 24,492 5,143 26,189 NATIONAL CAPITAL REGION 2,105,159 544,389 583,971 171,525 805,274 CORDILLERA ADMINISTRATIVE REGION (CAR) 66,378 35,270 13,711 2,920 14,477 AUTONOMOUS REGION OF MUSLIM MINDANAO (ARMM)
53,216 31,165 9,104 2,816 10,131
C A R A G A 69,070 41,349 14,791 3,392 9,538
Source of basic data: National Statistics Office List of Establishments, 2000 and 2002.
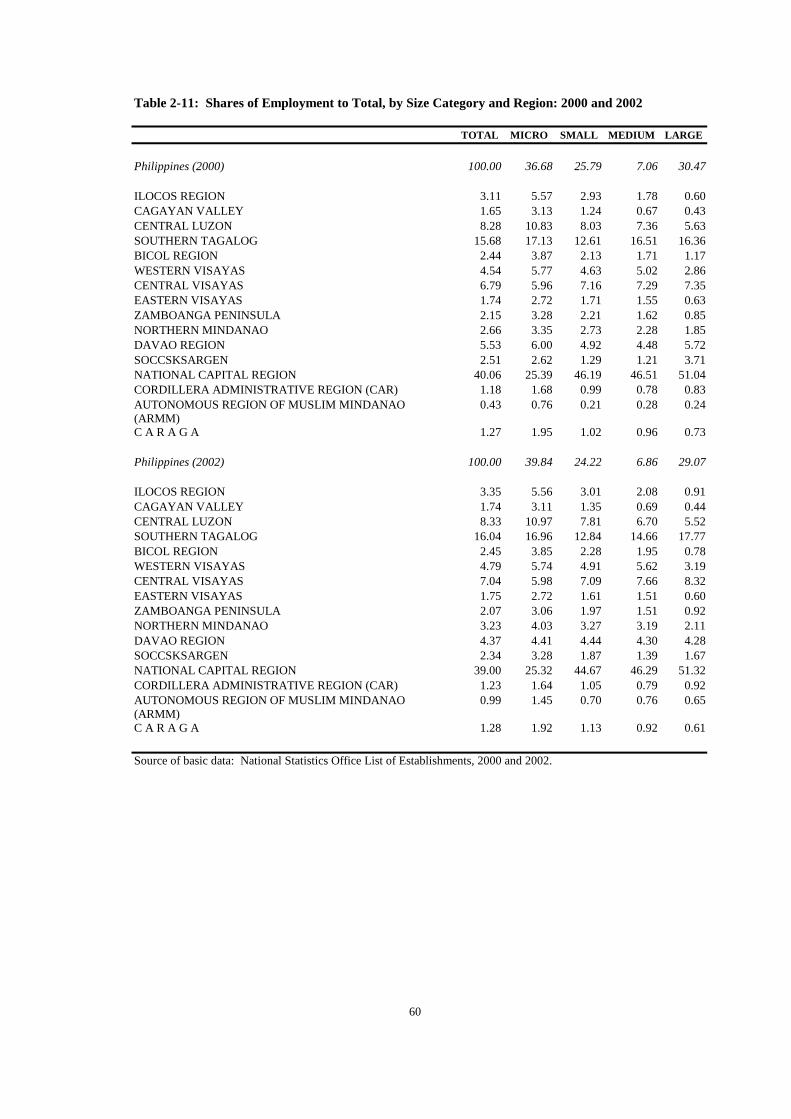
60
Table 2-11: Shares of Employment to Total, by Size Category and Region: 2000 and 2002
TOTAL MICRO SMALL MEDIUM LARGE
Philippines (2000) 100.00 36.68 25.79 7.06 30.47
ILOCOS REGION 3.11 5.57 2.93 1.78 0.60 CAGAYAN VALLEY 1.65 3.13 1.24 0.67 0.43 CENTRAL LUZON 8.28 10.83 8.03 7.36 5.63 SOUTHERN TAGALOG 15.68 17.13 12.61 16.51 16.36 BICOL REGION 2.44 3.87 2.13 1.71 1.17 WESTERN VISAYAS 4.54 5.77 4.63 5.02 2.86 CENTRAL VISAYAS 6.79 5.96 7.16 7.29 7.35 EASTERN VISAYAS 1.74 2.72 1.71 1.55 0.63 ZAMBOANGA PENINSULA 2.15 3.28 2.21 1.62 0.85 NORTHERN MINDANAO 2.66 3.35 2.73 2.28 1.85 DAVAO REGION 5.53 6.00 4.92 4.48 5.72 SOCCSKSARGEN 2.51 2.62 1.29 1.21 3.71 NATIONAL CAPITAL REGION 40.06 25.39 46.19 46.51 51.04 CORDILLERA ADMINISTRATIVE REGION (CAR) 1.18 1.68 0.99 0.78 0.83 AUTONOMOUS REGION OF MUSLIM MINDANAO (ARMM)
0.43 0.76 0.21 0.28 0.24
C A R A G A 1.27 1.95 1.02 0.96 0.73
Philippines (2002) 100.00 39.84 24.22 6.86 29.07
ILOCOS REGION 3.35 5.56 3.01 2.08 0.91 CAGAYAN VALLEY 1.74 3.11 1.35 0.69 0.44 CENTRAL LUZON 8.33 10.97 7.81 6.70 5.52 SOUTHERN TAGALOG 16.04 16.96 12.84 14.66 17.77 BICOL REGION 2.45 3.85 2.28 1.95 0.78 WESTERN VISAYAS 4.79 5.74 4.91 5.62 3.19 CENTRAL VISAYAS 7.04 5.98 7.09 7.66 8.32 EASTERN VISAYAS 1.75 2.72 1.61 1.51 0.60 ZAMBOANGA PENINSULA 2.07 3.06 1.97 1.51 0.92 NORTHERN MINDANAO 3.23 4.03 3.27 3.19 2.11 DAVAO REGION 4.37 4.41 4.44 4.30 4.28 SOCCSKSARGEN 2.34 3.28 1.87 1.39 1.67 NATIONAL CAPITAL REGION 39.00 25.32 44.67 46.29 51.32 CORDILLERA ADMINISTRATIVE REGION (CAR) 1.23 1.64 1.05 0.79 0.92 AUTONOMOUS REGION OF MUSLIM MINDANAO (ARMM)
0.99 1.45 0.70 0.76 0.65
C A R A G A 1.28 1.92 1.13 0.92 0.61
Source of basic data: National Statistics Office List of Establishments, 2000 and 2002.

61
Table 2-12: Growth of Employment, by Size Category and Region: 2000 and 2002
TOTAL MICRO SMALL MEDIUM LARGE -4.37 -0.34 -7.32 -5.70 -6.58
ILOCOS REGION -0.69 -0.43 -6.06 1.78 14.99 CAGAYAN VALLEY -1.66 -0.61 -3.25 -3.97 -6.29 CENTRAL LUZON -4.09 0.32 -8.59 -10.02 -7.54 SOUTHERN TAGALOG -3.30 -0.83 -6.49 -11.12 -2.65 BICOL REGION -4.36 -0.59 -4.15 0.69 -23.74 WESTERN VISAYAS -1.74 -0.57 -4.61 -0.24 -1.30 CENTRAL VISAYAS -2.58 -0.22 -7.75 -3.32 -0.61 EASTERN VISAYAS -3.96 -0.30 -9.88 -7.07 -8.54 ZAMBOANGA PENINSULA -6.11 -3.75 -12.54 -8.98 -2.38 NORTHERN MINDANAO 5.42 9.31 1.41 11.48 -0.23 DAVAO REGION -14.98 -14.57 -11.94 -7.61 -19.26 SOCCSKSARGEN -7.61 11.55 11.66 1.10 -37.33 NATIONAL CAPITAL REGION -5.64 -0.49 -8.87 -5.92 -6.33 CORDILLERA ADMINISTRATIVE REGION (CAR) -2.28 -1.42 -4.81 -4.99 -1.25 AUTONOMOUS REGION OF MUSLIM MINDANAO (ARMM)
45.61 37.55 69.28 55.01 53.89
C A R A G A -3.95 -0.99 -2.23 -8.06 -14.97
Source of basic data: National Statistics Office List of Establishments, 2000 and 2002.
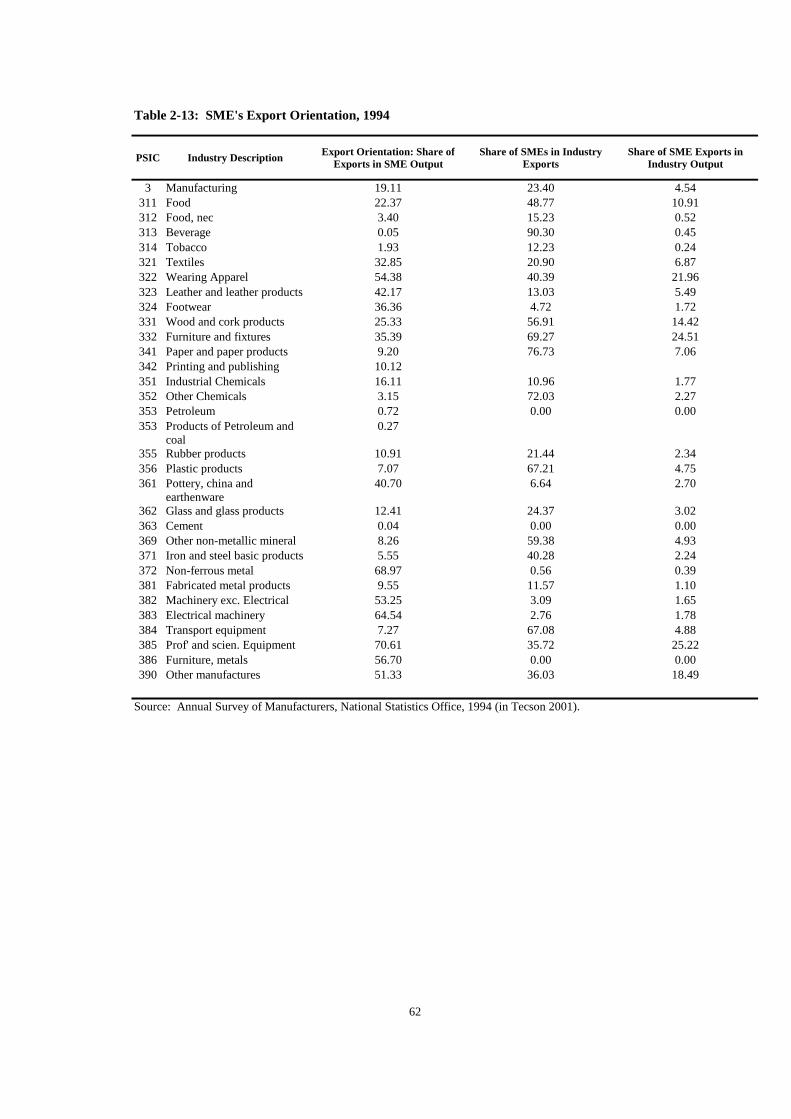
62
Table 2-13: SME's Export Orientation, 1994
PSIC Industry Description Export Orientation: Share of Exports in SME Output
Share of SMEs in Industry Exports
Share of SME Exports in Industry Output
3 Manufacturing 19.11 23.40 4.54 311 Food 22.37 48.77 10.91 312 Food, nec 3.40 15.23 0.52 313 Beverage 0.05 90.30 0.45 314 Tobacco 1.93 12.23 0.24 321 Textiles 32.85 20.90 6.87 322 Wearing Apparel 54.38 40.39 21.96 323 Leather and leather products 42.17 13.03 5.49 324 Footwear 36.36 4.72 1.72 331 Wood and cork products 25.33 56.91 14.42 332 Furniture and fixtures 35.39 69.27 24.51 341 Paper and paper products 9.20 76.73 7.06 342 Printing and publishing 10.12 351 Industrial Chemicals 16.11 10.96 1.77 352 Other Chemicals 3.15 72.03 2.27 353 Petroleum 0.72 0.00 0.00 353 Products of Petroleum and
coal 0.27
355 Rubber products 10.91 21.44 2.34 356 Plastic products 7.07 67.21 4.75 361 Pottery, china and
earthenware 40.70 6.64 2.70
362 Glass and glass products 12.41 24.37 3.02 363 Cement 0.04 0.00 0.00 369 Other non-metallic mineral 8.26 59.38 4.93 371 Iron and steel basic products 5.55 40.28 2.24 372 Non-ferrous metal 68.97 0.56 0.39 381 Fabricated metal products 9.55 11.57 1.10 382 Machinery exc. Electrical 53.25 3.09 1.65 383 Electrical machinery 64.54 2.76 1.78 384 Transport equipment 7.27 67.08 4.88 385 Prof' and scien. Equipment 70.61 35.72 25.22 386 Furniture, metals 56.70 0.00 0.00 390 Other manufactures 51.33 36.03 18.49
Source: Annual Survey of Manufacturers, National Statistics Office, 1994 (in Tecson 2001).

63
Table 2-14: Export Orientation of SMEs and Large Enterprises With and Without Foreign Ownership, 1994
Share of Direct Exports in Output PSIC Industry Description W/out Foreign Equity With Foreign Equity
311 Food 20-99 23.44 18.67 100+ 19.24 54.21
312 Food, nec 20-99 0 13.02 100+ 8.98 20.95
313 Beverage 20-99 9.07 100+ 1.46 6.06
314 Tobacco 20-99 100+ 2.22 97.91
321 Textiles 20-99 14.63 17.57 100+ 17.49 14.36
322 Wearing Apparel 20-99 16.31 32.37 100+ 18.57 20.27
323 Leather and leather products 20-99 20.59 100+ 4.49 50.29
324 Footwear 20-99 4.36 2.05 100+ 79.2
331 Wood and cork products 20-99 15.68 43.53 100+ 3.44 100.64
332 Furniture and fixtures 20-99 37.33 100 100+ 45.22 25.16
341 Paper and paper products 20-99 9.68 52.14 100+ 34.62 24.38
342 Printing and publishing 20-99 19.23 85.6 100+ 2.66 55.86
351 Industrial Chemicals 20-99 7.32 10.44 100+ 29.85 12.76
352 Other Chemicals 20-99 4.38 3.66 100+ 11.11 8.6
353 Petroleum 20-99 100+ 2.59
353 Products of Petroleum and coal
20-99 100+ 12.89
355 Rubber products 20-99 1.8 2.32 100+ 9.83 41.54
356 Plastic products 20-99 5.68 10.06 100+ 15.56 80.8
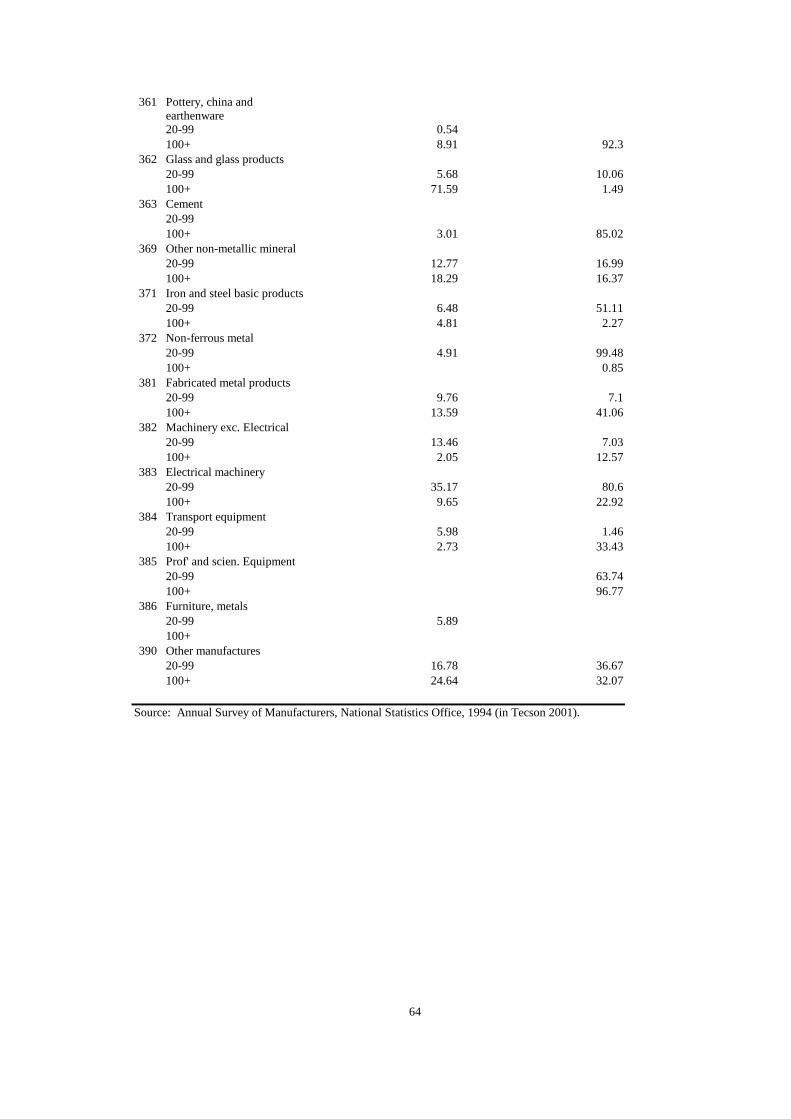
64
361 Pottery, china and earthenware
20-99 0.54 100+ 8.91 92.3
362 Glass and glass products 20-99 5.68 10.06 100+ 71.59 1.49
363 Cement 20-99 100+ 3.01 85.02
369 Other non-metallic mineral 20-99 12.77 16.99 100+ 18.29 16.37
371 Iron and steel basic products 20-99 6.48 51.11 100+ 4.81 2.27
372 Non-ferrous metal 20-99 4.91 99.48 100+ 0.85
381 Fabricated metal products 20-99 9.76 7.1 100+ 13.59 41.06
382 Machinery exc. Electrical 20-99 13.46 7.03 100+ 2.05 12.57
383 Electrical machinery 20-99 35.17 80.6 100+ 9.65 22.92
384 Transport equipment 20-99 5.98 1.46 100+ 2.73 33.43
385 Prof' and scien. Equipment 20-99 63.74 100+ 96.77
386 Furniture, metals 20-99 5.89 100+
390 Other manufactures 20-99 16.78 36.67
100+ 24.64 32.07
Source: Annual Survey of Manufacturers, National Statistics Office, 1994 (in Tecson 2001).
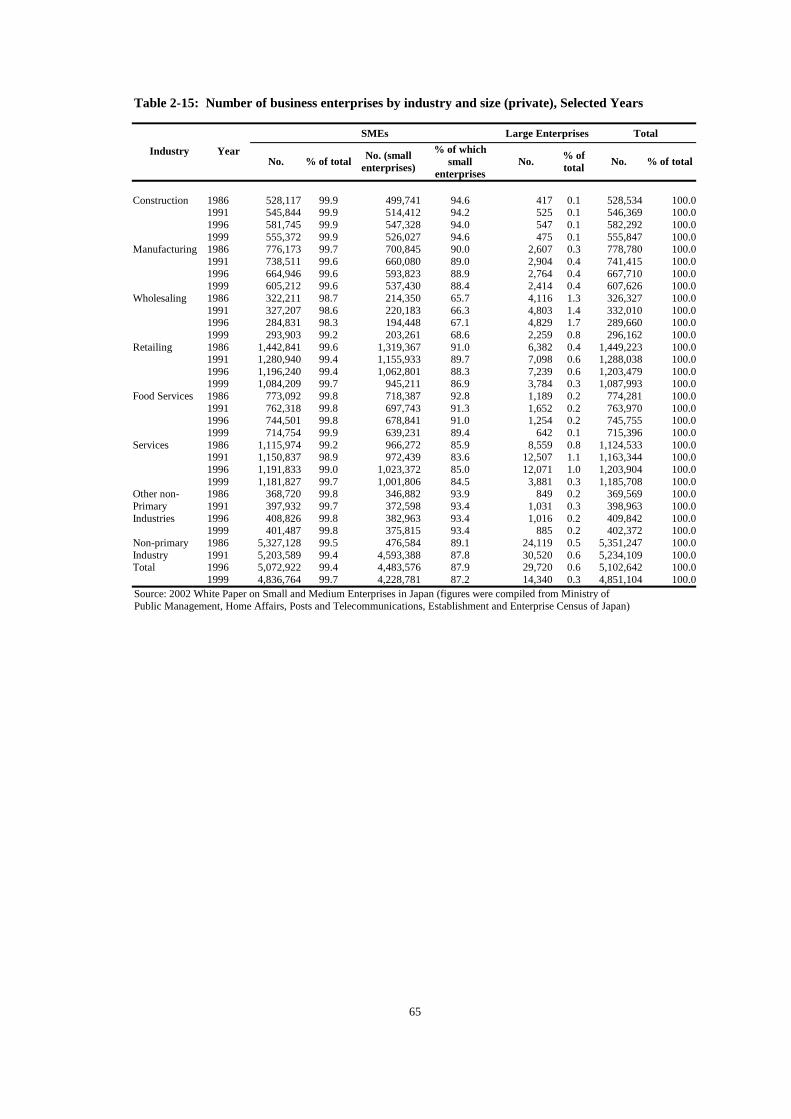
65
Table 2-15: Number of business enterprises by industry and size (private), Selected Years
SMEs Large Enterprises Total Industry Year
No. % of total No. (small enterprises)
% of which small
enterprises No. % of
total No. % of total
Construction 1986 528,117 99.9 499,741 94.6 417 0.1 528,534 100.0 1991 545,844 99.9 514,412 94.2 525 0.1 546,369 100.0 1996 581,745 99.9 547,328 94.0 547 0.1 582,292 100.0 1999 555,372 99.9 526,027 94.6 475 0.1 555,847 100.0 Manufacturing 1986 776,173 99.7 700,845 90.0 2,607 0.3 778,780 100.0 1991 738,511 99.6 660,080 89.0 2,904 0.4 741,415 100.0 1996 664,946 99.6 593,823 88.9 2,764 0.4 667,710 100.0 1999 605,212 99.6 537,430 88.4 2,414 0.4 607,626 100.0 Wholesaling 1986 322,211 98.7 214,350 65.7 4,116 1.3 326,327 100.0 1991 327,207 98.6 220,183 66.3 4,803 1.4 332,010 100.0 1996 284,831 98.3 194,448 67.1 4,829 1.7 289,660 100.0 1999 293,903 99.2 203,261 68.6 2,259 0.8 296,162 100.0 Retailing 1986 1,442,841 99.6 1,319,367 91.0 6,382 0.4 1,449,223 100.0 1991 1,280,940 99.4 1,155,933 89.7 7,098 0.6 1,288,038 100.0 1996 1,196,240 99.4 1,062,801 88.3 7,239 0.6 1,203,479 100.0 1999 1,084,209 99.7 945,211 86.9 3,784 0.3 1,087,993 100.0 Food Services 1986 773,092 99.8 718,387 92.8 1,189 0.2 774,281 100.0 1991 762,318 99.8 697,743 91.3 1,652 0.2 763,970 100.0 1996 744,501 99.8 678,841 91.0 1,254 0.2 745,755 100.0 1999 714,754 99.9 639,231 89.4 642 0.1 715,396 100.0 Services 1986 1,115,974 99.2 966,272 85.9 8,559 0.8 1,124,533 100.0 1991 1,150,837 98.9 972,439 83.6 12,507 1.1 1,163,344 100.0 1996 1,191,833 99.0 1,023,372 85.0 12,071 1.0 1,203,904 100.0 1999 1,181,827 99.7 1,001,806 84.5 3,881 0.3 1,185,708 100.0 Other non- 1986 368,720 99.8 346,882 93.9 849 0.2 369,569 100.0 Primary 1991 397,932 99.7 372,598 93.4 1,031 0.3 398,963 100.0 Industries 1996 408,826 99.8 382,963 93.4 1,016 0.2 409,842 100.0 1999 401,487 99.8 375,815 93.4 885 0.2 402,372 100.0 Non-primary 1986 5,327,128 99.5 476,584 89.1 24,119 0.5 5,351,247 100.0 Industry 1991 5,203,589 99.4 4,593,388 87.8 30,520 0.6 5,234,109 100.0 Total 1996 5,072,922 99.4 4,483,576 87.9 29,720 0.6 5,102,642 100.0 1999 4,836,764 99.7 4,228,781 87.2 14,340 0.3 4,851,104 100.0 Source: 2002 White Paper on Small and Medium Enterprises in Japan (figures were compiled from Ministry of Public Management, Home Affairs, Posts and Telecommunications, Establishment and Enterprise Census of Japan)
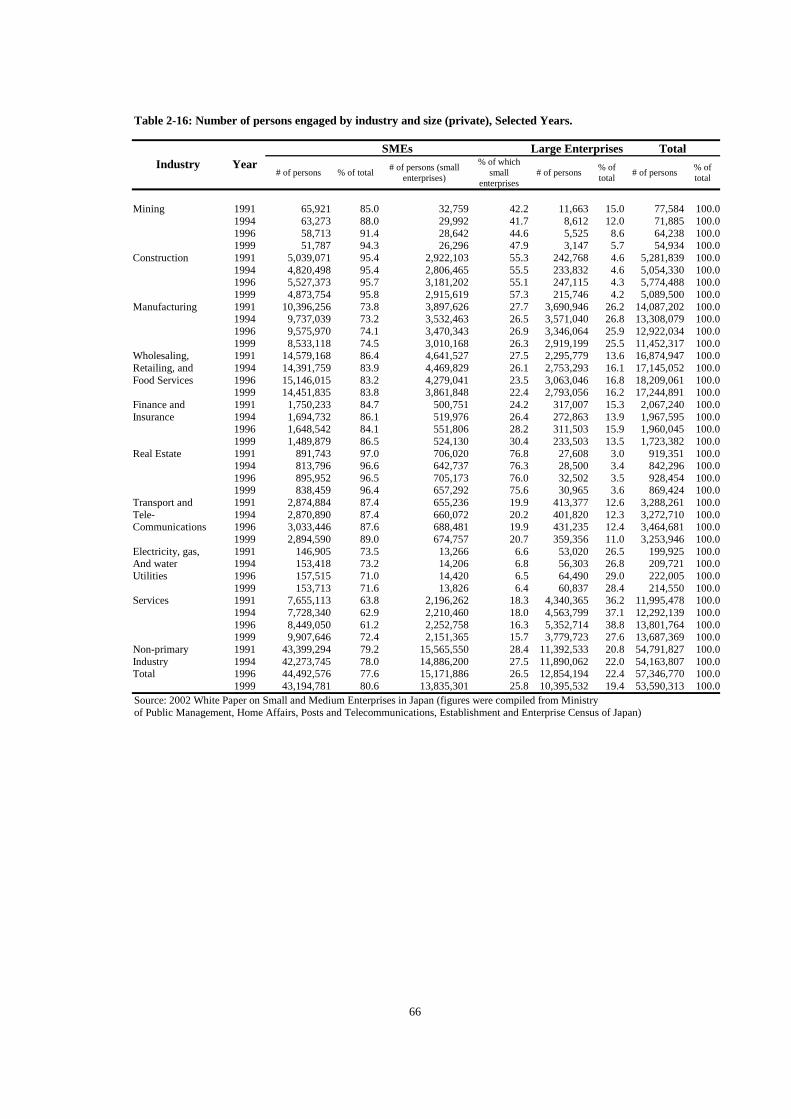
66
Table 2-16: Number of persons engaged by industry and size (private), Selected Years.
SMEs Large Enterprises Total Industry Year
# of persons % of total # of persons (small enterprises)
% of which small
enterprises # of persons % of
total # of persons % of total
Mining 1991 65,921 85.0 32,759 42.2 11,663 15.0 77,584 100.0 1994 63,273 88.0 29,992 41.7 8,612 12.0 71,885 100.0 1996 58,713 91.4 28,642 44.6 5,525 8.6 64,238 100.0 1999 51,787 94.3 26,296 47.9 3,147 5.7 54,934 100.0 Construction 1991 5,039,071 95.4 2,922,103 55.3 242,768 4.6 5,281,839 100.0 1994 4,820,498 95.4 2,806,465 55.5 233,832 4.6 5,054,330 100.0 1996 5,527,373 95.7 3,181,202 55.1 247,115 4.3 5,774,488 100.0 1999 4,873,754 95.8 2,915,619 57.3 215,746 4.2 5,089,500 100.0 Manufacturing 1991 10,396,256 73.8 3,897,626 27.7 3,690,946 26.2 14,087,202 100.0 1994 9,737,039 73.2 3,532,463 26.5 3,571,040 26.8 13,308,079 100.0 1996 9,575,970 74.1 3,470,343 26.9 3,346,064 25.9 12,922,034 100.0 1999 8,533,118 74.5 3,010,168 26.3 2,919,199 25.5 11,452,317 100.0 Wholesaling, 1991 14,579,168 86.4 4,641,527 27.5 2,295,779 13.6 16,874,947 100.0 Retailing, and 1994 14,391,759 83.9 4,469,829 26.1 2,753,293 16.1 17,145,052 100.0 Food Services 1996 15,146,015 83.2 4,279,041 23.5 3,063,046 16.8 18,209,061 100.0 1999 14,451,835 83.8 3,861,848 22.4 2,793,056 16.2 17,244,891 100.0 Finance and 1991 1,750,233 84.7 500,751 24.2 317,007 15.3 2,067,240 100.0 Insurance 1994 1,694,732 86.1 519,976 26.4 272,863 13.9 1,967,595 100.0 1996 1,648,542 84.1 551,806 28.2 311,503 15.9 1,960,045 100.0 1999 1,489,879 86.5 524,130 30.4 233,503 13.5 1,723,382 100.0 Real Estate 1991 891,743 97.0 706,020 76.8 27,608 3.0 919,351 100.0 1994 813,796 96.6 642,737 76.3 28,500 3.4 842,296 100.0 1996 895,952 96.5 705,173 76.0 32,502 3.5 928,454 100.0 1999 838,459 96.4 657,292 75.6 30,965 3.6 869,424 100.0 Transport and 1991 2,874,884 87.4 655,236 19.9 413,377 12.6 3,288,261 100.0 Tele- 1994 2,870,890 87.4 660,072 20.2 401,820 12.3 3,272,710 100.0 Communications 1996 3,033,446 87.6 688,481 19.9 431,235 12.4 3,464,681 100.0 1999 2,894,590 89.0 674,757 20.7 359,356 11.0 3,253,946 100.0 Electricity, gas, 1991 146,905 73.5 13,266 6.6 53,020 26.5 199,925 100.0 And water 1994 153,418 73.2 14,206 6.8 56,303 26.8 209,721 100.0 Utilities 1996 157,515 71.0 14,420 6.5 64,490 29.0 222,005 100.0 1999 153,713 71.6 13,826 6.4 60,837 28.4 214,550 100.0 Services 1991 7,655,113 63.8 2,196,262 18.3 4,340,365 36.2 11,995,478 100.0 1994 7,728,340 62.9 2,210,460 18.0 4,563,799 37.1 12,292,139 100.0 1996 8,449,050 61.2 2,252,758 16.3 5,352,714 38.8 13,801,764 100.0 1999 9,907,646 72.4 2,151,365 15.7 3,779,723 27.6 13,687,369 100.0 Non-primary 1991 43,399,294 79.2 15,565,550 28.4 11,392,533 20.8 54,791,827 100.0 Industry 1994 42,273,745 78.0 14,886,200 27.5 11,890,062 22.0 54,163,807 100.0 Total 1996 44,492,576 77.6 15,171,886 26.5 12,854,194 22.4 57,346,770 100.0 1999 43,194,781 80.6 13,835,301 25.8 10,395,532 19.4 53,590,313 100.0 Source: 2002 White Paper on Small and Medium Enterprises in Japan (figures were compiled from Ministry of Public Management, Home Affairs, Posts and Telecommunications, Establishment and Enterprise Census of Japan)
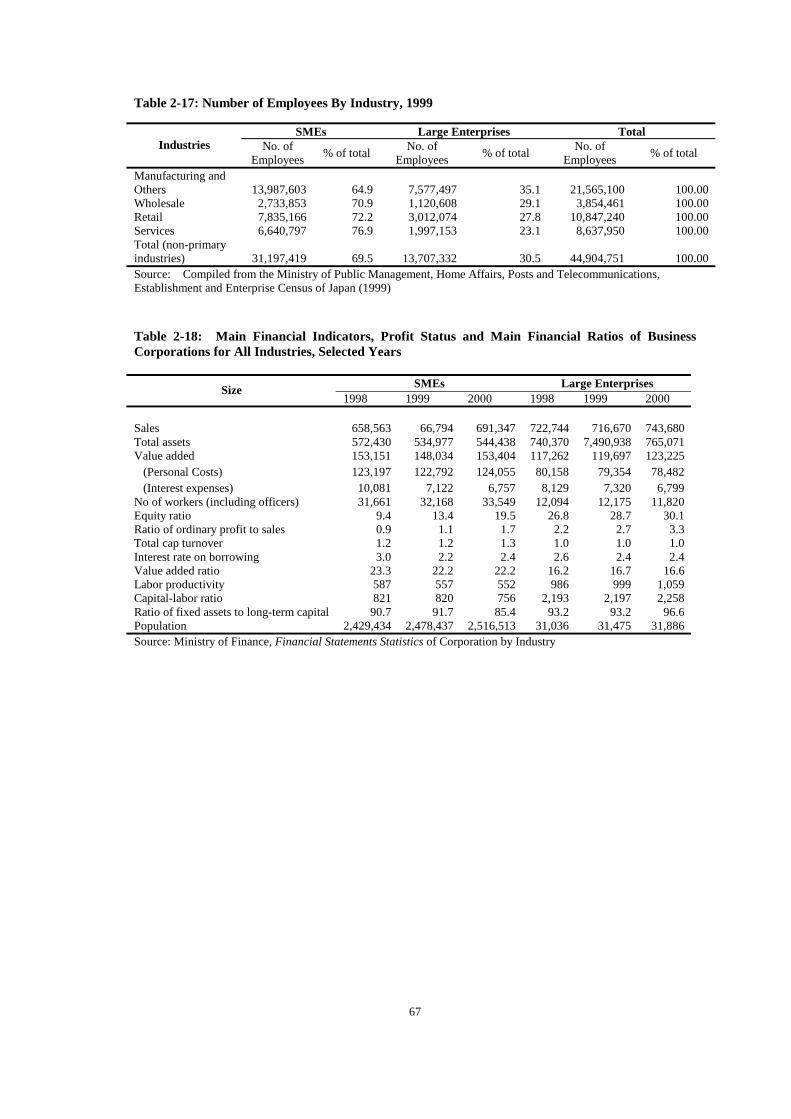
67
Table 2-17: Number of Employees By Industry, 1999
SMEs Large Enterprises Total Industries No. of
Employees % of total No. of Employees % of total No. of
Employees % of total
Manufacturing and Others 13,987,603 64.9 7,577,497 35.1 21,565,100 100.00 Wholesale 2,733,853 70.9 1,120,608 29.1 3,854,461 100.00 Retail 7,835,166 72.2 3,012,074 27.8 10,847,240 100.00 Services 6,640,797 76.9 1,997,153 23.1 8,637,950 100.00 Total (non-primary industries) 31,197,419 69.5 13,707,332 30.5 44,904,751 100.00 Source: Compiled from the Ministry of Public Management, Home Affairs, Posts and Telecommunications, Establishment and Enterprise Census of Japan (1999) Table 2-18: Main Financial Indicators, Profit Status and Main Financial Ratios of Business Corporations for All Industries, Selected Years
SMEs Large Enterprises Size 1998 1999 2000 1998 1999 2000
Sales 658,563 66,794 691,347 722,744 716,670 743,680 Total assets 572,430 534,977 544,438 740,370 7,490,938 765,071 Value added 153,151 148,034 153,404 117,262 119,697 123,225 (Personal Costs) 123,197 122,792 124,055 80,158 79,354 78,482 (Interest expenses) 10,081 7,122 6,757 8,129 7,320 6,799 No of workers (including officers) 31,661 32,168 33,549 12,094 12,175 11,820 Equity ratio 9.4 13.4 19.5 26.8 28.7 30.1 Ratio of ordinary profit to sales 0.9 1.1 1.7 2.2 2.7 3.3 Total cap turnover 1.2 1.2 1.3 1.0 1.0 1.0 Interest rate on borrowing 3.0 2.2 2.4 2.6 2.4 2.4 Value added ratio 23.3 22.2 22.2 16.2 16.7 16.6 Labor productivity 587 557 552 986 999 1,059 Capital-labor ratio 821 820 756 2,193 2,197 2,258 Ratio of fixed assets to long-term capital 90.7 91.7 85.4 93.2 93.2 96.6 Population 2,429,434 2,478,437 2,516,513 31,036 31,475 31,886 Source: Ministry of Finance, Financial Statements Statistics of Corporation by Industry
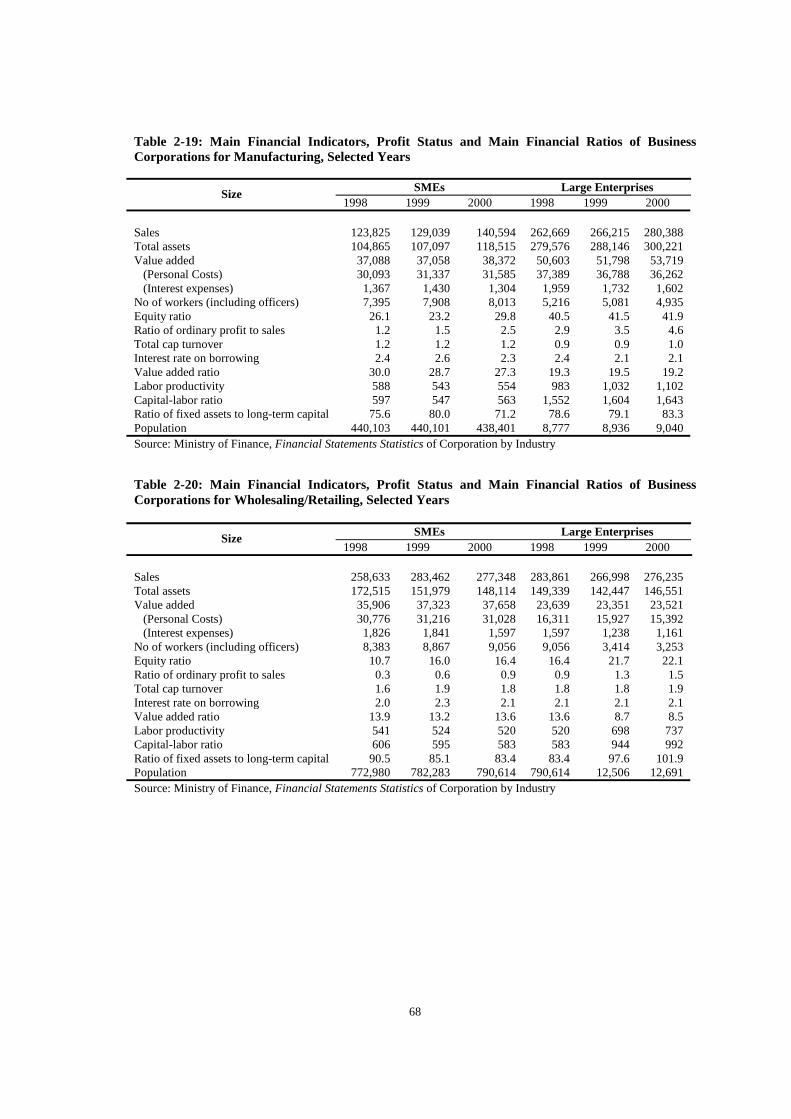
68
Table 2-19: Main Financial Indicators, Profit Status and Main Financial Ratios of Business Corporations for Manufacturing, Selected Years
SMEs Large Enterprises Size 1998 1999 2000 1998 1999 2000
Sales 123,825 129,039 140,594 262,669 266,215 280,388 Total assets 104,865 107,097 118,515 279,576 288,146 300,221 Value added 37,088 37,058 38,372 50,603 51,798 53,719 (Personal Costs) 30,093 31,337 31,585 37,389 36,788 36,262 (Interest expenses) 1,367 1,430 1,304 1,959 1,732 1,602 No of workers (including officers) 7,395 7,908 8,013 5,216 5,081 4,935 Equity ratio 26.1 23.2 29.8 40.5 41.5 41.9 Ratio of ordinary profit to sales 1.2 1.5 2.5 2.9 3.5 4.6 Total cap turnover 1.2 1.2 1.2 0.9 0.9 1.0 Interest rate on borrowing 2.4 2.6 2.3 2.4 2.1 2.1 Value added ratio 30.0 28.7 27.3 19.3 19.5 19.2 Labor productivity 588 543 554 983 1,032 1,102 Capital-labor ratio 597 547 563 1,552 1,604 1,643 Ratio of fixed assets to long-term capital 75.6 80.0 71.2 78.6 79.1 83.3 Population 440,103 440,101 438,401 8,777 8,936 9,040 Source: Ministry of Finance, Financial Statements Statistics of Corporation by Industry Table 2-20: Main Financial Indicators, Profit Status and Main Financial Ratios of Business Corporations for Wholesaling/Retailing, Selected Years
SMEs Large Enterprises Size 1998 1999 2000 1998 1999 2000
Sales 258,633 283,462 277,348 283,861 266,998 276,235 Total assets 172,515 151,979 148,114 149,339 142,447 146,551 Value added 35,906 37,323 37,658 23,639 23,351 23,521 (Personal Costs) 30,776 31,216 31,028 16,311 15,927 15,392 (Interest expenses) 1,826 1,841 1,597 1,597 1,238 1,161 No of workers (including officers) 8,383 8,867 9,056 9,056 3,414 3,253 Equity ratio 10.7 16.0 16.4 16.4 21.7 22.1 Ratio of ordinary profit to sales 0.3 0.6 0.9 0.9 1.3 1.5 Total cap turnover 1.6 1.9 1.8 1.8 1.8 1.9 Interest rate on borrowing 2.0 2.3 2.1 2.1 2.1 2.1 Value added ratio 13.9 13.2 13.6 13.6 8.7 8.5 Labor productivity 541 524 520 520 698 737 Capital-labor ratio 606 595 583 583 944 992 Ratio of fixed assets to long-term capital 90.5 85.1 83.4 83.4 97.6 101.9 Population 772,980 782,283 790,614 790,614 12,506 12,691 Source: Ministry of Finance, Financial Statements Statistics of Corporation by Industry
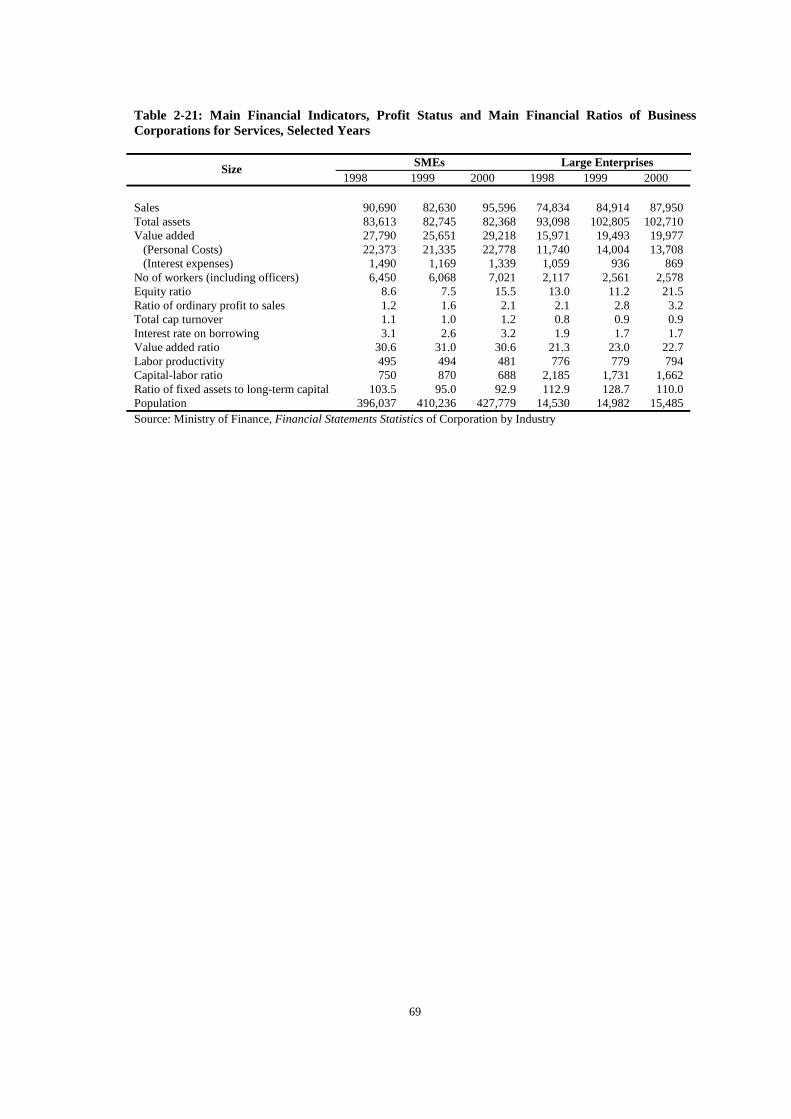
69
Table 2-21: Main Financial Indicators, Profit Status and Main Financial Ratios of Business Corporations for Services, Selected Years
SMEs Large Enterprises Size 1998 1999 2000 1998 1999 2000
Sales 90,690 82,630 95,596 74,834 84,914 87,950 Total assets 83,613 82,745 82,368 93,098 102,805 102,710 Value added 27,790 25,651 29,218 15,971 19,493 19,977 (Personal Costs) 22,373 21,335 22,778 11,740 14,004 13,708 (Interest expenses) 1,490 1,169 1,339 1,059 936 869 No of workers (including officers) 6,450 6,068 7,021 2,117 2,561 2,578 Equity ratio 8.6 7.5 15.5 13.0 11.2 21.5 Ratio of ordinary profit to sales 1.2 1.6 2.1 2.1 2.8 3.2 Total cap turnover 1.1 1.0 1.2 0.8 0.9 0.9 Interest rate on borrowing 3.1 2.6 3.2 1.9 1.7 1.7 Value added ratio 30.6 31.0 30.6 21.3 23.0 22.7 Labor productivity 495 494 481 776 779 794 Capital-labor ratio 750 870 688 2,185 1,731 1,662 Ratio of fixed assets to long-term capital 103.5 95.0 92.9 112.9 128.7 110.0 Population 396,037 410,236 427,779 14,530 14,982 15,485 Source: Ministry of Finance, Financial Statements Statistics of Corporation by Industry

70
Table 5-1: Summary of Basic Differences Regarding SME Basic Law
Previous SME Basic Law New SME Basic Law
POLICY CONCEPT Rectify the Gap Between LE & SME in terms of productivity
Developing a wide range of independent SMEs for greater economic vitality ! creation of new businesses ! promotion of market competition ! increase of attractive job opportunities ! # vitalization of regional economy
POLICY SYSTEM
! Upgrading/Improving Productivity
! Improving Trading Conditions ! Finance & Taxation
! Supporting self-help for ambitious enterprises: ! Strengthening of Management Base ! Facilitating apt responses by enterprise for abrupt
environmental change (Providing Necessary Safety Net) ex. facilitating change of business, provision of mutual relief system & legal system of bankruptcy
! Finance & Taxation (i.e. establishing various ways to supply fund including direct financing)
DEFINITION
(1) Manufacturing ! capital size: 100 or less ! employees: 300 or less (2) Wholesale ! capital size: 30 or less ! employees: 100 or less (3) Retail ! capital size: 10 or less ! employees: 10 or less (4) Services ! capital size:10 or less ! employees: 50 or less
(1) Manufacturing ! capital size: 300 or less ! employees: 300 or less (2) Wholesale ! capital size: 100 or less ! employees: 100 or less (3) Retail ! capital size: 50 or less ! employees: 50 or less (4) Services ! capital size: 50 or less ! employees: 100 or less
Note that capital size is in million yen Source: Small and Medium Enterprise Agency (www.sme.ne.jp/policies02_kaiseigaiyo/kaiseigaiyo.html)
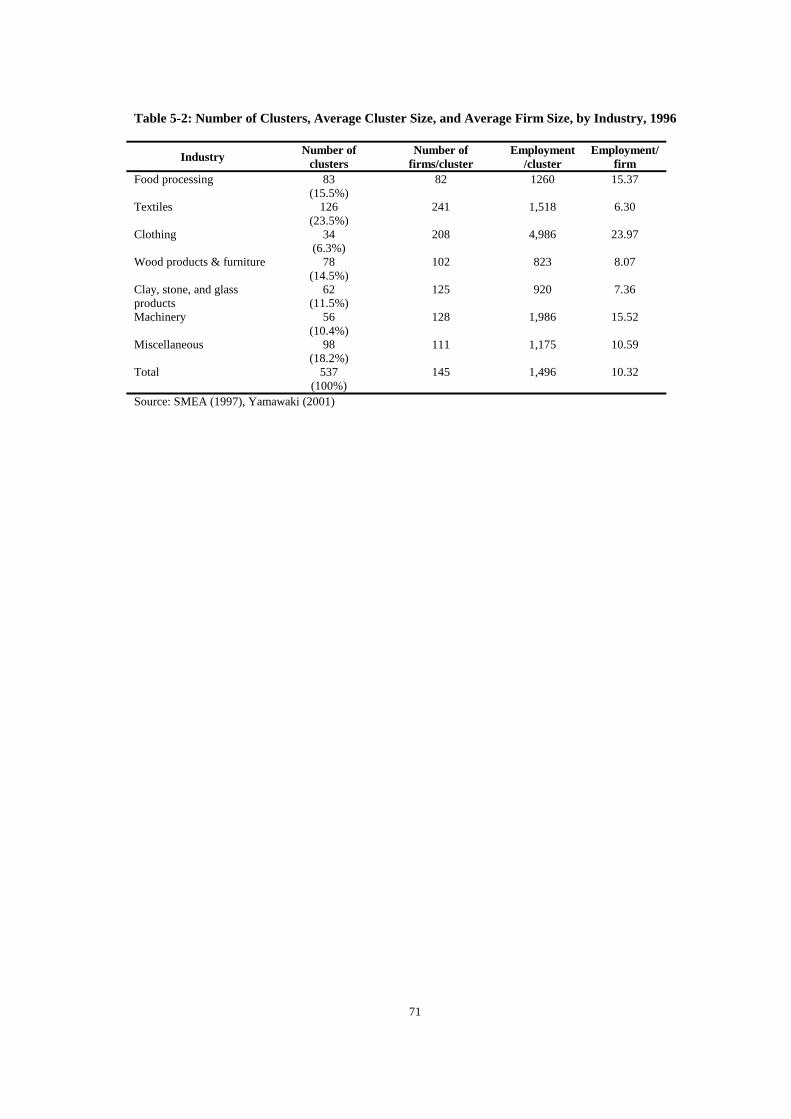
71
Table 5-2: Number of Clusters, Average Cluster Size, and Average Firm Size, by Industry, 1996
Industry Number of clusters
Number of firms/cluster
Employment/cluster
Employment/ firm
Food processing 83 (15.5%)
82 1260 15.37
Textiles 126 (23.5%)
241 1,518 6.30
Clothing 34 (6.3%)
208 4,986 23.97
Wood products & furniture 78 (14.5%)
102 823 8.07
Clay, stone, and glass products
62 (11.5%)
125 920 7.36
Machinery 56 (10.4%)
128 1,986 15.52
Miscellaneous 98 (18.2%)
111 1,175 10.59
Total 537 (100%)
145 1,496 10.32
Source: SMEA (1997), Yamawaki (2001)
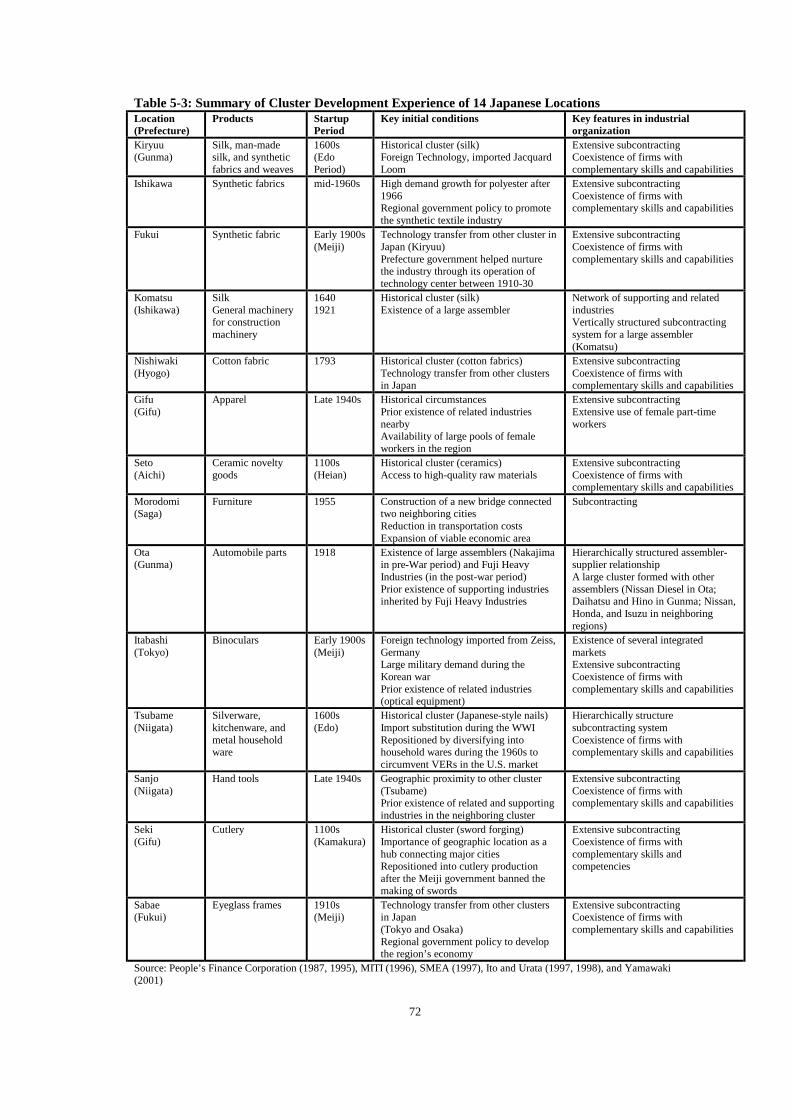
72
Table 5-3: Summary of Cluster Development Experience of 14 Japanese Locations Location (Prefecture)
Products Startup Period
Key initial conditions Key features in industrial organization
Kiryuu (Gunma)
Silk, man-made silk, and synthetic fabrics and weaves
1600s (Edo Period)
Historical cluster (silk) Foreign Technology, imported Jacquard Loom
Extensive subcontracting Coexistence of firms with complementary skills and capabilities
Ishikawa Synthetic fabrics mid-1960s High demand growth for polyester after 1966 Regional government policy to promote the synthetic textile industry
Extensive subcontracting Coexistence of firms with complementary skills and capabilities
Fukui Synthetic fabric Early 1900s (Meiji)
Technology transfer from other cluster in Japan (Kiryuu) Prefecture government helped nurture the industry through its operation of technology center between 1910-30
Extensive subcontracting Coexistence of firms with complementary skills and capabilities
Komatsu (Ishikawa)
Silk General machinery for construction machinery
1640 1921
Historical cluster (silk) Existence of a large assembler
Network of supporting and related industries Vertically structured subcontracting system for a large assembler (Komatsu)
Nishiwaki (Hyogo)
Cotton fabric 1793 Historical cluster (cotton fabrics) Technology transfer from other clusters in Japan
Extensive subcontracting Coexistence of firms with complementary skills and capabilities
Gifu (Gifu)
Apparel Late 1940s Historical circumstances Prior existence of related industries nearby Availability of large pools of female workers in the region
Extensive subcontracting Extensive use of female part-time workers
Seto (Aichi)
Ceramic novelty goods
1100s (Heian)
Historical cluster (ceramics) Access to high-quality raw materials
Extensive subcontracting Coexistence of firms with complementary skills and capabilities
Morodomi (Saga)
Furniture 1955 Construction of a new bridge connected two neighboring cities Reduction in transportation costs Expansion of viable economic area
Subcontracting
Ota (Gunma)
Automobile parts 1918 Existence of large assemblers (Nakajima in pre-War period) and Fuji Heavy Industries (in the post-war period) Prior existence of supporting industries inherited by Fuji Heavy Industries
Hierarchically structured assembler-supplier relationship A large cluster formed with other assemblers (Nissan Diesel in Ota; Daihatsu and Hino in Gunma; Nissan, Honda, and Isuzu in neighboring regions)
Itabashi (Tokyo)
Binoculars Early 1900s (Meiji)
Foreign technology imported from Zeiss, Germany Large military demand during the Korean war Prior existence of related industries (optical equipment)
Existence of several integrated markets Extensive subcontracting Coexistence of firms with complementary skills and capabilities
Tsubame (Niigata)
Silverware, kitchenware, and metal household ware
1600s (Edo)
Historical cluster (Japanese-style nails) Import substitution during the WWI Repositioned by diversifying into household wares during the 1960s to circumvent VERs in the U.S. market
Hierarchically structure subcontracting system Coexistence of firms with complementary skills and capabilities
Sanjo (Niigata)
Hand tools Late 1940s Geographic proximity to other cluster (Tsubame) Prior existence of related and supporting industries in the neighboring cluster
Extensive subcontracting Coexistence of firms with complementary skills and capabilities
Seki (Gifu)
Cutlery 1100s (Kamakura)
Historical cluster (sword forging) Importance of geographic location as a hub connecting major cities Repositioned into cutlery production after the Meiji government banned the making of swords
Extensive subcontracting Coexistence of firms with complementary skills and competencies
Sabae (Fukui)
Eyeglass frames 1910s (Meiji)
Technology transfer from other clusters in Japan (Tokyo and Osaka) Regional government policy to develop the region’s economy
Extensive subcontracting Coexistence of firms with complementary skills and capabilities
Source: People’s Finance Corporation (1987, 1995), MITI (1996), SMEA (1997), Ito and Urata (1997, 1998), and Yamawaki (2001)

73
Table 5-4. Sources of Advantage in Japan’s Clusters, by Industry (response rate in percentage)
Advantages (note: respondents are not
restricted to choose only one)
All industries
Textile and clothing
Wood prod and furniture
Stone, clay, and glass
Metal prod. And
machinery Ease of procurement 42.3 23.9 50.7 59.3 50.0 Access to labor market 6.8 5.1 5.5 3.7 8.0 Availability of skilled workers and engineers
10.0 9.4 13.7 5.6 8.0
Specialization/division of labor 42.6 53.6 47.9 31.5 64.0 Access to supplier/subcontractor 24.2 30.4 23.3 13.0 38.0 Access to customer base 10.8 11.6 12.3 13.0 6.0 Competitive environment 19.5 16.7 20.5 25.9 14.0 Diffusion of technology and technological cooperation
31.2 37.6 26.0 46.4 16.0
Opportunity for business alliance 11.9 8.0 13.7 14.8 10.0 Access to market information 24.8 29.0 16.4 16.7 24.0 Regional policy 27.4 26.8 23.3 20.4 28.0 No advantage 2.8 2.9 1.4 1.9 0.0 Number of clusters in sample 471 138 73 54 50 Source: SMEA (1997), Table 17 (taken from Yamawaki (2001))

74
Table 6-1. Total Philippine Exports, the Philippines Exports to Japan: Shares and Growth Rates, 1998-2002
Product Category
Contribution of RP's Export to Japan to total RP Exports
Average Contribution of RP's Export to Japan to total RP Exports
Total Philippine
Exports (Growth)
Exports to Japan (Growth)
Total 14.63 7.67 5.25 Consumer manufactures 6.38 8.22 -1.21 -2.21 Food and food preparations 8.00 30.7 1.01 -0.82 Processed foods 0.76 7.04 0.25 -2.78 Fresh foods 4.34 60.35 4.66 2.97 Marine products 2.91 35.71 -0.43 -5.11 Tuna 0.52 16.74 -0.97 -0.1 Shrimps and prawns 1.93 71.27 2.23 -1.87 Resourced-based products 6.52 18.02 -4.92 -8.32 Industrial manufactures 73.36 14.29 11.54 8.32 Electronics 60.24 13.26 14.68 11.51 Components/devices (semi-
conductors) 33.19 9.91 13.92 8.3 Electronic data processing 21.51 24.11 24.33 18.78 Telecommunications 1.44 33.06 -15.49 38.63 Automotive electronics 1.76 28.29 9.26 31.55 Consumer electronics 1.40 15.98 8.3 -11.31 Machineries/transport
equipment/apparatus and parts 8.18 34.4 12.15 3.84 Transport Equipment 7.07 34.67 11.78 2.65 Automotive parts 6.41 35.43 11.53 3.18 Special transactions 5.73 19.73 10.98 9.28
Source: Tradeline Philippines, Department of Trade and Industry, in Palanca-Tan (2003) Table 6-2. Philippine Exportable Products to Japan: Japan’s Import Index > 1and Philippine RCA > 1, 1999.
Commodity Japan’s Import Index
Philippine RCA
031 fish fresh simply preserved 5.02 1.37 032 fish etc. tinned prepared 4.06 3.49 051 fruit fresh nuts fresh dry 1.06 4.02 053 fruit preserved prepared 1.64 3.28 241 fuel wood charcoal 2.29 2.68 281 iron ore conc 4.78 2.42 284 non fer metal scrap 1.38 1.36 285 silver platinum ores 2.09 2.03 292 crude veg materials nes 1.21 1.16 632 wood manufacture nes 1.33 1.26 714 office machine 1.09 4.45 831 travel goods handbags 2.64 3.98 841 cloth not fur 1.51 2.02 864 watches clocks 1.64 2.12 899 other manufacturing goods 1.28 1.06 941 zoo animals pets 1.21 1.04 Source of data: NAPES Database in Palanca-Tan (2003).

75
Table 6-3. Philippine Exportable Products to Japan: Japan’s Import Index > 1and Philippine RCA < 1, 1999
Commodity Japan’s Import Index
Philippine RCA
054 veg etc. fresh simply preserved 1.63 0.20 055 veg etc. preserved prepared 2.18 0.21 081 animal feed stuff 1.74 0.24 099 food preps nes 1.05 0.33 112 alcoholic beverage 1.12 0.21 121 tobacco unmanufactured 1.36 0.87 243 wood shaped 2.06 0.13 251 pulp waste paper 1.42 0.31 276 other crude minerals 2.31 0.24 283 non fer base mtl ore conc 4.47 0.99 291 crude animal matter nes 2.98 0.35 332 petroleum products 1.10 0.23 341 gas natural manufactured 4.10 0.12 521 coal petroleum etc. chemicals 2.05 0.17 656 textile etc. products nes 1.58 0.81 657 floor cover tapestry etc. 1.14 0.15 661 cement etc. bldg products 1.24 0.57 851 foot wear 1.05 0.52 897 gold silver jewelry 1.06 0.24 Source of data: NAPES Database in Tan (2003).
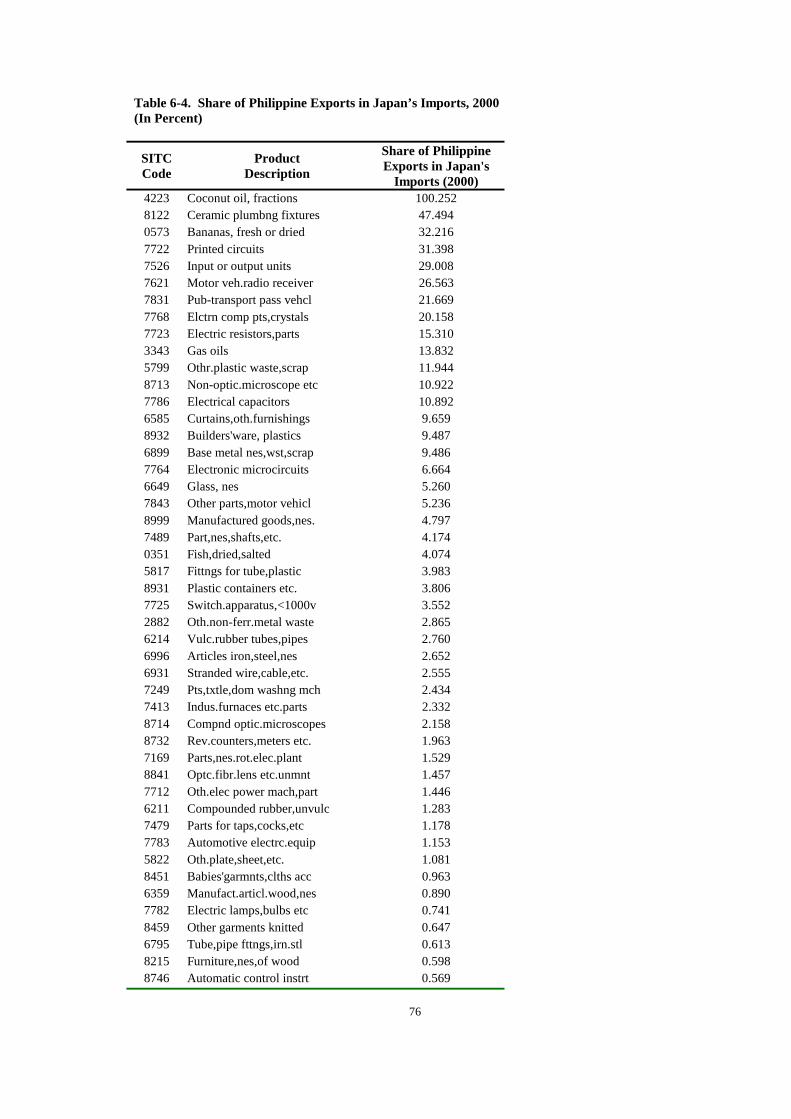
76
Table 6-4. Share of Philippine Exports in Japan’s Imports, 2000 (In Percent)
SITC Code
Product Description
Share of Philippine Exports in Japan's
Imports (2000) 4223 Coconut oil, fractions 100.252 8122 Ceramic plumbng fixtures 47.494 0573 Bananas, fresh or dried 32.216 7722 Printed circuits 31.398 7526 Input or output units 29.008 7621 Motor veh.radio receiver 26.563 7831 Pub-transport pass vehcl 21.669 7768 Elctrn comp pts,crystals 20.158 7723 Electric resistors,parts 15.310 3343 Gas oils 13.832 5799 Othr.plastic waste,scrap 11.944 8713 Non-optic.microscope etc 10.922 7786 Electrical capacitors 10.892 6585 Curtains,oth.furnishings 9.659 8932 Builders'ware, plastics 9.487 6899 Base metal nes,wst,scrap 9.486 7764 Electronic microcircuits 6.664 6649 Glass, nes 5.260 7843 Other parts,motor vehicl 5.236 8999 Manufactured goods,nes. 4.797 7489 Part,nes,shafts,etc. 4.174 0351 Fish,dried,salted 4.074 5817 Fittngs for tube,plastic 3.983 8931 Plastic containers etc. 3.806 7725 Switch.apparatus,<1000v 3.552 2882 Oth.non-ferr.metal waste 2.865 6214 Vulc.rubber tubes,pipes 2.760 6996 Articles iron,steel,nes 2.652 6931 Stranded wire,cable,etc. 2.555 7249 Pts,txtle,dom washng mch 2.434 7413 Indus.furnaces etc.parts 2.332 8714 Compnd optic.microscopes 2.158 8732 Rev.counters,meters etc. 1.963 7169 Parts,nes.rot.elec.plant 1.529 8841 Optc.fibr.lens etc.unmnt 1.457 7712 Oth.elec power mach,part 1.446 6211 Compounded rubber,unvulc 1.283 7479 Parts for taps,cocks,etc 1.178 7783 Automotive electrc.equip 1.153 5822 Oth.plate,sheet,etc. 1.081 8451 Babies'garmnts,clths acc 0.963 6359 Manufact.articl.wood,nes 0.890 7782 Electric lamps,bulbs etc 0.741 8459 Other garments knitted 0.647 6795 Tube,pipe fttngs,irn.stl 0.613 8215 Furniture,nes,of wood 0.598 8746 Automatic control instrt 0.569
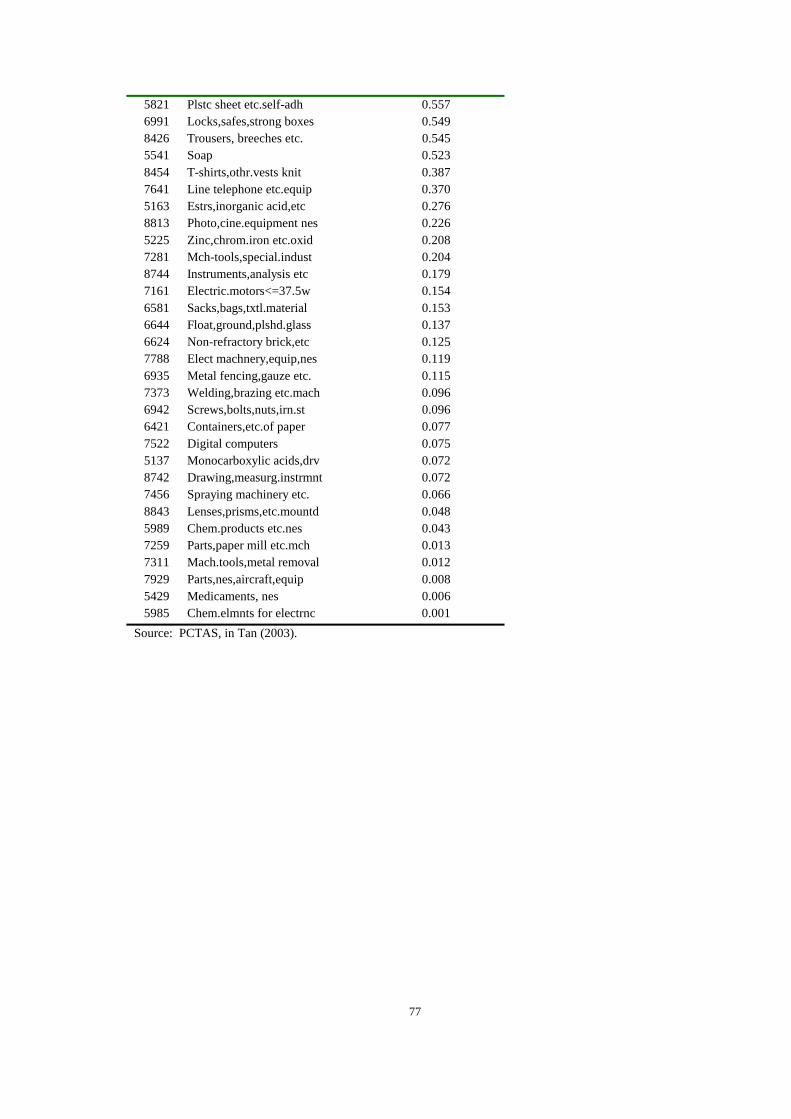
77
5821 Plstc sheet etc.self-adh 0.557 6991 Locks,safes,strong boxes 0.549 8426 Trousers, breeches etc. 0.545 5541 Soap 0.523 8454 T-shirts,othr.vests knit 0.387 7641 Line telephone etc.equip 0.370 5163 Estrs,inorganic acid,etc 0.276 8813 Photo,cine.equipment nes 0.226 5225 Zinc,chrom.iron etc.oxid 0.208 7281 Mch-tools,special.indust 0.204 8744 Instruments,analysis etc 0.179 7161 Electric.motors<=37.5w 0.154 6581 Sacks,bags,txtl.material 0.153 6644 Float,ground,plshd.glass 0.137 6624 Non-refractory brick,etc 0.125 7788 Elect machnery,equip,nes 0.119 6935 Metal fencing,gauze etc. 0.115 7373 Welding,brazing etc.mach 0.096 6942 Screws,bolts,nuts,irn.st 0.096 6421 Containers,etc.of paper 0.077 7522 Digital computers 0.075 5137 Monocarboxylic acids,drv 0.072 8742 Drawing,measurg.instrmnt 0.072 7456 Spraying machinery etc. 0.066 8843 Lenses,prisms,etc.mountd 0.048 5989 Chem.products etc.nes 0.043 7259 Parts,paper mill etc.mch 0.013 7311 Mach.tools,metal removal 0.012 7929 Parts,nes,aircraft,equip 0.008 5429 Medicaments, nes 0.006 5985 Chem.elmnts for electrnc 0.001
Source: PCTAS, in Tan (2003).