slowdown of the walker circulation at solar cycle maximum
TRANSCRIPT

Slowdown of the Walker circulation at solarcycle maximumStergios Misiosa,b,1, Lesley J. Graya,c, Mads F. Knudsenb,d, Christoffer Karoffb,d,e, Hauke Schmidtf, and Joanna D. Haighg,h
aDepartment of Physics, Oxford University, Oxford, OX1 3PU, United Kingdom; bDepartment of Geoscience, Aarhus University, DK-8000 Aarhus C,Denmark; cNational Centre for Atmospheric Science, Oxford, OX1 3PU, United Kingdom; diCLIMATE Interdisciplinary Centre for Climate Change, AarhusUniversity, DK-8000 Aarhus C, Denmark; eStellar Astrophysics Centre, Department of Physics and Astronomy, Aarhus University, DK-8000 Aarhus C,Denmark; fMax Planck Institute for Meteorology, 20146, Hamburg, Germany; gDepartment of Physics, Imperial College London, London, SW7 2BW, UnitedKingdom; and hGrantham Institute, Imperial College London, London, SW7 2BW, United Kingdom
Edited by Isaac M. Held, Geophysical Fluid Dynamics Laboratory, National Oceanic and Atmospheric Administration, Princeton, NJ, and approved February 25,2019 (received for review August 31, 2018)
The Pacific Walker Circulation (PWC) fluctuates on interannual andmultidecadal timescales under the influence of internal variability andexternal forcings. Here, we provide observational evidence thatthe 11-y solar cycle (SC) affects the PWC on decadal timescales. Weobserve a robust reduction of east–west sea-level pressure gradientsover the Indo-Pacific Ocean during solar maxima and the following1–2 y. This reduction is associatedwithwesterly wind anomalies at thesurface and throughout the equatorial troposphere in the western/central Pacific paired with an eastward shift of convective precipita-tion that brings more rainfall to the central Pacific. We show that thisis initiated by a thermodynamical response of the global hydrologicalcycle to surface warming, further amplified by atmosphere–oceancoupling, leading to larger positive ocean temperature anomalies inthe equatorial Pacific than expected from simple radiative forcing con-siderations. The observed solar modulation of the PWC is supported bya set of coupled ocean–atmosphere climate model simulations forcedonly by SC irradiance variations. We highlight the importance of amuted hydrology mechanism that acts to weaken the PWC. Demon-stration of this mechanism acting on the 11-y SC timescale adds con-fidence in model predictions that the same mechanism also weakensthe PWC under increasing greenhouse gas forcing.
11-y solar cycle | Walker circulation | GHG forcing | climate model
The Pacific Walker Circulation (PWC) consists of a large-scalezonal overturning atmospheric circulation pattern over the
equatorial Indian and Pacific Oceans that plays a key role inglobal climate by redistributing heat and precipitation. On in-terannual timescales, the PWC is tightly coupled to local varia-tions of sea-surface temperatures (SSTs) associated with the ElNiño Southern Oscillation (ENSO); its warm phase causes re-duced sea-level pressure (SLP) gradients between the westernand eastern Pacific, weaker trade winds, an eastward displace-ment of the PWC, and increased rainfall in the central/east Pa-cific (1). Model simulations of climate change indicate an overallweakening of the PWC, explained in terms of a muted hydrologycycle as global-mean precipitation increases (2–3%/K of surfacewarming) at a lower rate than atmospheric humidity (∼7%/Kfollowing the Clausius–Clapeyron, C-C, relationship) (2, 3).However, observational evidence of PWC trends in the 20thcentury is contradictory, depending on the diagnostics examinedand which time period is selected, especially as the last few de-cades have been characterized by a number of La Niña eventsthat result in a strengthened rather than a weakened PWC (4–6).In view of the inconclusive observational evidence for the
greenhouse gas (GHG) response, one approach is to look forimproved insight by examining the transient response of tropicalclimate to other external factors. Examination of the response tothe 11-y solar cycle (SC) forcing presents such an opportunity.There is a variety of observational evidence for an SC influenceat the Earth’s surface, generally interpreted in terms of a “top-down” stratospheric influence via UV irradiance and ozonechanges and “bottom-up” influences via total solar irradiance
(TSI) and hence surface heating (7). The bottom-up mechanismis most likely the primary influence in the Indo-Pacific (7–9), butthere have been contradictory interpretations of the observa-tions. Composite analyses have associated SC maximum (Smax)years with negative SST anomalies in the equatorial Pacific,stronger east–west SLP gradient, enhanced surface easterlies,and ultimately a stronger PWC (10–12). However, ENSO vari-ability may severely contaminate signals in composites of limitedtime periods (13, 14). Alternative approaches such as multipleregression analysis that take into account variability associatedwith ENSO and other forcings (e.g., volcanic) suggest a warmerequatorial Pacific Ocean (∼0.4 K) lagging Smax by 1–2 y (13, 15),which slackens the east–west SLP gradient and reduces thestrength of the PWC. Given that the radiative imbalance at thetop of the atmosphere barely exceeds 0.18 W/m2 between Sminand Smax, radiative forcing alone suggests a very modest global-mean surface warming of only 0.08–0.16 K (15). The consider-ably stronger sensitivity detected in the Pacific is thought to bedue to feedbacks between the direct surface heating, clouds/precipitation changes, and dynamical ocean adjustments (7–9).A weakened PWC in response to Smax has been identified,
albeit with varying strength, in the majority of climate models.Responding to warmer Pacific SSTs at Smax, the models simulatean increase in tropical precipitation (16), deep convection shiftsfrom the maritime continent toward the central Pacific, and theeasterly trade winds slacken, the latter indicating a weakening and
Significance
Influences of the 11-y solar cycle (SC) on climate have beenspeculated, but here we provide robust evidence that the SCaffects decadal variability in the tropical Pacific. By analyzingindependent observations, we demonstrate a slowdown of thePacific Walker Circulation (PWC) at SC maximum. We find amuted hydrological cycle at solar maximum that weakens thePWC and this is amplified by a Bjerknes feedback. Given that asimilar muted hydrological cycle has been simulated under in-creased greenhouse gas forcing, our results strengthen confi-dence in model predictions of a weakened PWC in a warmerclimate. The results also suggest that SC forcing is a source ofskill for decadal predictions in the Indo-Pacific region.
Author contributions: S.M. designed research; S.M. and L.J.G. performed research; S.M.analyzed data; and S.M., L.J.G., M.F.K., C.K., H.S., and J.D.H. wrote the paper.
The authors declare no conflict of interest.
This article is a PNAS Direct Submission.
This open access article is distributed under Creative Commons Attribution License 4.0(CC BY).
Data deposition: All data and scripts are available through the GitHub repository, https://github.com/smisios/pnas2019.1To whom correspondence should be addressed. Email: [email protected].
This article contains supporting information online at www.pnas.org/lookup/suppl/doi:10.1073/pnas.1815060116/-/DCSupplemental.
Published online March 29, 2019.
7186–7191 | PNAS | April 9, 2019 | vol. 116 | no. 15 www.pnas.org/cgi/doi/10.1073/pnas.1815060116
Dow
nloa
ded
by g
uest
on
Nov
embe
r 30
, 202
1
eastward displacement of the upward branch of the PWC (17).Extensive examination of the historical simulations in the fifthphase of the Coupled Model Intercomparison Project (CMIP5)(18) attributed the weakened PWC response to the weaker sen-sitivity of global precipitation to surface warming (∼1.9%/K) com-pared with global atmospheric moistening (∼6.6%/K).It turns out, therefore, that the muted hydrological cycle mecha-
nism may slow down the PWC under both SC and GHG forcings, atleast in climate models. Here, we demonstrate the transient responseof the PWC to the SC in a variety of independent observationalrecords spanning the second half of the 20th century. The periodicnature of SC forcing reduces the potential influence of uncorrectedobservational biases in existing datasets that often hamper the de-tection of longer-term trends. Our methodology is based on a simplelead/lag multiple-linear regression (MLR) that includes ENSO, vol-canic, and GHG forcings, as well as the SC (Materials and Methods).We find a clear, statistically significant weakening of the PWC atSmax. Idealized model simulations support the observational patternof a weakened PWC, and are interpreted in terms of the bottom-upmechanism, initiated by a zonally uniform SST warming and am-plified by an ocean–atmosphere (Bjerknes) feedback.
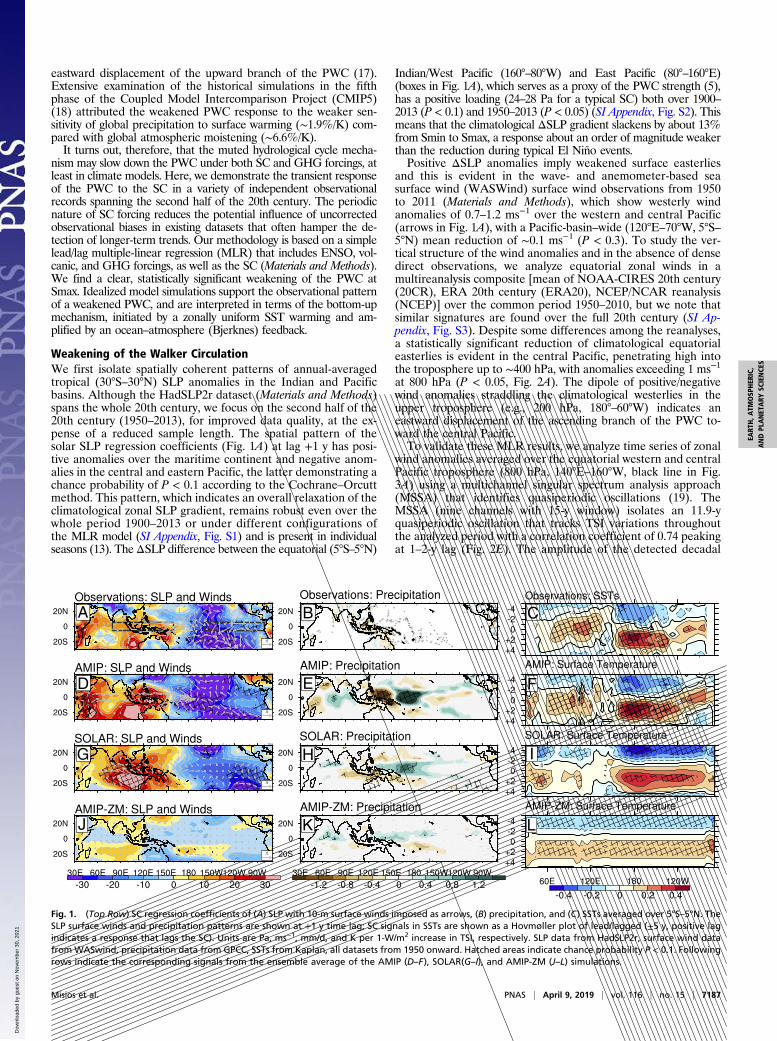
Weakening of the Walker CirculationWe first isolate spatially coherent patterns of annual-averagedtropical (30°S–30°N) SLP anomalies in the Indian and Pacificbasins. Although the HadSLP2r dataset (Materials and Methods)spans the whole 20th century, we focus on the second half of the20th century (1950–2013), for improved data quality, at the ex-pense of a reduced sample length. The spatial pattern of thesolar SLP regression coefficients (Fig. 1A) at lag +1 y has posi-tive anomalies over the maritime continent and negative anom-alies in the central and eastern Pacific, the latter demonstrating achance probability of P < 0.1 according to the Cochrane–Orcuttmethod. This pattern, which indicates an overall relaxation of theclimatological zonal SLP gradient, remains robust even over thewhole period 1900–2013 or under different configurations ofthe MLR model (SI Appendix, Fig. S1) and is present in individualseasons (13). TheΔSLP difference between the equatorial (5°S–5°N)
Indian/West Pacific (160°–80°W) and East Pacific (80°–160°E)(boxes in Fig. 1A), which serves as a proxy of the PWC strength (5),has a positive loading (24–28 Pa for a typical SC) both over 1900–2013 (P < 0.1) and 1950–2013 (P < 0.05) (SI Appendix, Fig. S2). Thismeans that the climatological ΔSLP gradient slackens by about 13%from Smin to Smax, a response about an order of magnitude weakerthan the reduction during typical El Niño events.Positive ΔSLP anomalies imply weakened surface easterlies
and this is evident in the wave- and anemometer-based seasurface wind (WASWind) surface wind observations from 1950to 2011 (Materials and Methods), which show westerly windanomalies of 0.7–1.2 ms−1 over the western and central Pacific(arrows in Fig. 1A), with a Pacific-basin–wide (120°E–70°W, 5°S–5°N) mean reduction of ∼0.1 ms−1 (P < 0.3). To study the ver-tical structure of the wind anomalies and in the absence of densedirect observations, we analyze equatorial zonal winds in amultireanalysis composite [mean of NOAA-CIRES 20th century(20CR), ERA 20th century (ERA20), NCEP/NCAR reanalysis(NCEP)] over the common period 1950–2010, but we note thatsimilar signatures are found over the full 20th century (SI Ap-pendix, Fig. S3). Despite some differences among the reanalyses,a statistically significant reduction of climatological equatorialeasterlies is evident in the central Pacific, penetrating high intothe troposphere up to ∼400 hPa, with anomalies exceeding 1 ms−1
at 800 hPa (P < 0.05, Fig. 2A). The dipole of positive/negativewind anomalies straddling the climatological westerlies in theupper troposphere (e.g., 200 hPa, 180°–60°W) indicates aneastward displacement of the ascending branch of the PWC to-ward the central Pacific.To validate these MLR results, we analyze time series of zonal
wind anomalies averaged over the equatorial western and centralPacific troposphere (800 hPa, 140°E–160°W, black line in Fig.3A) using a multichannel singular spectrum analysis approach(MSSA) that identifies quasiperiodic oscillations (19). TheMSSA (nine channels with 15-y window) isolates an 11.9-yquasiperiodic oscillation that tracks TSI variations throughoutthe analyzed period with a correlation coefficient of 0.74 peakingat 1–2-y lag (Fig. 2E). The amplitude of the detected decadal
A B C
D E F
G H I
J K L
Fig. 1. (Top Row) SC regression coefficients of (A) SLP with 10-m surface winds imposed as arrows, (B) precipitation, and (C) SSTs averaged over 5°S–5°N. TheSLP surface winds and precipitation patterns are shown at +1 y time lag; SC signals in SSTs are shown as a Hovmøller plot of lead/lagged (±5 y, positive lagindicates a response that lags the SC). Units are Pa, ms−1, mm/d, and K per 1-W/m2 increase in TSI, respectively. SLP data from HadSLP2r, surface wind datafrom WASwind, precipitation data from GPCC, SSTs from Kaplan, all datasets from 1950 onward. Hatched areas indicate chance probability P < 0.1. Followingrows indicate the corresponding signals from the ensemble average of the AMIP (D–F), SOLAR(G–I), and AMIP-ZM (J–L) simulations.
Misios et al. PNAS | April 9, 2019 | vol. 116 | no. 15 | 7187
EART
H,A
TMOSP
HER
IC,
ANDPL
ANET
ARY
SCIENCE
S
Dow
nloa
ded
by g
uest
on
Nov
embe
r 30
, 202
1

oscillation in this region exceeds 1 ms−1, consistent with theMLR signal, with prevalent westerly anomalies in Smax reversingto easterly anomalies during Smin years.A weaker and eastward-shifted PWC at Smax results in an east-
ward migration of atmospheric convection and precipitation maximatoward the central Pacific as evident in the Global PrecipitationClimatology Centre (GPCC) precipitation dataset (Materials andMethods) over the period 1950–2013 (Fig. 1B). Despite the limitedspatial coverage of GPCC in the Pacific, the detected pattern isrobust and is supported by the reanalyses and the independentGPCP v.2.3 global precipitation dataset (SI Appendix, Fig. S4).The observed signals in Figs. 1 and 2 refer to 1 y after Smax
(lag +1 y), when the strongest ΔSLP anomalies are detected inHadSLP2r and the reanalyses (SI Appendix, Fig. S5). This timelag is similar to that identified in previous studies (15, 18) andindeed our MLR analysis of the Kaplan SSTs over the period1950–2013 (Materials and Methods) detects a significant SSTwarming of more than 0.4 K over the equatorial Pacific thatmaximizes at 1-y time lag (Fig. 1C). The spatial pattern of theseSST anomalies is characterized by a stronger loading over thecentral Pacific and overall warming over the Indian Ocean, asshown in earlier MLR analyses (13, 18, 20).In line with other studies, we propose that the observed SLP,
wind, and precipitation anomalies are all associated with thisSST warming. To highlight the bottom-up contribution of SSTs,we perform a six-member ensemble of an atmosphere-only globalclimate model for 1950–2013 (33 SCs) forced only at the surfaceboundary by time-varying SST and sea-ice concentration observa-tions (AMIP ensemble, Materials and Methods), while deliberatelykeeping the solar irradiance and all other forcings constant. The
SLP regression coefficients show good agreement with theHadSLP2r at lag +1 y, and significant positive/negative SLPanomalies are simulated over the Indian Ocean/West Pacific andthe East Pacific, respectively, resulting in a positive ensemblemean ΔSLP of +41 Pa at Smax (Fig. 1D and SI Appendix, Figs. S2and S5). Westerly surface wind anomalies (>1 ms−1) are simulatedbetween 150° and 170°W that extend up to 400 hPa into theequatorial troposphere in all individual AMIP runs, although theensemble mean westerly anomalies are narrower than in reanalyseswith an overall stronger magnitude (1.5 ms−1 at 800 hPa), likelyexplained by differences in the extent and position of the cli-matological PWC (Fig. 2B and SI Appendix, Fig. S6). Consistentwith precipitation observations, the upward branch of the PWCshifts eastward bringing significantly more rainfall (>2.5 mm d−1)toward the central Pacific (Fig. 1E).While the AMIP ensemble underlines the role of SST anoma-
lies, this is insufficient evidence for the role of SC forcing on thePWC. Although the null hypothesis, that the observed responsessimply reflect internally generated decadal variability, can berejected in statistical terms with probability <0.1, the MLR anal-ysis alone cannot establish causal linkages between SC forcing andwarmer SSTs/weakened PWC per se. In fact, the detected patternsin tropical PWC, SSTs, and precipitation share common featureswith modes associated with internal Pacific variability (21), im-plying a possible signal contamination. To demonstrate a physicallinkage to SC forcing, we perform a four-member, 100-y ensemble(∼40 SCs) using a coupled atmosphere–ocean model forced onlyby repeating the solar cycle 22 (1986–1996) variation in solarspectral irradiance (SOLAR ensemble, Materials and Methods).
A B E
C D F
Fig. 2. SC regression coefficients of equatorial zonal winds for (A) the multireanalysis mean of 20CR, ERA20, and NCEP, (B) AMIP ensemble mean, (C) SOLARensemble mean, and (D) AMIP-ZM ensemble mean. Hatched areas indicate chance significance P < 0.1. Contour lines show the zonal wind climatology. Units inms−1 per 1-W/m2 increase in TSI. Signals refer to +1-y time lag. (E and F) MSSA filtered equatorial zonal winds (ms−1) in the multireanalysis mean composite (1950–2010) and SOLAR, respectively, averaged over 800 hPa and 140°E–160°W (marked in A and C). TSI variability (gray, normalized) is superimposed for reference.
7188 | www.pnas.org/cgi/doi/10.1073/pnas.1815060116 Misios et al.
Dow
nloa
ded
by g
uest
on
Nov
embe
r 30
, 202
1

Increased TSI at Smax in the SOLAR results in a widespreadwarming over the equatorial Pacific, with regression coefficientsof up to +0.4 K that maximize at a lag of 1–2 y, in good agreementwith the observations (Fig. 1I). The equatorial SLP responds tothe positive SST anomalies by increasing over the Indian Ocean/West Pacific and reducing in the East Pacific and the strongestSLP signal is also found at 1–2 y lag (Fig. 1G and SI Appendix,Fig. S5). The ensemble mean ΔSLP change of +38 Pa per 1 W/m2
increase in TSI is consistent with the observed change ofabout +24 Pa per 1 W/m2 (SI Appendix, Fig. S2) and indicates aslower PWC. This is confirmed by the westerly surface windanomalies between 150° and 170°W (0.5 ms−1) that extendthroughout the troposphere (0.7 ms−1 at 800 hPa) in the westernPacific (Fig. 2C). SOLAR reproduces the pattern of observedzonal wind anomalies over the equatorial Pacific but the modelsimulates broader easterly anomalies over the Indian Ocean(30°–90°E), associated with overall broader simulated SLP andSST patterns. This is related to a common model bias in simu-lating tropical Pacific feedbacks, which also affects the SLP,precipitation, and SST responses to ENSO variability on in-terannual timescales (SI Appendix, Fig. S7) and is present inmany other coupled atmosphere–ocean models (22). The spreadof wind anomalies among individual ensemble members inSOLAR is low and all consistently show a weakened PWC withreduced easterlies in the western Pacific and a dipole of negative/positive anomalies in the upper troposphere (SI Appendix, Fig.S8). MSSA filtering of the ensemble mean SOLAR zonal windsat 800 hPa over the western and central Pacific identifies aquasiperiodic (∼10.3-y) fluctuation in phase with the specifiedTSI variability (∼10.5-y period) over 100 model years with acorrelation coefficient 0.6 at lag +1 y (Fig. 2F). An eastward shiftof the upward branch of the PWC in SOLAR brings morerainfall toward the central Pacific (Fig. 1H), with an amplitudeand pattern comparable to the observations.An eastward shift of the PWC following Smax has also been
simulated in previous studies (17, 18), but as an additionalmeasure to validate our model responses, we identify a similar
pattern of westerly wind anomalies at Smax in the CommunityEarth System Model (CESM) Large Ensemble Project simulationsthat include all historical forcings (SI Appendix, Fig. S9). In sum-mary, the SOLAR simulations reject the null hypothesis that thePWC response is due to internal decadal variability and insteadprovide supporting evidence that the observed weakening of thePWC is a genuine response to the increased TSI at solar maximum.
Weakening of the PWC by a Muted HydrologyPrevious analysis of CMIP5 historical simulations indicates that astarting point in understanding the mechanisms whereby the SCvariability influences the PWC is found in the muted hydrolog-ical cycle mechanism (18). As direct observations of precipitationsuffer from limited spatiotemporal coverage and homogeniza-tion issues (23), we turn to the reanalyses to examine globalsignals at lag +1 y in precipitation and water vapor content(WVC). Reanalyses generally indicate an atmospheric moisten-ing at Smax with increases of 0.5% (P < 0.25), 0.7% (P < 0.05),and 0.4% (P < 0.4) for 20CR, ERA20, and NCEP, respectively(Fig. 3). Over the ocean only (land grid points masked out) thesignals are 0.6% (P < 0.05), 0.74% (P < 0.05), and 0.57% (P < 0.15).This translates to a global-mean sensitivity of 6.3%/K, 7.7%/K, and4.2%/K, under global surface warming (per 1 W/m2) of about0.07, 0.09, and 0.1 K (Fig. 3). While the WVC is largely con-trolled by the C-C relation, global precipitation changes areconstrained by atmospheric energetics and generally increase ata reduced rate in response to a warmer surface (24). The SCimprint on global precipitation is more uncertain than the WVCand reanalyses show insignificant positive anomalies at lag +1(0.06%, 0.1%, and 0.32% for 20CR, ERA20, and NCEP, re-spectively, generally P < 0.6). However, the sensitivity of globalprecipitation changes to surface warming (0.94%/K, 1.15%/K,and 3.17%/K, for 20CR, ERA20, and NCEP, respectively) lieswithin the spread of responses in the AMIP individual runs(range −0.6–4.2%/K at lag +1 y), which show an ensemble meanincrease of 1.92%/K. As expected, percentage increases of globalWVC are larger than the corresponding precipitation signals inall AMIP runs, with an ensemble mean WVC sensitivity of8.84%/K (ensemble range 6.1–11.6%/K). Comparable changes inglobal hydrology are also found in SOLAR at lag +1. The WVCincreases significantly by 0.72% (P < 0.01 and range 0.4–1%),while global precipitation increases by merely 0.12% (P < 0.22and range 0.07–0.2%), implying an ensemble mean sensitivity tothe SC of 9.6%/K for WVC and 1.6%/K for precipitation.Reanalyses and model results provide evidence for a stronger
sensitivity of the global WVC increase versus global precipitationin response to the SC, which is consistent with SC signatures inglobal hydrology identified in the CMIP5 models and other at-tribution studies (18, 24). According to theory and sensitivitysimulations of GHG forcing (2, 25), the dominant driver ofglobal hydrological changes is the spatially uniform SST responsewhile the SST pattern (longitudinal distribution of SST anoma-lies) is of secondary importance. To investigate whether this isalso the case for solar forcing, we analyze an AMIP-ZM en-semble, which is identical to AMIP but forced only by zonallyaveraged SST anomalies from 1950 to 2013 superimposed on theSST climatology (Materials and Methods). In this way, the lon-gitudinal pattern of SST response to SC forcing is removed andsurface temperature anomalies over the Indian and PacificOceans are characterized by a zonally uniform warming, whichbarely exceeds 0.1 K (Fig. 1L). Analysis of this ensemble con-firms that the global-mean WVC and precipitation increase atalmost the same rates as in the AMIP (with differences arisingmainly over land; Fig. 3). The muted response of the globalhydrology weakens convection and tropical circulation as in-dicated by the westerly anomalies (up to 300 hPa) in the FarWest Pacific (Fig. 2D). Westerly wind anomalies in AMIP-ZMare considerably weaker (<0.2 m/s, P < 0.4 at 800 hPA) thanAMIP and show a wider ensemble spread because of the weakermagnitude of the specified SST gradients (SI Appendix, Fig. S10). Forthis reason, it is not surprising that AMIP-ZM shows insignificant
Fig. 3. Comparison of SC regression coefficients (percentage changes) ofglobal-mean precipitation (circles) and WVC (squares) against the respectiveglobal-mean surface temperature change. Units in percent and K per 1-W/m2
increase in TSI, respectively. Open circles and squares mark individual en-semble members of the SOLAR, AMIP, and AMIP-ZM simulations. All signalsrefer to +1-y time lag. Gray lines indicate sensitivities to SC inferred in theCMIP5 20th century simulations (18).
Misios et al. PNAS | April 9, 2019 | vol. 116 | no. 15 | 7189
EART
H,A
TMOSP
HER
IC,
ANDPL
ANET
ARY
SCIENCE
S
Dow
nloa
ded
by g
uest
on
Nov
embe
r 30
, 202
1

ΔSLP anomalies (Fig. 1J and SI Appendix, Figs. S2 and S5). How-ever, we detect a significant (P < 0.1) increase in precipitation which,like the circulation anomalies, is confined to the West Pacific.Comparison of the AMIP versus AMIP-ZM simulations sug-
gests that while the general response pattern may be determinedby the zonal-mean warming, the amplitude of the surface pre-cipitation and wind response as well as the extent of the eastwardshift of the PWC, are probably associated with the longitudinal SSTresponse pattern. It is therefore of interest to explore the cause ofthis SST warming pattern and how it further weakens the PWC.
Amplification by the Bjerknes FeedbackIt is not well understood why the Pacific warms preferentially inresponse to increased TSI (Fig. 1C). Previous studies have noted anENSO-like pattern and suggested a dynamically excited mechanisminvolving a damped-resonant ENSO response triggered by direct TSIsurface heating (9). However, the weak westerly anomalies found inAMIP-ZM suggest an alternative mechanism and here we proposethat a Bjerknes feedback further weakens the PWC at Smax.We investigate this hypothesis in a conceptual framework us-
ing a low-order atmosphere–ocean model of the Pacific that hasbeen extensively used to study ENSO dynamics (26). The modelsolves for SST and thermocline depth anomalies in two boxes,representing the east and west equatorial Pacific, by taking intoaccount the Bjerknes feedback that drives wind stress anomalies,which in turn cause equatorial upwelling in the eastern Pacificand zonal advection (SI Appendix). Effects of the SC are in-troduced as an 11-y sinusoidal modulation of the wind stress of1% amplitude, roughly corresponding to the 10% reduction insurface easterlies simulated in AMIP-ZM. The model shows thatthe imposed westerly anomaly reduces the thermocline tilt be-tween the West and East Pacific at Smax, resulting in eastwardadvection of anomalously warm water and positive SST anom-alies in the East Pacific (SI Appendix, Fig. S11). The west–eastSST gradient is thus weakened and hence the Bjerknes feedbackreinforces the imposed westerly anomalies. The transition fromSmax to Smin weakens and eventually reverses the wind anom-alies to easterlies at Smin.Results of this low-order ENSO model can only frame a the-
oretical background for understanding the observed PWCweakening given that the simulated response amplitude dependson the assumed coupling parameters. Nevertheless, the low-order model predicts a weakening of the equatorial Pacificthermocline tilt at Smax, and thus a lifted thermocline in thewestern Pacific that brings cold water to the subsurface. We findfurther evidence that the two-box model can be considered as acredible analog of the observed SC response by examiningequatorial subsurface ocean temperature responses in the EN4objective analysis for the period 1950–2013 (Fig. 4, Materials andMethods). MLR identifies negative temperature anomalies, in-dicating a shallower thermocline in the western Pacific at +1 ylag (−0.5 K per 1 W/m2 TSI at 130 m, P < 0.3) and significantpositive anomalies indicating a deeper thermocline in the easternPacific (>1 K, P < 0.05; 120°–160°W at 130-m depth). This meansa reduced thermocline tilt at Smax as suggested by the low-ordermodel. This observational evidence is supported by the SOLARensemble, which simulates cold water in the western Pacific sub-surface, but does not show a stronger warming in the subsurfaceover the central and eastern sector (Fig. 4). This negligible changein the eastern Pacific thermocline likely explains the generallyweaker SST warming in the equatorial Pacific at Smax (Fig. 1I).The low-order model thus highlights the potential for a
Bjerknes amplification of the weak westerly wind anomaliesinitially generated by the SC influence on global hydrology. Inaddition, the relaxation of the trade winds at Smax is likely toweaken evaporative cooling, which further weakens the surfacewinds. This wind–evaporation–SST feedback (27), not accountedfor in the low-order model, could provide a source of additionalwarming in the West Pacific, as indicated by the pattern of PacificSST anomalies in the Kaplan dataset and the SOLAR ensemble(Fig. 1 C and I).
Summary and DiscussionStudies of the response to centennial increases in TSI havesuggested a contrasting response, with reduced rainfall in thePacific and stronger east–west SST gradients (28). However, thisresponse is not supported by a recent multimodel comparison ofthe tropical impacts of a step-change doubling of CO2 concen-tration versus a 2% increase in TSI (29). In those simulations,both forcings produced strikingly similar patterns of increasedprecipitation over the central Pacific and a relaxed east–westSST gradient, despite the fact that TSI predominately affects thesurface, whereas GHGs perturb the radiative balance of the tro-posphere. In fact, the globally averaged precipitation is expectedto increase at higher rates for the same surface warming under TSIthan GHG forcing (24). Likewise, we find no evidence for di-vergent patterns in the Pacific response given that the detectedpatterns of increased rainfall, relaxed SST gradient, positive ΔSLPanomalies, and a weakened PWC in response to SC resemblemodeled responses to 2% TSI and doubling CO2, despite subtledifferences in the timescale and the magnitude of the forcing (2%TSI roughly corresponds to 20× the SC amplitude).By highlighting the importance of global hydrology in medi-
ating SC responses in the tropical Pacific, our findings addconfidence in the modeled predictions for a weakened PWC,driven by similar hydrological changes in response to GHGforcing. We are not suggesting, however, that observed SC sig-natures can be used as an analog for quantifying future PWCresponses to GHGs. This is because we identify ΔSLP changes ofabout 300 Pa/K (24–28 Pa per 1 W/m2 TSI associated with about0.08 K per 1 W/m2) between solar maximum and minimum,which are considerably larger than the observed century-longΔSLP trends (50–100 Pa/K scaled to the global-mean SSTwarming) (4, 5). Reasons for reduced sensitivity in the case ofGHG forcing are likely to be found in the pattern of SST re-sponse in the Pacific, which is ill constrained in observations and/orcancellation from opposing mechanisms that may not be aseffective on the 11-y SC timescale. For example, a long-termadjustment of the thermocline to GHG forcing has been foundto reduce the effectiveness of the Bjerknes feedback (30), whileour analysis, instead, highlights the importance of this feedbackin reinforcing wind and SST anomalies and ultimately the PWCreduction. In summary, we propose a bottom-up pathway bywhich the SC influence in global hydrology induces weak west-erly surface wind anomalies which are then amplified by theBjerknes ocean–atmosphere feedback (and possibly also a wind–evaporation–SST feedback), leading to the further reduction andeastward shift of the PWC, positive SSTs, and more rainfall inthe equatorial Pacific. This study suggests that SC forcing is anappreciable source of decadal variability in the Indo-Pacific andfurther studies are required to assess the potential to improvedecadal predictability in this region.
A B
Fig. 4. SC regression coefficients of ocean temperature in the equatorialPacific for (A) EN4.2.0 (1950–2013) and (B) SOLAR. Hatched areas indicatechance probability P < 0.1. Units in K per 1-W/m2 increase in TSI. Signals referto +1-y time lag.
7190 | www.pnas.org/cgi/doi/10.1073/pnas.1815060116 Misios et al.
Dow
nloa
ded
by g
uest
on
Nov
embe
r 30
, 202
1

Materials and MethodsObservations and Reanalyses. Gridded annual mean time series of SLP aretaken from the HadSLP2r (1900–2013) global historical reconstruction (31);sea surface winds at 10 m over the period 1950–2011 are taken from theWASWind composite (32). Global precipitation is taken from the GPCC v.7(1950–2013) (33) and the GPCP v.2.3 Combined Precipitation Dataset (1979–2013) (34). We use the Kaplan SST (1950–2013) dataset (35) and oceansubsurface temperatures (1950–2013) are taken from Met Office HadleyCentre EN Version 4.2.0 objective analysis (36). We additionally make use ofannual time series of AMIP, SLP, WVC, total precipitation, and zonal windsfrom three atmospheric reanalyses: (i) the NOAA-CIRES 20th century re-analysis (1950–2011, Version 2c), (ii) the ECMWF ERA-20C reanalysis (1950–2010), and (iii) NCEP/NCAR (1950–2013).
Model Simulations. We carry out model simulations with the middle atmo-sphere version of ECHAM5, as implemented in the Modular Earth SubmodelSystem (MESSy) framework (37), with and without interactive ocean cou-pling. An ensemble of six runs (AMIP) from 1940 to 2013 (10-y spin-up) withthe atmosphere-only configuration of the model (AGCM) forced only at thelower boundary by the monthly mean AMIP2 SST and sea ice concentrations.All AMIP integrations have been carried out with constant solar irradiance andpresent-day GHGs, while neglecting volcanic aerosol forcing. Individual modelruns branch off from a long control model simulation with climatologicalboundary. A twin AGCM ensemble of six members (AMIP-ZM) forced at thebottom boundary by zonally averaged AMIP2 SSTs is additionally carried outto isolate the zonally symmetric part of the SST contribution. The AMIP-ZMSSTs is constructed by adding to the monthly climatology (1950–2013) desea-sonalized zonal mean SST anomalies. A third ensemble (SOLAR) of four real-izations with ECHAM5 interactively coupled to the Max Planck Institute oceanmodel (MPIOM) is simulated to analyze surface responses to the SC variabilityspecified following the ideal approach of repeating the SC22 (September 1986to August 1996) 10 times (SI Appendix, Fig. S12). Total and spectral irradiancesfor the SC 22 are taken by the Naval Research Laboratory SSI model v1. Ozoneis prescribed as a time-independent climatology, and no other external forcingis considered. SOLAR runs have been initiated from a long control coupledatmosphere–ocean simulation with constant forcings. The analysis covers 100
model years following a spin-up period of 25 y (125 y in total). ECHAM5 has aspectral dynamical core with a triangular truncation at wavenumber 42 (T42)and with 47 levels in the vertical up to 0.01 hPa. The MPIOM model is con-figured in a GR15 grid (∼1.5° horizontal resolution) with 40 depth levels.
MLR Model. We regress lagged solar cycle signals out of annual time serieswith an MLR model that isolates the linear contribution of four forcings (18),namely (i) 11-y solar cycle described by TSI variations filtered out of multi-decadal changes, (ii) GHG warming described by the CO2 equivalent con-centration of all major GHGs, (iii) major volcanic eruptions described by theaerosol optical depth at 550 nm, and (iv) interannual effects of the ENSOphenomenon described by a high-pass filtered (using a Lanczos filter with8-y cutoff) Niño-3.4 index to account for the ENSO preferred timescale. Timelags in SC signals are inferred by lagging the solar predictor backward/for-ward in time (−5 to 5 y, step 1 y) with respect to the fitted variable. Lag zerodescribes changes in phase with SC, whereas delayed signals are indicated inpositive lags. The SC regression coefficients are scaled to a 1-W m−2 increaseof TSI that is “typical” for solar cycles in the last 50 y (e.g., solar cycle 22).Residuals are tested for autocorrelation with a Durbin–Watson test postu-lating zero autocorrelation and when rejected, regression coefficients andSEs are modified following the Cochrane–Orcutt iterative method. The nullhypothesis of zero regression coefficients is rejected with P value < 0.1 usinga two-tailed t test with degrees of freedom N-K-1, where N is the length oftime series reduced by the K number of regressors plus the intercept. The Pvalues have been adjusted for the false detection rate following the Benjamini–Hochberg procedure. Finally, the Ljung–Box test identifies insignificant corre-lations at higher lags in the areas of interest.
ACKNOWLEDGMENTS. We thank Dr. Fenwick Cooper for advice on statis-tical methods. We also thank three anonymous reviewers and the editorialteam for constructive comments on the manuscript. All model simulationspresented in this work were supported by the DeiC National HPC Center,University of Southern Denmark (SDU). The research was supported by theUK Natural Environment Research Council (NERC) through Grant NE/N010965/1 and the NERC National Centre for Atmospheric Science. M.F.K. and C.K. aregrateful for financial support from Villum Foundation Grants VKR023114 andVKR010116.
1. Wang C, Deser C, Yu J-Y, DiNezio P, Clement A (2017) El Niño and Southern Oscillation(ENSO): A review. Coral Reefs of the Eastern Tropical Pacific (Springer, Berlin).
2. Held IM, Soden BJ (2006) Robust responses of the hydrological cycle to globalwarming. J Clim 19:5686–5699.
3. DiNezio PN, Vecchi GA, Clement AC (2013) Detectability of changes in the walkercirculation in response to global warming. J Clim 26:4038–4048.
4. Tokinaga H, Xie S-P, Deser C, Kosaka Y, Okumura YM (2012) Slowdown of the walkercirculation driven by tropical Indo-Pacific warming. Nature 491:439–443.
5. Vecchi GA, et al. (2006) Weakening of tropical Pacific atmospheric circulation due toanthropogenic forcing. Nature 441:73–76.
6. England MH, et al. (2014) Recent intensification of wind-driven circulation in thePacific and the ongoing warming hiatus. Nat Clim Chang 4:222–227.
7. Gray L, et al. (2010) Solar influences on climate. Rev Geophys 48:RG4001.8. Meehl GA, Arblaster JM, Matthes K, Sassi F, van Loon H (2009) Amplifying the Pacific
climate system response to a small 11-year solar cycle forcing. Science 325:1114–1118.9. White W, Liu Z (2008) Resonant excitation of the quasi-decadal oscillation by the 11-
year signal in the Sun’s irradiance. J Geophys Res Oceans 113:C01002.10. Meehl GA, Arblaster JM, Branstator G, van Loon H (2008) A coupled air-sea response
mechanism to solar forcing in the Pacific region. J Clim 21:2883–2897.11. van Loon H, Meehl GA, Shea DJ (2007) Coupled air-sea response to solar forcing in the
Pacific region during northern winter. J Geophys Res Atmos 112:D02108.12. van Loon H, Meehl GA (2008) The response in the Pacific to the sun’s decadal peaks
and contrasts to cold events in the Southern Oscillation. J Atmos Sol Terr Phys 70:1046–1055.
13. Roy I, Haigh JD (2010) Solar cycle signals in sea level pressure and sea surface tem-perature. Atmos Chem Phys 10:3147–3153.
14. Tung KK, Zhou JS (2010) The Pacific’s response to surface heating in 130 yr of SST:La Niña-like or El Niño-like? J Atmos Sci 67:2649–2657.
15. White W, Lean J, Cayan DR, Dettinger MD (1997) Response of global upper oceantemperature to changing solar irradiance. J Geophys Res Oceans 102:3255–3266.
16. Shindell DT, et al. (2006) Solar and anthropogenic forcing of tropical hydrology.Geophys Res Lett 33:L24706.
17. Misios S, Schmidt H (2012) Mechanisms involved in the amplification of the 11-yr solarcycle signal in the Tropical Pacific Ocean. J Clim 25:5102–5118.
18. Misios S, et al. (2016) Solar signals in CMIP-5 simulations: Effects of atmosphere-oceancoupling. Q J Roy Meteorol Soc 142:928–941.
19. Ghil M, et al. (2002) Advanced spectral methods for climatic time series. Rev Geophys40:1003.
20. Gray L, et al. (2013) A lagged response to the 11 year solar cycle in observed winterAtlantic/European weather patterns. J Geophys Res Atmos 118:13405–13420.
21. Mantua NJ, Hare SR, Zhang Y, Wallace JM, Francis RC (1997) A Pacific interdecadalclimate oscillation with impacts on salmon production. Bull Am Meteorol Soc 78:1069–1079.
22. Bellenger H, Guilyardi E, Leloup J, Lengaigne M, Vialard J (2014) ENSO representationin climate models: From CMIP3 to CMIP5. Clim Dyn 42:1999–2018.
23. Liepert BG, Previdi M (2009) Do models and observations disagree on the rainfallresponse to global warming? J Clim 22:3156–3166.
24. Andrews T, Forster PM, Boucher O, Bellouin N, Jones A (2010) Precipitation, radiativeforcing and global temperature change. Geophys Res Lett 37:L14701.
25. He J, Soden BJ (2015) Anthropogenic weakening of the tropical circulation: The rel-ative roles of direct CO2 forcing and sea surface temperature change. J Clim 28:8728–8742.
26. Jin FF (1997) An equatorial ocean recharge paradigm for ENSO. 1. Conceptual model.J Atmos Sci 54:811–829.
27. Xie S-P, Philander SGH (1994) A coupled ocean-atmosphere model of relevance to theITCZ in the eastern Pacific. Tellus A Dyn Meterol Oceanogr 46:340–350.
28. Liu J, Wang B, Cane MA, Yim S-Y, Lee J-Y (2013) Divergent global precipitationchanges induced by natural versus anthropogenic forcing. Nature 493:656–659.
29. Samset BH, et al. (2018) Weak hydrological sensitivity to temperature change overland, independent of climate forcing. npj Clim Atmos Sci 1:20173.
30. DiNezio PN, Clement AC, Vecchi GA (2010) Reconciling differing views of tropicalPacific climate change. Eos 91:141–142.
31. Allan R, Ansell T (2006) A new globally complete monthly historical gridded mean sealevel pressure dataset (HadSLP2): 1850-2004. J Clim 19:5816–5842.
32. Tokinaga H, Xie S-P (2010) Wave- and anemometer-based sea surface wind (WASWind)for climate change analysis. J Clim 24:267–285.
33. Schneider U, et al. (2015) GPCC full data reanalysis version 6.0 at 1.0°: Monthly land-surface precipitation from rain-gauges built on GTS-based and historic data, edGlobal Precipitation Climatology Centre, Deutscher Wetterdienst (GPCC hgddaDW,Germany).
34. Adler RF, et al. (2003) The version-2 global precipitation climatology project (GPCP)monthly precipitation analysis (1979-present). J Hydrometeorol 4:1147–1167.
35. Kaplan A, et al. (1998) Analyses of global sea surface temperature 1856-1991.J Geophys Res Oceans 103:18567–18589.
36. Good SA, Martin MJ, Rayner NA (2013) EN4: Quality controlled ocean temperatureand salinity profiles and monthly objective analyses with uncertainty estimates.J Geophys Res Oceans 118:6704–6716.
37. Jöckel P, et al. (2015) Earth system chemistry integrated modelling (ESCiMo) with themodular Earth submodel system (MESSy, version 2.51). Geosci Model Dev Discuss 8:8635–8750.
Misios et al. PNAS | April 9, 2019 | vol. 116 | no. 15 | 7191
EART
H,A
TMOSP
HER
IC,
ANDPL
ANET
ARY
SCIENCE
S
Dow
nloa
ded
by g
uest
on
Nov
embe
r 30
, 202
1