slow growth for the french economy in 2014 - insee.fr fileslow growth for the french economy in 2014...
TRANSCRIPT

Slow growth for the French economy in 2014
Vincent Biausque, Sylvain Larrieu, Camille Sutter*
Despite the rebound in purchasing power due to disinflation, the French economy grewslowly in 2014: GDP progressed by just 0.2% in volume after +0.7% in 2013.
Domestic demand excluding inventory accounted for +0.5 points of growth by volume inGDP, like in 2013 (figure 1). Household consumption accelerated slightly (+0.6% in volumeafter +0.4% in 2013), in the wake of the strong rebound in purchasing power (+1.1% after-0.1% in 2013), part of which was reflected in a rise in savings of 0.4 points, to 15.1% onaverage over the year. In nominal terms, household income gained momentum (+1.1% after+0.7% in 2013), while consumer prices again slowed down considerably (0.0% after +0.8%in 2013). Domestic demand remained stable due to the momentum of general governmentconsumption expenditure (+1.6% in volume, like in 2013), whereas its investment declinedsharply (-6.9% after +0.1% in 2013). The volume of investment among non-financial enter-prises picked up (+2.0% after +0.5% in 2013), whereas household investment, primarily inhousing, fell back for the third consecutive year (-5.3% in 2014). All in all, investment in allsectors declined in 2014 (-1.2% in volume) more sharply than in 2013 (-0.6%).
In 2014 exports gained momentum, with volume growth reaching +2.4% after +1.7%. Butimports accelerated even more vigorously (+3.8% in volume, after +1.7% in 2013), aphenomenon that is only very partially explained by the dynamics of the components ofdemand, in which import content is high (household consumption, corporate investment,
Over all view - Slow growth for the French economy in 2014 1
* Vincent Biausque, Sylvain Larrieu, Camille Sutter, Insee
-4
-3
-2
-1
0
1
2
3
2007 2008 2009 2010 2011 2012 2013 2014
Private investment
Foreign trade
Change in inventories
Household consumption
Public-sector demand
1
growth in %, contributions in points
GDP
GDP
1. Contribution of the main aggregates to GDP growth
1. Including Non profit institutions serving households.
Field: France.
Source: Insee, national accounts, base 2010.
exports). All in all, the contribution of foreign trade to GDP growth became negative (-0.5points after 0.0 points).
Finally, corporate inventory behaviour again contributed positively to GDP growth in2014 (+0.2 points, like in 2013).
Per branch, volume growth in value added was driven by the activity of market services(+0.5% after +0.7%), non-market services (+1.0% after +1.2%) and agriculture (+8.5% after-1.9%). The energy-water-waste branch fell back sharply, to -2.1% after +2.2% in 2013, due toa mild winter and autumn. Construction fell back sharply (-3.6%), after near stabilisation in2013 (0.1%). Activity in manufacturing industry also fell back (-0.7% after +0.6%).
Non-agricultural market-sector payroll employment decreased slightly (-0.2%), under theeffect of the slow pace of growth in activity. However, thanks to net job creation in thenon-market branches, particularly in subsidised contracts (with an increase in emploisd’avenir, “jobs of the future”), total employment increased on average over the year (+0.3%)and the unemployment rate decreased slightly as an annual average (10.2% after 10.3%).
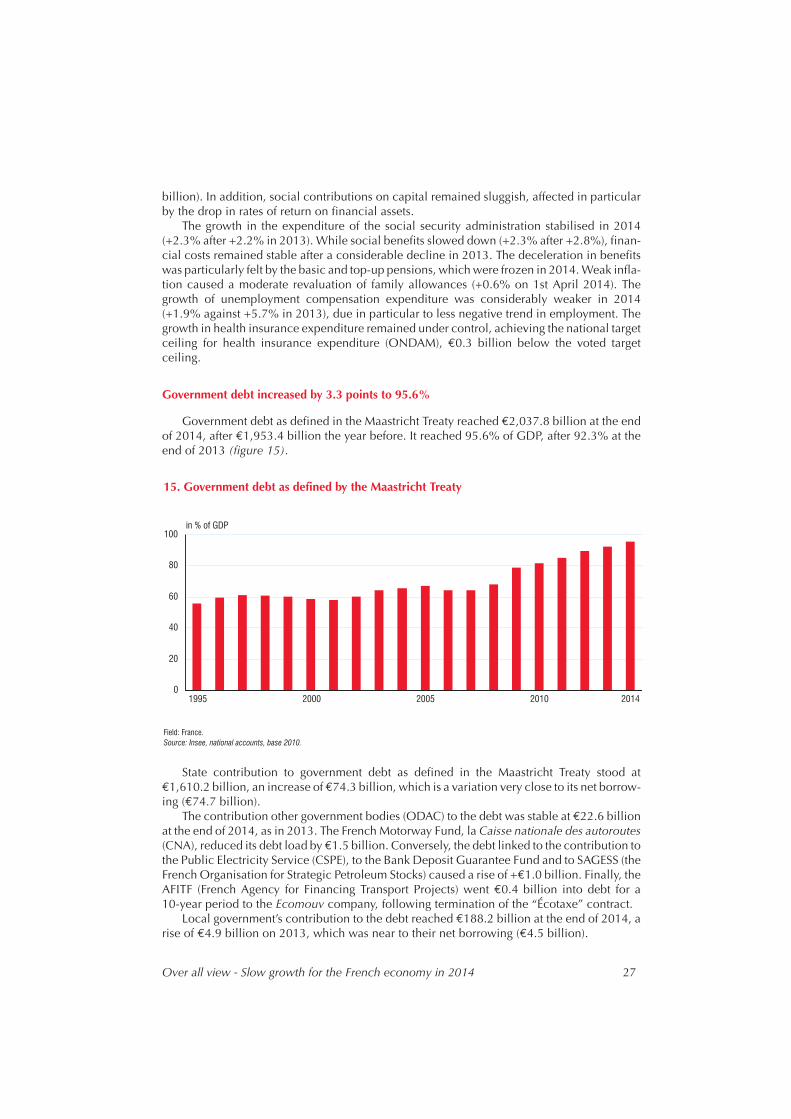
In 2014, government debt as defined in the Maastricht Treaty amounted to 4.0% of GDP,after 4.1% in 2013. Taxes and social contributions as a percentage of GDP increased from44.7% to 44.9% in 2014 (of which +0.1 point is attributed to new measures), rising slightlymore rapidly than expenditure calculated excluding tax credits. Government debt as definedin the Maastricht Treaty reached 95.6% of GDP at the end of the year, after 92.3% at the end of2013.
Activity continued to grow slowly
Manufacturing output picked up
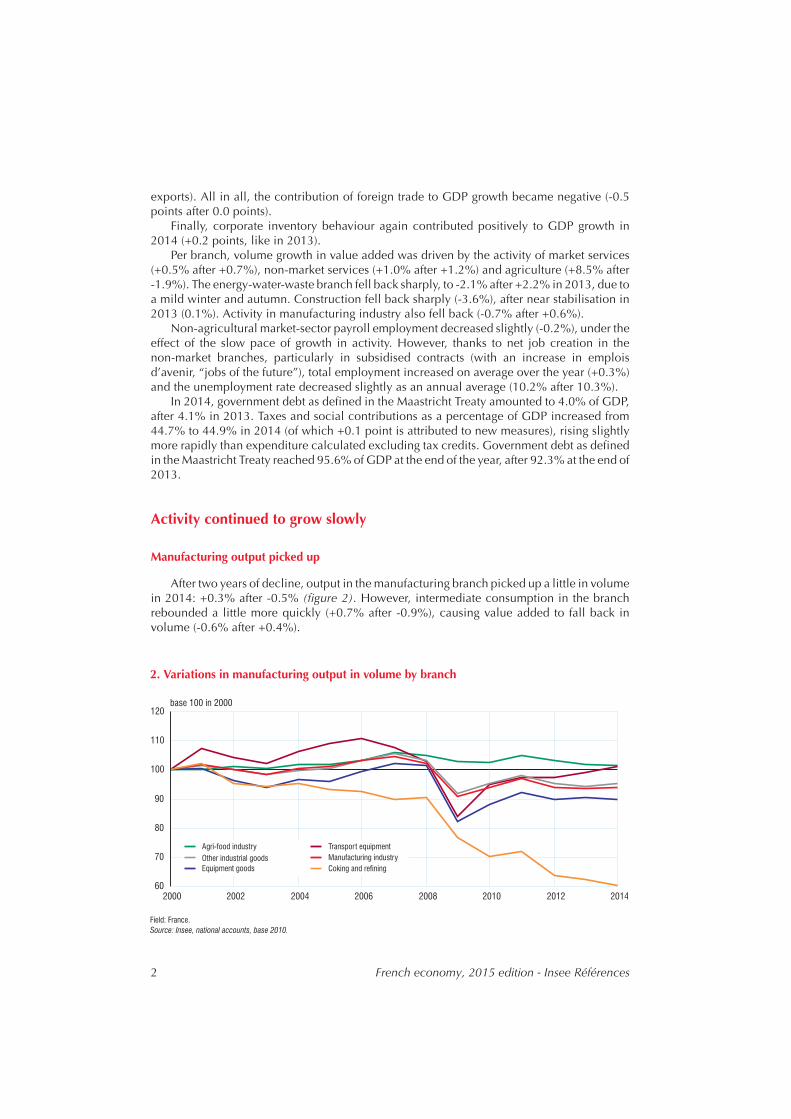
After two years of decline, output in the manufacturing branch picked up a little in volumein 2014: +0.3% after -0.5% (figure 2). However, intermediate consumption in the branchrebounded a little more quickly (+0.7% after -0.9%), causing value added to fall back involume (-0.6% after +0.4%).
2 French economy, 2015 edition - Insee Références
60
70
80
90
100
110
120
2000 2002 2004 2006 2008 2010 2012 2014
base 100 in 2000
Agri-food industry Transport equipment
Other industrial goodsManufacturing industry
Equipment goods Coking and refining
2. Variations in manufacturing output in volume by branch
Field: France.
Source: Insee, national accounts, base 2010.

Various demand components contributed positively to the upturn in output volume.Although it had decreased in 2012 (-1.4%), and again in 2013 (-0.8%), consumption ofmanufactured goods bounced back in 2014 (+0.6%). Exports of manufactured goods alsoremained dynamic (+1.8% after +1.3%) and investment in manufactured goods picked up(+1.1% after -1.5%).
In the manufacturing branch, coking and refining production declined for the thirdconsecutive year (-2.8% after -2.2% in 2013), as did agri-food production (-0.5% after -1.4%).Production of capital goods fell back (-0.8% after +0.7%). However, the branches thatproduce transport equipment (+2.1%) and “other manufactured goods” (+0.9%) weredynamic in 2014.
The drop in the production of energy, water and waste in 2014 (-3.5% after +0.7%) was theresult of a sharp decline in final consumption (-8.7% after +2.1%) due to particularly mildtemperatures at the beginning of 2014, and again at the end of the year.
Activity in construction continued to decrease
In the construction sector, activity decreased: -3.6% after +0.1% in 2013 (box 1). Invest-ment in construction fell back 3.4%, due to the fall in households’ investment in housing(-6.1%) and that of general government in the construction of buildings and civil engineering(-7.7%); however, corporate investment in construction continued to increase: +3.0% after+1.2%.
Production of market services accelerated slightly
Production of market services accelerated, increasing by 1.2% in 2014, after +0.6%. In2014, this branch contributed to growth in activity by +0.3 points (figure 3).
Activity in services benefited from the intermediate demand, which accelerated in 2014 to+2.0% after +0.5%. In addition, investment in services rebounded, at +0.6% after -0.1%.
Over all view - Slow growth for the French economy in 2014 3
-2.5
-2.0
-1.5
-1.0
-0.5
0.0
0.5
1.0
1.5
2,0
2008 2009 2010 2011 2012 2013 2014
in points
Agriculture, forestry and fisheries
Manufacturing industry, extraction, other industry
Construction
Mainly market services
Mainly non-market services
3. Contribution of primary branches to the growth in volume of total value added
Field: France.
Source: Insee, national accounts, base 2010.
4 French economy, 2015 edition - Insee Références
Box 1
Fall in housing construction in 2014Julie Goussen*
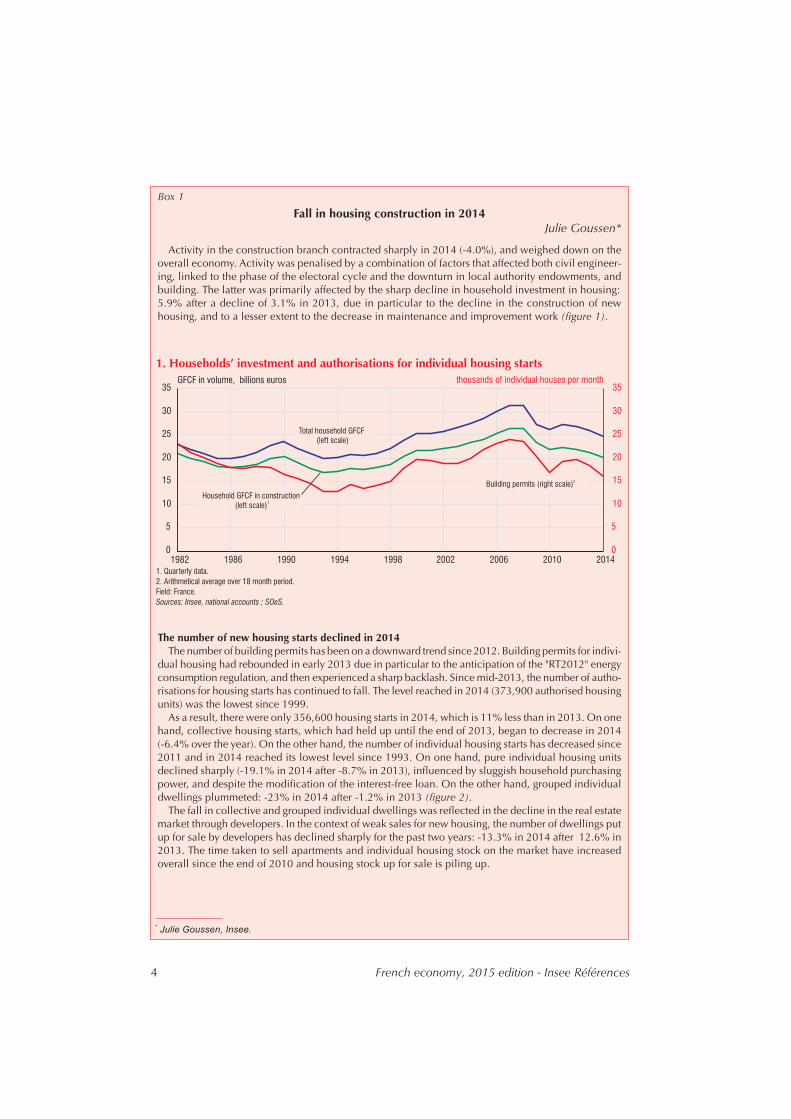
Activity in the construction branch contracted sharply in 2014 (-4.0%), and weighed down on theoverall economy. Activity was penalised by a combination of factors that affected both civil engineer-ing, linked to the phase of the electoral cycle and the downturn in local authority endowments, andbuilding. The latter was primarily affected by the sharp decline in household investment in housing:5.9% after a decline of 3.1% in 2013, due in particular to the decline in the construction of newhousing, and to a lesser extent to the decrease in maintenance and improvement work (figure 1).
The number of new housing starts declined in 2014The number of building permits has been on a downward trend since 2012. Building permits for indivi-
dual housing had rebounded in early 2013 due in particular to the anticipation of the "RT2012" energyconsumption regulation, and then experienced a sharp backlash. Since mid-2013, the number of autho-risations for housing starts has continued to fall. The level reached in 2014 (373,900 authorised housingunits) was the lowest since 1999.
As a result, there were only 356,600 housing starts in 2014, which is 11% less than in 2013. On onehand, collective housing starts, which had held up until the end of 2013, began to decrease in 2014(-6.4% over the year). On the other hand, the number of individual housing starts has decreased since2011 and in 2014 reached its lowest level since 1993. On one hand, pure individual housing unitsdeclined sharply (-19.1% in 2014 after -8.7% in 2013), influenced by sluggish household purchasingpower, and despite the modification of the interest-free loan. On the other hand, grouped individualdwellings plummeted: -23% in 2014 after -1.2% in 2013 (figure 2).
The fall in collective and grouped individual dwellings was reflected in the decline in the real estatemarket through developers. In the context of weak sales for new housing, the number of dwellings putup for sale by developers has declined sharply for the past two years: -13.3% in 2014 after 12.6% in2013. The time taken to sell apartments and individual housing stock on the market have increasedoverall since the end of 2010 and housing stock up for sale is piling up.
*
Julie Goussen, Insee.
0
5
10
15
20
25
30
35
1982 1986 1990 1994 1998 2002 2006 2010 2014
0
5
10
15
20
25
30
35
thousands of individual houses per monthGFCF in volume, billions euros
Household GFCF in construction
(left scale)
1
Total household GFCF
(left scale)
Building permits (right scale)
2
1. Households’ investment and authorisations for individual housing starts
1. Quarterly data.
2. Arithmetical average over 18 month period.
Field: France.
Sources: Insee, national accounts ; SOeS.

Over all view - Slow growth for the French economy in 2014 5
Box 1 (cont'd)
This sluggishness was in part the result of the fall in investment in accommodation for rental, probablydue to the lagging momentum of incentive schemes, which were less and less attractive until the Pinelscheme took effect in the summer of 2014. This scheme offers the possibility of renting to an ascendant ordescendant under certain conditions, to rent over six, nine or twelve years with a tax reduction on invest-ment, and to put a dwelling on the market at a slightly higher price, due to revised zoning.
Building sector professionals are reporting a deterioration in the short-term outlookIn line with the decrease in household investment, business leaders in the building sector are repor-
ting a deterioration in the short-term outlook of the sector. The indicator that summarises the businessclimate in the building sector has been on a downward trend since mid-2011 and below its long-termaverage (100) since 2012. In 2013, it levelled out, fluctuating around 93. It deteriorated sharply inmid-2014, reaching its lowest level since 1997.
An increasing number of business leaders in the building sector are reporting a decline in activityand fewer orders than usual. They report underutilised production capabilities. At the end of 2014, theproduction capacity utilisation rate continued to decline: it is over 10% below the level it was at before2008. This affects payroll employment in the sector, which has shown a downward trend since 2008(figure 3).
0
100
200
300
400
500
2000 2002 2004 2006 2008 2010 2012 2014
in thousands of houses
Total of dwellings
Purely individual dwellings
Collective dwellings
Grouped individual dwellings
2. Housing starts (over the 12 month period)
Field: France.
Note: total over 12 month period.
Source: SOeS.
80
90
100
110
120
130
2000 2002 2004 2006 2008 2010 2012 2014
standardised, average 100 and standard deviation 10
-60
-30
0
30
60
90
in thousand of salaried jobs
Synthetical business climate indicator (left scale)
Year-on-year change of salaried employment in construction (right scale)
1
3. Business climate and employment in construction
1. CVS data.
Field: metropolitan France.
Source: Insee, construction conjoncture survey, salaried employment estimations.
By branch, activity fell back more sharply than in 2013 in accommodation-catering:-2.5% in 2014 after -0.7% in 2013. Activity slowed down in the trade branch (+0.5% after+1.8%), but it remained dynamic in the information and communication branches (+1.2%after +1.1%) and in real estate services (+1.0% after +1.3%). It accelerated in the corporateservices branch (+0.7% after +0.3%) and the transport branch (+1.0% after -0.8%). Finally, innon-market branches, activity slowed down very slightly (+1.0% after +1.2%).
Corporate investment accelerated
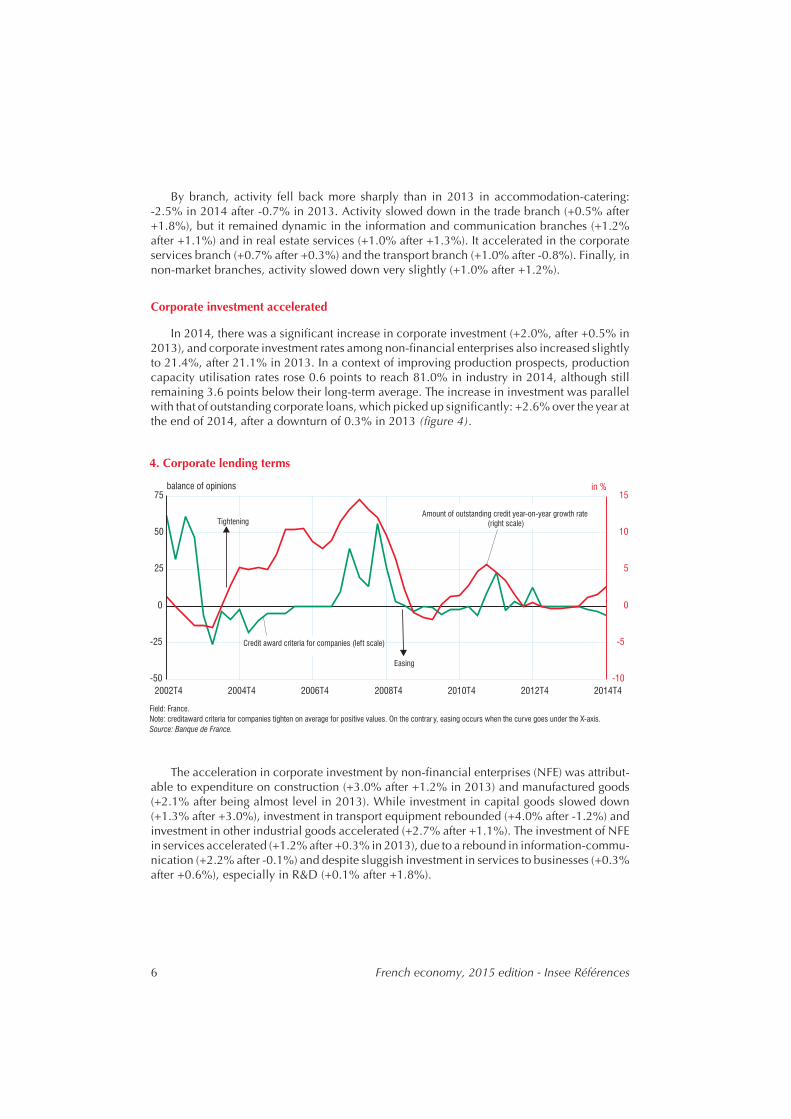
In 2014, there was a significant increase in corporate investment (+2.0%, after +0.5% in2013), and corporate investment rates among non-financial enterprises also increased slightlyto 21.4%, after 21.1% in 2013. In a context of improving production prospects, productioncapacity utilisation rates rose 0.6 points to reach 81.0% in industry in 2014, although stillremaining 3.6 points below their long-term average. The increase in investment was parallelwith that of outstanding corporate loans, which picked up significantly: +2.6% over the year atthe end of 2014, after a downturn of 0.3% in 2013 (figure 4).
The acceleration in corporate investment by non-financial enterprises (NFE) was attribut-able to expenditure on construction (+3.0% after +1.2% in 2013) and manufactured goods(+2.1% after being almost level in 2013). While investment in capital goods slowed down(+1.3% after +3.0%), investment in transport equipment rebounded (+4.0% after -1.2%) andinvestment in other industrial goods accelerated (+2.7% after +1.1%). The investment of NFEin services accelerated (+1.2% after +0.3% in 2013), due to a rebound in information-commu-nication (+2.2% after -0.1%) and despite sluggish investment in services to businesses (+0.3%after +0.6%), especially in R&D (+0.1% after +1.8%).
6 French economy, 2015 edition - Insee Références
-50
-25
0
25
50
75
2002T4 2004T4 2006T4 2008T4 2010T4 2012T4 2014T4
-10
-5
0
5
10
15
balance of opinionsin %
Credit award criteria for companies (left scale)
Amount of outstanding credit year-on-year growth rate
(right scale)
Tightening
Easing
4. Corporate lending terms
Field: France.
Note: creditaward criteria for companies tighten on average for positive values. On the contrar y, easing occurs when the curve goes under the X-axis.
Source: Banque de France.
Inventory change contributed positively to activity
In 2014 companies continued to rebuild their stocks. Inventory change therefore contrib-uted +0.2 points to growth in activity, as in 2013. All in all, in 2014 corporate demand viainvestment expenditure and inventory behaviour contributed +0.5 points to growth in GDP,after +0.2 points in 2013.
The margin rate decreased slightly
The financial situation of non-financial corporations deteriorated less in 2014 than the twopreceding years.
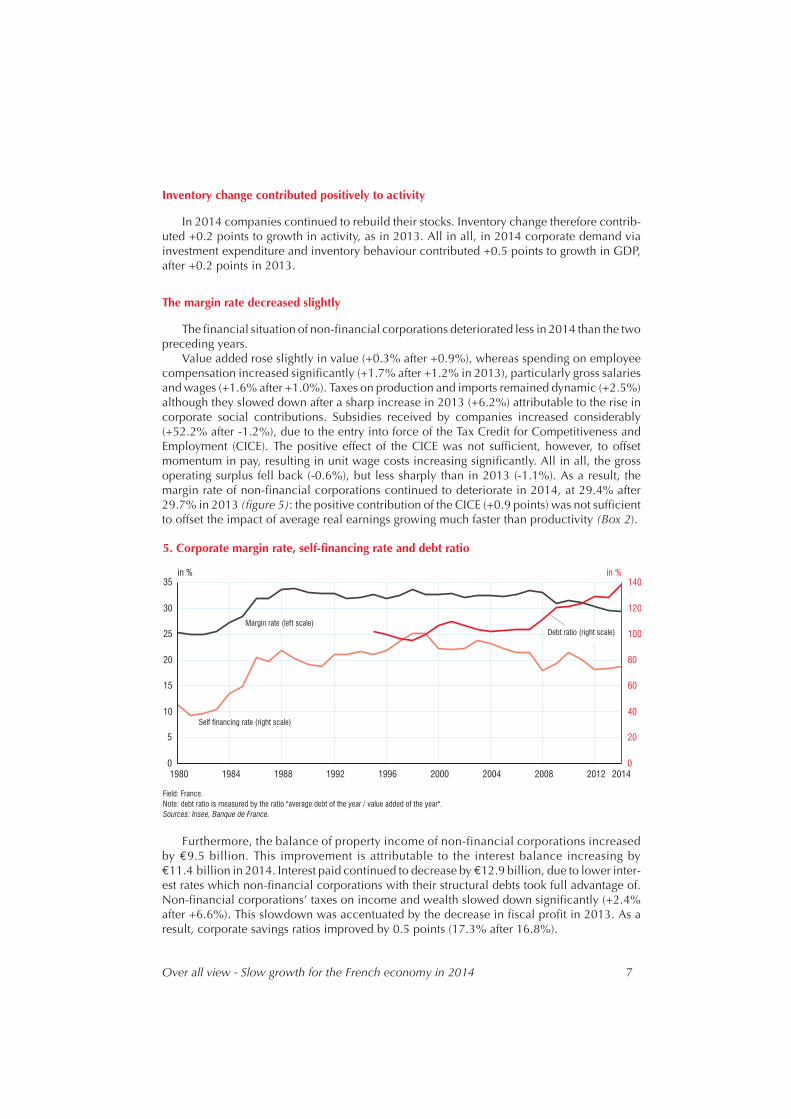
Value added rose slightly in value (+0.3% after +0.9%), whereas spending on employeecompensation increased significantly (+1.7% after +1.2% in 2013), particularly gross salariesand wages (+1.6% after +1.0%). Taxes on production and imports remained dynamic (+2.5%)although they slowed down after a sharp increase in 2013 (+6.2%) attributable to the rise incorporate social contributions. Subsidies received by companies increased considerably(+52.2% after -1.2%), due to the entry into force of the Tax Credit for Competitiveness andEmployment (CICE). The positive effect of the CICE was not sufficient, however, to offsetmomentum in pay, resulting in unit wage costs increasing significantly. All in all, the grossoperating surplus fell back (-0.6%), but less sharply than in 2013 (-1.1%). As a result, themargin rate of non-financial corporations continued to deteriorate in 2014, at 29.4% after29.7% in 2013 (figure 5): the positive contribution of the CICE (+0.9 points) was not sufficientto offset the impact of average real earnings growing much faster than productivity (Box 2).
Furthermore, the balance of property income of non-financial corporations increasedby €9.5 billion. This improvement is attributable to the interest balance increasing by€11.4 billion in 2014. Interest paid continued to decrease by €12.9 billion, due to lower inter-est rates which non-financial corporations with their structural debts took full advantage of.Non-financial corporations’ taxes on income and wealth slowed down significantly (+2.4%after +6.6%). This slowdown was accentuated by the decrease in fiscal profit in 2013. As aresult, corporate savings ratios improved by 0.5 points (17.3% after 16.8%).
Over all view - Slow growth for the French economy in 2014 7
0
5
10
15
20
25
30
35
1980 1984 1988 1992 1996 2000 2004 2008 2012
in %
0
20
40
60
80
100
120
140
in %
2014
Margin rate (left scale)
Self financing rate (right scale)
Debt ratio (right scale)
5. Corporate margin rate, self-financing rate and debt ratio
Field: France.
Note: debt ratio is measured by the ratio "average debt of the year / value added of the year".
Sources: Insee, Banque de France.
8 French economy, 2015 edition - Insee Références
Box 2
The accounting impact of the Tax Credit for Competitiveness and Employment (CICE) in 2014
Ronan Mahieu*
Since 1st January 2013, the wages paid bycompanies make them eligible for the Tax Creditfor Competitiveness and Employment, the CICE.The base of the CICE is composed of grosscompensation subject to social security contribu-tions paid out over the period of one calendaryear, with a limit of 2.5 times the legal minimumwage. The tax credit rate is 4% for wages paid in2013 (the first year of application), and 6% forwages paid the following years. The CICE is set offagainst amounts payable by companies for corpo-ration tax or personal income tax for companiesthat are not subject to corporation tax.
Generally, the CICE due for a given year is set offagainst the tax due for the same financial year.Therefore, the CICE calculated for wages paid in2013 must be set off against the tax due for the2013 financial year. If the CICE cannot be fullyused (because it exceeds the amount due forcorporation tax or personal income tax), it can beused to pay for the taxes due over the course of thenext two years. After three years, the company willbe reimbursed for the fraction that is notchargeable. As an exception, the immediate andfull reimbursement of the amount owed may berequested by certain types of companies (smalland medium enterprises, new companies, young,innovative companies, companies in difficulty).
Given these characteristics, the CICE due for theyear 2013 is recorded in the companies' accountsfor 2013, but does not begin to affect the compa-nies' liquid assets until the payment of the corpo-rate tax balance for 2013, which takes place in2014. In companies' accounts, it can appear as adeduction of personnel charges, but also as acorporation tax deduction.
The CICE is processed very differently for thenational accounts. In accordance with the provi-sions of the European System of Accounts (ESA2010) on tax credits, the CICE must be recorded asa public expense all at once, in the year that thecompany pursues its claim on the State. In thenational accounts, the CICE is therefore not recor-ded as a deduction, nor as wages or taxes paid, butrather as subsidies on employee compensation
(D.391). In addition, the CICE due for 2013 isrecorded all at once in 2014, even though theimpact of the CICE on budget revenue is spreadover several years.
This manner of recording the CICE thus createsa time lag in terms of the impact on the Statedeficit, depending on whether the budget imple-mentation balance or the national accountingdeficit communicated to the European Commis-sion is taken into account: the CICE due for the2013 financial year weighs entirely on the deficitreported for 2014, whereas the impact on thebudget implementation balance is spread out overseveral years, beginning in 2014. In nationalaccounting, the CICE increased subsidy expendi-ture and weighed down on the public deficit by€10.2 billion in 2014 (or 0.5 points of GDP),which corresponds to the amount of the recei-vable that companies declared to the tax depart-ment in 2014 for the 2013 financial year. Theimpact on tax revenues and the budget implemen-tation balance was less because it was limited toamounts charged against the corporate tax or thepersonal income tax paid in 2014, or directlyreimbursed to companies in 2014, amounting toapproximately €6 billion.
Since the CICE is recorded as a subsidy oncompensation (D.391) in national accounting,it has a neutral impact on companies' grossvalue added and the compensation they pay.However, it improves companies' gross opera-ting surplus (GOS) and margin rate. The impacton the margin rate of non-financial corpora-tions' in 2014 was estimated at approximately+0.9 points. However, the margin rate ofnon-financial corporations dropped 0.3 pointsbetween 2013 and 2014 to stand at 29.4%. Theaverage compensation paid by non-financialcorporations indeed continued to progress inreal terms in 2014 (in a context of very low infla-tion), whereas productivity gains were greatlyreduced and the contribution of terms of trade(which measure changes in the price of valueadded relative to those in consumer prices) wasvirtually non-existent.
* Ronan Mahieu, Insee.

Activity of financial corporations declined in 2014 against the backdropof a fall in rates
The decrease in the ECB base rate by 20 basis points in 2014 once again significantlyaffected the amounts of interest received and paid by banks. In 2014, interest received1 by thissector decreased by €7.6 billion, after -€24.9 billion in 2013 for a decline in ECB base interestrates of 50 basis points. Interest paid decreased by €5.8 billion, after -€17.1 billion in 2013.However, the vigour of the equity market allowed financial intermediaries to recover thebalance of their primary income, which increased by €1.7 billion in 2014, after falling from€43.5 billion in 2009 to €31.5 billion in 2013.
While it did not affect the balance of primary incomes of financial intermediaries, thecalculation of FISIM2 did however lead to the reintegration into banks’ value added of theproportion of interest margins assimilated to production. However, for a given level of rates onlending and deposit rates proposed to bank clients, a decrease in the refinancing rate leads to arise in the margin rate of banks on lending and a decrease in the margin on deposits. Inpractice, bank margins on lending increased by 17 basis points in 2014, whereas the marginon deposits decreased by 11 points; FISIM on credits thus increased by €5.1 billion in 2014,and FISIM on deposits decreased by €1.8 billion. FISIM therefore contributed to increasing thevalue added of financial intermediaries by €3.3 billion in 2014. For the third consecutive year,it is therefore FISIM production that contributed primarily to the rise in the value added offinancial intermediaries, which increased by €4.2 billion in 2014, after taking into account theproduction explicitly charged to clients of the institutions. In addition, the sector was markedby the BNP Paribas penalty payment to the United States: a transfer of €4.2 billion from Franceto the rest of the world thus adversely affected financial intermediaries’ financing capacitywhich amounted to €7.4 billion at the end of 2014, after €9.6 billion at the end of 2013.
Value added of insurers fell by €4.7 billion in 2014. Financial profit provisions of life insur-ance companies increased in 2014: the corresponding sums will only be paid out to
Over all view - Slow growth for the French economy in 2014 9
Box 2 (cont'd)The margin rate of non-financial corporations
would thus appear to have dropped spontaneous-ly without the impact of the CICE in 2014: theimplementation of the CICE only allowed partialcompensation of the negative effect that anincrease in compensation, faster than that of valueadded, had on the margin rate in 2014 (figure).
Finally, it should be noted that the CICE doesnot affect the unit labour cost indicators that arepublished, in particular, by the EuropeanCommission within the context of the macroeco-nomic imbalance procedure: unit labour costs arein fact calculated by comparing compensation invalue (D.1) to real GDP. Since the CICE is recordedas a subsidy on compensation (D.391), it does notaffect compensations paid, and therefore does notaffect the unit wage cost indicator. It is also notpossible to calculate a similar alternative unitwage cost indicator from one country to another
that takes subsidies on compensation intoaccount because, unlike France, most countriesdo not distinguish those subsidies that are basedon compensations among total productionsubsidies (D.39).
Margin rate 2013 (in %) 29,7
Impact of the changes in real compen-
sation per employee
-1,3
Impact of productivity gains per capita 0,1
Impact of terms of trade 0,1
Impact of the CICE 0,9
Other -0,1
Margin rate 2014 (in %) 29,4
Breakdown of changes in non-financialcorporation margin rates
in point
Source: Insee, national accounts, 2010 base.
1. Excluding FISIM adjustment.2. Financial intermediation services indirectly measured.
policyholders at a later date. This prudential policy, inspired in particular by the Banque deFrance and the ACPR,3 aims to anticipate the impact that the drop in sovereign bond yields willhave on money-market policy yields. As a consequence of this policy, heavy strain was put onthe production of life insurance services in 2014. At the same time, activity in non-life insur-ance stagnated. The drop in burglaries was partly offset by the rise in road-traffic injuries and inpayments for natural events.
Including the activity of financial auxiliaries, the value added of financial corporations stagnatedas compared to 2013, and the balance of primary income declined by 2.9% to €39.2 billion.
Total employment increased
Payroll employment in the non-agricultural market sector dropped slightly (-0.2%) due tothe weak pace of growth in activity. However, total employment increased (+0.3%), due to theincrease in non-market sector jobs (+1.2%), which were boosted by subsidised employment.The unemployment rate was virtually stable on average over the year (10.2% after 10.3%).
Market-sector payroll employment declined
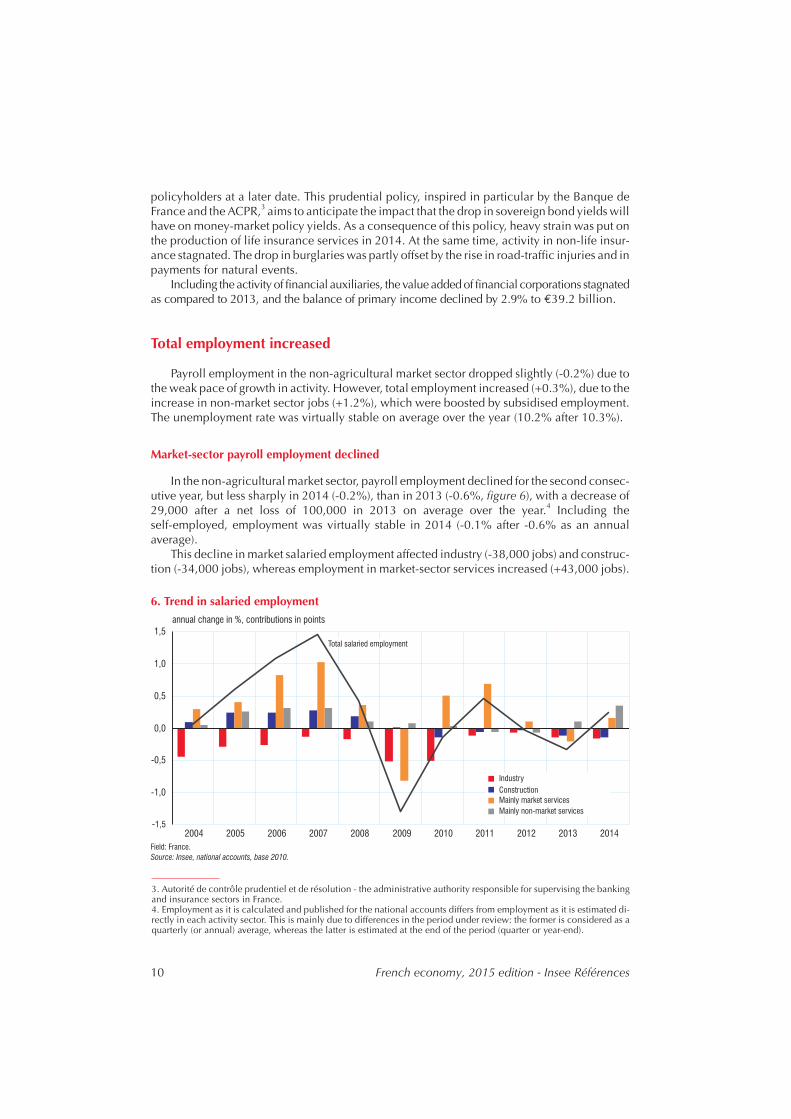
In the non-agricultural market sector, payroll employment declined for the second consec-utive year, but less sharply in 2014 (-0.2%), than in 2013 (-0.6%, figure 6), with a decrease of29,000 after a net loss of 100,000 in 2013 on average over the year.4 Including theself-employed, employment was virtually stable in 2014 (-0.1% after -0.6% as an annualaverage).
This decline in market salaried employment affected industry (-38,000 jobs) and construc-tion (-34,000 jobs), whereas employment in market-sector services increased (+43,000 jobs).
10 French economy, 2015 edition - Insee Références
-1,5
-1,0
-0,5
0,0
0,5
1,0
1,5
2004 2005 2006 2007 2008 2009 2010 2011 2012 2013 2014
annual change in %, contributions in points
Industry
Construction
Mainly market services
Mainly non-market services
Total salaried employment
6. Trend in salaried employment
Field: France.
Source: Insee, national accounts, base 2010.
3. Autorité de contrôle prudentiel et de résolution - the administrative authority responsible for supervising the bankingand insurance sectors in France.4. Employment as it is calculated and published for the national accounts differs from employment as it is estimated di-rectly in each activity sector. This is mainly due to differences in the period under review: the former is considered as aquarterly (or annual) average, whereas the latter is estimated at the end of the period (quarter or year-end).

The decline in market-sector employment was offset, however, by the increase in non-marketsalaried employment (+89,000 jobs, figure 7). This rise was largely due to subsidised contracts(+60,000). In particular, emplois d’avenir including “jobs of the future” teachers), whichentered into force in November 2012 and were ramped up in 2013 and 2014: at the end of2014, 112,000 people benefited from emplois d’avenir jobs in Metropolitan France,compared to 72,000 at the end of 2013.
Unemployment decreased in 2014 as an annual average, but increased at the end of the year
After rising for two years, in 2012 and 2013, the unemployment rate was virtually stable asan annual average in 2014 (10.2% after 10.3%, including Overseas Departments). Over thecourse of the year, however, it increased; in Q4 2013 it reached 10.1% of the labour forceaccording to the ILO definition. Then, after stabilising in H1 2014, it increased at the end of theyear to reach 10.4% at the end of 2014.
Real wages continued to increase
The average wage per capita in the non-agricultural market sector accelerated slightly innominal terms in 2014, at +1.7% after +1.5% in 2013, despite lower inflation (0.0% at the endof 2014 after +0.8% at the end of 2013). This fall in inflation was of full benefit to the purchas-ing power of average wage per capita, which accelerated considerably (+1.7% after +0.7%).
In general government, nominal wages slowed down in 2014 (+0.2% after +0.6%), due inparticular to the fact that the civil service minimum index was not revaluated at the beginningof 2014, although it had been on 1st January 2013 (+0.3%). In addition, the employment struc-ture changed due to substantial recruitment under subsidised contracts, with lower pay levelsthan the average civil service wage. The slowdown in prices did however offset that of nominalwages: in 2014, real wages increased slightly (+0.3%) after a slight decrease in 2013 (-0.2%).
Over all view - Slow growth for the French economy in 2014 11
-6
-4
-2
0
2
4
6
2000 2002 2004 2006 2008 2010 2012 2014
88
91
94
97
100
103
106
base 100 in 2007Q1
in %
Value added growth in non-agricultural market branches (left scale)
Employment growth in non-agricultural market branches (left scale)
Productivity of non-agricultural market branches, level (right scale)
7. Growth in productivity, value added and employment in the non-agricultural market branches
Field: France.
Source: Insee, national accounts, base 2010.

Purchasing power picked up significantly, consumption accelerated
Household purchasing power picked up in 2014, due to a lower rise in taxes and the decel-eration in prices. In this context, consumption rose more strongly in 2014 than in 2013.
Household gross disposable income rose
In 2014, household gross disposable income (GDI) increased in nominal terms, +1.1%after +0.7% in 2013 (Box 3). Earned incomes increased a little more strongly (+1.3% after+0.9%), in the wake of gross wages received by households (+1.6% after +1.0%), due to asmaller decline in employment in non-agricultural market branches. The gross operatingsurplus of sole proprietors fell back (-0.3% after +0.1% in 2013). That of pure households5
continued to increase (+0.6% after +0.9%).However, the property income balance of households declined in 2014, falling by 2.2%
after increasing by 2.9%. This decrease is due to the fall in interest received by households,despite the rise in distributed company income.
Current taxes on income and wealth continued to grow, but at a slower pace (+1.4% after+4.3%, or +€2.8 billion after +€8.6 billion in 2013). This slowdown was in particular theresult of new measures, which were less significant in 2014 than in 2013. The following are themain measures for taxes on income and wealth introduced in 2014: the removal of the incometax exemption for dependency benefit pension supplements, the further lowering of the ceilingof the family quotient, as well as the removal of tax exemption for a portion of employers’ contri-butions to top-up insurance policies. The impact of these measures was limited, however, byother measures that lowered taxes, such as the income tax reduction for the lowest incomehouseholds.
Social benefits in cash received by households continued to increase (+2.3%), albeit lessstrongly than in 2013 (+2.8%). This slowdown was due to that of social security benefits(+2.3% after +3.0%). Old-age insurance benefits slowed down in particular, due to a backlashafter the increase in the number of retirements in 2013, following the easing of the terms onlong careers decided in July 2012. The slowdown was also due to the fact that pensions overallwere revaluated very little in 2014. Pensions paid by the general and aligned pension schemes,the civil servant scheme as well as the Agirc and Arrco supplementary schemes did notundergo any revaluation in 2014. Family allowances also increased less in 2014 (+0.6% on1st April) than in previous years (+1.3% on average over the last five years), due to weak infla-tion. Finally, after strong growth in 2013, unemployment benefits slowed down considerablyin 2014, affected in particular by improved employment prospects. However, social welfarebenefits continued to accelerate (+3.7% after +1.9% in 2013); they were sustained by earnedincome supplement (RSA) expenditure, for which the scale was revaluated according to thecommitments of the anti-poverty plan, and the specific solidarity allowance, in line with therise in the number of long-term unemployed.
12 French economy, 2015 edition - Insee Références
5. In national accounts the gross operating surplus (GOS) of pure households refers to rent that individual property ow-ners receive from their tenants, or could receive if they rented out their property (in which case they are referred to as “im-puted rents”), after deducting intermediate consumption costs and property tax.
Over all view - Slow growth for the French economy in 2014 13
Box 3
From the purchasing power of disposable incometo the purchasing power of "arbitrable" income per consumption unit
Sylvain Billot, Nathalie Morer*
The term "purchasing power" is used extensively, but it can refer to very different concepts: thecomprehensive and coherent framework of the national accounts provides a precise definition, basedon data that is harmonised internationally. It is based on the purchasing power of gross disposableincome of all households (or real disposable income). Gross disposable income refers to the part ofincome that remains available to households for consumption and savings, after social and fiscal taxcontributions have been deducted**. Changes in the purchasing power of gross disposable incomecompare changes in gross disposable income to those in household consumption expenditure prices.
However, this macroeconomic measurement may differ from the perception that households have ofthe changes in their standard of living. In particular, they may perceive their purchasing power ashaving a more narrow range, by considering that in reality they have little power over some of theirconsumption expenditure, which must necessarily be paid: they are thus focused on the availableleeway for freely making choices on consumption and savings. To understand this perception ofpurchasing power better, we can examine the changes in real "arbitrable" income, that of availableincome once all "pre-engaged" consumption expenditure has been deducted.
The growing weight of "pre-engaged" expenditure in households' budgets"Pre-engaged" expenditure is that which is made within the framework of a contract that is not easily
renegotiable in the short-term. This complementary approach, presented in particular in the 2007 editionof the French economy report as "constrained" expenditure, was adopted, refined and recommended by the"Measurement of Household Purchasing Power" Commission in its report, submitted on 6 February 2008 tothe Minister for Economic Affairs, Industry and Employment. These expenditures are defined as follows:
- expenditure related to housing (including imputed rents)***, as well as expenditure related towater, gas, electricity and other fuels used in dwellings;
- telecommunications services;- canteen expenses;- television services (television royalty, subscriptions to pay channels);- insurance (except life insurance);- financial services (including the services of financial intermediation indirectly
measured-FISIM****).The portion of "pre-engaged" expenditure represents a growing fraction of household budgets: it
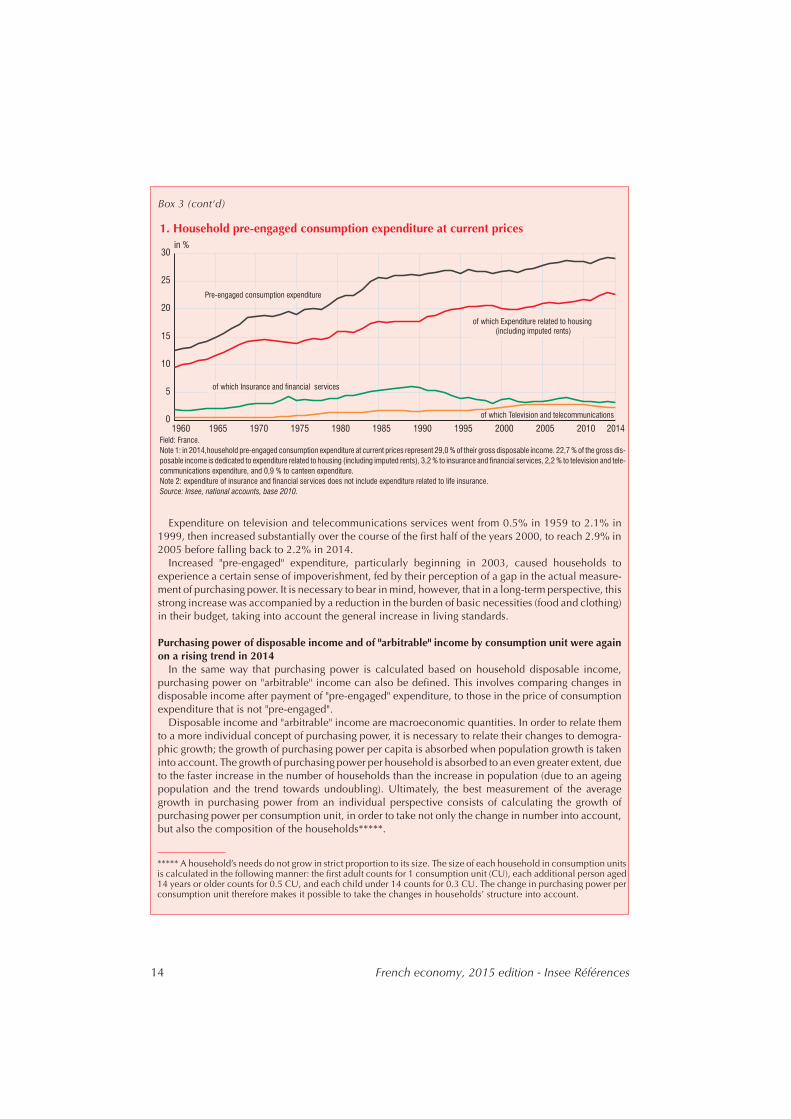
went from 12.3% of their disposable income in 1959, to 29.0% in 2014, a rise of nearly 17 points infifty-six years (figure 1).
Expenditure related to housing accounts for over three quarters of this rise: its share in householdincome climbed from 9.3% in 1959 to 22.7% in 2014. The part of insurance and financial services(including FISIM) was more limited. It first increased, going from 1.9% in 1959 to 6.1% in 1989,before returning to 3.2% in 2014 due to the growing competition between banking institutions andthe drop in interest rates, which was accompanied by tighter bank margins on deposits and loans.
* Sylvain Billot, Nathalie Morer, Insee.** Gross disposable income includes earned income (wages and household gross pay, plus sole proprietors' profits),property income excluding capital gains, whether realised or not (dividends, interest, etc.), transfers (particularly netinsurance premium benefits) and social benefits (retirement pensions, unemployment benefits, family allowances, sta-tutory minimum wages, etc.). The gross disposable income excludes taxes and social contributions. The four main ty-pes of taxes taken into account are income tax, housing tax, the Generalised Social Contribution (CSG) and the SocialDebt Repayment Contribution (CRDS). Inheritance tax, however, is not included in this total.*** The national accounts consider that households that own and occupy their own dwelling pay themselves rent, re-ferred to as "imputed", which is measured based on the prices of the private market sector. This rent raises their level ofdisposable income as well as their consumption expenditure.**** FISIM refers to the margin banks take on remunerations from deposits and loans.
14 French economy, 2015 edition - Insee Références
Box 3 (cont'd)
Expenditure on television and telecommunications services went from 0.5% in 1959 to 2.1% in1999, then increased substantially over the course of the first half of the years 2000, to reach 2.9% in2005 before falling back to 2.2% in 2014.
Increased "pre-engaged" expenditure, particularly beginning in 2003, caused households toexperience a certain sense of impoverishment, fed by their perception of a gap in the actual measure-ment of purchasing power. It is necessary to bear in mind, however, that in a long-term perspective, thisstrong increase was accompanied by a reduction in the burden of basic necessities (food and clothing)in their budget, taking into account the general increase in living standards.
Purchasing power of disposable income and of "arbitrable" income by consumption unit were againon a rising trend in 2014
In the same way that purchasing power is calculated based on household disposable income,purchasing power on "arbitrable" income can also be defined. This involves comparing changes indisposable income after payment of "pre-engaged" expenditure, to those in the price of consumptionexpenditure that is not "pre-engaged".
Disposable income and "arbitrable" income are macroeconomic quantities. In order to relate themto a more individual concept of purchasing power, it is necessary to relate their changes to demogra-phic growth; the growth of purchasing power per capita is absorbed when population growth is takeninto account. The growth of purchasing power per household is absorbed to an even greater extent, dueto the faster increase in the number of households than the increase in population (due to an ageingpopulation and the trend towards undoubling). Ultimately, the best measurement of the averagegrowth in purchasing power from an individual perspective consists of calculating the growth ofpurchasing power per consumption unit, in order to take not only the change in number into account,but also the composition of the households*****.
2014
0
5
10
15
20
25
30
1960 1965 1970 1975 1980 1985 1990 1995 2000 2005 2010
in %
of which Insurance and financial services
of which Expenditure related to housing
(including imputed rents)
Pre-engaged consumption expenditure
of which Television and telecommunications
1. Household pre-engaged consumption expenditure at current prices
Field: France.
Note 1: in 2014,household pre-engaged consumption expenditure at current prices represent 29,0 % of their gross disposable income. 22,7 % of the gross dis-
posable income is dedicated to expenditure related to housing (including imputed rents), 3,2 % to insurance and financial services, 2,2 % to television and tele-
communications expenditure, and 0,9 % to canteen expenditure.
Note 2: expenditure of insurance and financial services does not include expenditure related to life insurance.
Source: Insee, national accounts, base 2010.
***** A household’s needs do not grow in strict proportion to its size. The size of each household in consumption unitsis calculated in the following manner: the first adult counts for 1 consumption unit (CU), each additional person aged14 years or older counts for 0.5 CU, and each child under 14 counts for 0.3 CU. The change in purchasing power perconsumption unit therefore makes it possible to take the changes in households’ structure into account.
Inflation fell considerably
As an annual average, the rise in consumer prices6 reached +0.5%, a marked slowdowncompared to 2013 (+0.9%). The year-on-year increase in prices dropped by 0.6 pointsbetween December 2013 and December 2014.
The fall in headline inflation rates was in part attributable to the fall in core inflation. As anannual average, core inflation dropped by 0.4 points, going from +0.6% to +0.2%. Thismovement could be observed throughout the second half of 2014 (figure 8). In addition, thecontribution of energy to inflation became negative in 2014, going from an annual average of+0.8% to -0.9%. The slowdown in energy prices has thus continued for nearly four years,having decreased nearly 20 points on a year-on-year basis, between the peak in March 2011(+15.3%) and December 2014 (-4.4%).
Over all view - Slow growth for the French economy in 2014 15
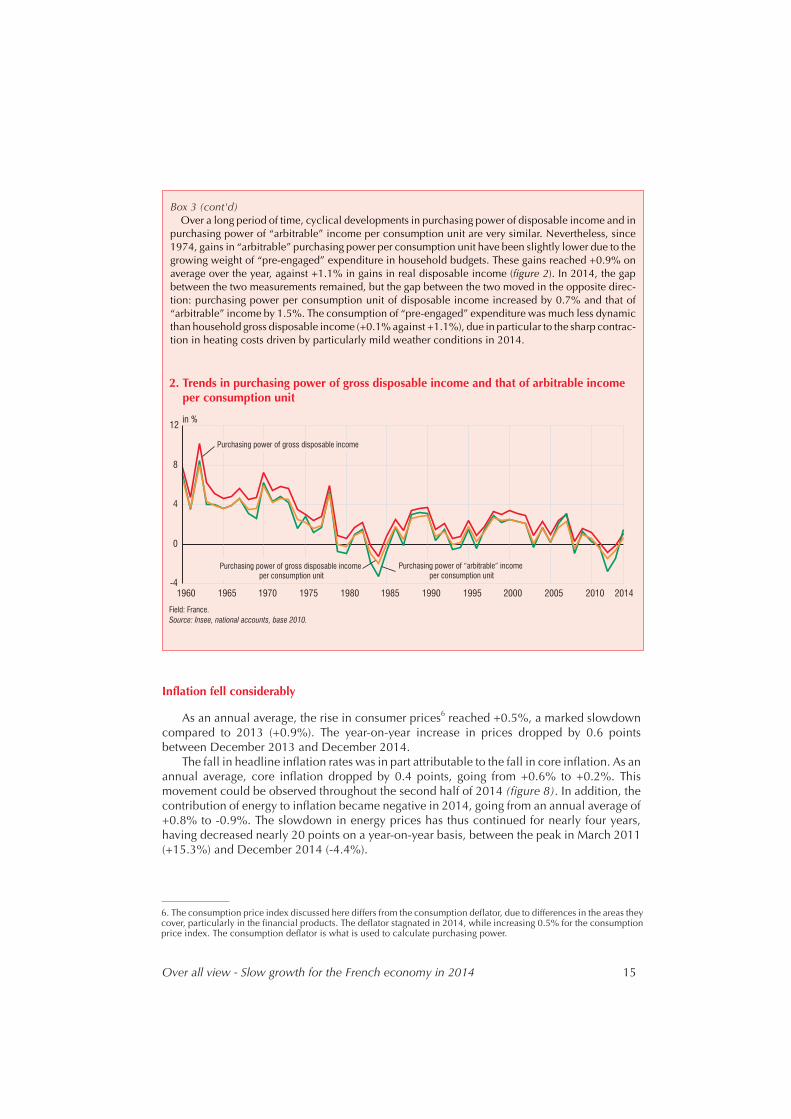
Box 3 (cont'd)Over a long period of time, cyclical developments in purchasing power of disposable income and in
purchasing power of “arbitrable” income per consumption unit are very similar. Nevertheless, since1974, gains in “arbitrable” purchasing power per consumption unit have been slightly lower due to thegrowing weight of “pre-engaged” expenditure in household budgets. These gains reached +0.9% onaverage over the year, against +1.1% in gains in real disposable income (figure 2). In 2014, the gapbetween the two measurements remained, but the gap between the two moved in the opposite direc-tion: purchasing power per consumption unit of disposable income increased by 0.7% and that of“arbitrable” income by 1.5%. The consumption of “pre-engaged” expenditure was much less dynamicthan household gross disposable income (+0.1% against +1.1%), due in particular to the sharp contrac-tion in heating costs driven by particularly mild weather conditions in 2014.
-4
0
4
8
12
in %
1960 1965 1970 1975 1980 1985 1990 1995 2000 2005 2010 2014
Purchasing power of gross disposable income
Purchasing power of arbitrable income
per consumption unit
“ ”Purchasing power of gross disposable income
per consumption unit
2. Trends in purchasing power of gross disposable income and that of arbitrable incomeper consumption unit
Field: France.
Source: Insee, national accounts, base 2010.
6. The consumption price index discussed here differs from the consumption deflator, due to differences in the areas theycover, particularly in the financial products. The deflator stagnated in 2014, while increasing 0.5% for the consumptionprice index. The consumption deflator is what is used to calculate purchasing power.
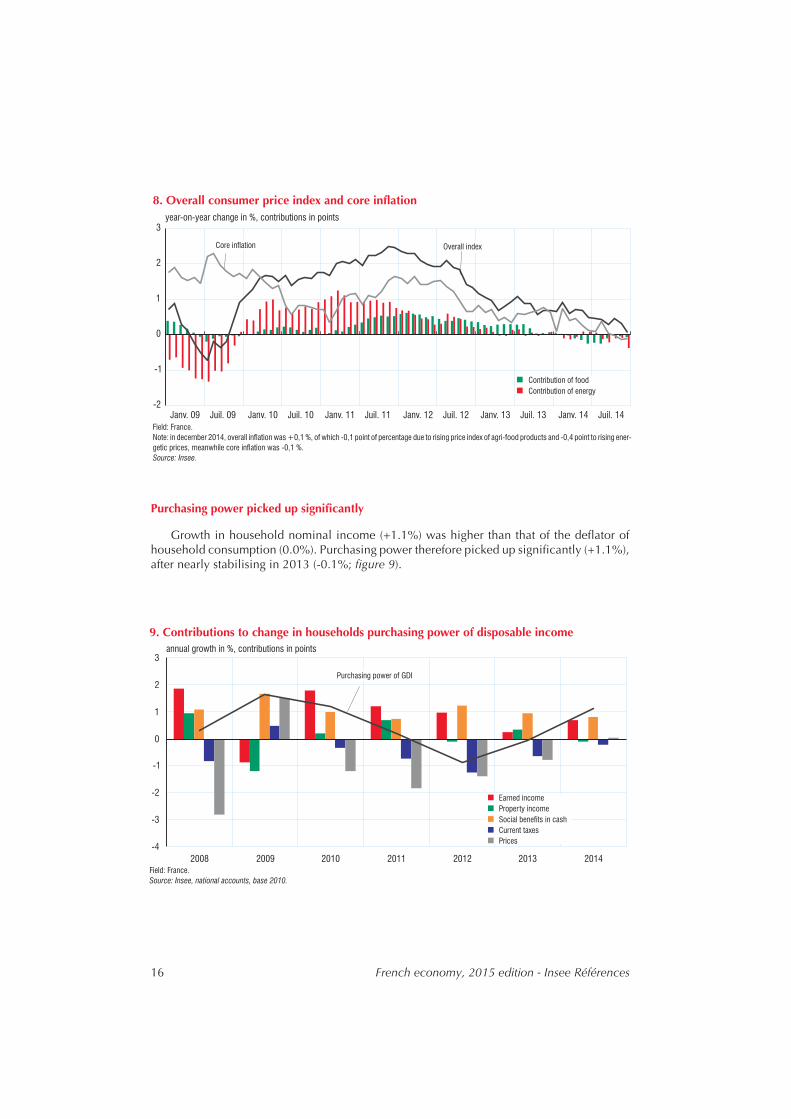
Purchasing power picked up significantly
Growth in household nominal income (+1.1%) was higher than that of the deflator ofhousehold consumption (0.0%). Purchasing power therefore picked up significantly (+1.1%),after nearly stabilising in 2013 (-0.1%; figure 9).
16 French economy, 2015 edition - Insee Références
-2
-1
0
1
2
3
Janv. 09 Juil. 09 Janv. 10 Juil. 10 Janv. 11 Juil. 11 Janv. 12 Juil. 12 Janv. 13 Juil. 13 Janv. 14 Juil. 14
Contribution of food
Contribution of energy
year-on-year change in %, contributions in points
Overall index
Core inflation
8. Overall consumer price index and core inflation
Field: France.
Note: in december 2014, overall inflation was +0,1 %, of which -0,1 point of percentage due to rising price index of agri-food products and -0,4 point to rising ener-
getic prices, meanwhile core inflation was -0,1 %.
Source: Insee.
-4
-3
-2
-1
0
1
2
3
2008 2009 2010 2011 2012 2013 2014
annual growth in %, contributions in points
Earned income
Property income
Social benefits in cash
Current taxes
Prices
Purchasing power of GDI
9. Contributions to change in households purchasing power of disposable income
Field: France.
Source: Insee, national accounts, base 2010.
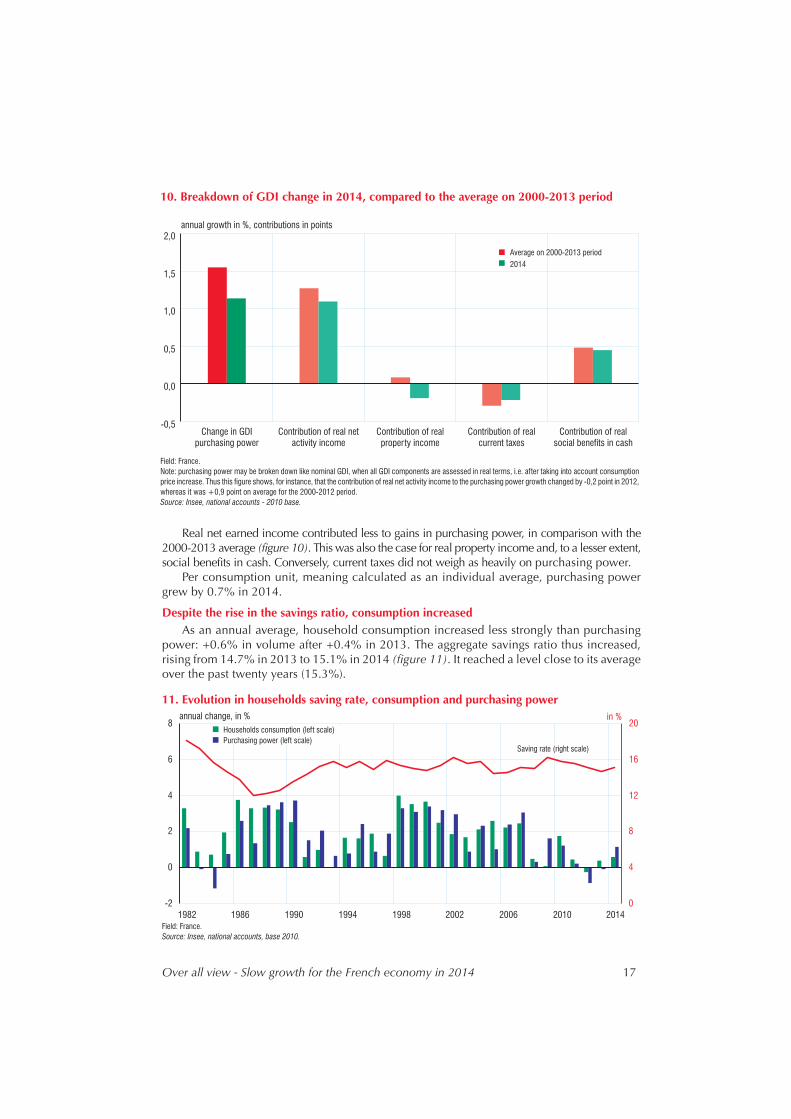
Real net earned income contributed less to gains in purchasing power, in comparison with the2000-2013 average (figure 10). This was also the case for real property income and, to a lesser extent,social benefits in cash. Conversely, current taxes did not weigh as heavily on purchasing power.
Per consumption unit, meaning calculated as an individual average, purchasing powergrew by 0.7% in 2014.
Despite the rise in the savings ratio, consumption increasedAs an annual average, household consumption increased less strongly than purchasing
power: +0.6% in volume after +0.4% in 2013. The aggregate savings ratio thus increased,rising from 14.7% in 2013 to 15.1% in 2014 (figure 11). It reached a level close to its averageover the past twenty years (15.3%).
Over all view - Slow growth for the French economy in 2014 17
-0,5
0,0
0,5
1,0
1,5
2,0
2014
annual growth in %, contributions in points
Average on 2000-2013 period
Change in GDI
purchasing power
Contribution of real net
activity income
Contribution of real
property income
Contribution of real
current taxes
Contribution of real
social benefits in cash
10. Breakdown of GDI change in 2014, compared to the average on 2000-2013 period
Field: France.
Note: purchasing power may be broken down like nominal GDI, when all GDI components are assessed in real terms, i.e. after taking into account consumption
price increase. Thus this figure shows, for instance, that the contribution of real net activity income to the purchasing power growth changed by -0,2 point in 2012,
whereas it was +0,9 point on average for the 2000-2012 period.
Source: Insee, national accounts - 2010 base.
-2
0
2
4
6
8
1982 1986 1990 1994 1998 2002 2006 2010 2014
0
4
8
12
16
20
in %annual change, in %
Households consumption (left scale)
Purchasing power (left scale)
Saving rate (right scale)
11. Evolution in households saving rate, consumption and purchasing power
Field: France.
Source: Insee, national accounts, base 2010.

Spending on manufactured goods picked up significantly (+0.6% afters -0.8%). After adecline in 2013, automobile consumption bounced back (+1.3% after -3.2%), as did consump-tion of capital goods (+1.1% after -1.0%). Consumption of food products continued to grow(+1.4% after +3.0%), as did consumption of other industrial goods (+1.8% after +1.1%).
Consumption of energy, water and waste fell back considerably in 2014 (-8.8% after+1.9%), affected by exceptionally mild temperatures which allowed a reduction in heatingcosts in Q1 and Q4.
The consumption of market services grew slightly (+0.7% after +0.9%). Consumption ofaccommodation and restaurant services continued to decline (-0.9% after -1.4%), as did “otherhousehold services” (-0.4% after -0.9%). Consumption in information-communication slowedconsiderably (0.0% after +4.0%) and that of transport services decelerated more moderately(+0.2% after +0.5%). Finally, the balance of trade in tourism deteriorated considerably in 2014due to a rise in French residents’ spending abroad (+9.6% after +3.5%) and a decline in spendingby foreign visitors in France (-2.3% after +1.7%). Territorial adjustment increased the growth ofhousehold consumption by 0.2 points in 2014, after 0.4 points in 2013.
Household investment fell back sharply (-5.3% after -1.5%), particularly in construction,where individual housing starts declined for the third consecutive year.
All in all, the household financial savings ratio increased 0.8 points, from 5.3% in 2013 to6.1% in 2014.
Foreign trade weighed down on activity
French exports grew in the wake of world trade
In 2014, world trade in goods accelerated (+3.3% after +2.7%), in line with the greaterbuoyancy in advanced economies. World demand for French exports was also a little moredynamic (+3.3% after +3.1%), even though the geographic breakdown of trade limited theimpact of the slowdown in emerging economies. The rise came mainly from demand fromGermany (contributing +0.7 points after +0.4 points in 2013) and Spain (contributing +0.6points after 0.0), whereas the pace of demand from other partners was maintained.
Exports of goods and services accelerated in 2014, growing 2.4% in volume after +1.7%.This growth still remained lower than that in world trade in goods (figure 12) and that indemand for French exports, which resulted in a slight loss in market share, which was partlylinked to the appreciation of the Euro on average over the year.
18 French economy, 2015 edition - Insee Références
-15
-10
-5
0
5
10
15
1994 1998 2002 2006 2010 2014
in %
World trade in goods
French exports of goods
12. Trends in French exports and world trade in goods in volume
Sources: Insee, Centraal Planbureau.

Exports of manufactured goods accelerated
Exports of manufactured goods, which represent approximately three quarters of sales,gathered momentum (+1.8% in volume after +1.3%). This acceleration came from that ofexports of “other industrial products” (+3.4% after +1.0%) and exports in coking and refining(+1.7% after +0.5%). Exports of transport equipment slowed down (+0.4% after +3.7%), as didcapital goods (+1.2% after +1.8%). Exports in food products fell back (-1.5% after -0.4%).
Excluding manufactured products, energy, water and waste exports bounced backstrongly in 2014 (+15.4% after -7.7%). Agricultural exports slowed down (+1.3% after+7.7%). All in all, the export of goods accelerated (+2.1% in 2014 after +1.5% in 2013).Finally, export of services also accelerated (+5.0% after +3.3%).
Imports accelerated even more considerably
Imports in France increased by 3.8% in volume in 2014, after +1.7%, driven by theincrease in various components of demand that were strong in import content: consumption,corporate investment and exports.
Imports of manufactured goods accelerated (+3.7% after +0.3%), due to capital goods(+4.4% after +1.2%), transport equipment (+1.8% after +1.4%) and “other industrialproducts” (+4.7% after -0.7% in 2013). But imports in coking and refining fell back (-2.0%after +1.2%) and energy, water and waste imports, including crude oil products, againdeclined sharply (-4.5% after -3.2%). All in all, the import of goods accelerated, increasing by2.7% after 0.0% in 2013.
Similarly, imports of services grew strongly (+7.4% after +9.3%). In particular, imports offinancial services rebounded and continued to grow vigorously in services to businesses.
Over the year 2014 as a whole, the contribution of trade to GDP was negative (-0.5 pointsafter 0.0 points in 2013), with imports significantly more dynamic than exports.
France’s net borrowing picked up
In value, however, exports of goods and services grew almost as rapidly in 2014 (+1.4%) asimports (+1.3%), due to the price of imports decreasing much more sharply than that ofexports, driven in particular by the fall in the price of oil. The balance of trade was thus virtu-ally stable and remained largely in deficit, at -€39.2 billion. The strong improvement in theenergy balance (+9.4 billion) was offset by a deterioration in the balances for the other mainproduct categories: manufactured goods (-€1.8 billion), agriculture (-€1.5 billion), marketservices (-€2.5 billion) and territorial adjustment (-€4.1 billion, purchases of French residentsabroad were more dynamic than the purchases of non-residents in France). Furthermore, theproperty income balance improved (+€0.9 billion, after +€3.8 billion): income paid to the restof the world fell back by €8.3 billion, whereas income received decreased by €7.3 billion. Allin all, France’s net borrowing was down by €6.2 billion and represents 2.3% of GDP, after2.7% in 2013 (figure 13).
Over all view - Slow growth for the French economy in 2014 19

Public investment fell back and the deficit was slightly reduced
In 2014, the public deficit reached 4.0% of GDP
In 2014, the public deficit as defined in the Maastricht Treaty came to 4.0% of gross domesticproduct (GDP), after 4.1% in 2013 (figure 14). After deteriorating sharply in 2009 as a result of thegreat recession, the public deficit continues to narrow, due to revenue that was more dynamic thanexpenditure. With fewer new measures, public revenue slowed down as compared to 2013(+1.9% in 2014 after +3.2% in 2013). It remained more dynamic than GDP, however (+0.8% invalue). Public spending (+1.6% after +1.8%) continued to grow at a similar pace to that in 2013,driven by implementation of the Tax Credit for Competitiveness and Employment (CICE,+€10.2 billion of spending, or a contribution of 0.8 points to the variation in spending) (Box 4).
20 French economy, 2015 edition - Insee Références
15
20
25
30
35
1980 1984 1988 1992 1996 2000 2004 2008 2012
in % of GDP
-4
-2
0
2
4
in % of GDP
2014
Foreign trade balance (right scale)
National Lending/Borrowing (right scale)
Imports in value (left scale)
Exports in value (left scale)
13. External balance
Field: France.
Source: Insee, national accounts, base 2010.
20
30
40
50
60
1970 1974 1978 1982 1986 1990 1994 1998 2002 2006 2010 2014
-8
-4
0
4
8
in % of GDP in % of GDP
Net lending / borrowing (right scale)
Revenues (left scale)
Expenditures (left scale)
14. General Government net lending / borrowing
Field: France.
Source: Insee, national accounts, base 2010.
Over all view - Slow growth for the French economy in 2014 21
Box 4
General government in the representation of the economy
Ronan Mahieu*
General government encompasses all the unitsthat conduct economic action linked with politicalsovereignty. These units are responsible forproviding the community as a whole (and specifi-cally households) with goods and services. Theycarry out the redistribution of income and wealthby organising transfers. They finance thesepolicies by levying taxes and mandatorycontributions.
In the national accounts, general governmentperforms these duties in the framework of anon-market production activity, which distinguishesthem from public-sector firms, like EDF or theSNCF, that produce and sell market services tohouseholds or to companies. The economic activityof general government is recorded in the nationalaccounts in the same manner as other economicagents, particularly companies and households,subject to relevant agreements.
Total expenditure agreed upon by generalgovernment to fulfil its duties amounted to€1,145 billion in 2014, which was 53.7% ofGDP. This sum covers expenditure related toproviding goods and services to the community,and other general government expenditure, parti-cularly that of the redistribution process. It there-fore includes all social benefits in cash, includingthose for old-age insurance, family policy, or forfighting unemployment, poverty, and social exclu-sion, as well as subsidy expenditure that benefitscompanies or households. Interest expenses arealso included in this expenditure. Within thisamount, expenditure for social benefits in cashalone represented 20.0% of GDP in 2014.
Total general government expenditure recordedin national accounting is still slightly greater thanthis amount, because the alignment of the repre-sentation of general government with that ofhouseholds requires national accountants toallocate a number of transactions that do notcorrespond to any cash flow.
The best known case of such allocations is thatof processing pension benefits paid by the State toformer employees in the framework of the nationalcivil and military pension scheme: the cash flowsrelated to this scheme are limited to State pension
payments for retired civil servants. In the case of a"regular" pension scheme, the national accountsrecord three types of cash flow: the flow ofemployers' contributions from companiestowards employees, the flow of employees'contributions towards pension schemes, andbenefit payments from pension schemes towardspensioners. In order to make the processing ofcivil and military pension schemes consistentwith the other pension schemes, the nationalaccounts charge a contribution payment to theState as employer towards civil servants in activeemployment, and charge a payment of contribu-tions from civil servants in active employmenttowards the State-manager of the pension scheme.In practice, therefore, a payment of €1,000 fromthe State to a retired civil servant results in a publicexpenditure in the national accounts of €2,000:€1,000 for employers' contributions, and €1,000for social benefits in cash.
There are other cases of allocating expenditurein this manner in the national accounts. This is thecase, for example, in the development of produc-tion for the general government's own final use,particularly in the capitalisation of R&D expendi-ture: a payment of €1,000 in wages to a researcheremployed by a public unit results in public expen-diture of €2,000: €1,000 in compensation and€1,000 in investment expenditure. The proces-sing of refundable tax credits also brings aboutsuch charging procedures: all sums that proceedfrom tax credits represent a public expenditure,even though, in the vast majority of cases, the taxcredit is applied in the form of a reduction of thetax owed by the taxpayers that benefit from saidcredit.
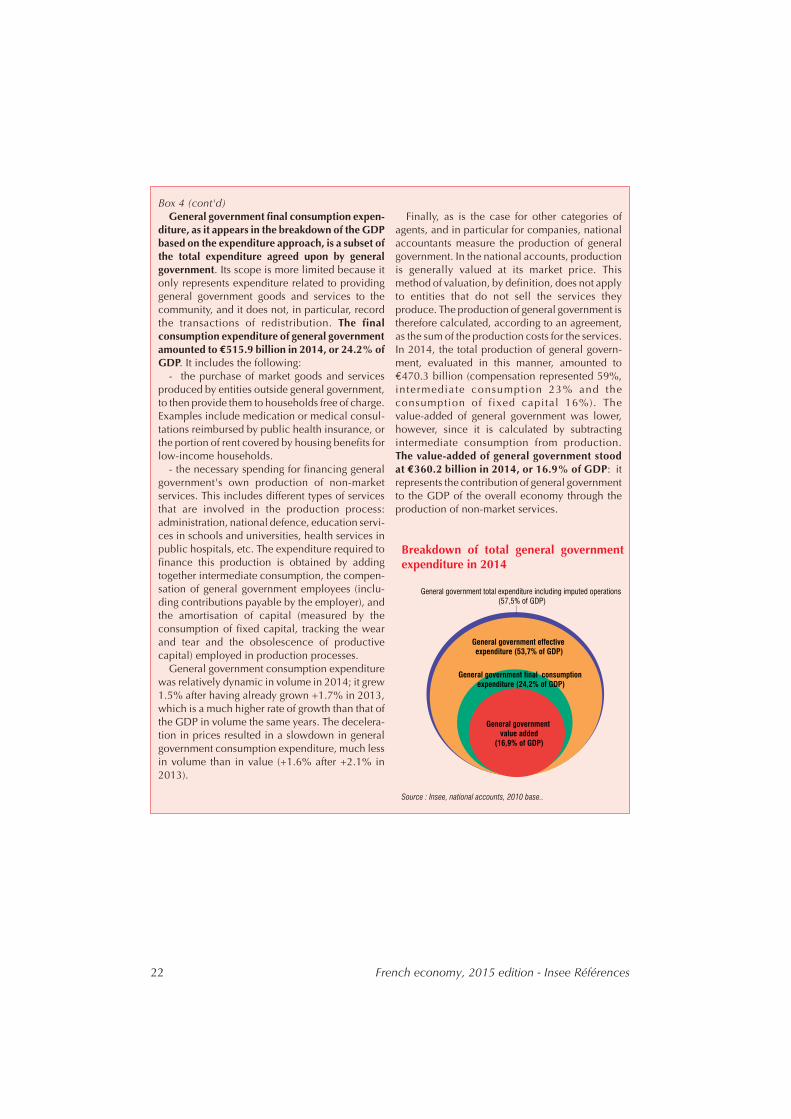
Ultimately, taking all of these charges intoaccount, total public expenditure in the nationalaccounts amounted to €1,226.40 billion in 2014,or 57.5% of GDP. These charges, though they arenecessary for ensuring the overall consistency ofthe national accounts, reduce the relevancy of thetotal expenditure of general government as anindicator of general government's increased drainon the economy to finance their production andredistribution duties.
* Ronan Mahieu, Insee.
22 French economy, 2015 edition - Insee Références
Box 4 (cont'd)General government final consumption expen-
diture, as it appears in the breakdown of the GDPbased on the expenditure approach, is a subset ofthe total expenditure agreed upon by generalgovernment. Its scope is more limited because itonly represents expenditure related to providinggeneral government goods and services to thecommunity, and it does not, in particular, recordthe transactions of redistribution. The finalconsumption expenditure of general governmentamounted to €515.9 billion in 2014, or 24.2% ofGDP. It includes the following:
- the purchase of market goods and servicesproduced by entities outside general government,to then provide them to households free of charge.Examples include medication or medical consul-tations reimbursed by public health insurance, orthe portion of rent covered by housing benefits forlow-income households.
- the necessary spending for financing generalgovernment's own production of non-marketservices. This includes different types of servicesthat are involved in the production process:administration, national defence, education servi-ces in schools and universities, health services inpublic hospitals, etc. The expenditure required tofinance this production is obtained by addingtogether intermediate consumption, the compen-sation of general government employees (inclu-ding contributions payable by the employer), andthe amortisation of capital (measured by theconsumption of fixed capital, tracking the wearand tear and the obsolescence of productivecapital) employed in production processes.
General government consumption expenditurewas relatively dynamic in volume in 2014; it grew1.5% after having already grown +1.7% in 2013,which is a much higher rate of growth than that ofthe GDP in volume the same years. The decelera-tion in prices resulted in a slowdown in generalgovernment consumption expenditure, much lessin volume than in value (+1.6% after +2.1% in2013).
Finally, as is the case for other categories ofagents, and in particular for companies, nationalaccountants measure the production of generalgovernment. In the national accounts, productionis generally valued at its market price. Thismethod of valuation, by definition, does not applyto entities that do not sell the services theyproduce. The production of general government istherefore calculated, according to an agreement,as the sum of the production costs for the services.In 2014, the total production of general govern-ment, evaluated in this manner, amounted to€470.3 billion (compensation represented 59%,intermediate consumption 23% and theconsumption of fixed capital 16%). Thevalue-added of general government was lower,however, since it is calculated by subtractingintermediate consumption from production.The value-added of general government stoodat €360.2 billion in 2014, or 16.9% of GDP: itrepresents the contribution of general governmentto the GDP of the overall economy through theproduction of non-market services.
General government total expenditure including imputed operations
(57,5% of GDP)
General government effective
expenditure (53,7% of GDP)
General government final consumption
expenditure (24,2% of GDP)
General government
value added
(16,9% of GDP)
Breakdown of total general governmentexpenditure in 2014
Source : Insee, national accounts, 2010 base..

Excluding tax credits, public spending slowed down significantly compared to 2013(+0.9% after +1.9%). In particular, interest paid again decreased, affected by lower rates and afall in inflation (+0.4% in 2014 against +0.7% in 2013, according to the consumer price indexexcluding tobacco) and general government investment declined significantly (-7.3%), partic-ularly affected by the municipal electoral cycle.
The improvement of the general government balance by €1.6 billion was essentially attrib-utable to local government (+€4.1 billion) and, to a lesser extent, to social security funds(+€0.6 billion). The balance of central government deteriorated, however, by €3.1 billion, asthe increase in tax revenues only offset a part of the costs associated with the implementationof the CICE.
Tax and social contribution rates rose slightly in 2014
The rate of taxes and social contributions increased slightly in 2014 (+0.2 in comparisonto 2013), to 44.9% of GDP. New tax and social measures contributed moderately to the rise:+0.1 points of GDP (Box 5). In the absence of new measures, taxes and social contributionsgrew spontaneously at a very similar pace to that of GDP in value (+0.8%).
The deficit of central government grew slightly
The net borrowing of central government, the State and other government bodies (ODAC),deteriorated by €3.1 billion to stand at -€71.8 billion in 2014. Exceptional transfers improvedthe balance of ODAC and symmetrically deteriorated that of the State: this is due to grants fromthe State to ODAC in the framework of the second phase of the Future Investments Programme,which represented €7.1 billion. The ODAC are thus in surplus again, after a 2013 marked bythe assumption by the State of the debt of the Public Financing and Development Establish-ment (EPFR, in charge of taking over the bad debt of the Crédit Lyonnais bank), for€4.5 billion.
Over all view - Slow growth for the French economy in 2014 23
The second Future Investment programme:
In 2014 the government launched a second Future Investments programme, financed by€12 billion in budget funds. The first programme took place in 2010.
The management of these funds was entrusted to operators within central government. They were incharge of selecting the files that would benefit from subsidies.
In the national accounts, only funds related to “consumable” grants are recorded as transfers incapital, because they are final. They represent over €7 billion. The main ODAC endowed by theState are the Public Investment Bank, the Atomic Energy Commission, the National Office forAerospace Studies and Research, the Environment and Energy Management Agency, the NationalResearch Agency, and the National Urban Renewal Agency.
However, “non-consumable” endowments do not result in any record in the national accounts,because the operators cannot consume the funds deposited into a Public Treasury account, only theinterest generated.
Central government revenue slowed down considerably (+0.9% in 2014 against +4.3% in2013), while growth in spending (including the impact of the CICE) remained moderate(+1.4% in 2014 after +0.3% in 2013).
Intermediate consumption excluding FISIM decreased by €1.0 billion, affected by lowermilitary expenditure, after several years of continuous increases (-3.4% in 2014 after +1.3% in2013). Staff expenditure increased slightly (+0.6% in 2014). The slight increase in gross wages(+0.5%) was the result of contrasting developments: a decrease due to the workforce reductionin the Department of Defence, and an increase resulting from job creations in the primary andsecondary school levels of education. Social contributions charged to the State as employercontinued to slow down (+1.0% in 2014 after +2.4% in 2013), due to the pension reform thatraised the age of retirement.
Subsidies on compensation increased sharply (+ €11.4 billion) due to the Tax Credit forCompetitiveness and Employment (CICE) representing €10.2 billion, but also the increase inemplois d’avenir, “jobs of the future” (+ €0.7 billion) and contrats uniques d’insertion “singlesocial integration contracts” (+ €0.4 billion).
Interest paid continued to decrease in 2014 (-2.3%), affected by the combination of adecrease in interest rates and in inflation, but much less considerably than in 2013 (-10.2%).
Social benefits paid by central government increased for the fourth consecutive year, witha growth of €1.9 billion (+2.0% after +2.4% in 2013). While the employment allowancecontinued to decrease, (-€0.3 billion), there was an increase in retirement pensions, expendi-ture for the earned income supplement, the adult disability allowance, as well as studentscholarships (for a total of +€1.7 billion).
Expenditure for current international cooperation decreased sharply (-4.2% in 2014 after+5.2% in 2013): appropriations for the maintenance of peace and international cooperationdecreased, as did refunds to Greece of income France received from Greek debt. The paymentinto the European Union’s own resources decreased considerably (-€2.6 billion), mainly dueto the revision in 2014 of the gross national revenue base in previous financial years, whichwas favourable for France.
In addition, the signing of a new debt reduction and development contract (C2D) with theIvory Coast, for €0.9 billion, caused a rise in debt remission expenditure (+€0.7 billion).
Yet again this year, central government investment expenditure decreased (-5.9% in 2014after -3.1% in 2013), mainly due to a fall in shipments of military equipment.
In terms of revenue, taxes and social contribution payments increased slightly (+0.6%).Taxes on production and imports increased by €1.4 billion, taking into account the rise in
VAT rates on 1st January (the intermediate rate went from 7% to 10% and the normal rate from19.6% to 20%). All in all, the VAT revenue increased by €3.8 billion. The State kept 1 billionand 2.8 billion went to social security institutions, which benefited from a larger share of VATthan in 2013. Other taxes on products grew by €0.5 billion, the revenue from the contributionto the Public Electricity Service increased in particular by €1.0 billion. Income taxes, afterstrong growth in 2013 (+€11.3 billion), dropped by €1.8 billion in 2014. Personal income taxwas particularly affected by several new measures that offset each other (see above). Corpora-tion tax was marked by the removal of the annual flat-rate tax. Other current taxes increased(+€0.9 billion), due to tax recoveries on the solidarity tax on wealth, which were moredynamic due to an increase in the regularisation of taxes from taxpayers who have foreignbank accounts, and to a lesser extent to revenue from the systemic risk tax on banks. Capitaltaxes dropped €0.2 billion: the rise in revenues from transfer duties on property donations(+€0.7 billion), due in part to an increase in tax regularisation, only partially offset by theremoval of the exceptional contribution of insurance companies on capitalization reserves(-€0.9 billion).
Property income grew by €0.8 billion (or +9.0%) due to €0.7 billion drawn from thesavings funds managed by Caisse des Dépôts et Consignations.
24 French economy, 2015 edition - Insee Références
Over all view - Slow growth for the French economy in 2014 25
Box 5
The main fiscal and social measures and their impact on variations in taxand social contributions in 2014
Claire Jolly, Thomas Meinzel, Carmina Montero de Espinosa*
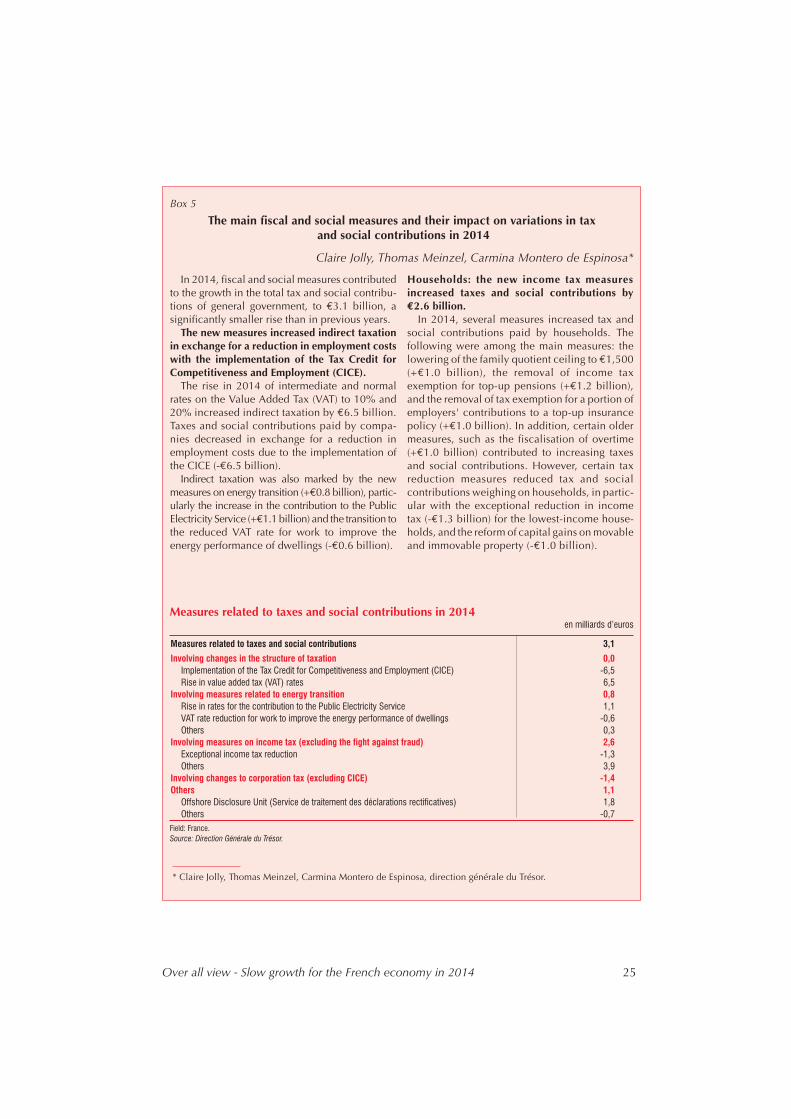
In 2014, fiscal and social measures contributedto the growth in the total tax and social contribu-tions of general government, to €3.1 billion, asignificantly smaller rise than in previous years.
The new measures increased indirect taxationin exchange for a reduction in employment costswith the implementation of the Tax Credit forCompetitiveness and Employment (CICE).
The rise in 2014 of intermediate and normalrates on the Value Added Tax (VAT) to 10% and20% increased indirect taxation by €6.5 billion.Taxes and social contributions paid by compa-nies decreased in exchange for a reduction inemployment costs due to the implementation ofthe CICE (-€6.5 billion).
Indirect taxation was also marked by the newmeasures on energy transition (+€0.8 billion), partic-ularly the increase in the contribution to the PublicElectricity Service (+€1.1 billion) and the transition tothe reduced VAT rate for work to improve theenergy performance of dwellings (-€0.6 billion).
Households: the new income tax measuresincreased taxes and social contributions by€2.6 billion.
In 2014, several measures increased tax andsocial contributions paid by households. Thefollowing were among the main measures: thelowering of the family quotient ceiling to €1,500(+€1.0 billion), the removal of income taxexemption for top-up pensions (+€1.2 billion),and the removal of tax exemption for a portion ofemployers' contributions to a top-up insurancepolicy (+€1.0 billion). In addition, certain oldermeasures, such as the fiscalisation of overtime(+€1.0 billion) contributed to increasing taxesand social contributions. However, certain taxreduction measures reduced tax and socialcontributions weighing on households, in partic-ular with the exceptional reduction in incometax (-€1.3 billion) for the lowest-income house-holds, and the reform of capital gains on movableand immovable property (-€1.0 billion).
* Claire Jolly, Thomas Meinzel, Carmina Montero de Espinosa, direction générale du Trésor.
Measures related to taxes and social contributions 3,1
Involving changes in the structure of taxation 0,0
Implementation of the Tax Credit for Competitiveness and Employment (CICE) -6,5
Rise in value added tax (VAT) rates 6,5
Involving measures related to energy transition 0,8
Rise in rates for the contribution to the Public Electricity Service 1,1
VAT rate reduction for work to improve the energy performance of dwellings -0,6
Others 0,3
Involving measures on income tax (excluding the fight against fraud) 2,6
Exceptional income tax reduction -1,3
Others 3,9
Involving changes to corporation tax (excluding CICE) -1,4
Others 1,1
Offshore Disclosure Unit (Service de traitement des déclarations rectificatives) 1,8
Others -0,7
Measures related to taxes and social contributions in 2014en milliards d’euros
Field: France.
Source: Direction Générale du Trésor.
Local government investment fell back sharply
The net borrowing of local government dropped by €4.1 billion to €4.5 billion in 2014.Expenditure slowed down significantly (-0.3% after +3.4% in 2013), whereas revenuesincreased at the same pace as in 2013 (+1.4% after +1.3%).
In terms of expenditure, investment fell back sharply following the municipal elections(-9.6% after +5.2% in 2013). Intermediate consumption also slowed down significantly(+0.3% after +2.9% in 2013) in a low inflation environment. The interest burden continued todecrease due to the drop in rates (-0.3% after -1.9% in 2013). Social benefit and transferexpenditures remained dynamic (+4.2% after +4.4% in 2012). Finally, the reform of schoolschedules, the rise in subsidised contracts, the increase in employers’ pension contributions,and the pay rise for certain categories of civil servants all contributed to the growth in compen-sation (+3.9% after +3.2% in 2013).
With regard to revenue, local government taxes and social contributions increased by€3.1 billion, due to a rise in taxes on products and production. These taxes were sustained bynew sources of funding, in particular from the widely-used possibility given to departments ofincreasing the rates of transfer duties on property purchases for valuable consideration (whichrepresented€0.7 billion of additional revenues), and by the transfer of revenues from domesticduty on consumption of energy products (TICPE) from the State to the Regions in the frame-work of reforms on vocational training apprenticeships.
On the flip-side of this rise in the taxes allocated, current transfers from the State to localgovernment decreased. The drop of €1.4 billion in the general operating grant was onlypartially offset by a new transfer representing the management costs of the property tax of€0.8 billion.
Social accounts improved gradually
In 2014, the balance of social security funds stood at -€8.5 billion, against -€9.1 billion in2013.
The slowdown in social security fund revenues continued in 2014 (+2.4% after +2.9% in2013), despite an acceleration in the private payroll that forms the primary base of socialcontributions (+1.5% in 2014 after +1.2%, in the field measured by ACOSS). In fact, the newtax and social contribution measures did not sustain revenue as much in 2014 (+€5.6 billion-due to a rise in pension contribution rates, the retrocession to the Social Security of the amountcorresponding to revenues received from the lowering of the family quotient ceiling and fromthe taxation of employer participation in group top-up insurance policies) as in 2013 (+€9.8
26 French economy, 2015 edition - Insee Références
Box 5 (cont'd)Companies: excluding CICE, the new measureson corporation tax decreased taxes and socialcontributions by - €1.4 billion.
In 2014, partial repercussions of previousmeasures on corporation tax decreased taxes andsocial contributions paid. These previous measuresinclude limitations on the deductibility of finan-cial charges (- €1.2 billion), the continued imple-mentation of the rise in the assessed amount forfees and expenses on long-term capital gains(-€1.4 billion), as well as the continued effects ofthe 2009 recovery plan (€1.4 billion), in particular
regarding the research tax credit. However, theexceptional contribution to corporation tax hadan opposite effect (+€2.0 billion), in particularwith a rate increase of 10.7%.
Finally, in 2014, other measures contributed toincreasing taxes and social contributions by€1.1 billion, particularly in the fight against fraudfor €1.8 billion with the initiation of the OffshoreDisclosure Unit (STDR - Service de traitement desdéclarations rectificatives).
billion). In addition, social contributions on capital remained sluggish, affected in particularby the drop in rates of return on financial assets.
The growth in the expenditure of the social security administration stabilised in 2014(+2.3% after +2.2% in 2013). While social benefits slowed down (+2.3% after +2.8%), finan-cial costs remained stable after a considerable decline in 2013. The deceleration in benefitswas particularly felt by the basic and top-up pensions, which were frozen in 2014. Weak infla-tion caused a moderate revaluation of family allowances (+0.6% on 1st April 2014). Thegrowth of unemployment compensation expenditure was considerably weaker in 2014(+1.9% against +5.7% in 2013), due in particular to less negative trend in employment. Thegrowth in health insurance expenditure remained under control, achieving the national targetceiling for health insurance expenditure (ONDAM), €0.3 billion below the voted targetceiling.
Government debt increased by 3.3 points to 95.6%
Government debt as defined in the Maastricht Treaty reached €2,037.8 billion at the endof 2014, after €1,953.4 billion the year before. It reached 95.6% of GDP, after 92.3% at theend of 2013 (figure 15).
State contribution to government debt as defined in the Maastricht Treaty stood at€1,610.2 billion, an increase of €74.3 billion, which is a variation very close to its net borrow-ing (€74.7 billion).
The contribution other government bodies (ODAC) to the debt was stable at €22.6 billionat the end of 2014, as in 2013. The French Motorway Fund, la Caisse nationale des autoroutes(CNA), reduced its debt load by €1.5 billion. Conversely, the debt linked to the contribution tothe Public Electricity Service (CSPE), to the Bank Deposit Guarantee Fund and to SAGESS (theFrench Organisation for Strategic Petroleum Stocks) caused a rise of +€1.0 billion. Finally, theAFITF (French Agency for Financing Transport Projects) went €0.4 billion into debt for a10-year period to the Ecomouv company, following termination of the “Écotaxe” contract.
Local government’s contribution to the debt reached €188.2 billion at the end of 2014, arise of €4.9 billion on 2013, which was near to their net borrowing (€4.5 billion).
Over all view - Slow growth for the French economy in 2014 27
0
20
40
60
80
100
1995 2000 2005 2010
in % of GDP
2014
15. Government debt as defined by the Maastricht Treaty
Field: France.
Source: Insee, national accounts, base 2010.
Finally, the social security administrations’ contribution to government debt increased by €5.1 billionto stand at €216.8 billion at the end of 2014. Net borrowing (€8.5 billion), considerably greater than thechange in debts, was financed in part by the State’s purchase of 3.1 billion ACOSS securities (a govern-ment agency going into debt with another government agency is not recorded in its contribution to debtas defined in the Maastricht Treaty).
At the end of 2014, the net debt of general government reached €1,849.9 billion (or 86.7% of GDP),up €81.7 billion on 2013. The recorded gross government debt grew at the same time by €84.4 billion.The movement of assets was relatively weak. The State Treasury decreased €2.0 billion and the Socialsecurity funds increased their holdings of short-term (by €2.8 billion) and long-term (by €1.8 billion)securities. The State granted €1.4 billion in loans, while the ODAC were reimbursed for an amount of€1.4 billion. �
28 French economy, 2015 edition - Insee Références
Box 6
Main revisions made to the National accounts in 2012 and 2013
Étienne Debauche, Marie Leclair*
At the time of the 2014 provisional report, the final2012 account and the half-finalised 2013 accountcontained revisions concerning the half-finalised 2012account and provisional 2013 account published in2014.
Main revisions on the 2012 account
The resources and uses balanceGDP increased by 0.2% in the final 2012 account,
against +0.3% in the half-finalised account. GDPgrowth in value was also adjusted downwards (+1.3%against +1.5%).
Regarding demand, the contribution of domesticdemand excluding inventory to GDP growth wasadjusted slightly upwards to +0.3 points: gross fixedcapital formation (GFCF) in volume made a slightlypositive contribution to growth (+0.1 point), as in thehalf-finalised account. However, the GFCF ofnon-financial enterprises was adjusted slightlydownwards (-0.2% against +0.1%), which is consistentwith the tangible investment estimates according toESANE (Annual Business Statistics Program) for thesecompanies, whereas the GFCF of general governmentwas adjusted upwards (+1.8% against +1.6%). House-hold GFCF declined considerably (-2.1%), nearly asmuch as in the provisional account (-2.2%).
Household consumption expenditure declined lesssharply in volume than in the half-finalised account(-0.3% against -0.5%).
The contribution of foreign trade to growth in volumewas adjusted downwards to +0.5 points (against +0.7 points
in the half-finalised account). Imports had indeed beenrevised upwards very considerably, at a higher level thanexports, primarily due to the revision of the balance ofpayments at the time of the last publication.
Companies continued to rebuild their inventories in2012, yet at a slower pace than in 2011: the contributionof change in inventories to growth in volume remainedunchanged at 0.6 points.
The account of non-financial corporationsThe development of value added of non-financial corpo-
rations was adjusted -0.3 points downwards (+1.3% insteadof +1.6%) and growth in compensations paid by thesecorporations was adjusted +0.2 points, to +2.4%. The grossoperating surplus (GOS) was therefore in sharp decline(-1.8%), although it decreased only slightly at the time of thehalf-finalised account ( 0.4%). In addition, the balance ofproperty income deteriorated significantly. As a result, thedecrease in non-financial corporations' gross savings wasmuch stronger than in the half-finalised account (-8.9%against -3.5% before). Gross fixed capital formation (GFCF),only slightly revised (-0.4 points), was growing a little in2012, at +1.2%.
The adjustment downwards of value added andupwards of compensat ion led to a sharper dropin non-financial corporations' margin rates, which lost1.0 point (against 0.6 in the half-finalised account) tostand at 30.2% in 2012. The investment rate ofnon-financial corporations remained unchanged at22.7%, whereas the self-financing ratio was revisedsharply downwards (-4 points) in relation to the revisionof savings, which stood at 72.3%.
* Étienne Debauche, Marie Leclair, Insee.
Over all view - Slow growth for the French economy in 2014 29
Box 6 (cont'd)Households account
The growth of gross disposable income remainedunchanged at +0.5%, as the revision of current transfersoffset those of earned and property income. With theprice of final consumption expenditure also remain-ing unchanged, purchasing power remained on aclearly downward trend at -0.9% in 2012. Theincrease in household final consumption expendi-ture in value was adjusted upwards (+0.2 points to+1.2%). The savings ratio was lowered (-0.1 points to15.1%).
Main revisions on the 2013 account
The resources and uses balanceThe GDP grew 0.7% in volume in the
half-finalised 2013 account, against +0.3% in theprovisional account. Growth of the GDP in valuewas also adjusted upwards to +1.4% against+1.1%. The deflator of GDP was adjusted slightlydownwards, following an adjustment of thevolume-price split of the variation in agriculturalinventories and imports.
Regarding demand, the contribution of domesticdemand excluding inventory to GDP growth wasadjusted slightly upwards at +0.5 points instead of+0.4 points previously: gross fixed capital forma-tion (GFCP) was adjusted upwards, due to therevision of the GFCP of non-financial enterprises(+0.5% against -0.9%) and the revision of house-hold GFCP (-1.5% against -3.1%). The GFCP ofgeneral government, and especially that of finan-cial enterprises were adjusted downwards, aftertaking into account the latest data available fromthe Directorate-General for Public Finances.Household consumption bounced back a littlemore vigorously than in the provisional account(+0.4% against +0.2%), due in particular to therevision of social action consumption. Consump-tion expenditure of general government and ofNPISH (Non-profit institutions serving households)were, however, adjusted downwards to +1.7% and+0.3% respectively.
Foreign trade did not influence growth involume in the half-finalised 2013 account (against+0.1 points in the provisional account). Exportsproved to be less dynamic than estimated in theprovisional account (+1.7% against +2.2%), dueto the revision of the balance of payments at thetime of the last publication.
Companies increased inventory in 2013,whereas a destocking of inventory had beenanticipated at the time of the provisional account,before structural business statistics had beentaken into account. As a result, the contribution ofinventory to GDP growth in volume was revisedupwards significantly, to +0.2 points against aprevious -0.2 points.
The account of non-financial corporationsIn 2013, growth in non-financial corporations
value added stood at +0.9% instead of +0.3% inthe provisional account. Employee compensationwas also adjusted upwards, but to a lesser extent(+1.3% instead of +1.2%). The downturn in theGOS was much less significant (-1.1%, against-2.6% previously). As a result, the margin ratedecreased a little (-0.5 points against -0.9 points inthe provisional account), which offset the revisionmade to the 2012 account. The margin rate ofnon-financial corporations therefore stood at29.7% in 2013, like before. Furthermore, thebalance of property income was only marginallyadjusted, so that gross savings, related to therevision of value added, were adjusted significan-tly upwards (+€8.0 billion). In the half-finalisedaccount, non-financial corporation gross savingsincreased +3.1% (-1.4% previously). The grossfixed capital formation was then on an upwardtrend (+1.2%), whereas it had fallen back slightlyin the provisional account (-0.4%).
The investment rate rose slightly (+0.1 points),where it had previously been down (-0.2 points).Finally, the self-financing ratio improved in 2013(+1.4 points), although it had decreased slightly inthe provisional account.
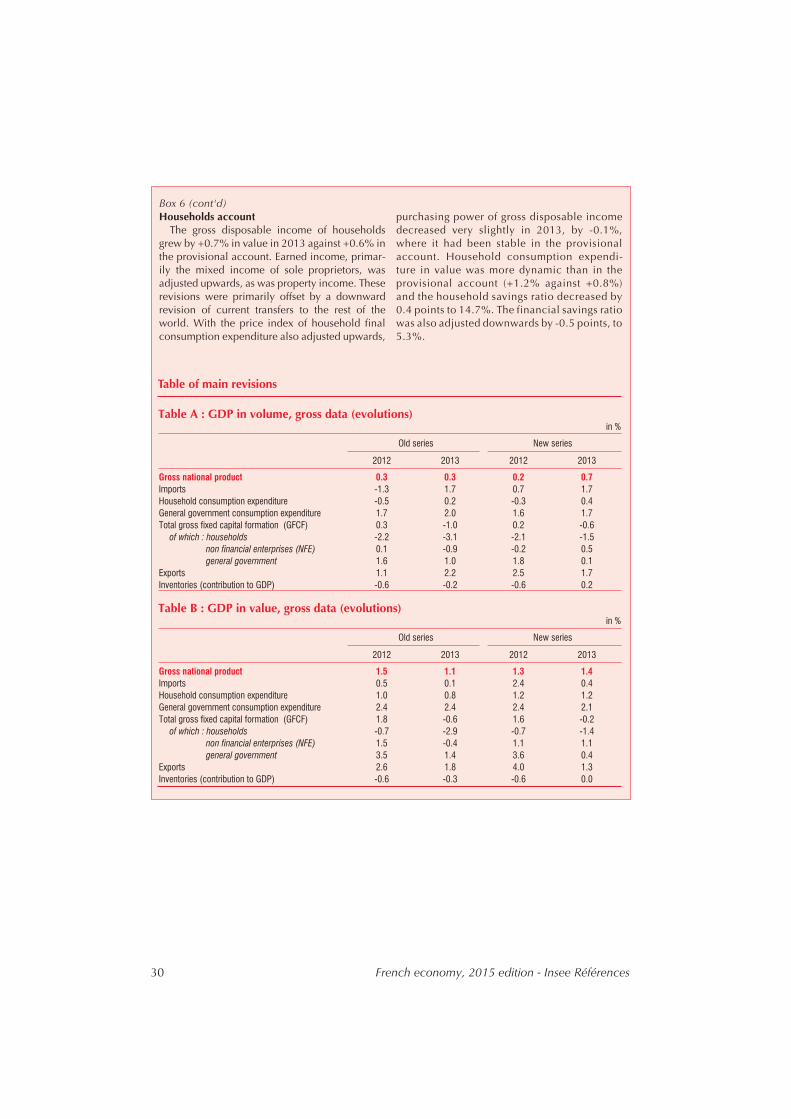
30 French economy, 2015 edition - Insee Références
Box 6 (cont'd)Households account
The gross disposable income of householdsgrew by +0.7% in value in 2013 against +0.6% inthe provisional account. Earned income, primar-ily the mixed income of sole proprietors, wasadjusted upwards, as was property income. Theserevisions were primarily offset by a downwardrevision of current transfers to the rest of theworld. With the price index of household finalconsumption expenditure also adjusted upwards,
purchasing power of gross disposable incomedecreased very slightly in 2013, by -0.1%,where it had been stable in the provisionalaccount. Household consumption expendi-ture in value was more dynamic than in theprovisional account (+1.2% against +0.8%)and the household savings ratio decreased by0.4 points to 14.7%. The financial savings ratiowas also adjusted downwards by -0.5 points, to5.3%.
Table A : GDP in volume, gross data (evolutions)in %
Old series New series
2012 2013 2012 2013
Gross national product 0.3 0.3 0.2 0.7
Imports -1.3 1.7 0.7 1.7
Household consumption expenditure -0.5 0.2 -0.3 0.4
General government consumption expenditure 1.7 2.0 1.6 1.7
Total gross fixed capital formation (GFCF) 0.3 -1.0 0.2 -0.6
of which : households -2.2 -3.1 -2.1 -1.5
non financial enterprises (NFE) 0.1 -0.9 -0.2 0.5
general government 1.6 1.0 1.8 0.1
Exports 1.1 2.2 2.5 1.7
Inventories (contribution to GDP) -0.6 -0.2 -0.6 0.2
Table B : GDP in value, gross data (evolutions)in %
Old series New series
2012 2013 2012 2013
Gross national product 1.5 1.1 1.3 1.4
Imports 0.5 0.1 2.4 0.4
Household consumption expenditure 1.0 0.8 1.2 1.2
General government consumption expenditure 2.4 2.4 2.4 2.1
Total gross fixed capital formation (GFCF) 1.8 -0.6 1.6 -0.2
of which : households -0.7 -2.9 -0.7 -1.4
non financial enterprises (NFE) 1.5 -0.4 1.1 1.1
general government 3.5 1.4 3.6 0.4
Exports 2.6 1.8 4.0 1.3
Inventories (contribution to GDP) -0.6 -0.3 -0.6 0.0
Table of main revisions
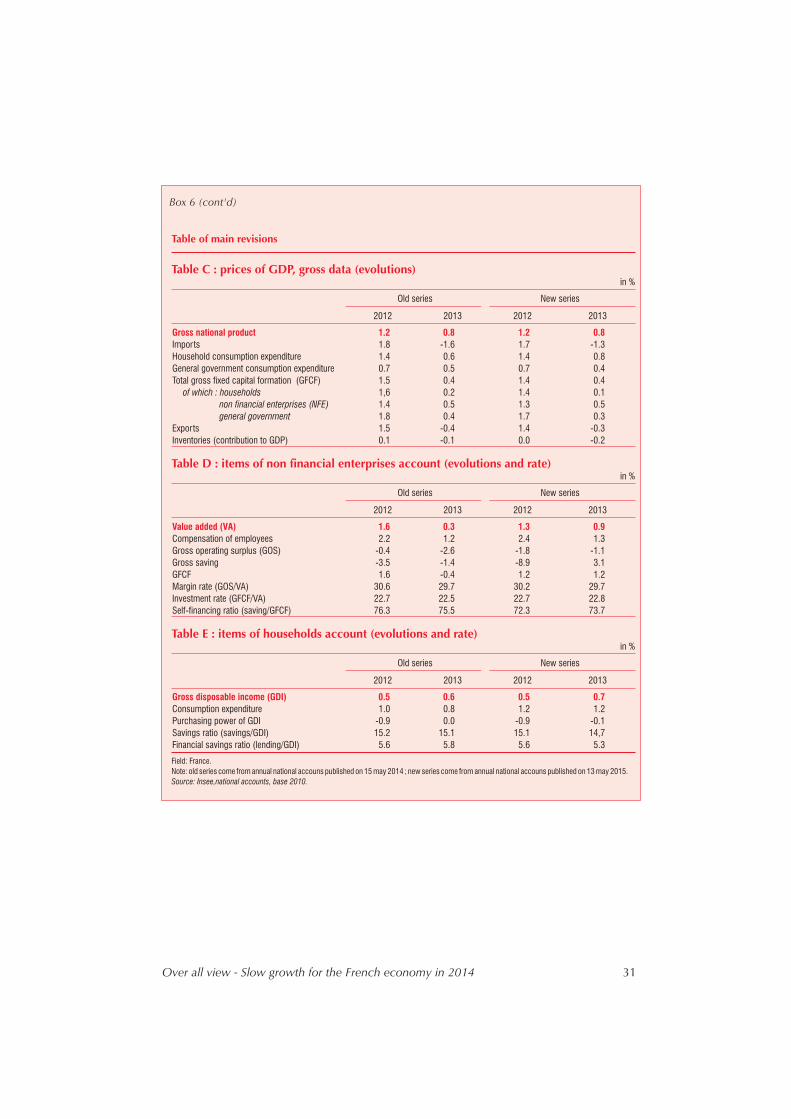
Over all view - Slow growth for the French economy in 2014 31
Box 6 (cont'd)
Table C : prices of GDP, gross data (evolutions)in %
Old series New series
2012 2013 2012 2013
Gross national product 1.2 0.8 1.2 0.8
Imports 1.8 -1.6 1.7 -1.3
Household consumption expenditure 1.4 0.6 1.4 0.8
General government consumption expenditure 0.7 0.5 0.7 0.4
Total gross fixed capital formation (GFCF) 1.5 0.4 1.4 0.4
of which : households 1,6 0.2 1.4 0.1
non financial enterprises (NFE) 1.4 0.5 1.3 0.5
general government 1.8 0.4 1.7 0.3
Exports 1.5 -0.4 1.4 -0.3
Inventories (contribution to GDP) 0.1 -0.1 0.0 -0.2
Table D : items of non financial enterprises account (evolutions and rate)in %
Old series New series
2012 2013 2012 2013
Value added (VA) 1.6 0.3 1.3 0.9
Compensation of employees 2.2 1.2 2.4 1.3
Gross operating surplus (GOS) -0.4 -2.6 -1.8 -1.1
Gross saving -3.5 -1.4 -8.9 3.1
GFCF 1.6 -0.4 1.2 1.2
Margin rate (GOS/VA) 30.6 29.7 30.2 29.7
Investment rate (GFCF/VA) 22.7 22.5 22.7 22.8
Self-financing ratio (saving/GFCF) 76.3 75.5 72.3 73.7
Table E : items of households account (evolutions and rate)in %
Old series New series
2012 2013 2012 2013
Gross disposable income (GDI) 0.5 0.6 0.5 0.7
Consumption expenditure 1.0 0.8 1.2 1.2
Purchasing power of GDI -0.9 0.0 -0.9 -0.1
Savings ratio (savings/GDI) 15.2 15.1 15.1 14,7
Financial savings ratio (lending/GDI) 5.6 5.8 5.6 5.3
Table of main revisions
Field: France.
Note: old series come from annual national accouns published on 15 may 2014 ; new series come from annual national accouns published on 13 may 2015.
Source: Insee,national accounts, base 2010.