slides module 1 - memberfiles.freewebs.com · - defining a business strategy ... one large...
TRANSCRIPT

IntroductionSession 1
Prof. Christian Terwiesch

Operations in a Restaurant
Prof. Christian Terwiesch

Operations in an Emergency Room
Prof. Christian Terwiesch

Four Dimensions of Performance
Cost▪ Efficiency
Quality▪ Product quality (how good?)
▪ Process quality (as good▪ Process quality (as good as promised?)
Time▪ Responsiveness to
demand
Variety▪ Customer heterogeneity
Important for- Performance measurement- Defining a business strategy
Prof. Christian Terwiesch
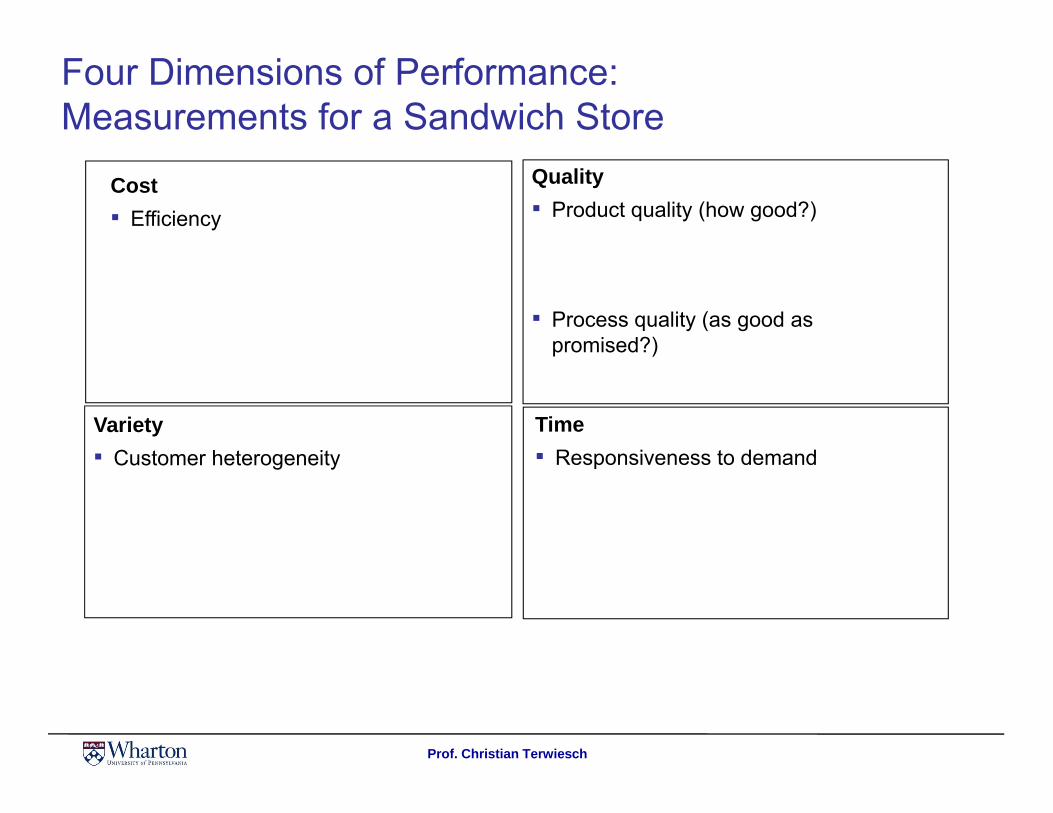
Four Dimensions of Performance: Measurements for a Sandwich Store
Cost▪ Efficiency
Quality▪ Product quality (how good?)
▪ Process quality (as good as promised?)
Time▪ Responsiveness to demand
p )
Variety▪ Customer heterogeneity ▪ Responsiveness to demand▪ Customer heterogeneity
Prof. Christian Terwiesch

IntroductionSession 2
Prof. Christian Terwiesch

Four Dimensions of Performance: Trade-offs
Cost▪ Efficiency▪ Measured by:
Quality▪ Product quality (how good?)
=> Price▪ Process quality (as good- cost per unit
- utilization
▪ Process quality (as good as promised?)=> Defect rate
Time▪ Responsiveness to
Variety▪ Customer heterogeneity p
demand▪ Measured by:
- customer lead time- flow time
Customer heterogeneity▪ Measured by:
- number of options- flexibility / set-ups
make to order
Prof. Christian Terwiesch
- flow time- make-to-order

What Can Ops Management (This Course) Do to Help? Step 1: Help Making Operational Trade-Offs
ResponsivenessHigh
Very short waiting times,Comes at the expense ofFrequent operator idle time
Trade-off Long waiting times,
yet operators are almostfully utilized
Example: Call center of a large retail bank
Labor Productivity(e.g. $/call)
Low
Low laborproductivity
High laborproductivity
y
Example: Call center of a large retail bank- objective: 80% of incoming calls wait less than 20 seconds - starting point: 30% of incoming calls wait less than 20 seconds- Problem: staffing levels of call centers / impact on efficiency
Prof. Christian Terwiesch
OM helps: Provides tools to support strategic trade-offs

What Can Ops Management (This Course) Do to Help?Step 2: Overcome Inefficiencies
Responsiveness
HighCurrent frontier
Eliminate inefficiencies
In the industry
Competitor A
Low
Competitor C
Competitor B
Labor Productivity(e.g. $/call)
Low laborproductivity
High laborproductivity
Competitor B
Example:• Benchmarking shows the pattern above• Don’t just manage the current system… Change it!
Provides tools to identify and eliminate inefficiencies => Define Efficient Frontier
Prof. Christian Terwiesch
Types of inefficiencies:-Poor process design- Inconsistencies in activity network

What Can Ops Management (This Course) Do to Help?Step 3: Evaluate Proposed Redesigns/New Technologies
Responsiveness
HighHigh
Redesignprocess
Current frontierNew frontier
LowIn the industry
Labor Productivity( $/ )
Low labor High labor
Example:• What will happen if we develop / purchase technology X?
Better technologies are al a s (?) nice to ha e b t ill the pa ?
(e.g. $/call)productivity productivity
Prof. Christian Terwiesch
• Better technologies are always (?) nice to have, but will they pay?
OM helps: Evaluates system designs before they occur

Example: The US Airline Industry
Prof. Christian Terwiesch

Example: The US Airline Industry
Prof. Christian Terwiesch

IntroductionSession 3
Prof. Christian Terwiesch

Course Outline / Grading / Homework
Objective of the course: Understanding and improving business processes
Performance measuresHow-to
Mix of industries: healthcare restaurants automotive computers call centers banking etcMix of industries: healthcare, restaurants, automotive, computers, call centers, banking, etc
Course OutlineIntroduction (0.5 weeks)1. Process analysis (1.5 weeks)2. Productivity3. Product variety 4. Responsiveness 5. Quality
Requirements / Prerequisites: There are no prerequisites for the course
Some modules require statistical knowledge (standard deviation, normal distribution)
Homework assignmentsOne large assignment after each module (five assignments); 10% each
Final exam with questions from all modules; 50%
Prof. Christian Terwiesch
q ;

Text Book
Course book Cachon, Gerard, Christian Terwiesch, Matching Supply with Demand: An Introduction to Operations Management, 3rd edition, Irwin - McGraw Hill, 2012 (ISBN 978-0073525204, 507 pages)
Prof. Christian Terwiesch

Personal IntroductionMBA core course: Operations Management: Quality and Productivity
Taught ~ 60 times ~ 4000 MBA students
Research: Operations Management, focus on Healthcare Management
Innovation tournaments and contests
Christian Terwiesch Andrew M. Heller Professor at the Wharton SchoolSenior Fellow Leonard Davis Institute for Health EconomicsSenior Fellow Leonard Davis Institute for Health Economics
573 Jon M. Huntsman Hall Philadelphia, PA 19104.6366
Prof. Christian Terwiesch

Process AnalysisSession 1
Prof. Christian Terwiesch

Subway – Sitting in Front of the Store
Prof. Christian Terwiesch

Subway – Sitting in Front of the Store
Prof. Christian Terwiesch

Processes: The Three Basic Measures
• Flow rate / throughput: number of flow units going through the process per unit of time
• Flow Time: time it takes a flow unit to go from the beginning to the end of the process
• Inventory: the number of flow units in the process at a given moment in time
• Flow Unit: Customer or SandwichFlow Unit: Customer or Sandwich
Prof. Christian Terwiesch
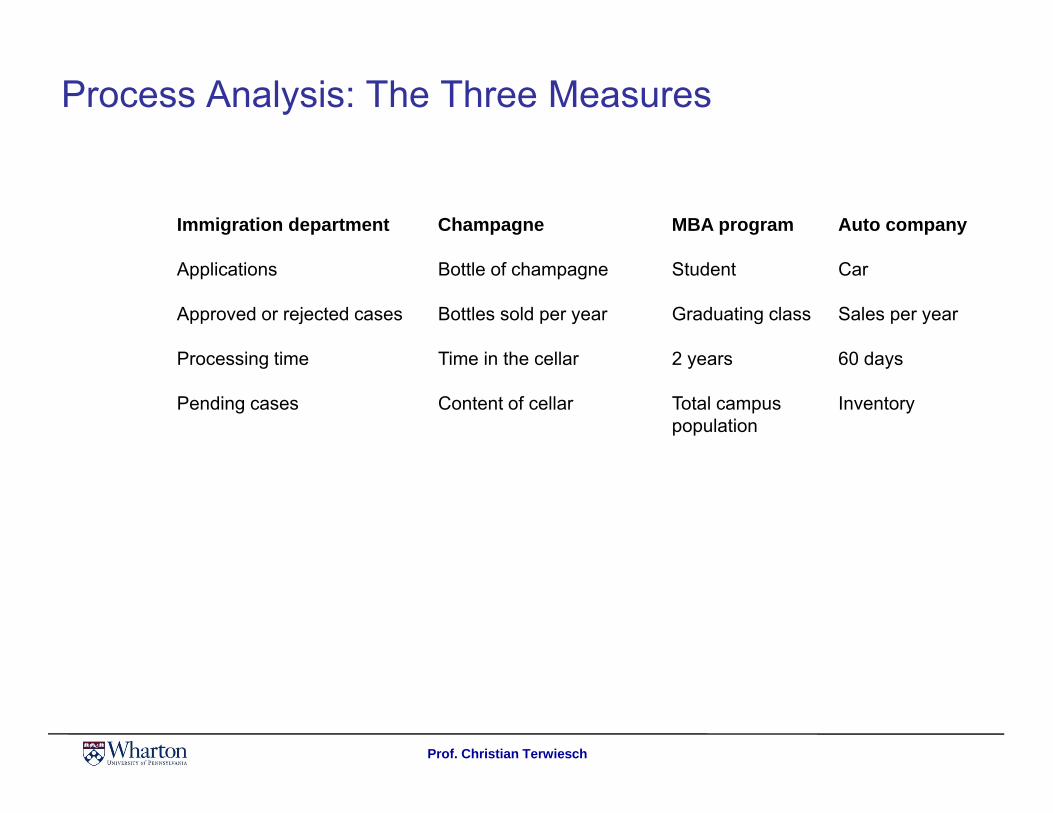
Process Analysis: The Three Measures
Immigration department Champagne MBA program Auto company
Applications
Approved or rejected cases
Processing time
Bottle of champagne
Bottles sold per year
Time in the cellar
Student
Graduating class
2 years
Car
Sales per year
60 daysProcessing time
Pending cases
Time in the cellar
Content of cellar
2 years
Total campus population
60 days
Inventory
Prof. Christian Terwiesch

Why Do We Care About Inventory?
About $1 Trillion in Inventory in the US EconomyAbout $1 Trillion in Inventory in the US Economy
That is manufacturing inventory alone
Prof. Christian Terwiesch

Why Do We Care About Inventory? (ctd)
Inventory corresponds to Supply Demand mismatchesInventory corresponds to Supply-Demand mismatches
That is inventory waiting for customers, but also customers wait for products and services
Service Examples ER Wait Times: 58-year-old Michael Herrara of Dallas died of a heart attack after an estimated 19
h i th l l H it l ERhours in the local Hospital ERSome ER’s now post expected wait times online / via Apps
It takes typically 45 days do get approval on a mortgage; Strong link between wait times and conversion
Waiting times for drive through at McDonald’s: 159 seconds; Long queues deter customers to join Waiting times for drive-through at McDonald s: 159 seconds; Long queues deter customers to join
Production Examples• Buying an Apple computer
B i D ll t
Prof. Christian Terwiesch
• Buying a Dell computer=> Make-to-order vs Make-to-Stock
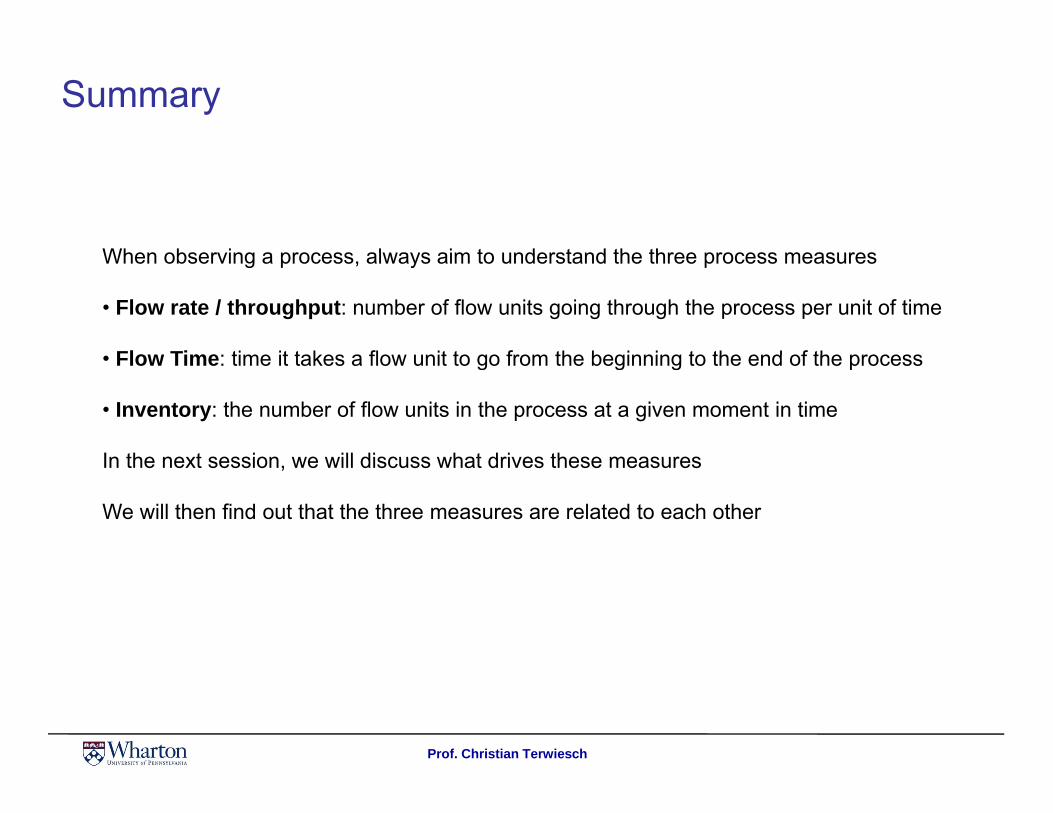
Summary
When observing a process always aim to understand the three process measuresWhen observing a process, always aim to understand the three process measures
• Flow rate / throughput: number of flow units going through the process per unit of time
Flow Time: time it takes a flow unit to go from the beginning to the end of the process• Flow Time: time it takes a flow unit to go from the beginning to the end of the process
• Inventory: the number of flow units in the process at a given moment in time
In the next session we will discuss what drives these measuresIn the next session, we will discuss what drives these measures
We will then find out that the three measures are related to each other
Prof. Christian Terwiesch

Process AnalysisSession 2
Prof. Christian Terwiesch

Process Analysis
In this session, we will take you INSIDE the black box
Specifically, you will learn how to:
1. Create a process flow diagram
2. Find the bottleneck of the process and determine the maximum flow rate
3 Conduct a basic process analysis3. Conduct a basic process analysis
Prof. Christian Terwiesch

Subway – Inside the Store
Prof. Christian Terwiesch

Drawing a Process Flow Diagram
Prof. Christian Terwiesch

Drawing a Process Flow Diagram
Customers Station 1 Station 2 Station 3
Symbols in a process flow diagram
Difference between project management and process management
Prof. Christian Terwiesch

Basic Process Vocabulary
• Processing times: how long does the worker spend on the task?
• Capacity=1/processing time: how many units can the worker make per unit of timeIf there are m workers at the activity: Capacity=m/activity time
• Bottleneck: process step with the lowest capacity
• Process capacity: capacity of the bottleneck
• Flow rate =Minimum{Demand rate, Process Capacity)
• Utilization =Flow Rate / Capacity
• Flow Time: The amount of time it takes a flow unit to go through the process
• Inventory: The number of flow units in the system
Prof. Christian Terwiesch
Inventory: The number of flow units in the system
Process AnalysisSession 3
Prof. Christian Terwiesch

Labor Productivity MeasuresTi
me
a2
a4
Bottleneck=Idle Time =Processing time
a1
Pro
cess
ing
a• Cycle time CT= 1/ Flow Rate
Di t L b C t t
Labor Productivity Measures
P a3 Direct Labor Content=p1+p2+p3+p4If one worker per resource:
Direct Idle Time=(CT-p1) +(CT-p2) +(CT-p3)
A l b tili ti1 2 3 4
• Capacityi =
Review of Capacity CalculationsResources ofNumber i
time idle direct content labor content labor
• Average labor utilization
Capacityi
• Process Capacity=Min{Capacityi}
• Flow Rate = Min{Demand Capacity}
iTime Processing
timeofunitperRateFlow time of unit perwages Total
• Cost of direct labor
Prof. Christian Terwiesch
Flow Rate Min{Demand, Capacity}
• Utilizationi=iCapacity
Rate Flow
p

Example: Assembly Line with Six Stations
3 min/unit 5 min/unit 2 min/unit 3 min/unit 6 min/unit 2 min/unit
Prof. Christian Terwiesch

100%
The Role of Labor Costs in Manufacturing: The Auto Industry
70%
80%
90%
100%
QualityWarrantyOverheadOther
30%
40%
50%
60%
Purchasedparts andassemblies
Parts andmaterialcosts Logistics costs
Assembly and otherLabor costs
0%
10%
20%
30%
Fi l I l di I l di R ll d
Material costs
Final Assembler’s cost
IncludingTier 1Costs
IncludingTier 2Costs
Rolled-upCosts over~ 5 Tiers
• While labor costs appear small at first, they are importantlook relative to value added- look relative to value added
- role up costs throughout the value chain
• Implications
Prof. Christian Terwiesch
- also hunt for pennies (e.g. line balancing) - spread operational excellence through the value chain
Source: Whitney / DaimlerChrysler