slide title here
TRANSCRIPT

Transformation Update
Board of Trustees – September 20, 2021

Summary of Progress
● Launched the core teams and sub-teams for Student Experience, Academic Operations, and Administrative Operations
○ All teams focused on Discovery work through the end of October
● Workforce Development teams scheduled to kick off in October
● Several key deliverables needed for design and development are on track
○ Mission and Vision for the New Combined Entity (NCE) in development
○ Program Array work progressing toward governance process
○ Naming and Branding initiative for the NCE
Discovery Design Development Launch Review
Gate Gate Gate Launch
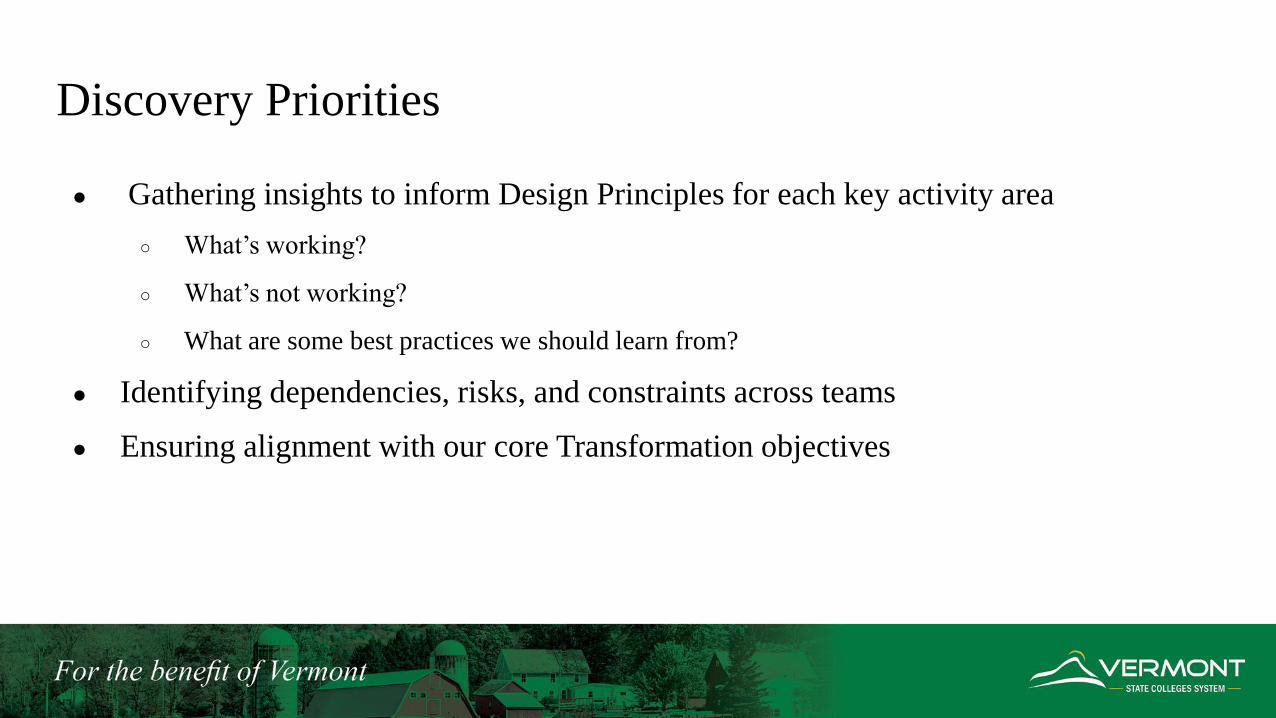
Discovery Priorities
● Gathering insights to inform Design Principles for each key activity area
○ What’s working?
○ What’s not working?
○ What are some best practices we should learn from?
● Identifying dependencies, risks, and constraints across teams
● Ensuring alignment with our core Transformation objectives

Risks and Dependencies
● Sequencing the work of NECHE’s process while executing on Transformation
● Capacity challenges of gaining faculty governance approval of programs, policies,
and other shared governance priorities
● Managing the scope of change to match student needs, capacity, and schedule
constraints
○ Sequencing changes and process improvements
○ Adding temporary capacity as needed to support the work of teams

Academic Operations
Accomplishments Priorities Looking Ahead
• First draft of program array completed• Sub-team discovery focusing on student
success, access, best practices
• Evaluation of array for cost and mission• Professional development regarding
modalities and DEI priorities• Defining Gen Ed
Issues and Dependencies
• Capacity of governance structures and processes to evaluate programs and policies • Complexity of merging and supporting scheduling across programs and institutions• Scope of development needed in systems and technologies (delivery modalities)

Student ExperienceAccomplishments Priorities Looking Ahead
• Delivered name recommendation for Board consideration
• Drafted Transformation FAQ for use in Fall recruitment
• Kicked off Discovery across all sub-teams• Established cross-functional team to
recommend tuition pricing approach
• Discovery concerning alignment across student service functions
• Strategy and approach for the website • Discovery must address diversity, equity,
and inclusion goals
Issues and Dependencies
• Academic program and co-curricular offering decisions and communication of implications for admissions, student and residence life, and marketing.
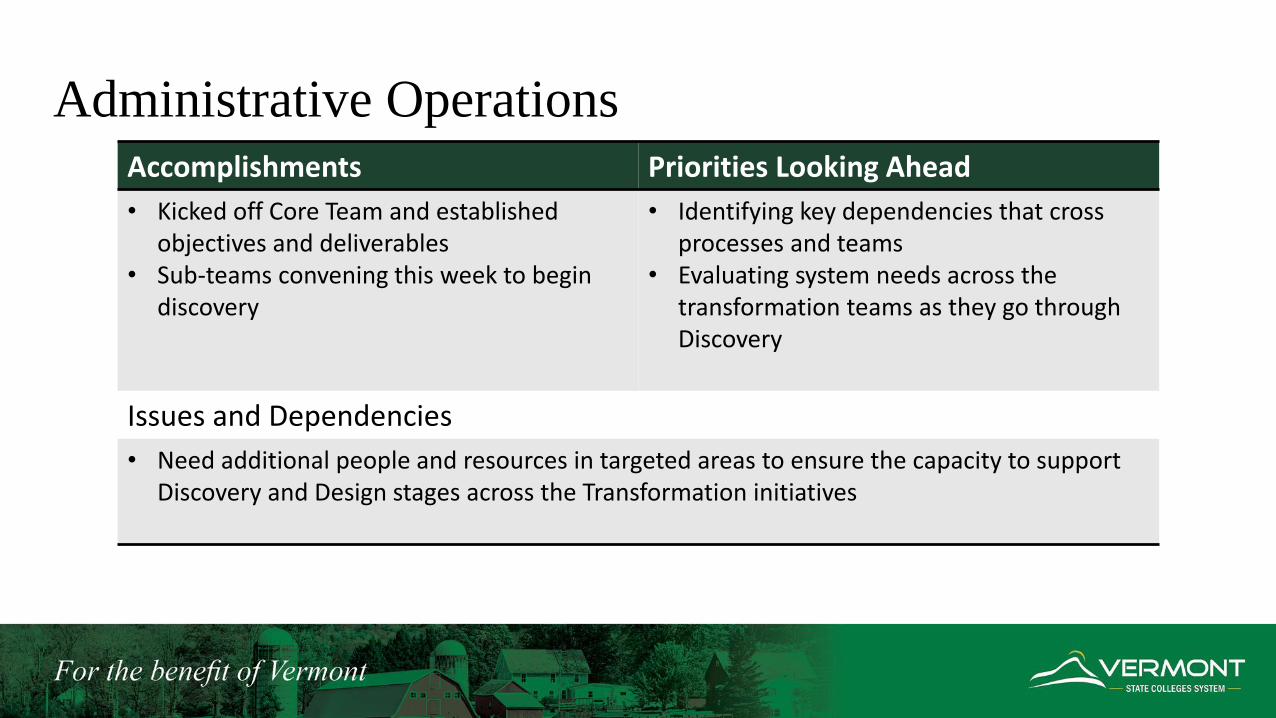
Administrative OperationsAccomplishments Priorities Looking Ahead
• Kicked off Core Team and established objectives and deliverables
• Sub-teams convening this week to begin discovery
• Identifying key dependencies that cross processes and teams
• Evaluating system needs across the transformation teams as they go through Discovery
Issues and Dependencies
• Need additional people and resources in targeted areas to ensure the capacity to support Discovery and Design stages across the Transformation initiatives
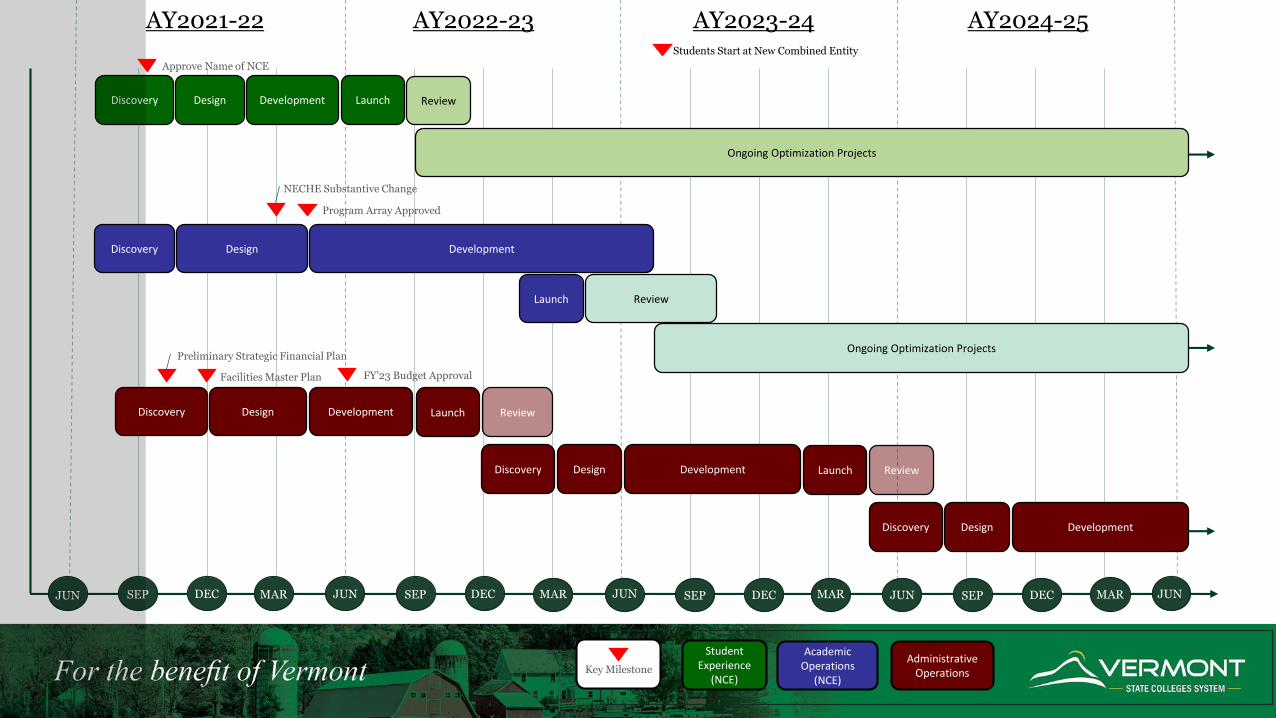
JUN SEP DEC JUNMAR SEP DEC JUNMAR SEP DEC JUNMAR SEP DEC MAR JUN
AY2021-22 AY2022-23 AY2023-24 AY2024-25Students Start at New Combined Entity
Discovery Design Development Launch Review
Discovery Design Development
Launch Review
Discovery Design Development Launch Review
Discovery Design Development Launch Review
Student Experience
(NCE)
Administrative Operations
Academic Operations
(NCE)
Discovery Design Development
Ongoing Optimization Projects
Ongoing Optimization Projects
Program Array Approved
FY’23 Budget ApprovalFacilities Master Plan
Preliminary Strategic Financial Plan
NECHE Substantive Change
Approve Name of NCE
Key Milestone
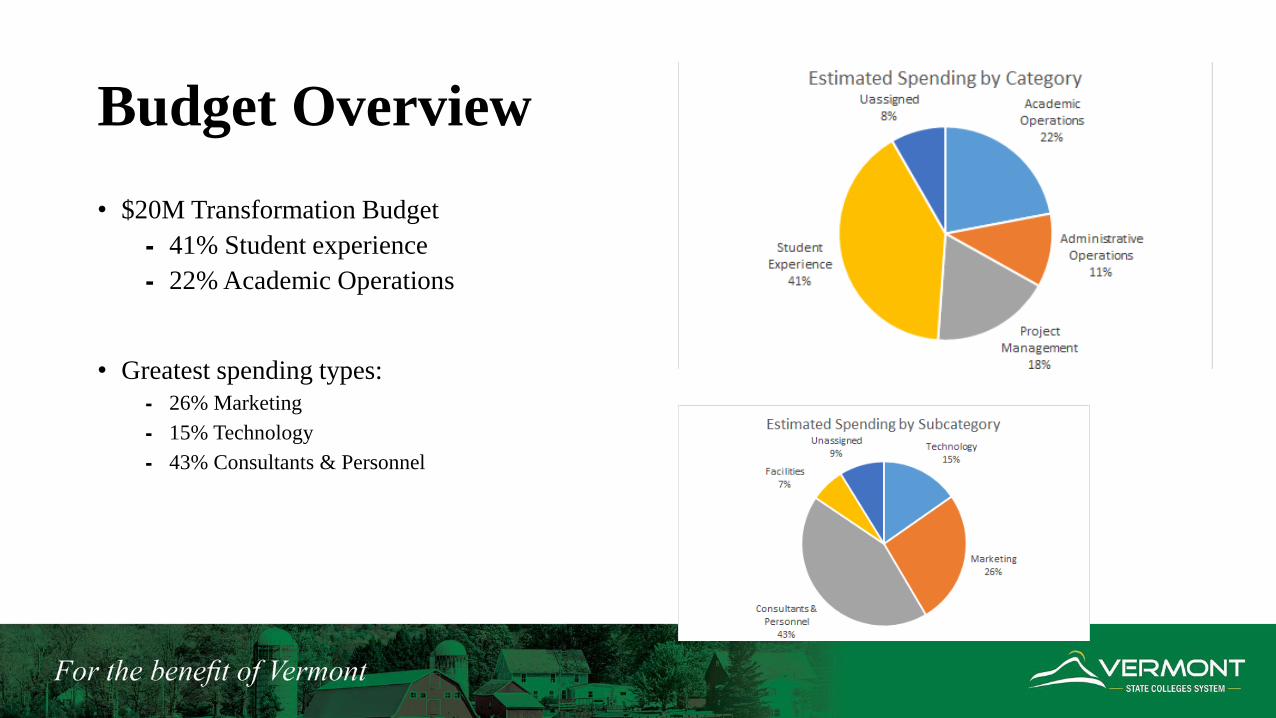
Budget Overview
• $20M Transformation Budget
⁃ 41% Student experience
⁃ 22% Academic Operations
• Greatest spending types:
⁃ 26% Marketing
⁃ 15% Technology
⁃ 43% Consultants & Personnel
Additional Board Considerations
● About which additional elements of Transformation would the Board like more detail in future updates?
● Are there any transformation activities that are not important to the Board?
● Resource and timing tradeoffs – faster progress to cutting costs vs. foundation for the future?

Accountability Dashboard

Prioritizing Measures for the Dashboard
● Evaluated the proposed measures for both availability and impact
● Highlighted the metrics that we would prioritize in the short, medium, and long-term
● Prioritized metrics will be presented to relevant committees
Example:
Financial Stability Ratio

Considerations
● Are the measures we prioritized the right place to start?
● Are there other measures on the list we should prioritize in each category?
● Are there other measures not on the list that we should consider?

Month Approve Originator Review Action Originator
Sep 2021 NCE Name All Draft Strategic Financial Plan Review All
Oct 2021 Draft Program Array EPSL NCE Brand Review All
Mission & Vision EPSL Dashboard Update: Financial & Affordability Review F&F
External Audit Audit
Dec 2021 Facilities Planning: Space Utilization,
Return on Assets & 10 Year Direction
F&F
Feb 2022 FY2023 Budget: 1st Pass Review F&F
Mar 2022 NCE Substantive Change Request Review EPSL
Dashboard Update: Accessibility Review EPSL
Apr 2022 NCE President All FY2023 Budget: 2nd Pass Review F&F
NCE Tuition Model - FY2024 F&F
FY2023 VSCS Tuition Maximums F&F
May 2022 FY2023 Budget F&F Faculty Governance Recommendations Review EPSL
Academic Programs Update

Board Authority
The Board of Trustees may confer such honors and degrees as are usually given in colleges and universities and any other appropriate degrees and shall appoint a chancellor of the Corporation and a president for each institution under its control and prescribe their duties, salaries, and terms of office. The Board shall make bylaws and regulations for the government of its meetings and each institution under its control prescribing among other things, the terms of admission, courses of instruction, educational standards, rates of tuition, scholarships, and other student aids. 16 V.S.A. § 2171
See presentation on Board Authority and Locating Responsibility 3-27-2021

Faculty Governance Role
NECHE Accreditation Standard 3: Organization and Governance
“The institution places primary responsibility for the content, quality, and effectiveness of the curriculum with its faculty.” (3.15)
VSC Full-time Faculty Contract, Article 19: Faculty Governance
“Recognizing the final determining authority of the President, matters of academic concern shall be initiated by the Faculty Assembly or by the President through the Faculty Assembly which shall consider the matter and respond within a reasonable time. Such matters shall include…the development, curtailment or reorganization of academic programs.”

Board Priorities for Programs (Fall 2020)
AFFORDABILITY: Cost and debt are not access barriers for students.
ACCESSIBILITY: Increased access to VSCS programs regardless of race/ethnicity, age, educational attainment of parents, prior educational experience, family status, or place of residence.
QUALITY: The ability of VSCS graduates to meet externally-recognized measures of achievement (i.e. licensure exam success rates) and their preparation to compete in the global workforce.
RELEVANCE: Development of degree paths that are relevant to student goals and expectations of value in a career.
See VSCS Strategic Priorities adopted October 16, 2020.

Program Analysis Goals (Spring 2021, rpkGROUP)
1. Develop a framework for evaluating current academic programs within the VSCS portfolio;
2. Identify gaps in the VSCS’s existing academic portfolio relative to the demands of Vermont’s labor market;
3. Recommend an ideal portfolio of programs that meets the needs of Vermont students and the work force; and
4. Design action plans to help the VSCS implement the recommended academic portfolio.
See System Transformation Proposal approved by the Board, Feb. 22, 2021.
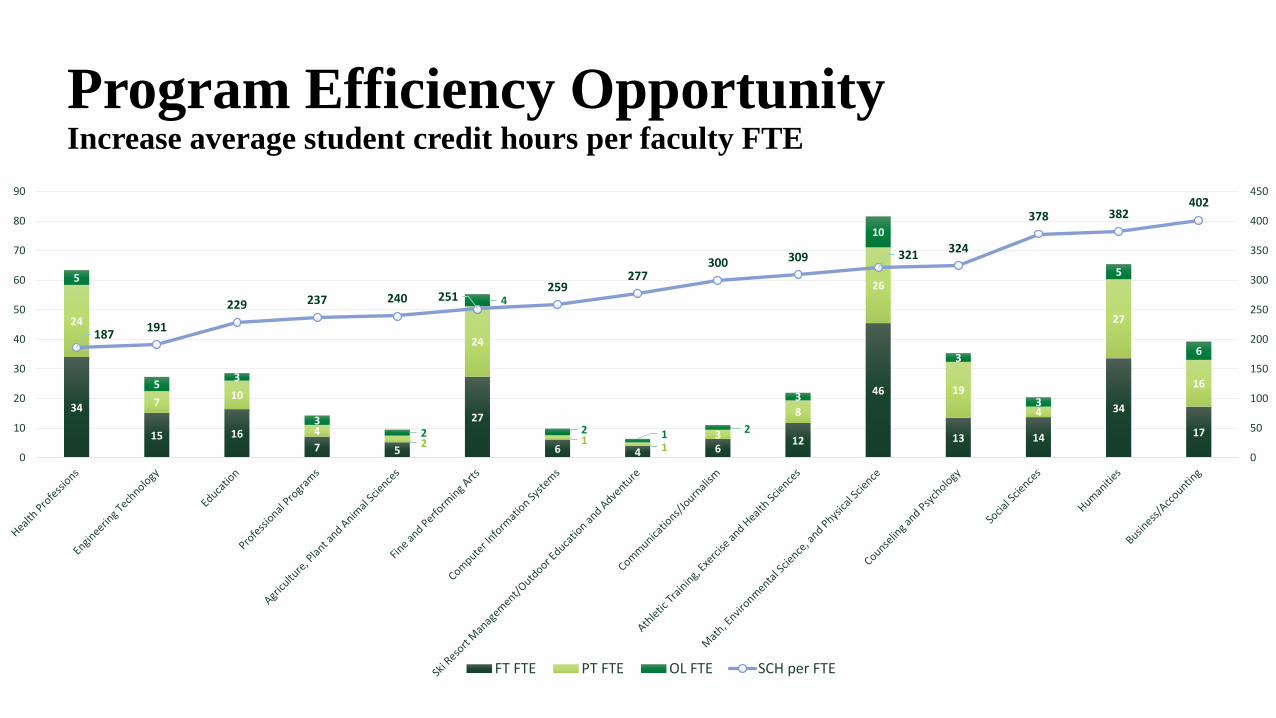
Program Efficiency OpportunityIncrease average student credit hours per faculty FTE
34
15 167 5
27
6 4 612
46
13 14
34
17
24
710
42
24
11
3
8
26
19
4
27
16
5
53
32
4
2 1 2
3
10
3
3
5
6
187191
229 237 240 251259
277300 309 321
324
378 382402
0
50
100
150
200
250
300
350
400
450
0
10
20
30
40
50
60
70
80
90
FT FTE PT FTE OL FTE SCH per FTE
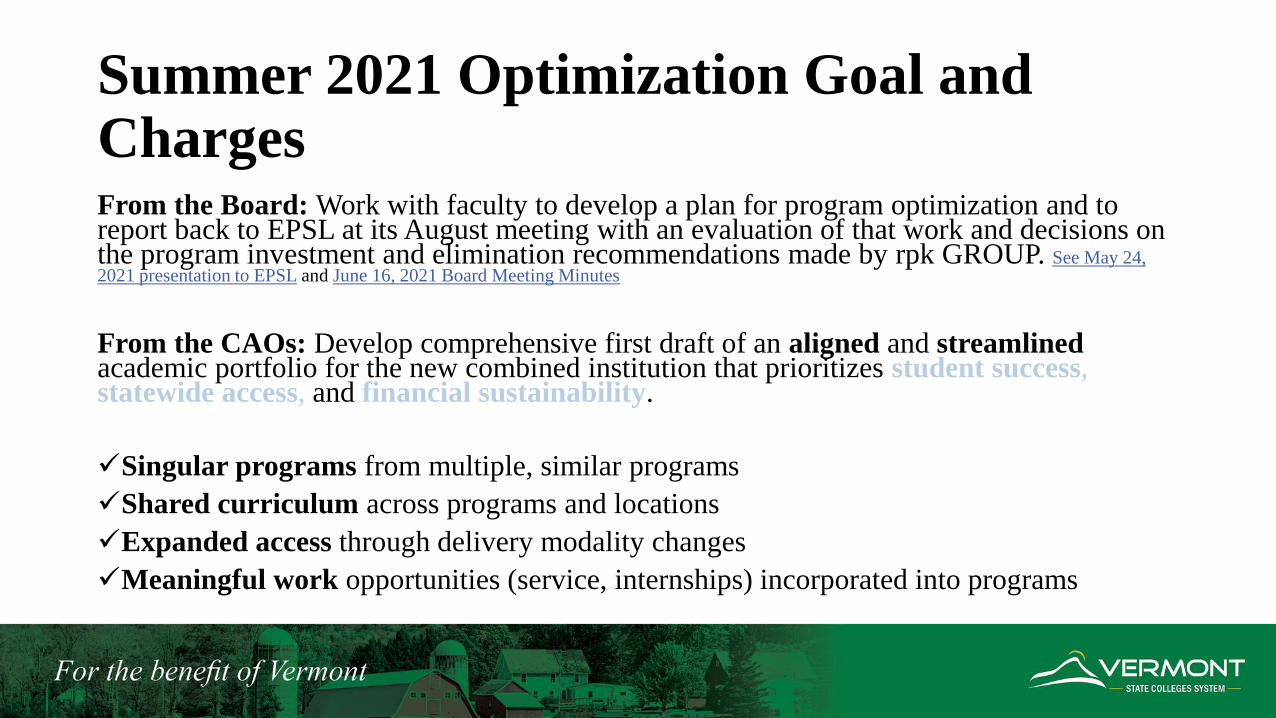
Summer 2021 Optimization Goal and ChargesFrom the Board: Work with faculty to develop a plan for program optimization and to report back to EPSL at its August meeting with an evaluation of that work and decisions on the program investment and elimination recommendations made by rpk GROUP. See May 24, 2021 presentation to EPSL and June 16, 2021 Board Meeting Minutes
From the CAOs: Develop comprehensive first draft of an aligned and streamlinedacademic portfolio for the new combined institution that prioritizes student success, statewide access, and financial sustainability.
Singular programs from multiple, similar programs
Shared curriculum across programs and locations
Expanded access through delivery modality changes
Meaningful work opportunities (service, internships) incorporated into programs

100+ quality programs from 250+ original programs and concentrations
Nursing &
Health
Professions
8 programs
(1 graduate)
Business &
Accounting
7 programs
(1 graduate)
Athletic
Training,
Exercise &
Health
Sciences
6 programs
(1 graduate)
Communica-
tions &
Journalism
2 programs
Counseling &
Psychology
8 programs
(2 graduate)
Education
4 programs
(1 graduate)
Engineering
12 programs
Humanities
5 programs
Math &
Sciences
17 programs
(1 graduate)
Professional
Programs
5 Programs
Outdoor Ed &
Leadership
1 Program
Social
Sciences
7 programs
Graphic
Design, Fine &
Performing
Arts
13 programs
Agriculture,
Plant &
Animal
Sciences
5 programs

Preliminary Evaluation
August 2021: Consensus determination by CAOs:
Does the optimization proposal meet the goals and charges?
46 Programs Yes, optimized program fully meets the goals and charges and should move ahead.
39 Programs Review and refine proposal. 13 now moved to green
16 Programs Significant additional work and review. 2 to yellow

Stage-Gates for Academic Program Array
Discovery Design Development Launch Review
Gate Gate Gate Launch
Discovery (through Oct 2021) includes:• rpk GROUP analysis• Program optimization proposals• Delivery modalities and locations• Mission alignment evaluation• Financial sustainability evaluation
Design (through May 2022) will include:• Revisions and final review of proposed
programs via faculty governance process.
• Delivery modality definition at program level.

Mission and Financial Sustainability Review
“No margin, no mission”
Priorities: Does the balance of programs in the array reflect the priorities of the mission, including the ability to continuously advance those priorities?
Scope: Does the array provide maximum sustainable breadth in alignment with mission?

Additional Board Considerations
In achieving financial sustainability, we will need to balance our priority on statewide access regardless of modality.
The nature of campus experiences will likely evolve as programs include increasing proportions of flexible remote learning.
Some programs are embedded in existing mission or history but may not be independently sustainable in the array.

Board Role in Next Steps
October 15, 2021 EPSL meeting: review proposed program array
• all programs meeting optimization goals and reviewed for mission alignment and financial sustainability
• all other programs with projected timeline and next steps (continued optimization work, additional review, potential closure).
May 23, 2022 EPSL meeting: review status of faculty governance recommendations on proposed program array
NCE Vision & Mission Update

Creating the NCE Vision and Mission
The work of transformation needs answers to these questions:
⁃ What are we creating?
⁃ What kind of institution does the NCE aspire to be?
⁃ What are the institution’s purposes?

Creating the NCE Vision and Mission

Vision
• What kind of an institution are we creating?
• What kind of institution does the NCE aspire to be?
Mission• Authentic expression of what’s important about the institution
• A statement of what you do and why you do it – why does the institution exist?
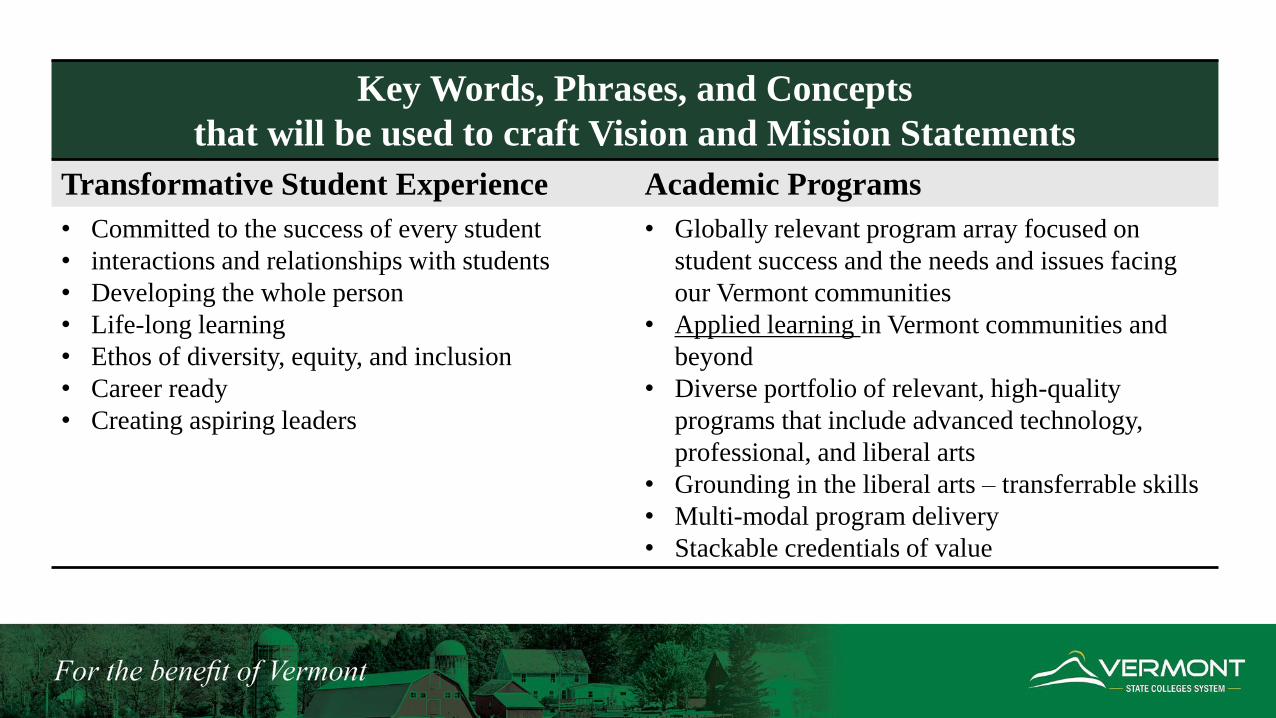
Key Words, Phrases, and Concepts
that will be used to craft Vision and Mission Statements
Transformative Student Experience Academic Programs
• Committed to the success of every student
• interactions and relationships with students
• Developing the whole person
• Life-long learning
• Ethos of diversity, equity, and inclusion
• Career ready
• Creating aspiring leaders
• Globally relevant program array focused on
student success and the needs and issues facing
our Vermont communities
• Applied learning in Vermont communities and
beyond
• Diverse portfolio of relevant, high-quality
programs that include advanced technology,
professional, and liberal arts
• Grounding in the liberal arts – transferrable skills
• Multi-modal program delivery
• Stackable credentials of value
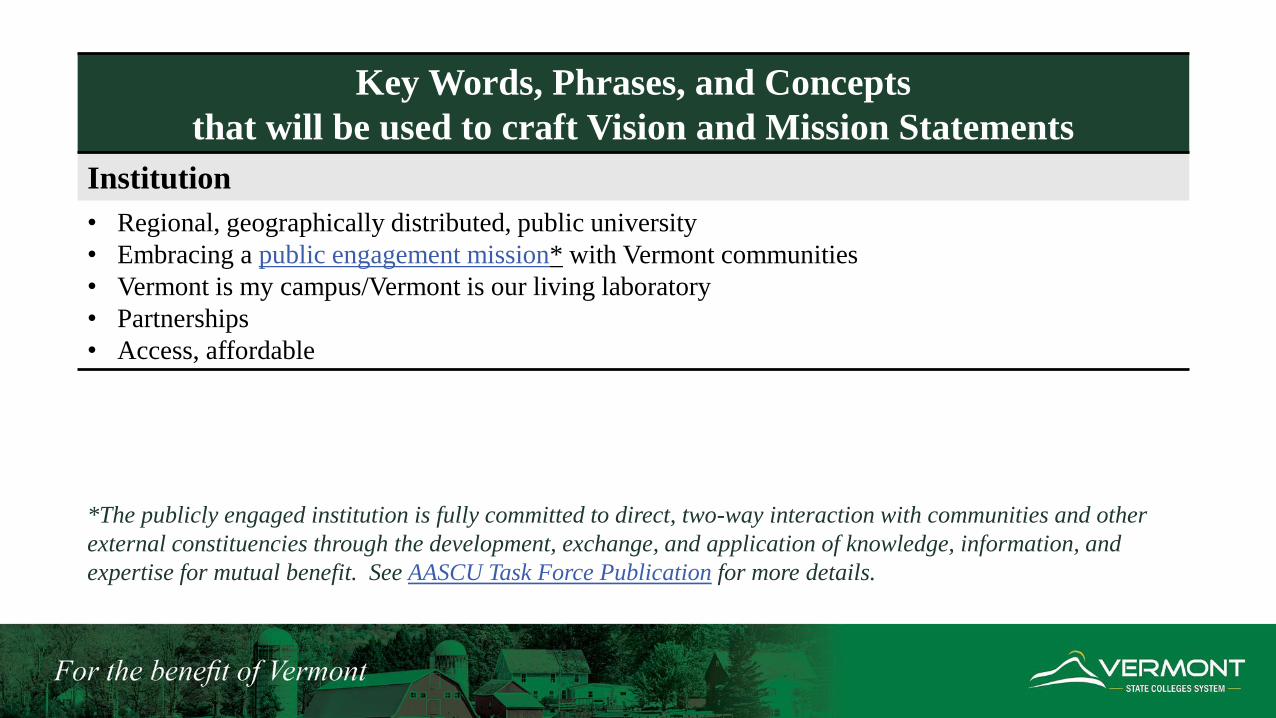
Key Words, Phrases, and Concepts
that will be used to craft Vision and Mission Statements
Institution
• Regional, geographically distributed, public university
• Embracing a public engagement mission* with Vermont communities
• Vermont is my campus/Vermont is our living laboratory
• Partnerships
• Access, affordable
*The publicly engaged institution is fully committed to direct, two-way interaction with communities and other
external constituencies through the development, exchange, and application of knowledge, information, and
expertise for mutual benefit. See AASCU Task Force Publication for more details.

Next Steps
• Collecting additional feedback:
Faculty across the system
Transformation Listening Tour Town Halls
Vision Point Survey
• A cross-institutional working group will synthesize current thinking and additional feedback and begin crafting vision and mission statements
• Presentation to the Board at 25 October, 2021 meeting

Financial UpdateSeptember 20, 2021

“Balancing an approved budget is an important [and] noteworthy achievement.
Yet a balanced budget is not necessarily a sign that all is financially well. A budget may underfund depreciation, for example. This strategy can be useful to bridge a short-term budget gap, but chronic underfunding leads to an inevitable and sometimes unrecoverable increase in deferred maintenance, an issue now requiring VSCS attention.
Also, a budget that just breaks even may not have included investment funds to update programs, improve classroom technologies, etc. Any institution that foregoes investing puts itself at a significant competitive disadvantage.”
Report to the Vermont Legislative Joint Fiscal Office
Concerning Vermont State Colleges System Funding for FY2020 and FY2021
James H. Page, June 8, 2020 p. 11

Accountability Matrix: Financial Measures
• Financial Accountability Goals:
⁃ Assess financial health
⁃ Current and future capacity of organization
⁃ Understand trend
⁃ Sufficiency of Resources
⁃ Living within our means
• Four key ratios combined into a single index
Resources
Primary Reserve
Operating Results
Net Operating Revenue
Asset Performance
Return on Net Assets
Debt Management
Viability
Composite Financial
Index
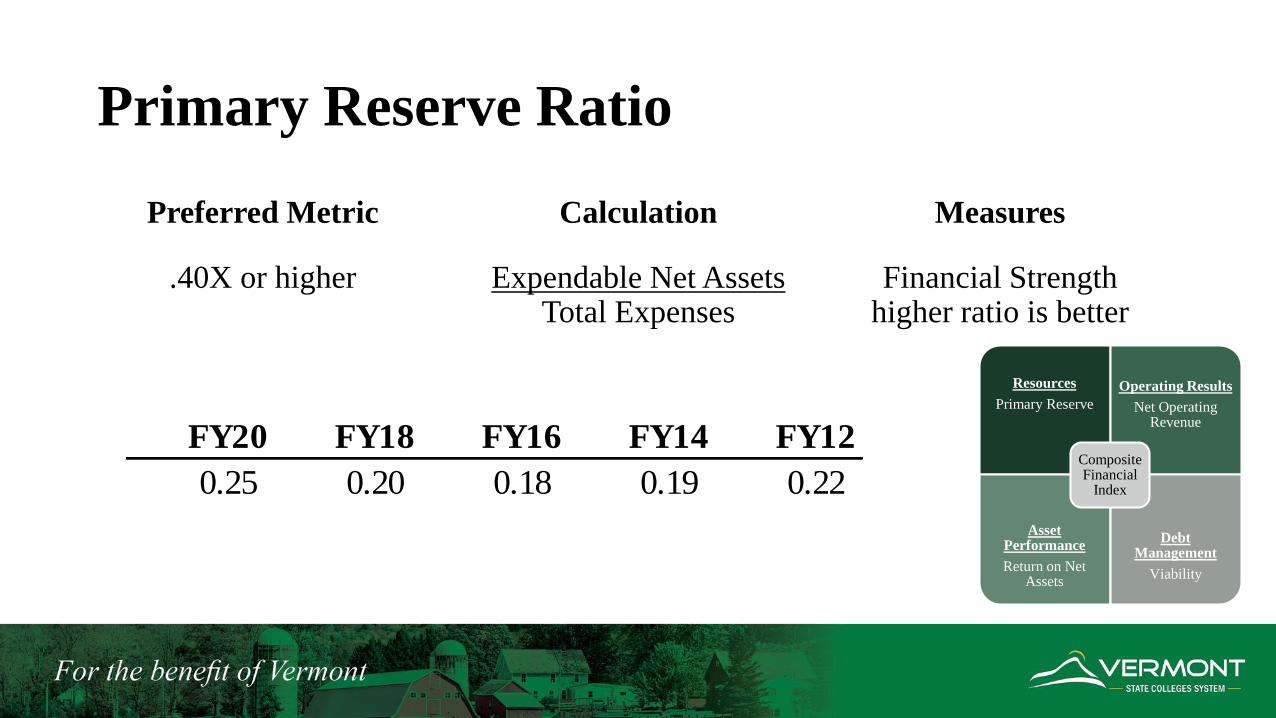
Primary Reserve Ratio
Calculation
Expendable Net AssetsTotal Expenses
Measures
Financial Strength higher ratio is better
Preferred Metric
.40X or higher
Resources
Primary Reserve
Operating Results
Net Operating Revenue
Asset Performance
Return on Net Assets
Debt Management
Viability
Composite Financial
Index
FY20 FY18 FY16 FY14 FY12
0.25 0.20 0.18 0.19 0.22

Net Operating Revenue Ratio
Calculation
Excess (deficiency) of unrestricted operating revenueUnrestricted operating expense
Total unrestricted operating income
Measures
Operating PerformanceLiving within available resources
Preferred Metric
2% to 4%
Resources
Primary Reserve
Operating Results
Net Operating Revenue
Asset Performance
Return on Net Assets
Debt Management
Viability
Composite Financial
Index
FY20 FY18 FY16 FY14 FY12
3.4% -1.4% -3.1% -2.7% -2.4%
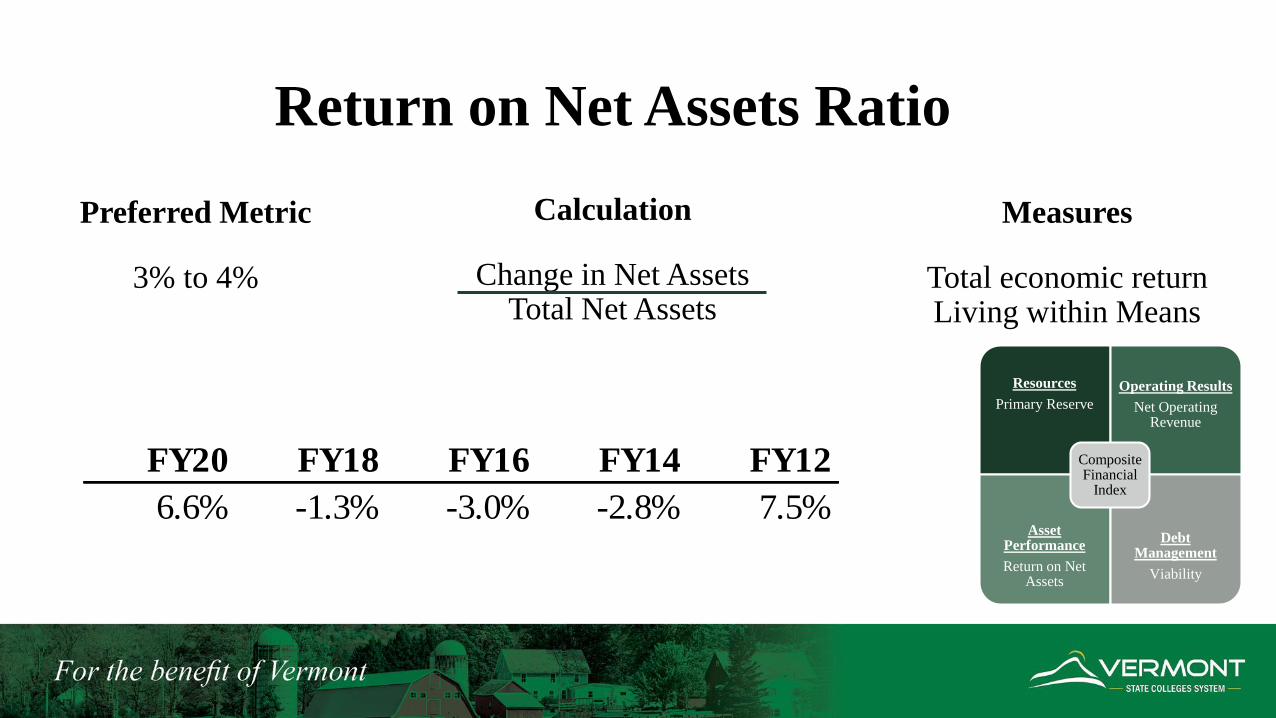
Return on Net Assets Ratio
Preferred Metric
3% to 4%
Resources
Primary Reserve
Operating Results
Net Operating Revenue
Asset Performance
Return on Net Assets
Debt Management
Viability
Composite Financial
Index
Calculation
Change in Net AssetsTotal Net Assets
Measures
Total economic returnLiving within Means
FY20 FY18 FY16 FY14 FY12
6.6% -1.3% -3.0% -2.8% 7.5%
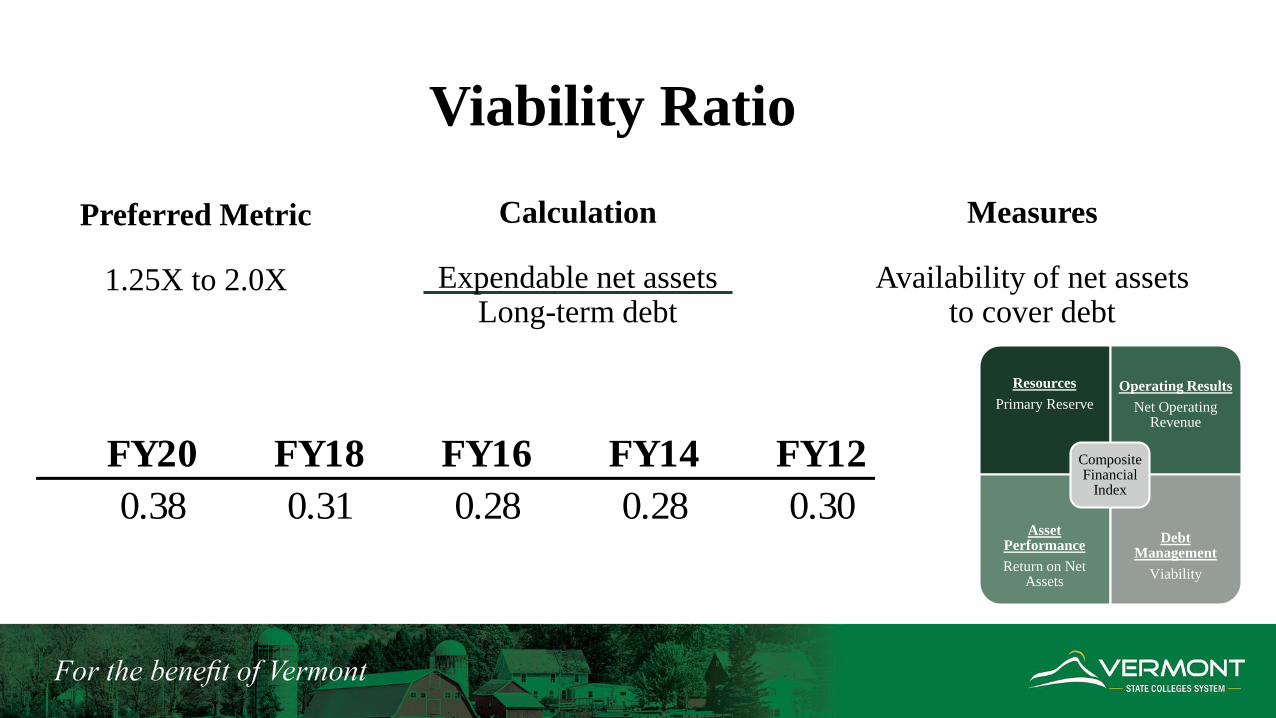
Viability Ratio
Resources
Primary Reserve
Operating Results
Net Operating Revenue
Asset Performance
Return on Net Assets
Debt Management
Viability
Composite Financial
Index
Calculation
Expendable net assetsLong-term debt
Preferred Metric
1.25X to 2.0X
Measures
Availability of net assets to cover debt
FY20 FY18 FY16 FY14 FY12
0.38 0.31 0.28 0.28 0.30

FY2020 Composite Financial Index (CFI)
One overall measurement of financial health based on the four core ratios
FY2020 Financial Ratios
VSCS
Value
Strength
Factor
Weighting
Factor
Weighted
Score
Primary Reserve 0.25 1.86 0.35 0.65
Net Operating Revenue 0.03 4.88 0.10 0.49
Viability Ratio 0.38 0.92 0.35 0.32
Return on Net Position 0.07 3.29 0.20 0.66
Composite Financial Index 2.12

(4.00)
(2.00)
-
2.00
4.00
6.00
8.00
10.00
Primary Reserve
Net Operating
Revenue
Viability Ratio
Return on Net
Position
Profile of Financial Strength Factors
FY20 FY18 FY16 FY14 FY12

Composite Financial Index Scale
-1 to 1 Assess viability to survive
0 to 3 Reengineer
3 to 5 Direct resources to allow transformation
5 to 7 Focus resources to compete in future
7 to 9 Opportunities to experiment with new initiatives
8 to 10 Deploy resources to achieve robust mission
FY20 FY18 FY16 FY14 FY12
2.12 0.46 (0.04) 0.07 1.24
(0.50)
-
0.50
1.00
1.50
2.00
2.50
FY20 FY18 FY16 FY14 FY12
Composite Financial
Index 2012-2020We are here
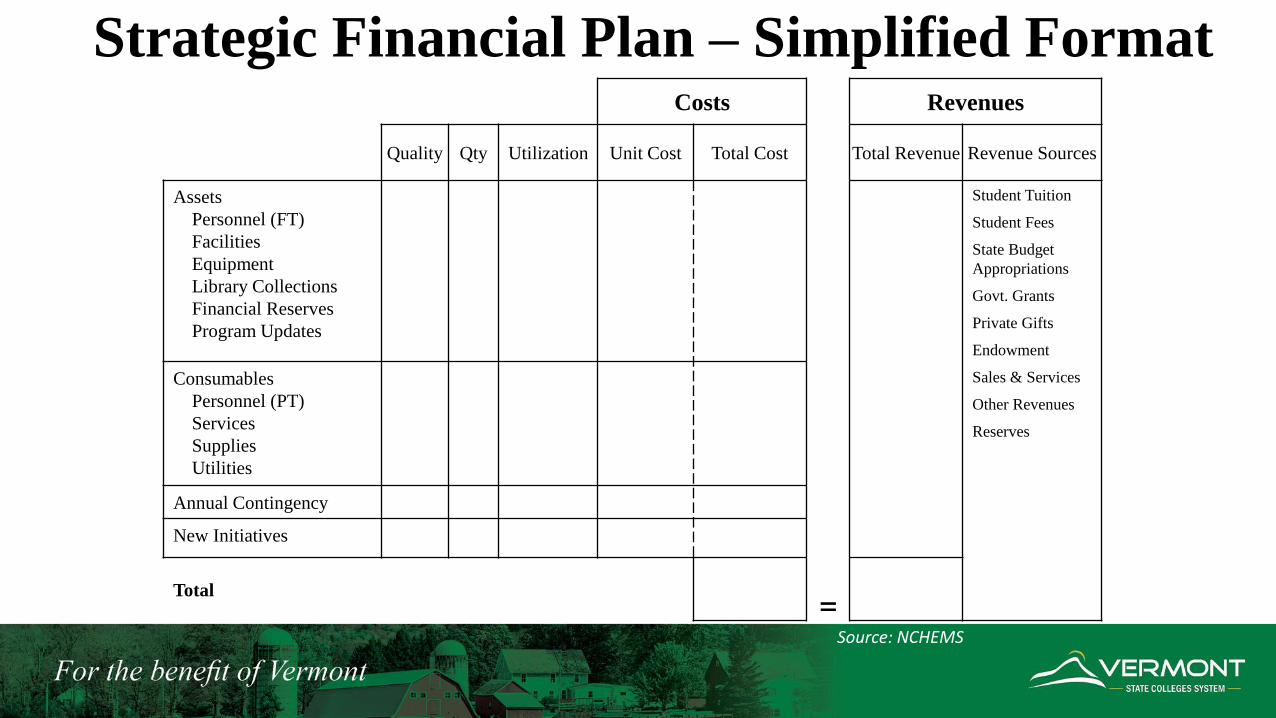
Strategic Financial Plan – Simplified FormatCosts Revenues
Quality Qty Utilization Unit Cost Total Cost Total Revenue Revenue Sources
Assets
Personnel (FT)
Facilities
Equipment
Library Collections
Financial Reserves
Program Updates
Student Tuition
Student Fees
State Budget
Appropriations
Govt. Grants
Private Gifts
Endowment
Sales & Services
Other Revenues
Reserves
Consumables
Personnel (PT)
Services
Supplies
Utilities
Annual Contingency
New Initiatives
Total
=Source: NCHEMS
Source: NCHEMS
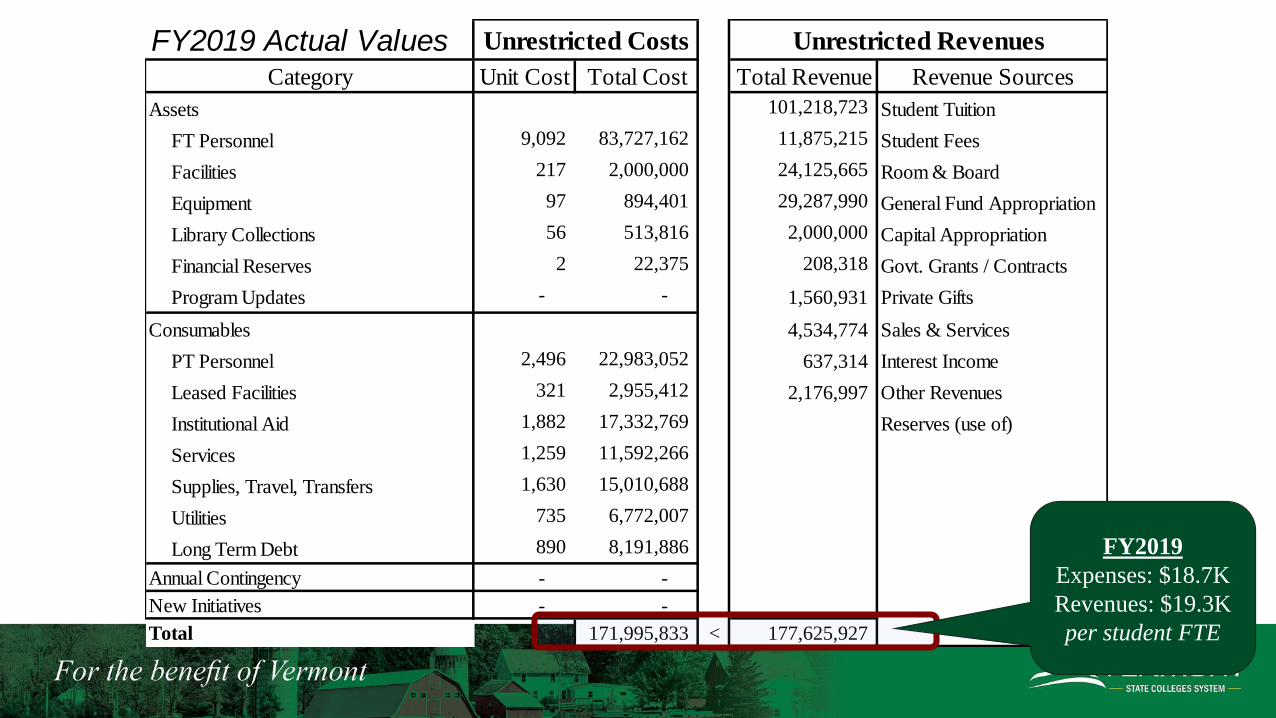
FY2019 Actual ValuesCategory Unit Cost Total Cost Total Revenue Revenue Sources
Assets 101,218,723 Student Tuition
FT Personnel 9,092 83,727,162 11,875,215 Student Fees
Facilities 217 2,000,000 24,125,665 Room & Board
Equipment 97 894,401 29,287,990 General Fund Appropriation
Library Collections 56 513,816 2,000,000 Capital Appropriation
Financial Reserves 2 22,375 208,318 Govt. Grants / Contracts
Program Updates - - 1,560,931 Private Gifts
Consumables 4,534,774 Sales & Services
PT Personnel 2,496 22,983,052 637,314 Interest Income
Leased Facilities 321 2,955,412 2,176,997 Other Revenues
Institutional Aid 1,882 17,332,769 Reserves (use of)
Services 1,259 11,592,266
Supplies, Travel, Transfers 1,630 15,010,688
Utilities 735 6,772,007
Long Term Debt 890 8,191,886
Annual Contingency - -
New Initiatives - -
Total 171,995,833 < 177,625,927
Unrestricted Costs Unrestricted Revenues
FY2019
Expenses: $18.7K
Revenues: $19.3K
per student FTE

Planning Factors
Category Basis Planning Factor
Facilities Owned Property Value 2%
IT Equipment Asset Value 14% - 7 Year Schedule
Other Equipment Asset Value 5% - 10% - By Asset Type
Libraries Asset Value 5%
Board Required Reserve Budgeted Unrestricted Expenses 25% - 10 year phase-in
Strategic Reserve Budgeted Unrestricted Expenses 5% - 25% - 10 year phase-in
Program Updates # of Programs $100K per program – 10 Year
Cycle
Annual Contingency Budgeted Unrestricted Expenses 2%
New Initiatives Budgeted Unrestricted Expenses 1%

Category Unit Cost Total Cost Unit Cost Total Cost Unit Cost Total Cost
Assets
FT Personnel 9,092 83,727,162 9,092 83,727,162 - -
Facilities 217 2,000,000 1,000 9,204,733 782 7,204,733
Equipment 97 894,401 570 5,249,171 473 4,354,770
Library Collections 56 513,816 83 766,362 27 252,545
Financial Reserves 2 22,375 844 7,773,515 842 7,751,140
Program Updates - - 271 2,500,000 271 2,500,000
Consumables
PT Personnel 2,496 22,983,052 2,496 22,983,052 - -
Leased Facilities 321 2,955,412 321 2,955,412 - -
Institutional Aid 1,882 17,332,769 1,882 17,332,769 - -
Services 1,259 11,592,266 1,259 11,592,266 - -
Supplies, Travel, Transfers 1,630 15,010,688 1,630 15,010,688 - -
Utilities 735 6,772,007 735 6,772,007 - -
Long Term Debt 890 8,191,886 890 8,191,886 - -
Annual Contingency - - 377 3,467,475 377 3,467,475
New Initiatives - - 188 1,733,738 188 1,733,738
Total 18,677 171,995,833 21,638 199,260,234 2,961 27,264,401
FY19 Actual FY19 Grossed Up Variance
Source: NCHEMS
1
2
4
3
5

Personnel Expenses
Quality Factors Utilization Factors
Establish Standard Operating Procedures Increase Average Class Size
Professional Development Increase Staff Productivity
Productivity Metrics Increase Student FTE
Hiring Criteria Decrease Headcount
Wages & Benefits
EE
Headcount
Student FTE
Per EE Type
Cost Per
Student FTE Total Cost
Full-Time + Retirees 925 9.76 9,092 83,727,162
Part-Time 1,153 7.83 2,496 22,983,052
2,078 11,588 106,710,213
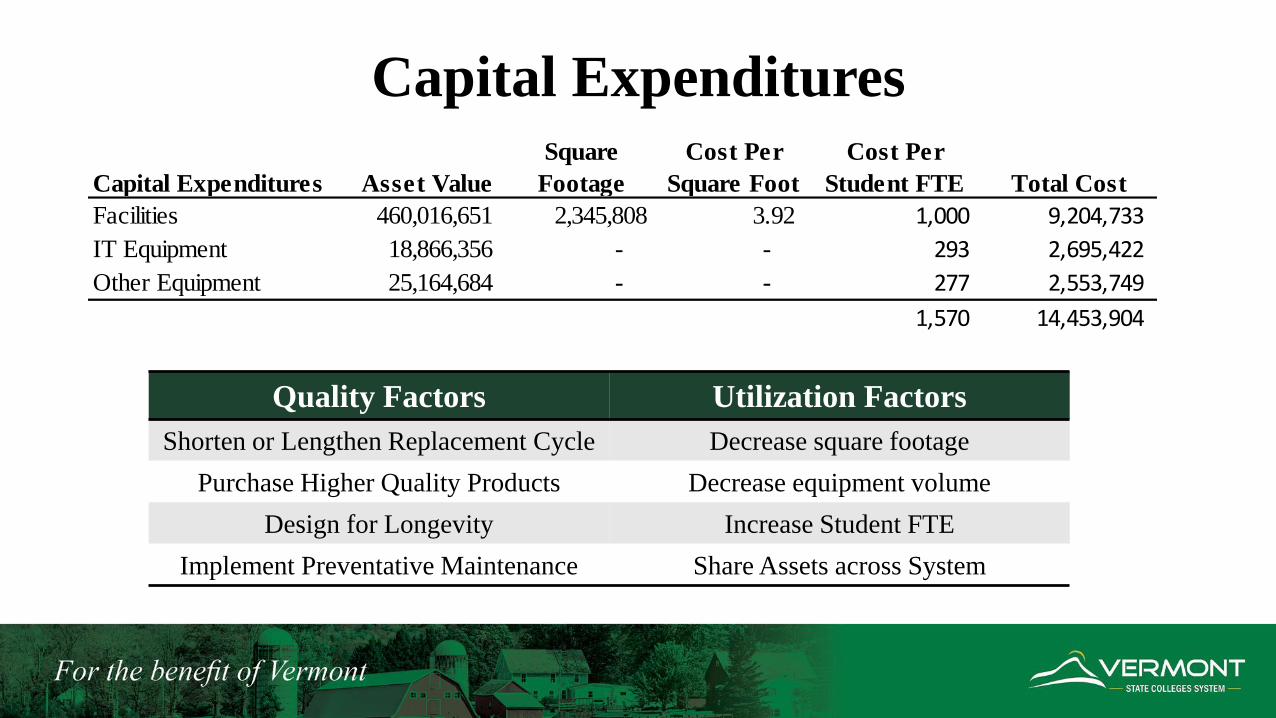
Capital Expenditures
Quality Factors Utilization Factors
Shorten or Lengthen Replacement Cycle Decrease square footage
Purchase Higher Quality Products Decrease equipment volume
Design for Longevity Increase Student FTE
Implement Preventative Maintenance Share Assets across System
Capital Expenditures Asset Value
Square
Footage
Cost Per
Square Foot
Cost Per
Student FTE Total Cost
Facilities 460,016,651 2,345,808 3.92 1,000 9,204,733
IT Equipment 18,866,356 - - 293 2,695,422
Other Equipment 25,164,684 - - 277 2,553,749
1,570 14,453,904

Financial Reserves
Quality Factors Utilization Factors
Ready reserves for emergencies Duration of Phase-In
Weather unknown issues such pandemic Size of Reserve / Number of Days on Hand
Financial Reserves FY19 Value
FY19
Percent
FY19 Days
on Hand Recommended
Recommended
Days on Hand
10 Year
Phase In
Board Required Reserve 4,400,000 2.2% 8.06 44,000,000 81 4,400,000
Strategic Reserve 7,400,000 3.7% 13.56 8,800,000 16 880,000
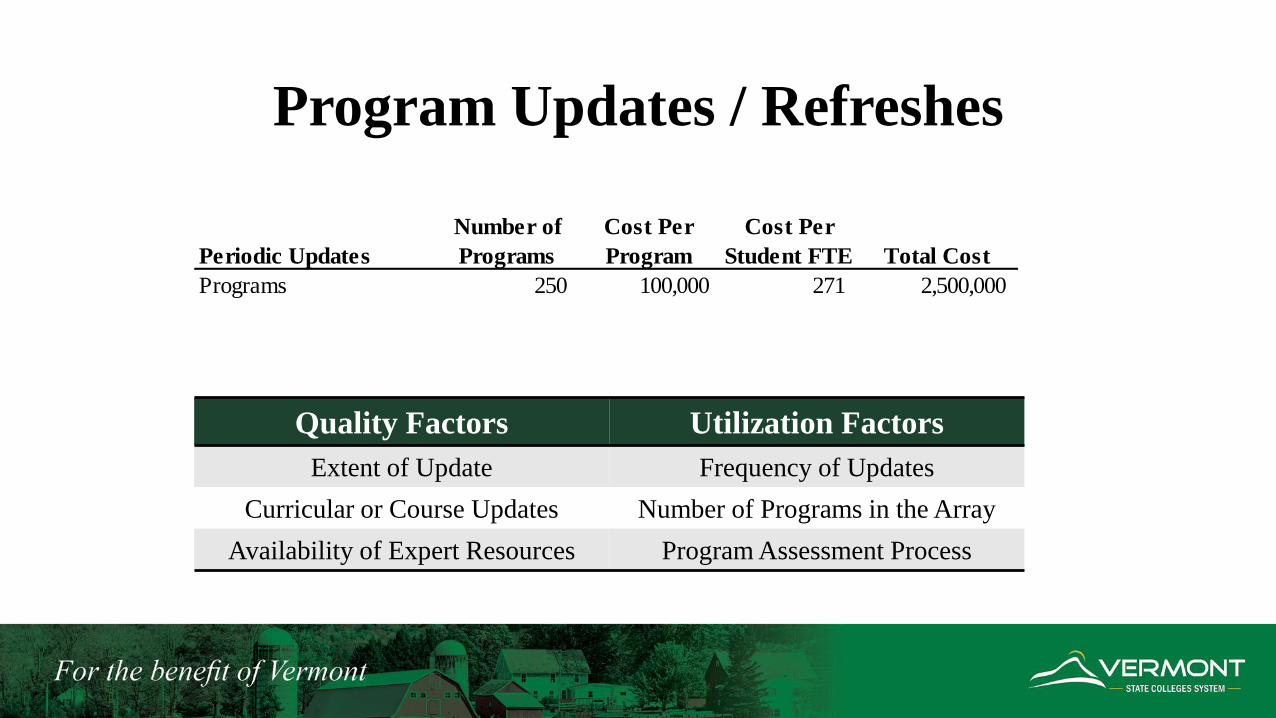
Program Updates / Refreshes
Quality Factors Utilization Factors
Extent of Update Frequency of Updates
Curricular or Course Updates Number of Programs in the Array
Availability of Expert Resources Program Assessment Process
Periodic Updates
Number of
Programs
Cost Per
Program
Cost Per
Student FTE Total Cost
Programs 250 100,000 271 2,500,000

Annual Operations & New Initiatives
Quality Factors Utilization Factors
Invest in New Offerings Adjust Target Size
Expand into New Markets Phase-In Period
Accommodate Market Changes Set Initiative Targets
Annual Operations
Cost Per
Student FTE Total Cost
Annual Operating Contingency 377 3,467,475
New Initiatives 188 1,733,738
Additional Board Consideration
• Number and quality of facilities
• Currency of technology
• Size of reserves
• Frequency and extent of program refreshes
• Funding for new initiatives
• Impact of finances on programmatic decisions
slide 55

FY2022
Budget
FY20223E
Budget
FY2024E
Budget
FY2025E
Budget
FY2026E
Budget
FY2027E
Budget
Total Revenues (all sources) 173,393 156,457 161,457 163,957 163,957 163,957
Total Expenses (all sources) (179,686) (178,908) (174,460) (171,098) (166,265) (161,723)
Net Revenue/(Deficit) (6,293) (22,451) (13,003) (7,141) (2,308) 2,234
One-Time Funds
Carried Over Funds 1,790 - - - - -
HEERF III - 10,000 - - - -
Additional Bridge - 14,900 16,500 10,000 5,000 -
All other Sources 4,503 - - - - -
Total One-Time Funds 6,293 24,900 16,500 10,000 5,000 -
Total Operating Result - 2,449 3,497 2,859 2,692 2,234
Unrestricted Use of CRF (3,826) - - - - -
Net Revenue without Use of CRF (3,826) 2,449 3,497 2,859 2,692 2,234
FY22 Budget: Multi-Year Budget Estimate

FY2022
Budget
FY20223E
Budget
FY2024E
Budget
FY2025E
Budget
FY2026E
Budget
FY2027E
Budget
Total Revenues (all sources) 173,393 156,457 161,457 163,957 163,957 163,957
Total Expenses (all sources) (179,686) (178,908) (174,460) (171,098) (166,265) (161,723)
Net Revenue/(Deficit) (6,293) (22,451) (13,003) (7,141) (2,308) 2,234
• Revenue Assumptions
⁃ Tuition, Fees, Room & Board remain flat
⁃ Volume of students does not change
⁃ State appropriation increases according to Select Committee schedule

FY2022
Budget
FY20223E
Budget
FY2024E
Budget
FY2025E
Budget
FY2026E
Budget
FY2027E
Budget
Total Revenues (all sources) 173,393 156,457 161,457 163,957 163,957 163,957
Total Expenses (all sources) (179,686) (178,908) (174,460) (171,098) (166,265) (161,723)
Net Revenue/(Deficit) (6,293) (22,451) (13,003) (7,141) (2,308) 2,234
• Expense Assumptions
⁃ Waterfall reduction
⁃ Inflationary increases for salaries, benefits, utilities, services, supplies
⁃ Then reduced by $5 million annually
⁃ Will need to be adjusted for Strategic Plan Investments

• One-Time Funding Sources
⁃ Anticipating $10M carry over from HEERF III from FY2022
⁃ Additional bridge funding for next four years
• Balanced budget without Bridge in FY2027
FY2022
Budget
FY20223E
Budget
FY2024E
Budget
FY2025E
Budget
FY2026E
Budget
FY2027E
Budget
One-Time Funds
Carried Over Funds 1,790 - - - - -
HEERF III - 10,000 - - - -
Additional Bridge - 14,900 16,500 10,000 5,000 -
All other Sources 4,503 - - - - -
Total One-Time Funds 6,293 24,900 16,500 10,000 5,000 -

Anticipated Savings Reductions
• Program Array (i.e. reductions needed for facilities, refresh, etc.)
• Increased Average Class Size
• Operational Efficiencies
• Right-sizing campus square footage
• Senior Leadership Organizational Restructuring
• Economies of Scale / Greater Purchasing Power

10 Year Facilities Plan
Underway Planned
Deferred Maintenance Study Gordian Site Visits
Return on Physical Assets Study Facilities Planning Team Discovery
Space Utilization Study F&F Review of Gordian work products
Facilities Planning Team F&F Approval of 10 Year Work Plan
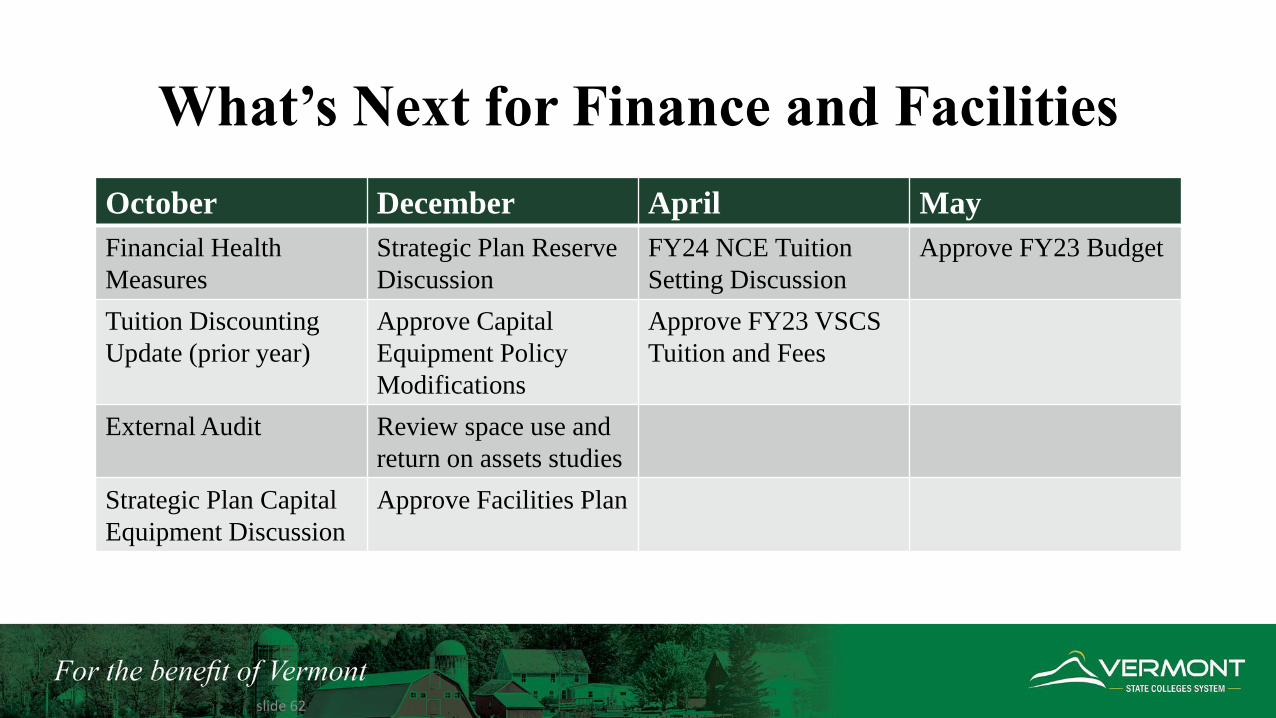
What’s Next for Finance and Facilities
slide 62
October December April May
Financial Health
Measures
Strategic Plan Reserve
Discussion
FY24 NCE Tuition
Setting Discussion
Approve FY23 Budget
Tuition Discounting
Update (prior year)
Approve Capital
Equipment Policy
Modifications
Approve FY23 VSCS
Tuition and Fees
External Audit Review space use and
return on assets studies
Strategic Plan Capital
Equipment Discussion
Approve Facilities Plan