slide 3.5- 1 copyright © 2007 pearson education, inc. publishing as pearson addison-wesley
TRANSCRIPT

Slide 3.5- 1 Copyright © 2007 Pearson Education, Inc. Publishing as Pearson Addison-Wesley

Copyright © 2008 Pearson Education, Inc. Publishing as Pearson Addison-Wesley
OBJECTIVES
Rational Functions
Learn the definition of a rational function.
Learn to find vertical asymptotes (if any).
Learn to find horizontal asymptotes (if any).
Learn to graph rational functions.
Learn to graph rational functions with oblique asymptotes.
Learn to graph a revenue curve.
SECTION 3.5
1
2
3
4
5
6

Slide 3.5- 3 Copyright © 2007 Pearson Education, Inc. Publishing as Pearson Addison-Wesley
RATIONAL FUNCTION
A function f that can be expressed in the form
where the numerator N(x) and the denominator D(x) are polynomials and D(x) is not the zero polynomial, is called a rational function. The domain of f consists of all real numbers for which D(x) ≠ 0.
f x N x D x ,

Slide 3.5- 4 Copyright © 2007 Pearson Education, Inc. Publishing as Pearson Addison-Wesley
EXAMPLE 1 Finding the Domain of a Rational Function
Find the domain of each rational function.
a. f x 3x2 12
x 1
Solution
a. The domain of f (x) is the set of all real numbers for which x – 1 ≠ 0; that is, x ≠ 1 .
b. g x x
x2 6x 8
c. h x x2 4
x 2
In interval notation: ,1 U 1,

Slide 3.5- 5 Copyright © 2007 Pearson Education, Inc. Publishing as Pearson Addison-Wesley
EXAMPLE 1 Finding the Domain of a Rational Function
Solution continued
b. Find the values of x for which the denominator x2 – 6x + 8 = 0, then exclude those values from the domain.
x 2 x 4 0
x 2 0 or x 4 0
x 2 or x 4
In interval notation: ,2 U 2, 4 U 4,
The domain of g (x) is the set of all real numbers such that x ≠ 2 and x ≠ 4 .
Slide 3.5- 6 Copyright © 2007 Pearson Education, Inc. Publishing as Pearson Addison-Wesley
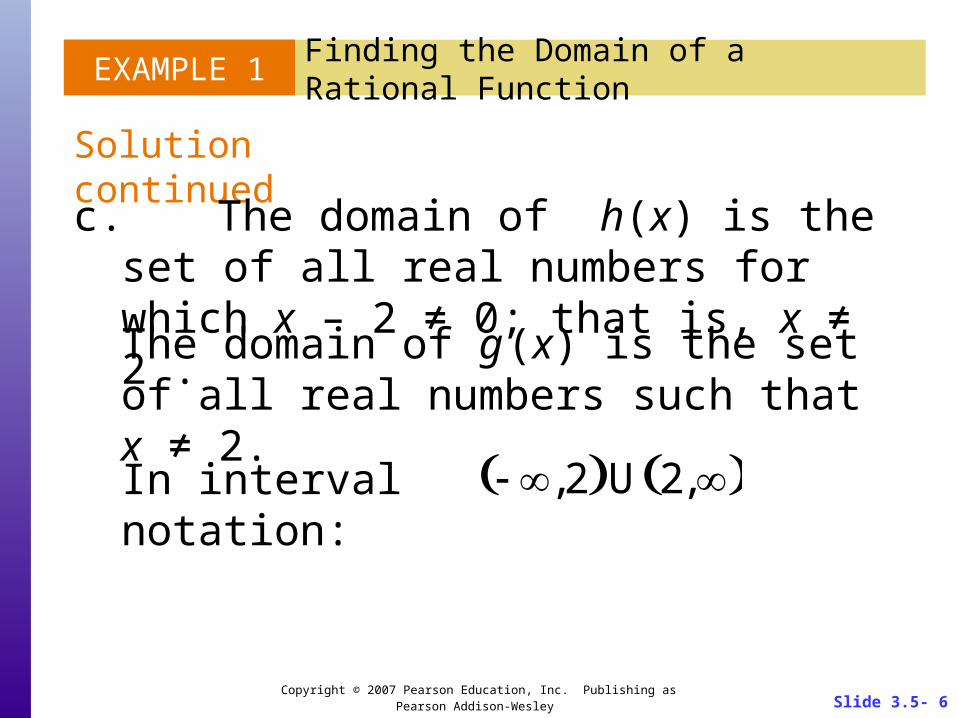
EXAMPLE 1 Finding the Domain of a Rational Function
Solution continued
c. The domain of h(x) is the set of all real numbers for which x – 2 ≠ 0; that is, x ≠ 2 .
In interval notation: ,2 U 2,
The domain of g (x) is the set of all real numbers such that x ≠ 2.
Slide 3.5- 7 Copyright © 2007 Pearson Education, Inc. Publishing as Pearson Addison-Wesley
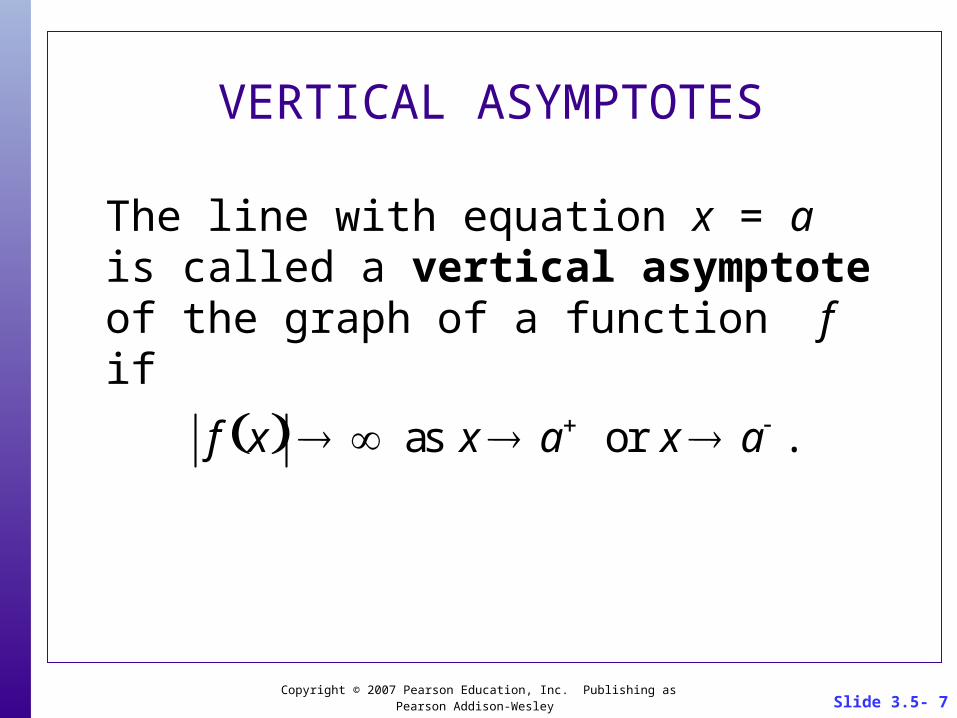
VERTICAL ASYMPTOTES
The line with equation x = a is called a vertical asymptote of the graph of a function f if
f x as x a or x a .

Slide 3.5- 8 Copyright © 2007 Pearson Education, Inc. Publishing as Pearson Addison-Wesley
VERTICAL ASYMPTOTES
Slide 3.5- 9 Copyright © 2007 Pearson Education, Inc. Publishing as Pearson Addison-Wesley
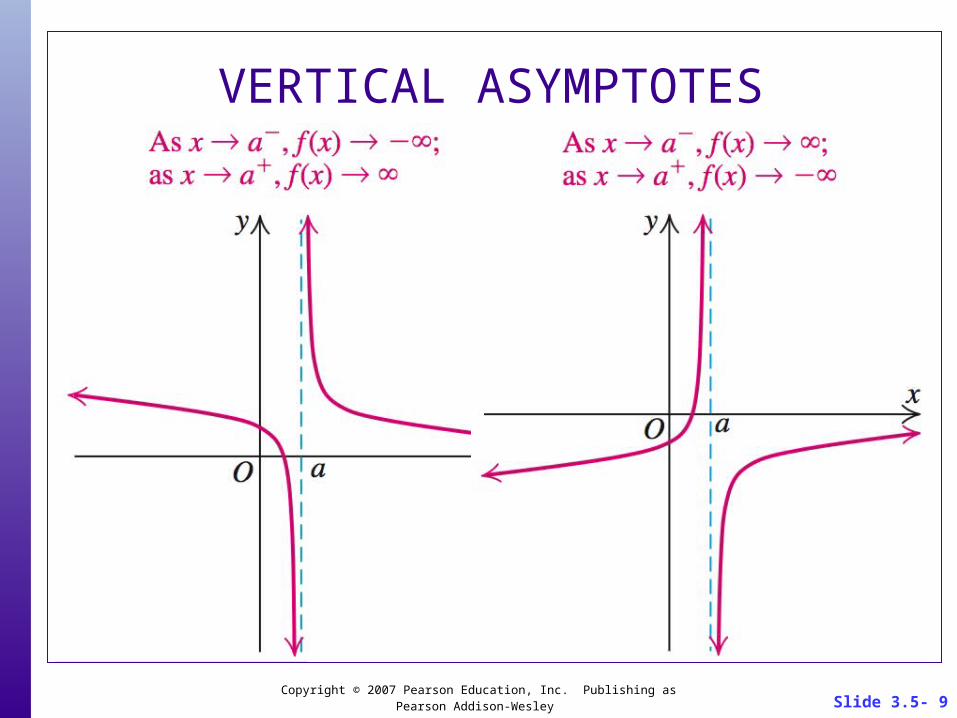
VERTICAL ASYMPTOTES

Slide 3.5- 10 Copyright © 2007 Pearson Education, Inc. Publishing as Pearson Addison-Wesley
LOCATING VERTICAL ASYMPTOTES OF RATIONAL FUNCTIONS
If
where the N(x) and D(x) do not have a common factor and a is a real zero of D(x), then the line with equation x = a is a vertical asymptote of the graph of f.
f x N x D x is a rational function,

Slide 3.5- 11 Copyright © 2007 Pearson Education, Inc. Publishing as Pearson Addison-Wesley
EXAMPLE 2 Finding Vertical Asymptotes
Find all vertical asymptotes of the graph of each rational function.
a. f x 1
x 1
Solution
a. No common factors, zero of the denominator is x = 1. The line with equation x = 1 is a vertical asymptote of f (x).
b. g x 1
x2 9
c. h x 1
x2 1

Slide 3.5- 12 Copyright © 2007 Pearson Education, Inc. Publishing as Pearson Addison-Wesley
EXAMPLE 2 Finding Vertical Asymptotes
Solution continued
b. No common factors. Factoring x2 – 9 = (x + 3)(x – 3), we see the zeros of the denominator are x = –3 and x = 3. The lines with equations x = 3 and x = –3 are the two vertical asymptotes of f (x).
c. The denominator x2 + 1 has no real zeros. Hence, the graph of the rational function h (x) has no vertical asymptotes.

Slide 3.5- 13 Copyright © 2007 Pearson Education, Inc. Publishing as Pearson Addison-Wesley
EXAMPLE 3 Rational Function Whose Graph Has a Hole
Find all vertical asymptotes of the graph of each rational function.
a. h x x2 4
x 2b. g x x 2
x2 4
The graph is the line with equation y = x + 2, with a gap (hole) corresponding to x = 2.
Solution
a. h x x2 4
x 2
x 2 x 2 x 2
x 2, x 2

Slide 3.5- 14 Copyright © 2007 Pearson Education, Inc. Publishing as Pearson Addison-Wesley
EXAMPLE 3 Rational Function Whose Graph Has a Hole
Solution continued

Slide 3.5- 15 Copyright © 2007 Pearson Education, Inc. Publishing as Pearson Addison-Wesley
EXAMPLE 3 Rational Function Whose Graph Has a Hole
Solution continued
The graph has a hole at x = –2. However, the graph of g(x) also has a vertical asymptote at x = 2.
b. g x x 2
x2 4
x 2
x 2 x 2
1
x 2, x 2

Slide 3.5- 16 Copyright © 2007 Pearson Education, Inc. Publishing as Pearson Addison-Wesley
EXAMPLE 3 Rational Function Whose Graph Has a Hole
Solution continued

Slide 3.5- 17 Copyright © 2007 Pearson Education, Inc. Publishing as Pearson Addison-Wesley
HORIZONTAL ASYMPTOTES
The line with equation y = k is called a horizontal asymptote of the graph of a function f if
f x k as x or x .

Slide 3.5- 18 Copyright © 2007 Pearson Education, Inc. Publishing as Pearson Addison-Wesley
RULES FOR LOCATINGHORIZONTAL ASYMPTOTES
Let f be a rational function given by
where N(x) and D(x) have no common factors. Then whether the graph of f has one horizontal asymptote or no horizontal asymptote is found by comparing the degree of the numerator, n, with that of the denominator, m:
an xn an 1x
n 1 ... a2 x2 a1x a0
bm xm bm 1xm 1 ... b2 x2 b1x b0
,an 0,bn 0
f x N x D x

Slide 3.5- 19 Copyright © 2007 Pearson Education, Inc. Publishing as Pearson Addison-Wesley
1. If n < m, then the x-axis (y = 0) is the horizontal asymptote.
3. If n > m, then the graph of f has no horizontal asymptote.
y an
bm
2. If n = m, then the line with equation
is the horizontal asymptote, where an and bm are the leading coefficients of N(x) and D(x), respectively.
RULES FOR LOCATINGHORIZONTAL ASYMPTOTES

Slide 3.5- 20 Copyright © 2007 Pearson Education, Inc. Publishing as Pearson Addison-Wesley
EXAMPLE 4 Finding the Horizontal Asymptote
Find the horizontal asymptotes (if any) of the graph of each rational function.
a. f x 5x 2
1 3x
Solution
a. Numerator and denominator have degree 1.
b. g x 2x
x2 1
c. h x 3x2 1
x 2
is the horizontal asymptote.y 5
3
5
3

Slide 3.5- 21 Copyright © 2007 Pearson Education, Inc. Publishing as Pearson Addison-Wesley
EXAMPLE 4 Finding the Horizontal Asymptote
Solution continued
degree of denominator > degree of numerator y = 0 (the x-axis) is the horizontal asymptote
b. g x 2x
x2 1
c. h x 3x2 1
x 2
degree of numerator > degree of denominator the graph has no horizontal asymptote

Slide 3.5- 22 Copyright © 2007 Pearson Education, Inc. Publishing as Pearson Addison-Wesley
PROCEDURE FOR GRAPHINGA RATIONAL FUNCTION
1. Find the intercepts. The x-intercepts are found by solving the equation N(x) = 0. The y-intercept is f (0).
2. Find the vertical asymptotes (if any). Solve D(x) = 0. This step gives the vertical asymptotes of the graph. Sketch the vertical asymptotes.
3. Find the horizontal asymptotes (if any). Use the rules found in an earlier slide.

Slide 3.5- 23 Copyright © 2007 Pearson Education, Inc. Publishing as Pearson Addison-Wesley
4. Test for symmetry. If f (–x) = f (x), then f is symmetric with respect to the y-axis. If f (–x) = – f (x), then f is symmetric with respect to the origin.
5. Find the sign of f (x). Use the sign graphs and test numbers associated with the zeros of N(x) and D(x), to determine where the graph of f is above the x-axis and where it is below the x-axis.
6. Sketch the graph. Plot the points and asymptotes found in steps 1-5 and symmetry to sketch the graph of f.

Slide 3.5- 24 Copyright © 2007 Pearson Education, Inc. Publishing as Pearson Addison-Wesley
EXAMPLE 5 Graphing a Rational Function
Sketch the graph of f x x
x2 4.
Step 2 Find the vertical asymptotes (if any).
f 0 0
02 40 y-intercept is 0
Set f x 0,x
x2 40 or x 0 x-intercept is 0
SolutionStep 1 Find the intercepts.
Solve x2 4 0, x 2 vertical asymptotes are x = 2 and x = –2.

Slide 3.5- 25 Copyright © 2007 Pearson Education, Inc. Publishing as Pearson Addison-Wesley
EXAMPLE 5 Graphing a Rational Function
degree of denominator > degree of numeratory = 0 (the x-axis) is the horizontal asymptote
Solution continued
Step 3 Find the horizontal asymptotes (if any).
Step 4 Test for symmetry.
f x x
x 2 4
x
x2 4 f x
Symmetric with respect to the origin

Slide 3.5- 26 Copyright © 2007 Pearson Education, Inc. Publishing as Pearson Addison-Wesley
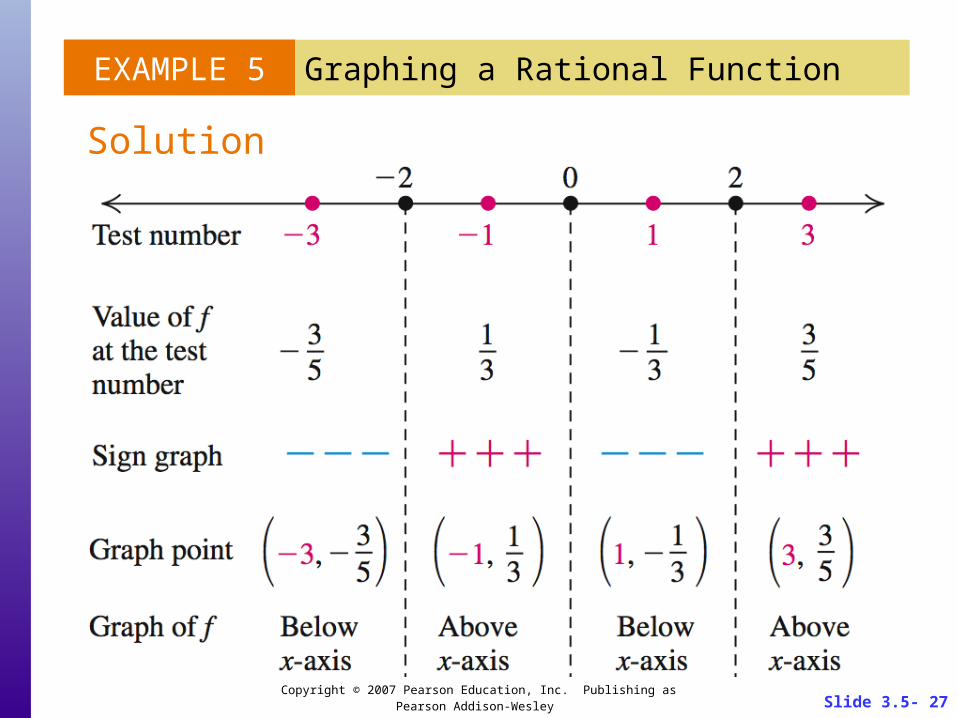
EXAMPLE 5 Graphing a Rational Function
The three zeros 0, –2 and 2 of the numerator and denominator divide the x-axis into four intervals
Solution continued
Step 5 Find the sign of f in the intervals determined by the zeros of the numerator and denominator.
f x x
x2 4
x
x 2 x 2
, 2 , 2,0 , 0,2 , 2,
Slide 3.5- 27 Copyright © 2007 Pearson Education, Inc. Publishing as Pearson Addison-Wesley
EXAMPLE 5 Graphing a Rational Function
Solution continued

Slide 3.5- 28 Copyright © 2007 Pearson Education, Inc. Publishing as Pearson Addison-Wesley
EXAMPLE 5 Graphing a Rational Function
Solution continued
Step 6 Sketch the graph.
f x x
x2 4

Slide 3.5- 29 Copyright © 2007 Pearson Education, Inc. Publishing as Pearson Addison-Wesley
EXAMPLE 6 Graphing a Rational Function
Sketch the graph of f x x2 2
x 2 x 1 .
Step 2 Solve (x + 2)(x – 1) = 0; x = –2, x = 1
f 0 02 2
0 2 0 1 1 y-intercept is –1
SolutionStep 1 Since x2 + 2 > 0, no x-intercepts
vertical asymptotes are x = –2 and x = 1

Slide 3.5- 30 Copyright © 2007 Pearson Education, Inc. Publishing as Pearson Addison-Wesley
EXAMPLE 6 Graphing a Rational Function
y = 1 is the horizontal asymptote
Solution continued
Step 3 degree of den = degree of num
Step 4 Symmetry. None
Step 5 The zeros of the denominator –2 and 1 yield the following figure:

Slide 3.5- 31 Copyright © 2007 Pearson Education, Inc. Publishing as Pearson Addison-Wesley
EXAMPLE 6 Graphing a Rational Function
Solution continued

Slide 3.5- 32 Copyright © 2007 Pearson Education, Inc. Publishing as Pearson Addison-Wesley
EXAMPLE 6 Graphing a Rational Function
Solution continued
Step 6 Sketch the graph.
f x x2 2
x 2 x 1

Slide 3.5- 33 Copyright © 2007 Pearson Education, Inc. Publishing as Pearson Addison-Wesley
EXAMPLE 7 Graphing a Rational Function
Sketch a graph of f x x2
x2 1.
Step 2 Because x2 +1 > 0 for all x, the domain is the set of all real numbers. Since there are no zeros for the denominator, there are no vertical asymptotes.
Solution
Step 1 Since f (0) = 0 and setting f (x) = 0, we have 0. x-intercept and y-intercept are 0.

Slide 3.5- 34 Copyright © 2007 Pearson Education, Inc. Publishing as Pearson Addison-Wesley
EXAMPLE 7 Graphing a Rational Function
y = 1 is the horizontal asymptote
Solution continued
Step 3 degree of den = degree of num
Step 4 Symmetry.
f x x 2
x 2 1
x2
x2 1 f x
Symmetric with respect to the y-axis
Step 5 The graph is always above the x-axis, except at x = 0.

Slide 3.5- 35 Copyright © 2007 Pearson Education, Inc. Publishing as Pearson Addison-Wesley
EXAMPLE 5 Graphing a Rational Function
Solution continued
Step 6 Sketch the graph.
f x x2
x2 1

Slide 3.5- 36 Copyright © 2007 Pearson Education, Inc. Publishing as Pearson Addison-Wesley
OBLIQUE ASUMPTOTES
Suppose f x N x D x ,
is greater than the degree of D(x). Then
and the degree of N(x)
f x N x D x Q x R x
D x .
Thus, as x , f x Q x 0 Q x .That is the graph of f approaches the graph of the oblique asymptote defined by Q(x).

Slide 3.5- 37 Copyright © 2007 Pearson Education, Inc. Publishing as Pearson Addison-Wesley
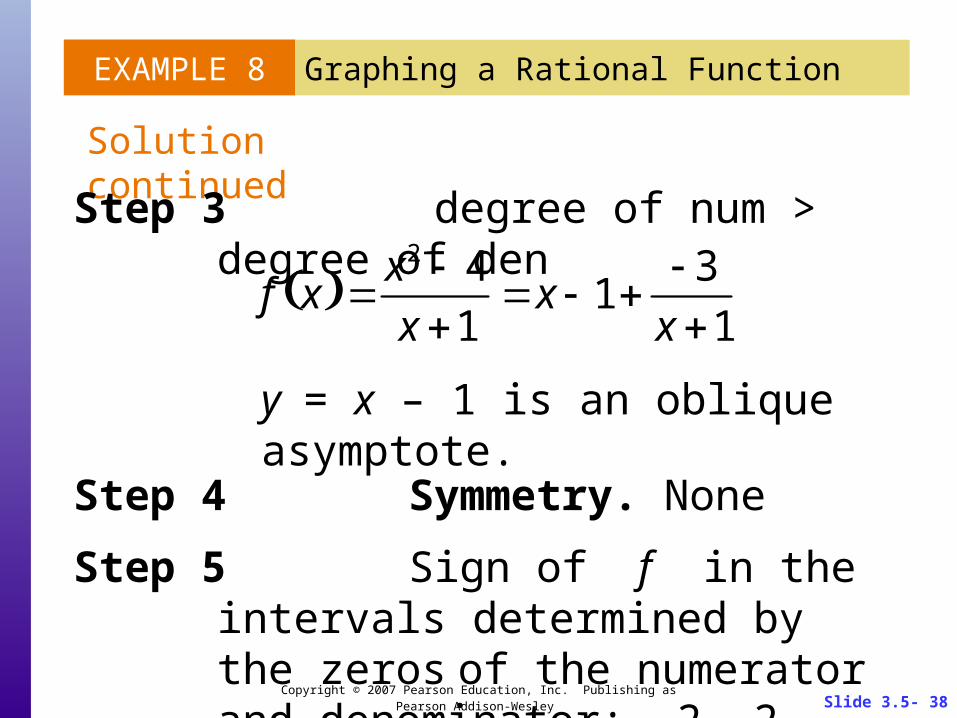
EXAMPLE 8 Graphing a Rational Function with an Oblique Asymptote
Sketch the graph of f x x2 4
x 1.
Step 2 Solve x + 1 = 0; x = –1; domain is set of all real numbers except –1.
f 0 0 4
0 1 4 y-intercept is –4.
SolutionStep 1 Solve x2 – 4 = 0, x-intercepts: –2, 2
Vertical asymptote is x = –1.
Slide 3.5- 38 Copyright © 2007 Pearson Education, Inc. Publishing as Pearson Addison-Wesley
EXAMPLE 8 Graphing a Rational Function
y = x – 1 is an oblique asymptote.
Solution continued
Step 3 degree of num > degree of den
Step 4 Symmetry. None
f x x2 4
x 1x 1
3
x 1
Step 5 Sign of f in the intervals determined by the zeros of the numerator and denominator: –2, 2, and –1.

Slide 3.5- 39 Copyright © 2007 Pearson Education, Inc. Publishing as Pearson Addison-Wesley
EXAMPLE 8 Graphing a Rational Function
Solution continued

Slide 3.5- 40 Copyright © 2007 Pearson Education, Inc. Publishing as Pearson Addison-Wesley
EXAMPLE 8 Graphing a Rational Function
Solution continued
Step 6 Sketch the graph.
f x x2 4
x 1

Slide 3.5- 41 Copyright © 2007 Pearson Education, Inc. Publishing as Pearson Addison-Wesley
EXAMPLE 9 Graphing a Revenue Curve
The revenue curve for an economy of a country is given by
R x x 100 x x 10
,
a. Find and interpret R(10), R(20), R(30), R(40), R(50), and R(60).
b. Sketch the graph of y = R(x) for 0 ≤ x ≤ 100.c. Use a graphing calculator to estimate the tax
rate that yields the maximum revenue.
where x is the tax rate in percent and R(x) is the tax revenue in billions of dollars.

Slide 3.5- 42 Copyright © 2007 Pearson Education, Inc. Publishing as Pearson Addison-Wesley
EXAMPLE 9 Graphing a Revenue Curve
a. R 10 10 100 10 10 10
45 billion dollars
Solution
If income is taxed at a rate of 10%, total revenue for the government will be 45 billion dollars.
R 20 53.3 billion dollars
R 30 52.5 billion dollars
R 40 48 billion dollars
R 50 41.67 billion dollars
R 60 34.3 billion dollars

Slide 3.5- 43 Copyright © 2007 Pearson Education, Inc. Publishing as Pearson Addison-Wesley
EXAMPLE 9 Graphing a Revenue Curve
Solution continued
Here is the graph ofy = R(x)for0 ≤ x ≤ 100.

Slide 3.5- 44 Copyright © 2007 Pearson Education, Inc. Publishing as Pearson Addison-Wesley
EXAMPLE 9 Graphing a Revenue Curve
Solution continued
c. From the calculator graph of
by using the ZOOM and TRACE features, you can see that the tax rate of about 23% produces he maximum tax revenue of about 53.67 billion dollars for the government.
Y 100x x2
x 10,