slide 1 wp d integrating mobility management and land use planning a good example of integration:...
TRANSCRIPT

slide 1
WP D Integrating Mobility Management and Land Use Planning
A good example of integration:
Sihlcity, Zürich, Switzerland (D2a)

slide 2
Sihlcity: What is it?
• Multifunctional development
• Located at the edge of the city – but also close to city centre (1.5 km)
• Highly accessible by all modes
• Opened March 2007• 2300 employees• 19.000 visitors/day• 850 car parking spaces

slide 3
Sihlcity – as so called Heavily Frequented Site: Requirement to obtain planning permission
• Financial contribution to public transport improvements • 600 bike parking spaces • Assure “recreation quality” within the area• Finance construction of access ramp to main road• Max. 850 car parking spaces• Car parking management (with charges) and limit on
total car trips per year (lever for MM measures)• Home delivery service by bike
• Regulated in a contract and part of the building permission

slide 4
• 850 parking spaces (50 P+R spaces included)– consequence: employees do not have parking permission!
• Two CarSharing locations• Max. car trip contingent
– 8‘800 trips / day (to achieve within 5 years, starting from 10‘000 trips / day)
– 1‘300 trips / night – 800 trips / peak hour
• Obligation to have paid parking
Measure: Parking concept (and trip contingent)

slide 5
Calculation of car trip contingent
Parking regulation of the city of
Zurich
No of additional parking spaces
>>> Maximum
No of parking spaces
>>> Minimum
Minimum trips per day
Maximum trips per day
Minimum trips per year
Maximum trips per year
STG trip rates (space and day):- Employees: 2.5-3.5- Residents: 2,5- Offices (clients): 4-10-15- Restaurant (clients): 8-10-18- Hotel (clients): 4-5- Stores (clients): 8-10-18-25
Specific trip generation per space
& day (STG)
Number of operational days per year and use
Number of operational days

slide 6
Measure: Linking to existing transport networks
• Motorised transport– access via ramp to main
access road
• Bike – extension of bike-paths
• Pedestrians & PT– expansion of train
station, bus and tram stop nearby

slide 7
Measure: Improved public transport services
• Bus line nr. 89– financed first two years
by Sihlcity
– afterwards by public transport company

slide 8
Measure: Improved public transport services
• Tram line nr. 5– financed first two years
by Sihlcity
– afterwards by public transport company

slide 9
Measure: Bike home delivery service
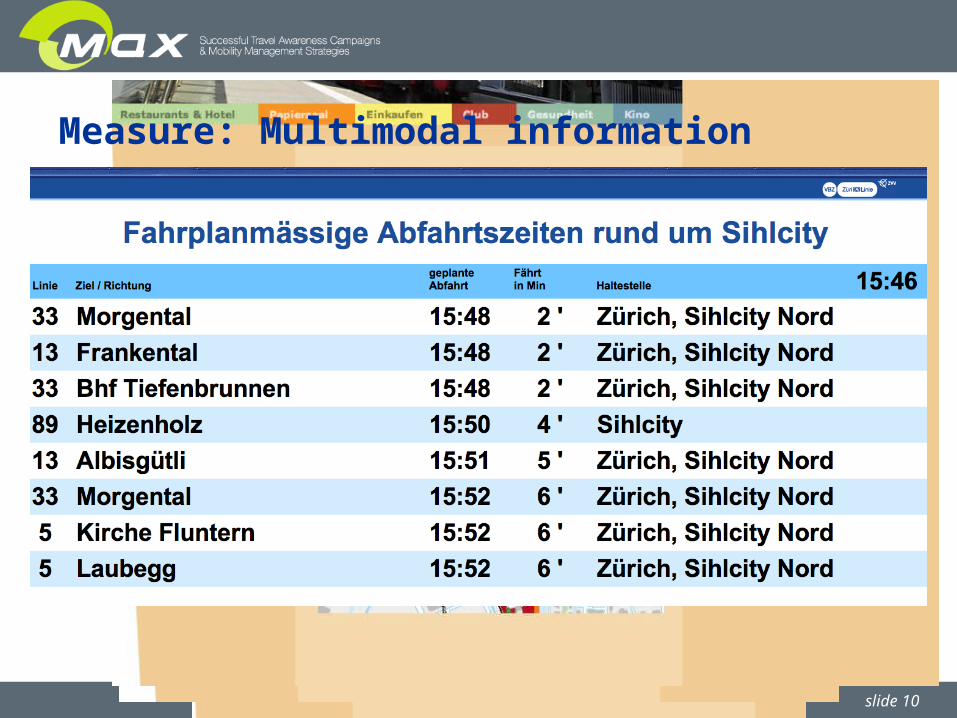
slide 10
www.sihlcity.ch
Measure: Multimodal information

slide 11
Measure: Marketing by PT company

slide 12
Measure: Mobility culture (walking map)

slide 13
Measure: High recreational quality and function of the neighbourhood

slide 14
Results (after 100 days / up to now)
• Frequencies– 19’000 visitors per day
– stable up to now
• Bike home delivery service– more than 1’800 deliveries, around 20 per day
– nowadays: 50 deliveries per day
• Use of transport modes (clients, visitors)– 72% by bike, by public transport, on foot
– 28% by car
– nowadays: 30% with car, 70% with other modes

slide 15
Results (after 100 days of opening / up to now)
• Public transport clients: e.g. counts at tram stop (line nr. 13)– 2006: 1’350 per day
– since 22.03.07: 3’100 per day
– stable up to now• Car parking and car trips
– not fully occupied during the week– on Saturdays full occupied– till now 360‘000 trips (= ca. 3‘600 per day / 8‘800 allowed)– stable up to now

slide 16
IT WORKS !!!
Thanks for your attention !
But wait a minute….

slide 17

slide 18
How to apply this in Auroville?
• Any new land use should include site-based sustainable mobility planning– What sort of mobility do you want?– What sort of (parking, roads, paths, public transport) do you need for
that?– How will you influence behaviour with this infrastructure?
• Make the mobility plan part of the building permission process– Estimate the mobility generated by the site, set targets for it– Provide for additional organisational and informational measures– Adapt the infrastructure
• Let’s go for some examples…

slide 19
How to apply this in Auroville?
Group work:• Please answer the following questions:
1. What does this mean for the place where you live?
2. What does this mean for the place where you work?
3. Any suggestions what could be improved?
4. Any suggestions on how to encourage more sustainable transport behaviour at your site:• Through infrastructure• Through information, organisation, communication?
• 40 minutes, please take about 10 minutes per question