slide 1 osteoporosis in the hiv- infected patient: update on pathogenesis and treatment todd t....
TRANSCRIPT

Slide 1
Osteoporosis in the HIV-infected Patient: Update on
Pathogenesis and Treatment
Todd T. Brown, MD, PhD
Division of Endocrinology, Diabetes, and Metabolism
Johns Hopkins University
Slide 2
Disclosure
• Dr Brown has served as a consultant for Bristol-Myers Squibb, Abbott Laboratories, EMD-Serono, Theratechnologies, Gilead Sciences, Inc, GlaxoSmithKline, Merck & Co, Inc, and ViiV Healthcare.
Slide 3
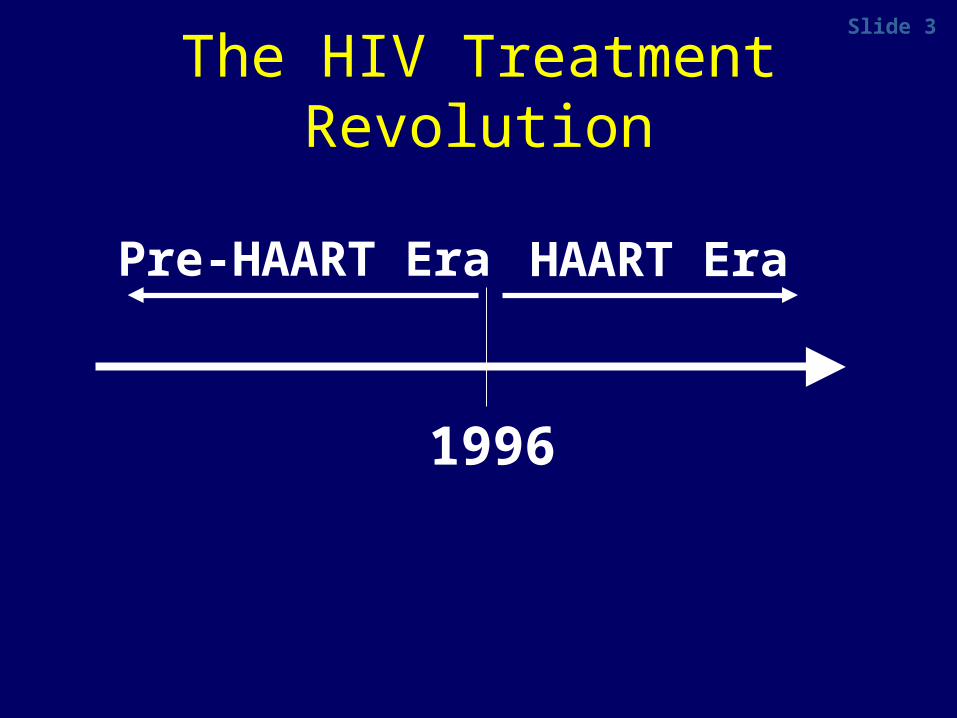
Pre-HAART Era HAART Era
1996
The HIV Treatment Revolution

Slide 4
The Impact of Highly Active Antiretroviral Therapy (HAART)
on HIV Morbidity
Palella, NEJM, 1998

Slide 5
2001 2002 2003 2004 2005 2006 2007 2008 2009 2010 2011 2012 2013 2014 2015 2016 2017
17%19%
21% 22%25%
27% 27% 29%33%
35%37%
39%41%
44%45%
47%50%
Projected Proportion of those Living With HIV in United States 50+
Years* 2001-2017
NY City Here as of 2008
VA Past This Point in 2003!
*Data from 2008, onward projected based on 2001-2007 trends (calculated by author), 2001-2007 data from CDC Surveillance Reports 2007 Slide Courtesy of Amy Justice, MD, PhD
Projected
Slide 6
6
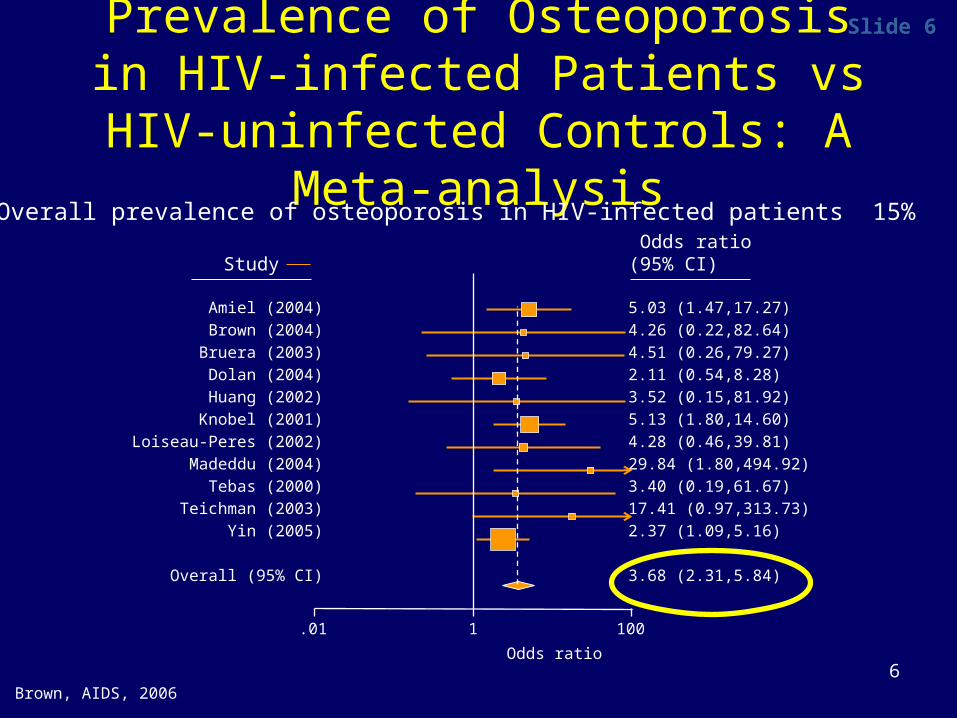
Prevalence of Osteoporosis in HIV-infected Patients vs HIV-uninfected
Controls: A Meta-analysis
Brown, AIDS, 2006
Overall prevalence of osteoporosis in HIV-infected patients 15%
Odds ratio
.01 1 100
Amiel (2004)
Brown (2004)
Bruera (2003)
Dolan (2004)
Huang (2002)
Knobel (2001)
Loiseau-Peres (2002)
Madeddu (2004)
Tebas (2000)
Teichman (2003)
Yin (2005)
Overall (95% CI)
5.03 (1.47,17.27)
4.26 (0.22,82.64)
4.51 (0.26,79.27)
2.11 (0.54,8.28)
3.52 (0.15,81.92)
5.13 (1.80,14.60)
4.28 (0.46,39.81)
29.84 (1.80,494.92)
3.40 (0.19,61.67)
17.41 (0.97,313.73)
2.37 (1.09,5.16)
3.68 (2.31,5.84)
Study Odds ratio(95% CI)
Slide 7
7
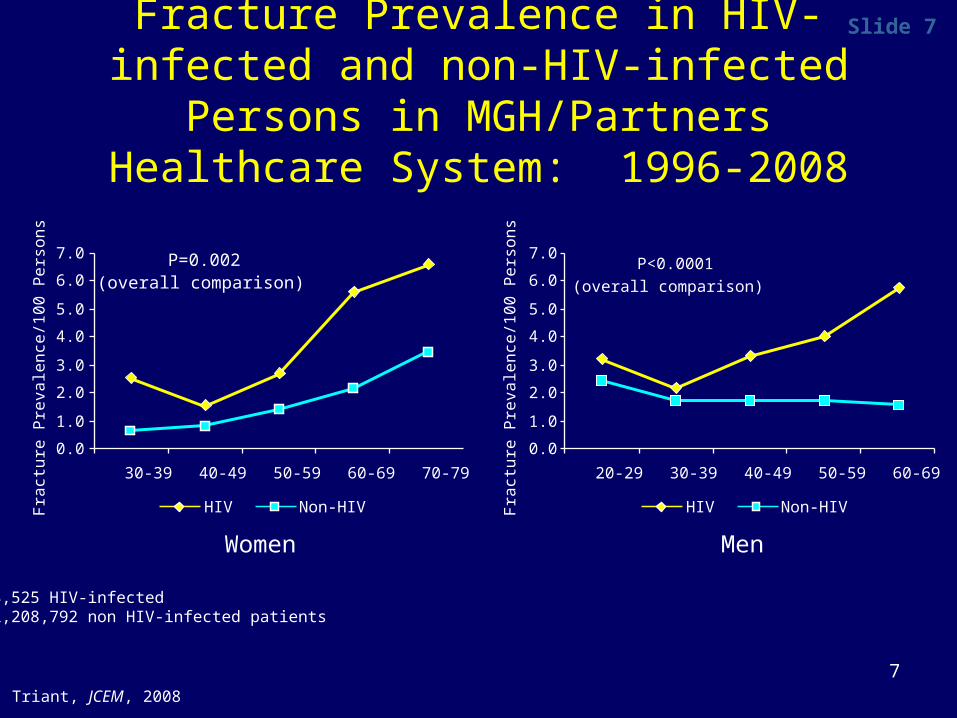
Fracture Prevalence in HIV-infected and non-HIV-infected Persons in MGH/Partners
Healthcare System: 1996-2008
Women Men
Triant, JCEM, 2008
8,525 HIV-infected 2,208,792 non HIV-infected patients
0.0
1.0
2.0
3.0
4.0
5.0
6.0
7.0
30-39 40-49 50-59 60-69 70-79Fra
ctu
re P
reva
len
ce/1
00
Pe
rso
ns
HIV Non-HIV
P=0.002 (overall comparison)
0.0
1.0
2.0
3.0
4.0
5.0
6.0
7.0
20-29 30-39 40-49 50-59 60-69Fra
ctu
re P
reva
len
ce/1
00
Pe
rso
ns
P<0.0001
(overall comparison)
HIV Non-HIV

Slide 8
8
Host
DiseaseMedication
Multifactorial Etiology of Reduced Bone Mineral Density in HIV
Slide 9
9
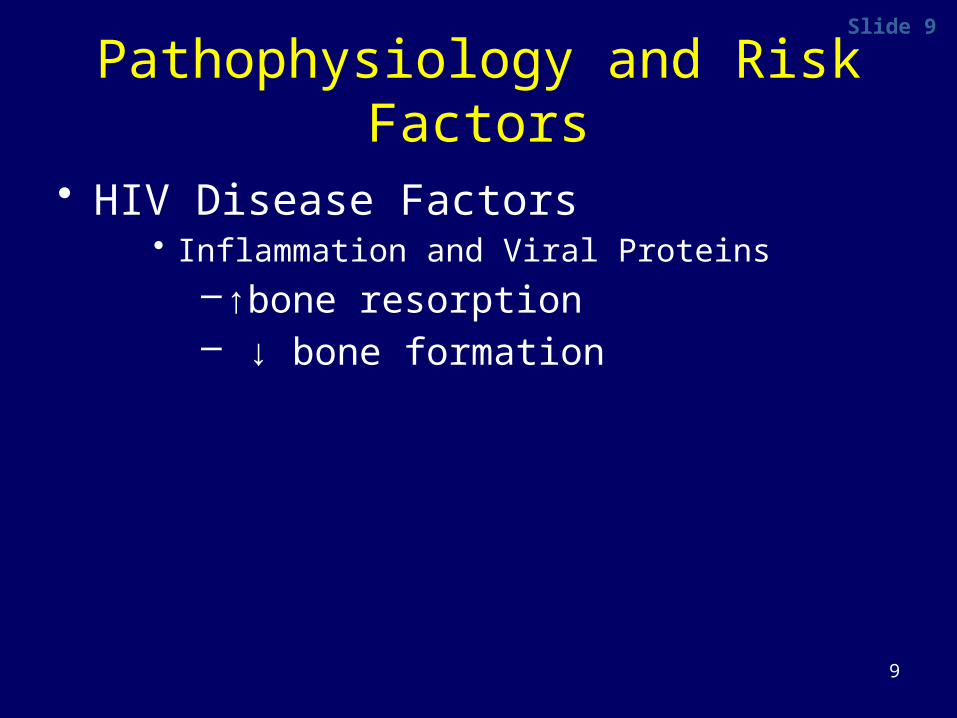
Pathophysiology and Risk Factors
• HIV Disease Factors• Inflammation and Viral Proteins
–↑bone resorption– ↓ bone formation

Slide 10
10
Pathophysiology and Risk Factors
• HIV Disease Factors• Inflammation and Viral Proteins
–↑bone resorption– ↓ bone formation
• Medication Factors– ART initiation

Slide 11
Early Reports Suggested that ART was Good for the Bone
JCEM, 1999

Slide 12BMD Loss with ART-initiation: ~2-6% at 48-96 weeks
Author, y N Wks ART-type Study outcomes
Gallant, 2004 602 144 TDF vs. d4T Spine :TDF-2.2% ; d4T:-1.0%Hip : TDF: -2.8%; d4T:-2.4%
Tebas, 2007 157 96 NFV vs EFV 2.5% decrease in total BMC
Bonnet, 2007 74 36 PI vs non-PI 0.8% decrease in lumbar BMD
Brown, 2009 106 96 LPV/r vs AZT/3TC/EFV 2.5% loss in total BMD
Duvivier, 2009 71 48 PI vs Non-PI Spine: -4.1% , Hip: -2.8%
van Vonderen, 2009
50 104 AZT/3TC/LPV/r v NVP/LPVr Fem Neck: -6.3% v -2.3%Spine: -5.1 v -2.6 %
Moyle, 2009 385 48 TDF v ABC Hip: ABC:-1.9%; TDF: -3.6%Spine:ABC: -1.6%; TDF -2.4%
McComsey, 2010
258 96 TDF v ABCATV/r vs EFV
Hip: ABC:-2.2%; TDF: -4.0%Spine:ABC: -1.8%; TDF -3.8%Hip: ATV/r:-3.5%; EFV: -3.5%Spine:ATV/r:-3.0%; EFV: -2.0%
Huang, 2010 753 96 TDF v AZT v d4TLPV/r v EFV
Total BMD: TDF: -3%; v AZT: -1.75% v d4T: -2%Difference LPV/r vs EFV: -0.5%
Qaqish, 2011 160 96 LPV/r+RAL v LPV/r+TDF/FTC Total BMD: +0.68 v -2.5%
Tebas, 2011 349 96 RPV vs EFV (+NRTI) Total BMD: -1.5% vs -1.5%
Moyle, 2011 224 96 ATV/r v LPV/r (+TDF/FTC) Total BMD: -3% v -4%

Slide 13
13
Average 2-year Percent Change in BMD in Healthy Women
Warming, Osteo Int, 2002
n=336
Lumbar Spine Total Body
-0.4
0.5
-2.1
-0.6
3.8
1.2
-0.9
0.6
-4.0
-3.0
-2.0
-1.0
0.0
1.0
2.0
3.0
4.0
20-49 50-59 60-69 70-89
-4.0
-3.0
-2.0
-1.0
0.0
1.0
2.0
3.0
4.0
20-49 50-59 60-69 70-89
Slide 14
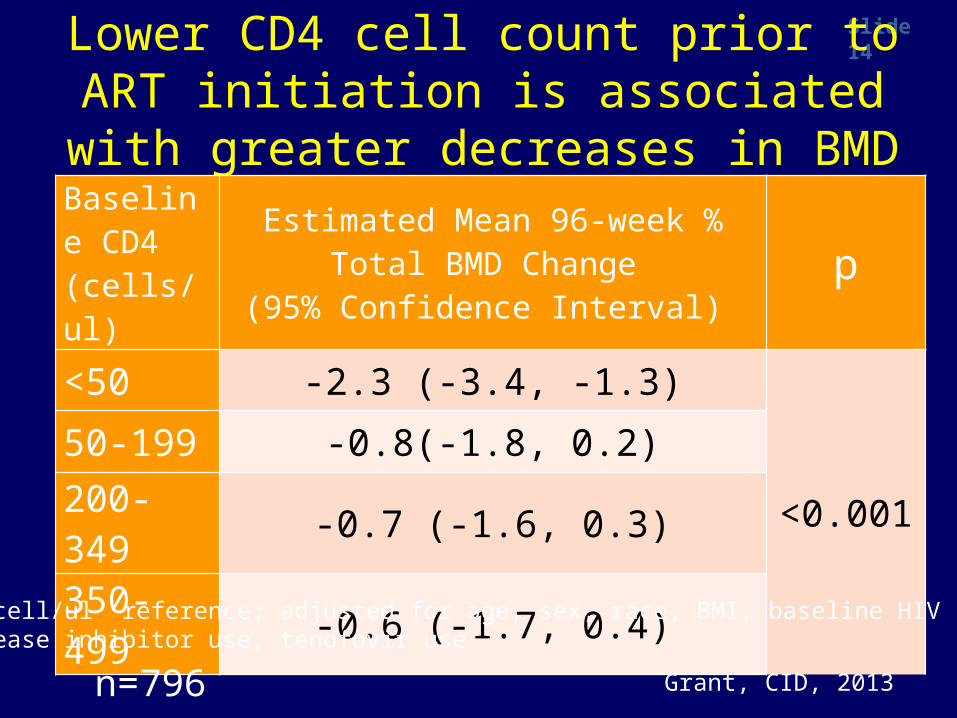
Lower CD4 cell count prior to ART initiation is associated with greater decreases in BMD
Baseline CD4(cells/ul)
Estimated Mean 96-week % Total BMD Change
(95% Confidence Interval) p
<50 -2.3 (-3.4, -1.3)
<0.00150-199 -0.8(-1.8, 0.2)
200-349 -0.7 (-1.6, 0.3)
350-499 -0.6 (-1.7, 0.4)
Grant, CID, 2013
500 cell/ul reference; adjusted for age, sex, race, BMI, baseline HIV RNA, protease inhibitor use, tenofovir use
n=796

Slide 15High Dose Vitamin D and Calcium Attenuates Bone Loss with Initiation of
TDF/FTC/EFV
Overton, CROI, 2014

Slide 16
What about specific ART agents?

Slide 17IAS-USA: Guidelines for Initial ARV Regimens
Dual NRTI Key 3rd Drug
Recommended
TDF/FTC EFV or RPVATV/r or DRV/r
RAL or EVG or DTG
Recommended
ABC/3TC EFVATV/rDTG
+
Gunthard, JAMA, 2014

Slide 18
Protease Inhibitors
• ART initiation– ↑ lumbar spine BMD loss ATV/r v EFV; similar
effect at total hip (ACTG 5224s)
– ↑ lumbar spine and total hip BMD loss with ATV/r or DRV/r vs RAL (ACTG 5260s)
– No difference b/t ATV/r and DRV/r (ACTG 5260s)
• Effect on Fracture

Slide 19Antiretroviral Exposure and Risk of Osteoporotic Fractures in VA Study:
HAART Era
MV Model 1: Controlling for CKD, age, race, tobacco use, diabetes and BMI; MV Model 2: Controlling for Model 1 variables + concomitant exposure to other ARVs.
TDFTDF1TDF2
ABCABC1ABC2
AZT/D4T
AZT/D4T1
AZT/D4T2
NNRTI
NNRTI1
NNRTI2 rP
IrPI1
rPI2
0.8
0.9
1.0
1.1
1.2
1.3
Haz
ard
Rat
io
Bedimo, AIDS, 2012

Slide 20
Protease Inhibitors
• ART initiation• Effect on Fracture• ART Switch: Switch from PI to RAL leads
to modest increases in BMD (SPIRAL)

Slide 21
TDF
• ART initiation– 1-2% additional loss at lumbar spine and hip
vs other NRTIs (Gilead 903, A5224s, ASSERT, TAF studies)
• Effect on Fracture
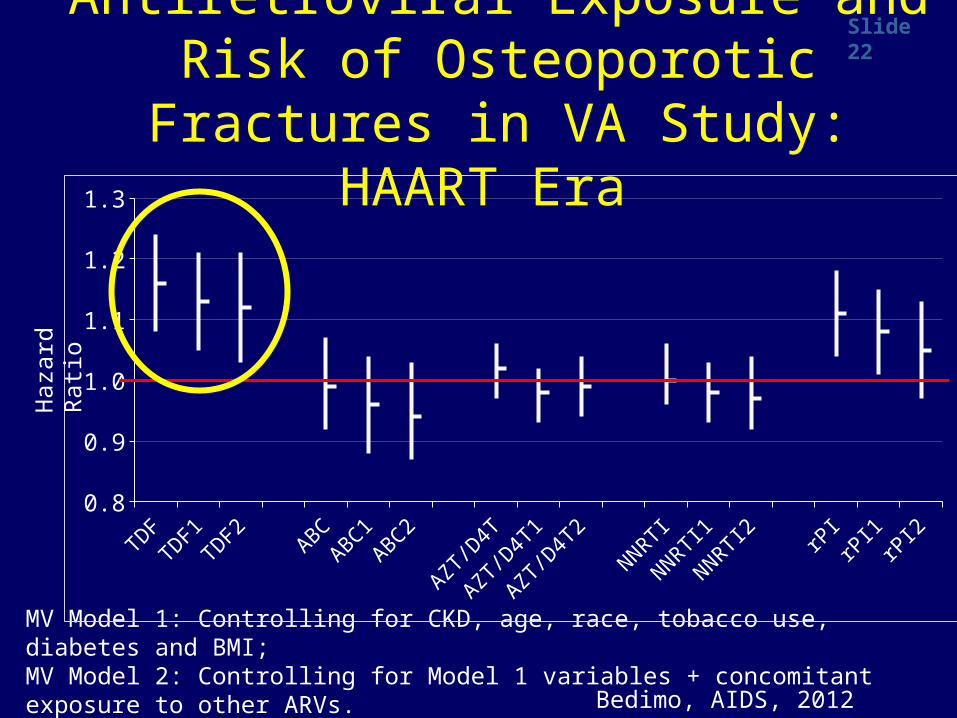
Slide 22Antiretroviral Exposure and Risk of Osteoporotic Fractures in VA Study:
HAART Era
MV Model 1: Controlling for CKD, age, race, tobacco use, diabetes and BMI; MV Model 2: Controlling for Model 1 variables + concomitant exposure to other ARVs.
TDFTDF1TDF2
ABCABC1ABC2
AZT/D4T
AZT/D4T1
AZT/D4T2
NNRTI
NNRTI1
NNRTI2 rP
IrPI1
rPI2
0.8
0.9
1.0
1.1
1.2
1.3
Haz
ard
Rat
io
Bedimo, AIDS, 2012

Slide 23
TDF
• ART initiation– 1-2% additional loss at lumbar spine and hip
vs other NRTIs (Gilead 903, A5224s, ASSERT, TAF studies)
• Effect on Fracture• Effect of Switch
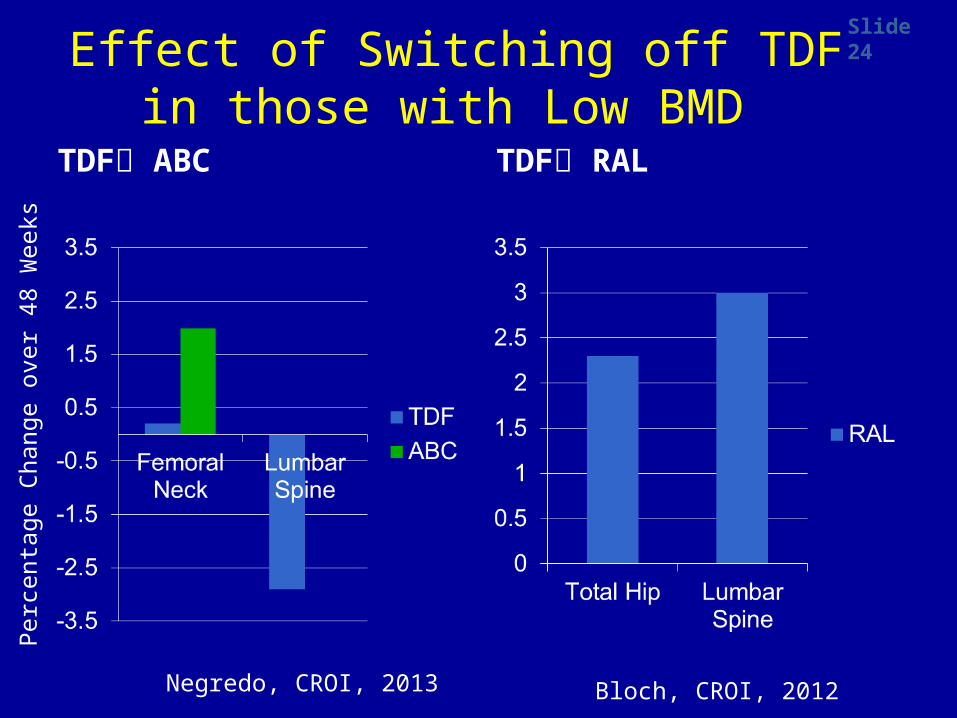
Slide 24
Effect of Switching off TDF in those with Low BMD
TDF ABC TDF RAL
Bloch, CROI, 2012Negredo, CROI, 2013
Per
cent
age
Cha
nge
over
48
Wee
ks

Slide 25
25
To Screen or Not to Screen….
No DXA
DXA
DXA
Slide 26
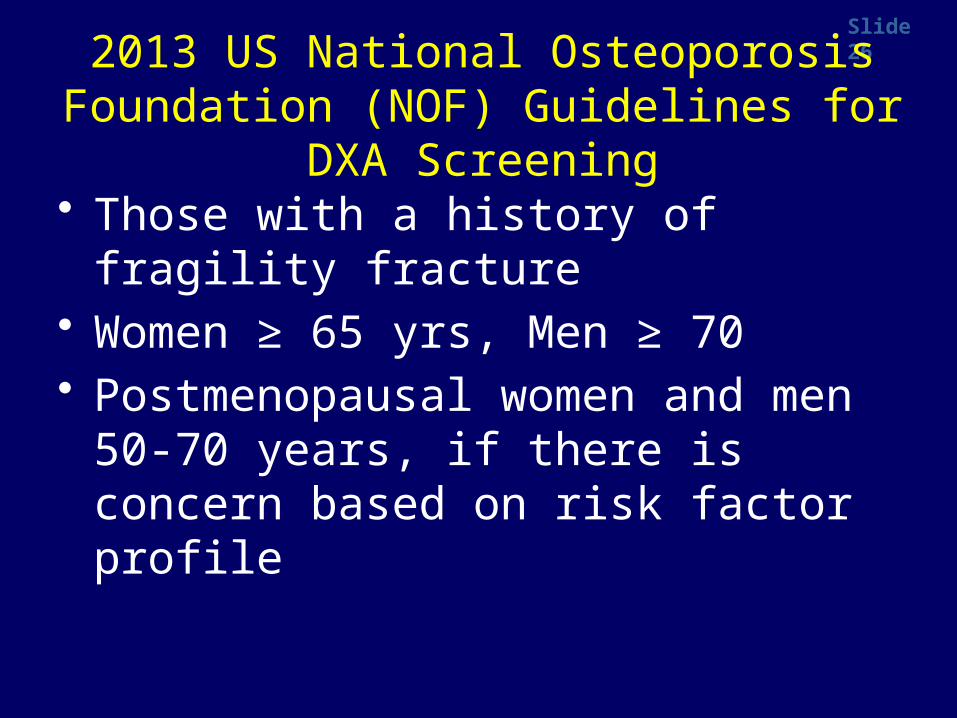
2013 US National Osteoporosis Foundation (NOF) Guidelines for DXA Screening
• Those with a history of fragility fracture• Women ≥ 65 yrs, Men ≥ 70• Postmenopausal women and men 50-
70 years, if there is concern based on risk factor profile
Slide 27
27
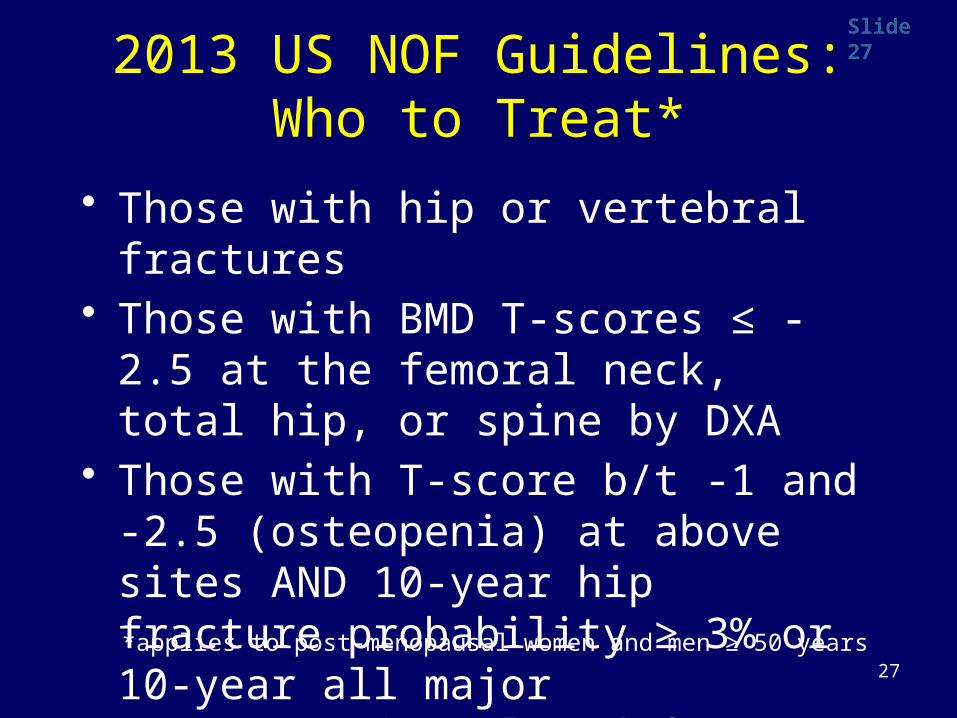
2013 US NOF Guidelines: Who to Treat*
• Those with hip or vertebral fractures• Those with BMD T-scores ≤ -2.5 at the
femoral neck, total hip, or spine by DXA• Those with T-score b/t -1 and -2.5
(osteopenia) at above sites AND 10-year hip fracture probability ≥ 3% or 10-year all major osteoporosis-related fracture ≥ 20% based on FRAX model
*applies to post-menopausal women and men ≥ 50 years

Slide 28
Secondary Causes of Low BMD• Vitamin D deficiency 25 OH Vit D• Hyperparathyroidism PTH, Ca++• Subclinical Hyperthyroidism TSH • Hypogonadism Males: Free Testosterone• Phosphate wasting Fractional Excretion of Phosphate• Idiopathic Hypercalciuria 24 hr Urinary Calcium• Celiac Sprue Tissue Transglutaminase• Multiple Myeloma Serum Protein Electrophoresis• Mastocytosis Serum Tryptase• Cushing’s Syndrome 24 hr Urinary Free Cortisol

Slide 29
29
Secondary Causes of Low BMD
• Vitamin D deficiency 25 OH Vit D
• Phosphate wasting Fractional Excretion of Phosphate

Slide 30
30
Osteomalacia• Impaired bone mineralization• Accompanied by weakness, fracture,
pain, anorexia, and weight loss• Treated with Vitamin D, Ca++, +/-
phosphate, not bisphosphonates• Most important differential diagnosis for
low BMD
Slide 31
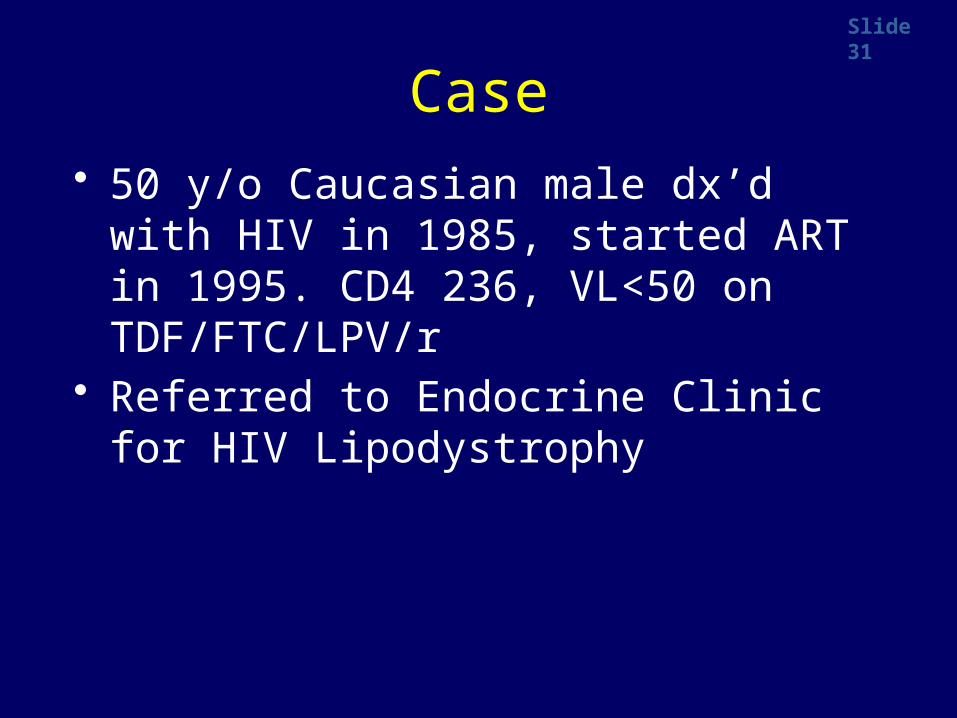
Case• 50 y/o Caucasian male dx’d with HIV in
1985, started ART in 1995. CD4 236, VL<50 on TDF/FTC/LPV/r
• Referred to Endocrine Clinic for HIV Lipodystrophy

Slide 32
“Is there anything else that is bothering you?”
Left hip pain for the past 2 weeks. No antecedent trauma

Slide 33
Femoral Neck Fracture

Slide 34
Femoral Neck Fracture
• Surgical Repair• Osteoporosis Risk
Factors:– Steroid exposure– Hypogonadism– ? Lactic acidosis/NRTI
exposure– Smoking– Past heavy EtOH use
Slide 35
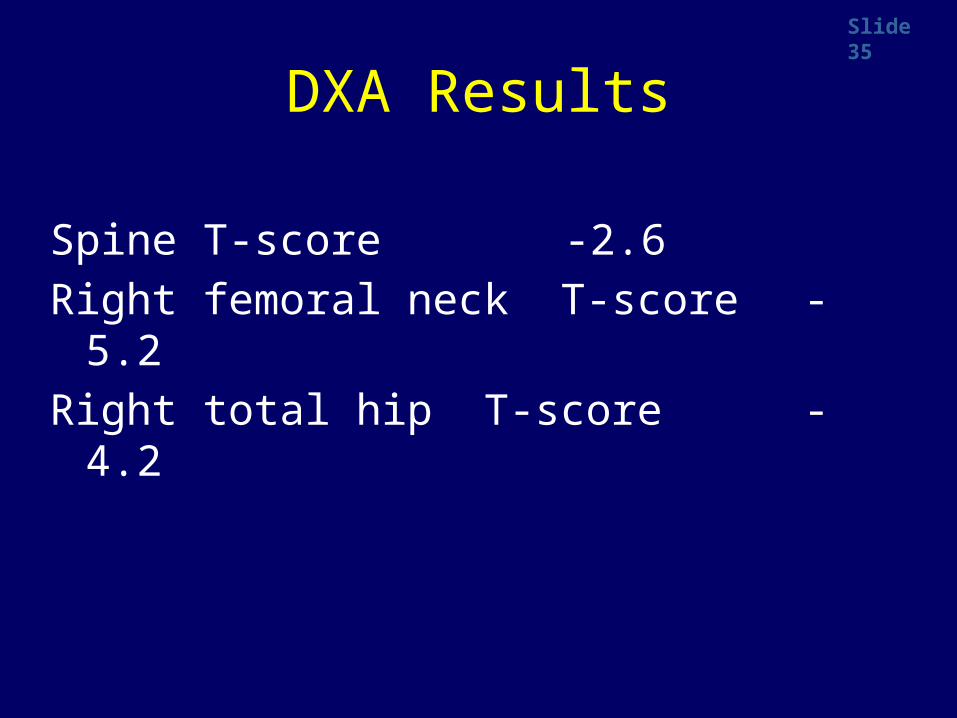
DXA Results
Spine T-score -2.6
Right femoral neck T-score -5.2
Right total hip T-score -4.2
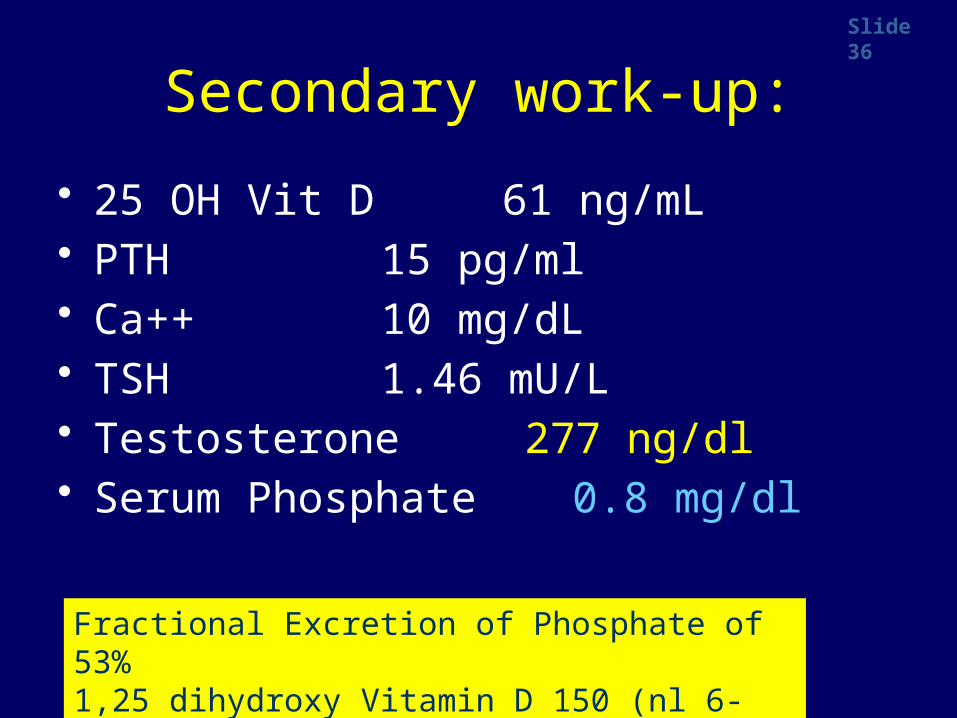
Slide 36
Secondary work-up:
• 25 OH Vit D 61 ng/mL• PTH 15 pg/ml• Ca++ 10 mg/dL• TSH 1.46 mU/L• Testosterone 277 ng/dl• Serum Phosphate 0.8 mg/dl
Fractional Excretion of Phosphate of 53% 1,25 dihydroxy Vitamin D 150 (nl 6-62)

Slide 37
Case: Treatment
• Tenofovir Abacavir• Phosphate 500 mg qid• Calcium 1 gram tid

Slide 38
DXA Follow Up
Spine T-score -2.6 -0.9
R femoral neck T-score -5.2 -2.0
R total hip T-score -4.2 -1.3
Change:↑ 8.9%
↑ 5.5%
↑ 14.6%
Aug 06 May 07
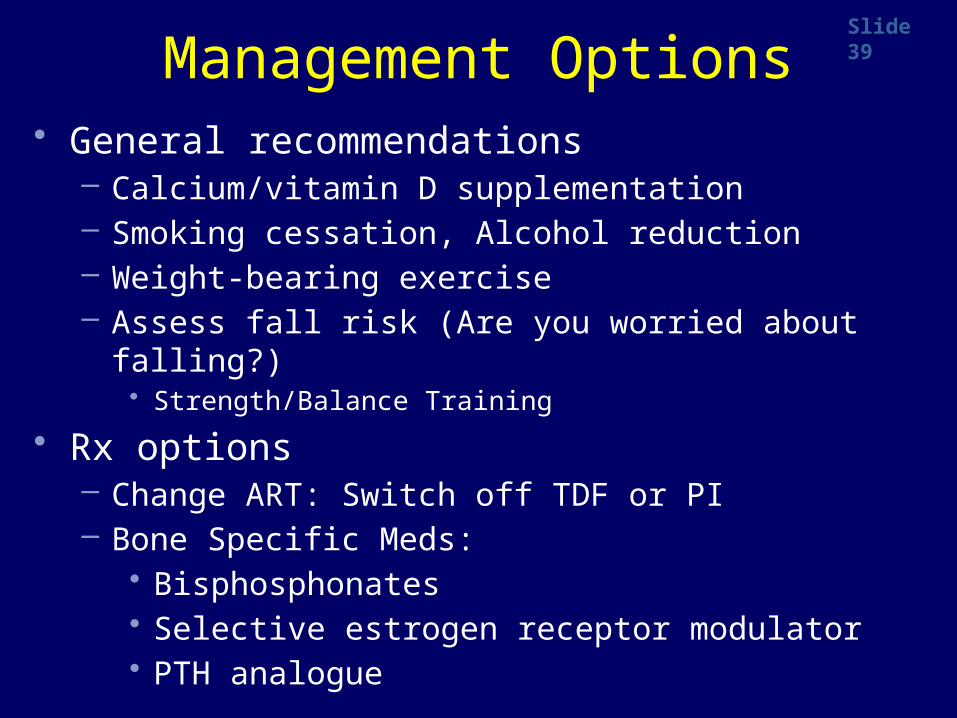
Slide 39
Management Options• General recommendations
– Calcium/vitamin D supplementation– Smoking cessation, Alcohol reduction– Weight-bearing exercise– Assess fall risk (Are you worried about falling?)
• Strength/Balance Training
• Rx options– Change ART: Switch off TDF or PI– Bone Specific Meds:
• Bisphosphonates• Selective estrogen receptor modulator• PTH analogue
Slide 40
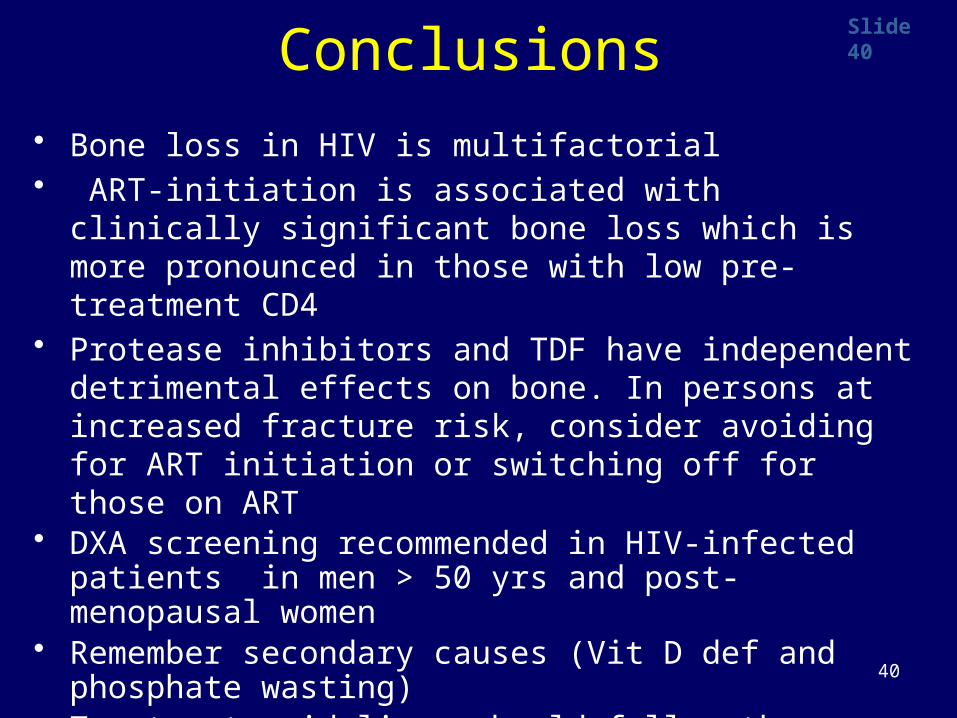
40
Conclusions• Bone loss in HIV is multifactorial• ART-initiation is associated with clinically significant bone
loss which is more pronounced in those with low pre-treatment CD4
• Protease inhibitors and TDF have independent detrimental effects on bone. In persons at increased fracture risk, consider avoiding for ART initiation or switching off for those on ART
• DXA screening recommended in HIV-infected patients in men > 50 yrs and post-menopausal women
• Remember secondary causes (Vit D def and phosphate wasting)
• Treatment guidelines should follow those established for the general population