slash and burn impacts on a costa rican wet forest site ... · old (o~o70 yr) secondary forest...
TRANSCRIPT

Slash and Burn Impacts on a Costa Rican Wet Forest SiteAuthor(s): John Ewel, Cory Berish, Becky Brown, Norman Price, James RaichSource: Ecology, Vol. 62, No. 3 (Jun., 1981), pp. 816-829Published by: Ecological Society of AmericaStable URL: http://www.jstor.org/stable/1937748Accessed: 21/11/2008 09:11
Your use of the JSTOR archive indicates your acceptance of JSTOR's Terms and Conditions of Use, available athttp://www.jstor.org/page/info/about/policies/terms.jsp. JSTOR's Terms and Conditions of Use provides, in part, that unlessyou have obtained prior permission, you may not download an entire issue of a journal or multiple copies of articles, and youmay use content in the JSTOR archive only for your personal, non-commercial use.
Please contact the publisher regarding any further use of this work. Publisher contact information may be obtained athttp://www.jstor.org/action/showPublisher?publisherCode=esa.
Each copy of any part of a JSTOR transmission must contain the same copyright notice that appears on the screen or printedpage of such transmission.
JSTOR is a not-for-profit organization founded in 1995 to build trusted digital archives for scholarship. We work with thescholarly community to preserve their work and the materials they rely upon, and to build a common research platform thatpromotes the discovery and use of these resources. For more information about JSTOR, please contact [email protected].
Ecological Society of America is collaborating with JSTOR to digitize, preserve and extend access to Ecology.
http://www.jstor.org

Ecology, 62(3), 1981, pp. 816-829 ? 1981 by the Ecological Society of America
SLASH AND BURN IMPACTS ON A COSTA RICAN WET FOREST SITE1
JOHN EWEL, CORY BERISH, BECKY BROWN,
NORMAN PRICE, AND JAMES RAICH Department of Botany, University of Florida, Gainesville, Florida 32611 USA
Abstract. Impacts of felling, mulching, and burning on budgets of C, N, S, P, K, Ca, and Mg; rates of CO2 evolution from the soil; soil seed storage; and plant growth were evaluated. The felled tropical evergreen forest was 8-9 yr old, interspersed with patches of 70-yr-old forest and had a leaf area index of 6 and aboveground biomass of 5.2 kg/M2.
Harvest of the largest trees removed 18% of the S, and >10% of all other elements except N. During the 1 1-wk mulching and drying period, 33% of the K and 13% of the P disappeared, but losses of other elements were <6%. Burn temperatures were >620'C in surface fuels, but soil temperatures were seldom >100IC at 1 cm or >50'C at 2 cm. The burn volatilized 1600 g/m2 C, 49 g/m2 N, and 13 g/m2 S. Postburn wind and water erosion of ash, plus leaching, removed 34 g/m2 N, 20 g/m2 K, 1 g/ m2 P, 39 g/m2 Ca, and 7 g/m2 Mg, but insignificant amounts of C and S. After the burn and onset of the rains, 57% of the initial amount of N and 39% of the initial C still remained because of conservation of the organic-rich upper 3 cm of soil.
Soil CO2 evolution was greater from beneath the 11-wk-old slash (3.6 gC m-2 d-1) than from beneath the forest (2.5 gC M-2 d-1), probably because the slash conserved soil moisture better than the actively transpiring forest. After the burn both the burned field and forest soil evolved CO2 at 4.5 gC.m-2 d-i. At this rate, 154 d of decomposition and respiration would release as much C into the atmosphere as did the burn.
Soil seed storage dropped from ;8000 seeds/M2 (67 species) in the forest, to 6000 seeds/M2 (51 species) after 11 wk of mulching, to 3000 seeds/m2 (37 species) after the burn. The seeds not killed by the burn, the survival of mycorrhizal fungi, and the release of nutrients resulted in vigorous and diverse postburn regrowth.
Key words: carbon; carbon dioxide; cations; Costa Rica;fire; mycorrhizae; nitrogen; phosphorus; seeds; shifting agriculture; slash and burn; sulfur; tropicalforests.
INTRODUCTION
Forest felling and burning are parts of the shifting cultivation cycle that supports millions of people throughout the tropics. These practices are also the precursors of permanent agriculture, pasture estab- lishment, and plantation forestry. Tropical deforesta- tion is of great current concern (e.g., United States Department of State and United States Agency for International Development 1978, Myers 1980, Nation- al Research Council 1980), especially because of its potential impacts on genetic diversity (Myers 1979) and on biogeochemical cycles.
The impact of tropical forest felling and burning is of special importance to the global C cycle because of its relationship to world climate (Bolin 1977, Wong 1978, 1979, Woodwell 1978, Woodwell et al. 1978), although some feel that the role of tropical defores- tation has been exaggerated (Broecker et al. 1979). It may also affect global S budgets. Tropical forest felling and burning have important local impacts on nutrient cycles, soil organisms, and stored propagules, all of which can have long-term effects on site quality and recovery.
Despite the ecological and economic implications of the slash and burn cycle, there have been few studies
I Manuscript received 30 January 1980; accepted 16 April 1980; final version received 9 July 1980.
of the changes in total standing crop of nutrients and organic matter from forest through felling and burning. One such study (from Ghana) was reported in two parts: one dealing with preburn soil and vegetation (Greenland and Kowal 1960), and the other dealing with the soil after clearing and burning (Nye and Greenland 1964). De las Salas and Folster (1976) con- ducted a similar study in Colombia.
In our study, a second-growth tropical forest was felled and burned as part of the site preparation done in conjunction with a longer term study of succession and agroecosystem design. We took advantage of our site manipulation to quantitatively evaluate felling, mulching, and burning impacts. Element budgets were monitored throughout the preburn, mulching, post- burn, and rain-onset stages, and soil seed storage, im- pact on mycorrhizae, and rate of CO2 evolution from the soil were monitored concomitantly. The objective of this study was to describe quantitatively slash and burn impacts on a tropical forest, and thereby to help clarify some of the issues of global and local impor- tance concerning tropical deforestation.
METHODS
Study site
The study was conducted near Turrialba, Costa Rica, in the Florencia Norte Forest owned by the Cen-

June 1981 TROPICAL DEFORESTATION IMPACTS 817
tro Agron6mico Tropical de Investigaci6n y Ensefi- anza (CATIE). The site is located at 9053'N, 83'40'W, and lies 650 m above sea level. Our study area includ- ed some of the same land where Harcombe (1977a,b) conducted earlier studies on second-growth vegetation and nutrients. Mean annual rainfall is -oo2700 mm, and the dry season extends from January through March. The site is in the Tropical Premontane Wet Forest life zone (Tosi 1969). Topography is lightly undulating (5- 28% slopes). The soil is the Colorado sandy clay se- ries, classified as an Andept Inceptisol by Aguirre (1971), but earlier referred to as a senile latosol by Hardy (1961). The vegetation consisted of 8-9 yr old second-growth that had regrown following Har- combe's studies and a later interplanting of timber trees by CATIE foresters, plus remnant patches of an old (o~o70 yr) secondary forest dominated by Goethal- sia melantha. The successional vegetation on the site is floristically and physiognomically typical of re- growth on similar soils in the humid tropics of Central America.
The vegetation on three 33 m x 33 m plots was felled during the 1st wk in January 1979. Firewood (17.8 m:3) was removed from the site, and the remain- ing vegetation was allowed to lie on the soil through the dry season until it was burned on 22 March 1979. Each plot was surrounded by a buffer strip 5 m wide consisting of the uncut original vegetation. The burn was quite complete, and left the site covered with a uniform gray-white ash.
Burn temperatures
Temperatures in the litter and upper layers of the soil were measured using temperature-sensitive paints (Tempilaq) with melting points of 380, 660, 930, 1210, 177?, 232?, 288?, 3990, 510?, and 621'C. Sensor design was similar to that of Fenner and Bentley (1960). Each paint was applied in a thin band parallel to the long axis of a 5 cm x 7 cm mica sheet, which was then stapled to a sheet of asbestos of the same size. The temperature sensors were placed at 62 randomly se- lected locations (21 or 20 in each of the three plots). To install each temperature sensor, a slit was made in the soil with a machete, and the temperature sensor was placed vertically so that it extended approximate- ly 1-2 cm above the soil surface. The position of the soil surface was indicated with a small notch in the side of the mica sheet. The temperature sensors were recovered after the burn and the distance from the top of each sensor to the depth of melting was measured for each temperature-sensitive paint band.
Aboveground sampling
Prior to the burn, biomass was harvested from four 3 m x 3 m plots located in the uncut vegetation sur- rounding the experimental plots. All vegetation in each plot was harvested and separated into leaves plus re-
productive parts, stems, and dead (= standing dead plus litter). Three subsamples, -0.5 kg each, were tak- en from each compartment, oven dried for :24 h at 650C and weighed for fresh mass-dry mass conver- sions and chemical analyses. Specific gravity of the firewood removed from the site was determined by oven drying wood samples at 70'C, weighing them, and measuring their volume. Leaf area was deter- mined by sampling 100 g fresh mass of leaves of common species from around each of the four biomass harvest plots. The area of each sample was determined with a leaf area meter (Li-Cor LI-3000), and the leaves were then oven dried at 70'C. The area to dry mass conversion (186.7 cm2/g, r2 = .999) was then applied to the biomass harvest data to determine leaf area in- dex.
Eleven weeks after the vegetation was felled the slash was sampled on two randomly located 1.5 m x 1.5 m plots. All fuel was harvested as a single com- partment because most leafy material had decomposed during the 11 wk that the slash was on the ground. Two subsamples, -0.3 kg each, were oven dried as above.
Ash was collected within 20 cm of each of the 62 temperature sensors. At each point we placed a por- celain crucible (3.1- or 4.6-cm diameter) or a 50-mL Pyrex beaker such that its upper rim was beneath the litter and flush with the soil surface. Ash was also sampled by randomly placing three 8.9 cm diameter Petri dishes beneath the litter on each plot prior to the burn. After the burn, the containers were collected and covered, then taken to the lab, opened, and oven dried to constant mass at 70'C. Bulk density of the ash (mass per unit of undisturbed volume) was determined by weighing the ash in those 33 ash collectors that were brim-full. Ash depth was determined by 300 reg- ularly spaced measurements, 100 in each of the three plots. The total mass of ash on the site was then cal- culated by multiplying the bulk density by the average ash depth.
Belowground sampling
Roots were sampled from 0 to 3 cm depth in the undisturbed preburn vegetation, from beneath the slashed vegetation that had been on the ground for 11 wk, and from beneath the ash immediately following the burn. Sampling was done with a 5.4-cm diameter corer having a sharp leading edge. For each of the three conditions (undisturbed vegetation, slash, post- burn), four locations were sampled and three cores were taken from within each location. The natural vegetation roots were sampled from the four biomass harvest plots, and the slash and postburn sampling points were located inside the larger burn plot, one near each biomass harvest plot. The cores were soaked in a 20-L tank fitted with an overflow spout. Water was circulated into this tank and the flotsam,

818 JOHN EWEL ET AL. Ecology, Vol. 62, No. 3
including roots, was collected on a 0.5-mm sieve be- neath the overflow spout. Roots were separated from the other overflow material, air dried, and separated into two size classes: -s<2 mm diameter and >2 mm diameter. These clean root samples were then oven dried to constant mass at 70'C. Root biomass was de- termined individually for each of the 36 soil cores, but the three cores from each sampling location for each of the three conditions were pooled to obtain enough root material for chemical analyses.
Soil was sampled under four conditions: beneath the second-growth vegetation in the buffer strips sur- rounding the plots; beneath the slash that had been on the ground for 11 wk; immediately following the burn; and immediately after the first rains, ==2 wk after the burn. Four soil samples were taken for each condition, and each sample consisted of a composite of 10 cores. Sampling depths were 0-3 and 3-8 cm. Each compos- ite sample was well mixed, oven dried at 550C to re- tard denitrification, ground, and passed through a 2- mm sieve. Soil sampling locations were the same as root sampling locations. Bulk density was determined at 0-3 and 3-8 cm by taking 12 volumetric cores, 5.4- cm diameter, and oven drying them at 1000C.
Chemical analyses
Duplicate chemical analyses were run on all plant material and soil samples.
Plant tissues (leaves, stems, trunks, litter, fuel, and roots) were ground fine in a Wiley mill. N in plant tissues was determined using a semimicro Kjeldahl technique (Muller 1961). Tissues destined for cation, P, and S analyses were digested using the nitric-per- chloric (5:1 ratio) method of Johnson and Ulrich (1959). Ca, Mg, and K were determined by atomic absorption. S was determined by the turbidimetric method of Chesnin and Yien (1950). P was determined calorimetrically as described by Johnson and Ulrich (1959).
The 47 ash samples that were not contaminated with mineral soil were pooled prior to chemical analyses into seven groups depending upon the surface tem- perature recorded by the sensor located within 20 cm of each ash collector. The seven temperature groups, with the number of samples included within each group shown in parentheses, were: 93'-1770C (5); 1770-232TC (3); 2320-2880C (2); 2880-3990C (5); 399?- 510?C (14); 510'-6210C (8);.>6210C (10). An eighth composite was made from the contents of the nine Petri dishes. Each of the eight composite samples was then divided into three subsamples: one destined for cation and P analysis, one for S analysis, and one for N analysis. One ash sample was oven dried at 700C and weighed, then re-ashed in a muffle furnace at 8000C and reweighed to determine the C content of the ash. Cations, P, S, and N were determined as de- scribed above for plant tissues.
Soil pH was determined in water and 0.01 moIIL CaCl2 using a soil:liquid ratio of 1:2.5 volumes. Soil organic matter and total N were determined on subsamples that were ground to pass through a 0.25-mm sieve. Total N was determined by the semimicro Kjeldahl technique (Bremner 1965). Organic C in the soil was determined by the Walkley-Black (1934) wet digestion method as modified by Siaz del Rio and Bornemisza (1962). A ratio of C digested to total C present of 0.75 was used, based on the recent work on tropical An- depts by Bornemisza et al. (1979). Exchangeable cat- ions in the soil were extracted using ammonium ace- tate at pH 7.0 (Bower et al. 1952), followed by analysis via atomic absorption. Available soil P was extracted using NaHCO3 (Olsen and Dean 1965), followed by colorimetric determination. Available soil S was ex- tracted with Ca3 (PO4)2 (500 gg/g P) and the analysis was done turbidimetrically (Fox et al. 1964). Total soil S was determined using an induction furnace (Leco 572-200) on single composite samples of four cores each, 0-3 cm, from the forest, the 11-wk-old slash, and the postburn field.
Plant material C was calculated as 46.3% of plant tissue (Levitt 1969:130) after subtracting our analytical results for N, P, K, Ca, Mg, S, plus an assumed 2.5% for other mineral elements.
Carbon dioxide evolution
CO2 evolution from the soil was measured in two 24-h series: 1 on 19 March immediately before the burn, and the other on 6 April, -2 wk after the burn. Methodology was similar to that of Schulze (1967). Nine locations were randomly selected along the plot boundaries. At each location we selected two paired sampling points, one at least 4 m into the undisturbed vegetation, and the other in the study plot, either in the preburn slash or in the postburn ash. A wire stand 5 cm high was located at each point and used to sup- port an uncovered Petri dish containing 25 mL of 1.ON NaOH. The stand and Petri dish were then covered with an inverted 4 L can enclosing 0.019 M2. Every 3 h for a 24-h period the cans were removed, the NaOH was collected and stored in a film canister, and re- placed with fresh NaOH. Every 3 h three blanks were run by pouring 25 mL of 1.ON NaOH into a Petri dish and immediately back into the canister. In the labo- ratory, each sample was titrated with 0.5N H2SO4 to phenolphthalein and methyl orange end points. The CO2 content of the blanks did not vary over time, so total CO2 absorption of each sample was determined by subtracting the mean blank value from each sample value.
Soil moisture plus surface soil and air temperatures were monitored as physical variables that might influ- ence rates of CO2 evolution. Soil moisture was deter- mined by weighing, oven drying (>24 h at 105?C), and reweighing paired samples of surface soil (0-5 cm)
June 1981 TROPICAL DEFORESTATION IMPACTS 819
TEMPERATURE (?CC)
0 100 200 300 400 500 600 2 0 . . . . . . . . . . . . . . . . . . . . . . . . ..
16
12
24- -248 _ _ i
0
40 -4
:3 -8
-12 E
-16- E
-20
0. -2 4
-28
-32
-36
-40
-44
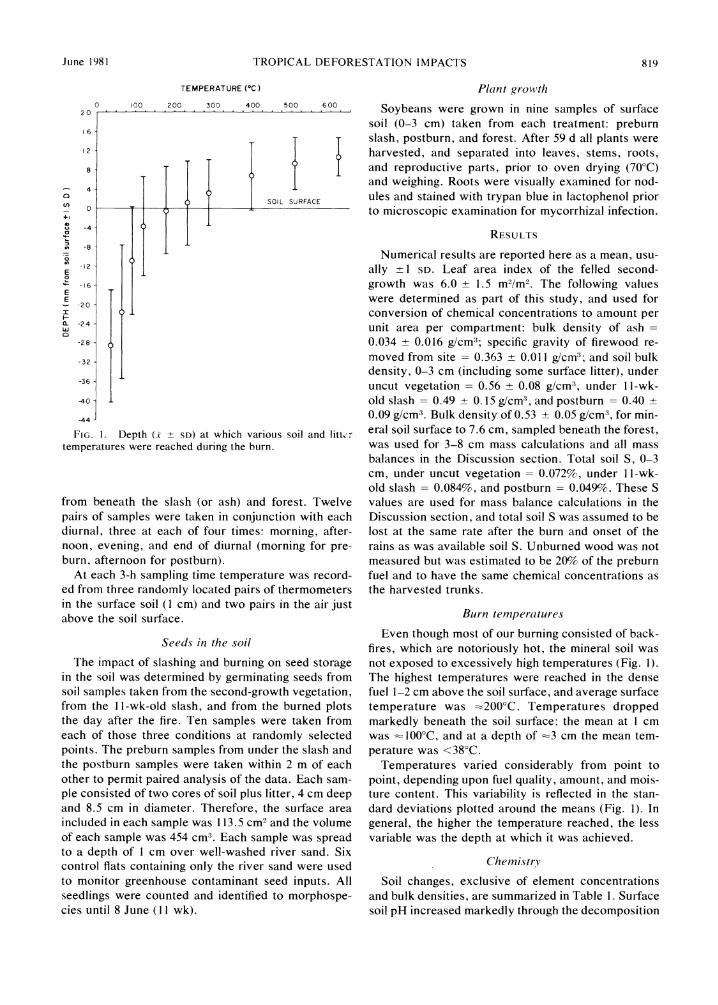
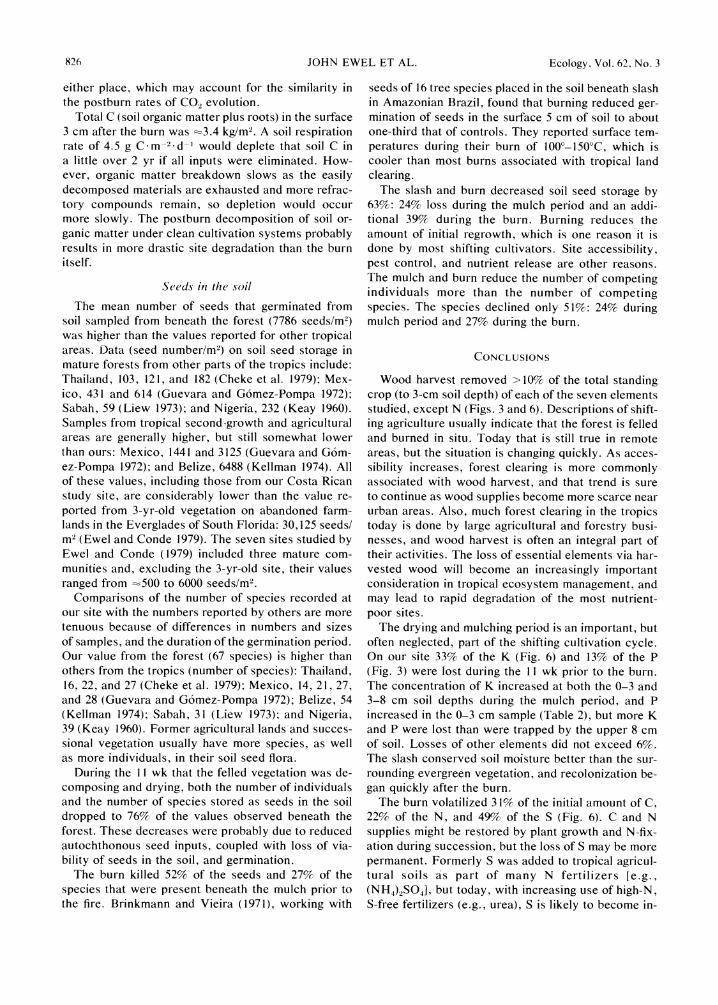
FIG. 1. Depth (x ? SD) at which various soil and litto temperatures were reached during the burn.
from beneath the slash (or ash) and forest. Twelve pairs of samples were taken in conjunction with each diurnal, three at each of four times: morning, after- noon, evening, and end of diurnal (morning for pre- burn, afternoon for postburn).
At each 3-h sampling time temperature was record- ed from three randomly located pairs of thermometers in the surface soil (1 cm) and two pairs in the air just above the soil surface.
Seeds in the soil
The impact of slashing and burning on seed storage in the soil was determined by germinating seeds from soil samples taken from the second-growth vegetation, from the 1 1-wk-old slash, and from the burned plots the day after the fire. Ten samples were taken from each of those three conditions at randomly selected points. The preburn samples from under the slash and the postburn samples were taken within 2 m of each other to permit paired analysis of the data. Each sam- ple consisted of two cores of soil plus litter, 4 cm deep and 8.5 cm in diameter. Therefore, the surface area included in each sample was 113.5 cm2 and the volume of each sample was 454 cm3. Each sample was spread to a depth of 1 cm over well-washed river sand. Six control flats containing only the river sand were used to monitor greenhouse contaminant seed inputs. All seedlings were counted and identified to morphospe- cies until 8 June (I I wk).
Plant growth
Soybeans were grown in nine samples of surface soil (0-3 cm) taken from each treatment: preburn slash, postburn, and forest. After 59 d all plants were harvested, and separated into leaves, stems, roots, and reproductive parts, prior to oven drying (70'C) and weighing. Roots were visually examined for nod- ules and stained with trypan blue in lactophenol prior to microscopic examination for mycorrhizal infection.
RESULTS
Numerical results are reported here as a mean, usu- ally ? 1 SD. Leaf area index of the felled second- growth was 6.0 + 1.5 m2/m2. The following values were determined as part of this study, and used for conversion of chemical concentrations to amount per unit area per compartment: bulk density of ash= 0.034 ? 0.016 g/cm3; specific gravity of firewood re- moved from site = 0.363 + 0.011 g/cm3; and soil bulk density, 0-3 cm (including some surface litter), under uncut vegetation 0.56 + 0.08 g/cm3, under 11-wk- old slash = 0.49 ? 0.15 g/cm3, and postburn = 0.40 + 0.09 g/cm3. Bulk density of 0.53 + 0.05 g/cm3, for min- eral soil surface to 7.6 cm, sampled beneath the forest, was used for 3-8 cm mass calculations and all mass balances in the Discussion section. Total soil S, 0-3 cm, under uncut vegetation = 0.072%, under 1 1-wk- old slash = 0.084%, and postburn = 0.049W. These S values are used for mass balance calculations in the Discussion section, and total soil S was assumed to be lost at the same rate after the burn and onset of the rains as was available soil S. Unburned wood was not measured but was estimated to be 20% of the preburn fuel and to have the same chemical concentrations as the harvested trunks.
Burn temperatures
Even though most of our burning consisted of back- fires, which are notoriously hot, the mineral soil was not exposed to excessively high temperatures (Fig. 1). The highest temperatures were reached in the dense fuel 1-2 cm above the soil surface, and average surface temperature was :200'C. Temperatures dropped markedly beneath the soil surface; the mean at 1 cm was 1000C, and at a depth of -3 cm the mean tem- perature was <380C.
Temperatures varied considerably from point to point, depending upon fuel quality, amount, and mois- ture content. This variability is reflected in the stan- dard deviations plotted around the means (Fig. 1). In general, the higher the temperature reached, the less variable was the depth at which it was achieved.
Chemistry
Soil changes, exclusive of element concentrations and bulk densities, are summarized in Table 1. Surface soil pH increased markedly through the decomposition
820 JOHN EWEL ET AL. Ecology, Vol. 62, No. 3
TABLE 1. Soil characteristics. C:N and cation exchange capacity (CEC) values are X ? SD; pH values are mean (range); n = 4.
Depth pH pH Effective CEC (cm) Status (H20) (CaCl2) (meq/IOOg) C:N
0-3 Forest 5.0 (4.6-6.2) 4.9 (4.6-5.9) 43.6 ? 5.3 15.1 ? 1.3 Slash 5.6 (5.3-6.2) 5.2 (5.0-5.5) 44.9 ? 4.8 13.6 + 0.6 Postburn 6.2 (6.0-6.6) 5.6 (5.4-5.9) 41.6 ? 2.8 12.5 ? 0.6 Postburn and rain 6.0 (5.5-6.6) 5.6 (5.2-6.1) 47.0 + 6.3 13.9 ? 1.3
3-8 Forest 5.3 (4.8-6.0) 4.7 (4.3-5.4) 40.3 ? 3.6 13.5 ? 1.1 Slash 5.1 (4.8-5.8) 4.8 (4.5-5.3) 38.3 ? 2.2 12.6 ? 0.5 Postburn 5.2 (5.0-5.6) 5.0 (4.8-5.3) 35.1 ? 0.8 13.0 ? 0.7 Postburn and rain 5.2 (5.0-5.6) 4.9 (4.6-5.4) 43.7 + 2.1 13.5 ? 1.0
interval and the burn, but the pH below 3 cm did not change. The ApH (= pHH2( - pH(aCl2) is negative un- der all conditions, indicating that the soil at the study site has a net negative charge, or positive cation ex- change capacity. The cation exchange capacity was lowest immediately after the burn, which probably re- flects the combustion of surficial organic matter. The C:N ratio in the surface 3 cm dropped during decom- position and the burn, indicating that C was released more readily than N, and/or that N accretion occurred. C:N ratios did not change significantly at 3-8 cm.
Mass and chemical concentrations are summarized in Table 2. The trunks, which were removed from the site and thus became a nutrient export, consisted of some 8-9 yr old Cecropia, Ocotea, and Virola, but were mostly remnant Goethalsia from the much older
secondary forest that covered the entire site prior to 1970. The biomass of the preburn vegetation, exclud- ing trunks, (leaves + stems + roots = 3.2 kg/M2) is quite low, and may reflect the dominance of this re- growth by woody vines rather than trees and shrubs.
Carbon dioxide evolution
Rates of CO2 evolution and changes in soil moisture were analyzed as a function of time of day, and no significant diurnal fluctuations were detected. There- fore, all CO2 evolution and soil moisture data from each 24-h run were pooled (Table 3). Because fresh reagents were used for each of the two series, the differences in CO2 evolution rates before and after the burn, and the absolute values, should be used with caution. Relative differences between soils sampled
TABLE 2. Mass and nutrient concentrations (percent dry mass) before and after the burn. Values are x ? SD.
Compart- Mass ment (g/m2) N P K Ca Mg S C
Forest
Leaves 318 ? 81 3.391 + 0.434 0.10 ? 0.01 2.09 ? 0.27 1.51 ? 0.30 0.39 ? 0.06 0.36 ? 0.04 41.5 Stems 2615 ? 306 0.997 ? 0.164 0.033 - 0.007 1.14 ? 0.30 0.93 ? 0.14 0.17 + 0.03 0.17 ? 0.08 43.5 Trunks 2241 0.460 ? 0.116 0.016 ? 0.007 0.40 ? 0.22 0.44 ? 0.13 0.12 ? 0.06 0.21 ? 0.14 44.4 Dead 1610 ? 628 1.358 ? 0.330 0.030 ? 0.007 0.52 ? 0.26 1.27 ? 0.36 0.22 ? 0.02 0.23 ? 0.05 43.5 Roots - 2 mm 183 ? 93 2.080 ? 0.354 0.045 ? 0.007 0.41 ? 0.44 1.38 ? 0.41 0.28 ? 0.03 0.37 ? 0.14 43.2 Roots > 2 mm 103 ?105 1.476 ? 0.641 0.032 ? 0.012 0.75 ? 0.37 1.51 + 0.44 0.44 ? 0.13 0.18 0.10 42.7 Soil 0-3 cm 16 800 + 2400 0.915 ? 0.120 (4.2 ? 0.4) x 10-4 (2.7 ? 1.1) x 10-2 0.15 0.10 (3.0 ? 1.6) x 10-2 (7.5 ? 2.3) x 10 4 13.8 ? 1.9 Soil 3-8 cm 26 50() ? 2500 0.669 ? 0.075 (2.6 ? 0.7) x 10 4 (1.5 1.0) X 10-2 0.10 ? 0.08 (1.9 ? 1.4) x 10-2 (2.7 ? 0.8) x 10 4 9.1 ? 1.6
Preburn slash
Fuel 3850 ? 1266 1.193 ? 0.245 0.036 ? 0.010 0.62 + 0.21 1.14 ? 0.15 0.21 ? 0.04 0.25 ? 0.06 43.5 Roots - 2 mm 170 ? 70 Assumed same concentrations as postburn Roots > 2 mm 50 ? 68 Assumed same concentrations as postburn Soil 0-3 cm 14 700 ? 4500 1.028 ? 0.203 (5.3 ? 1.5) x 10-4 (4.1 ? 1.0) x 10-2 0.18 ? 0.07 (4.0 ? 1.0) x 10-2 (8.6 ? 7.3) x 10-4 13.9 ? 2.4 Soil 3-8 cm 26 500 ? 2500 0.644 ? 0.079 (2.1 ? 0.5) x 10-4 (1.8 ? 0.5) x 10-2 0.10 ? 0.05 (2.0 ? 0.9) x 10 2 (4.3 ? 4.1) x 10 8.1 ? 0.7
Postburn
Ash 670 ? 206 1.427 + 0.468 0.233 ? 0.120 2.83 ? 2.11 8.28 ? 4.10 1.59 ? 0.72 0.19 ? 0.07 25.7 Roots - 2 mm 123 ? 86 2.166 ? 0.679 0.045 ? 0.004 0.27 ? 0.26 1.12 ? 0.21 0.27 ? 0.07 0.44 ? 0.18 43.1 Roots > 2 mm 30 ? 70 1.556 ? 0.668 0.023 ? 0.007 0.25 ? 0.20 1.66 ? 0.32 0.23 ? 0.06 0.43 ? 0.14 43.3 Soil 0-3 cm 12 000 ? 2700 0.898 ? 0.045 (5.3 ? 0.7) x 10-4 (4.3 ? 0.9) x 10-2 0.17 + 0.04 (4.5 ? 1.0) x 10-2 (26.5 ? 10.4) x 10-4 11.2 ? 0.7 Soil 3-8 cm 26 500 ? 2500 0.580 ? 0.026 (2.8 ? 0.7) x 10 4 (1.4 ? 0.1) x 10-2 0.08 ? 0.03 (1.7 ? 0.4) x 10-2 (9.8 ? 3.9) x 10 4 7.6 ? 0.2
Postburn and rain
Soil 0-3 cm Assumed 0.747 ? 0.074 (6.2 ? 1.0) x 10 4 (3.9 + 1.4) x 10-2 0.16 ? 0.05 (3.6 ? 0.6) x 10-2 (20.4 ? 6.7) x 10 4 10.3 ? 0.4 same as postburn
Soil 3-8 cm 26 500 ? 2500 0.557 ? 0.058 (2.8 ? 0.5) x 10 4 (1.7 ? 0.9) x 10 2 0.07 ? 0.02 (1.7 ? 0.6) x 10 2 (10.5 ? 3.0) x 10 4 7.4 ? 0.7
June 1981 TROPICAL DEFORESTATION IMPACTS 821
TABLE 3. Carbon dioxide evolution from the soil, soil moisture, and soil and air temperatures before and after the burn. CO2 and soil moisture values are x ? SD; temperatures are means (range).
CO, Soil moisture Temperatures CO Status (g C-m-2-24 h-) (%) Soil Air
Preburn Slash 3.62 ? 1.14 54.2 ? 14.4 21.4 (20.0-22.5) 22.5 (14.3-31.3) Forest 2.52 ? 0.37 39.1 ? 7.2 20.4 (18.0-22.5) 21.7 (15.8-28.0)
Postburn and rain Ash 4.57 ? 0.47 62.5 + 9.4 22.1 (20.6-24.8) 21.3 (19.6-25.0) Forest 4.51 ? 0.77 52.9 ? 6.6 20.7 (19.3-21.8) 20.3 (19.1-22.3)
during the same 24-h run, however, can be used with confidence.
Before the burn, the rate of CO2 evolution was sig- nificantly greater (paired t test, a < .05) from soil be- neath the slash than from forest soil. The soil beneath the insulating layer of slash was significantly wetter than soil beneath the actively transpiring forest. Both soil moisture and the abundance of dead plant material may be responsible for the greater CO2 evolution be- neath the slash. After the burn, however, there was no difference between the rate of CO2 evolution from the soil beneath the ash and the forest.
Seeds in the soil
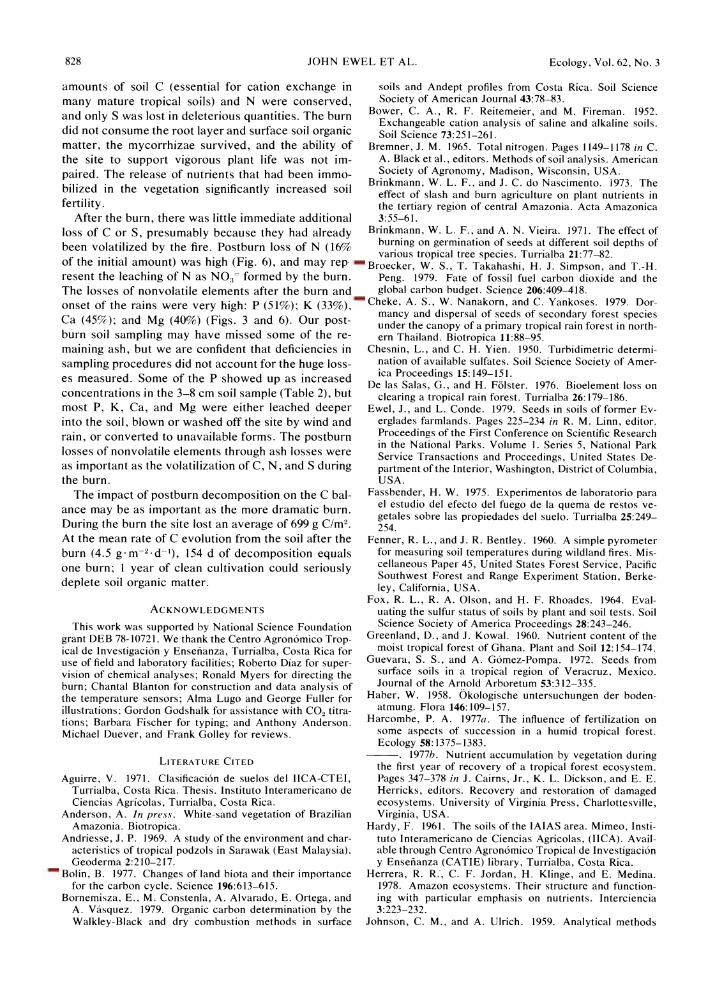
Substantially fewer seeds germinated from soil sam- pled from beneath the slash (=6000 seeds/M2) than from beneath the forest (nearly 8000 seeds/M2), but the decrease was not statistically significant due to large point-to-point variability, especially in the forest (Fig. 2). The number that germinated after the burn (< 3000 seeds/M2) was significantly less (ANOVA and LSD, a < .05) than the number germinating from soil sam- pled from both forest and slash. Germination was quite rapid; at least two-thirds of all seeds that germinated over the 78-d period did so during the 1st 30 d.
The three germinated seed floras were remarkably diverse. The decrease in number of species followed a trend similar to that of the decrease in number of individuals: forest, 67 species; slash, 51 species; and postburn, 37 species. Of the total germinated flora of 104 species, 19 were common to all three treatments. The forest and slash had 28 species in common, and the forest and slash each had 21 species in common with the postburn field.
Plant growth
Soybeans grew equally well in soil taken from be- neath the 1 l-wk-old slash, the forest, and the postburn ash. None of the plants became modulated. Only 16 of 27 plants were infected with mycorrhizal fungi, and there were no significant differences in rate of infec- tion among the three soils. Soybeans infected with mycorrhizae did not grow significantly larger than those that were uninfected. There were no significant differences in dry mass of leaves, stems, reproductive
parts, roots, or total biomass (overall mean = 6.7 g/ plant) among soybeans grown on any of the three soils.
DISCUSSION
Burn temperatures
There are few other reports of temperatures record- ed beneath burning tropical forest slash. Zinke et al. (1978), working in Thailand, reported temperatures as high as 650'C in the fuel 2 cm above the soil surface, dropping to 70'C 2-3 cm beneath the surface. Brink- mann and Vieira (1971) reported surface temperatures of 100'-150'C during their burn in Amazonian Brazil, and temperatures of 95'-1250C at 2 cm in the soil. Lal and Cummings (1979) recorded 740C at a soil depth of 1 cm during a burn of forest slash in Nigeria. The temperatures reported from Brazil and Nigeria seem low, but soil temperatures stayed high for several hours. Uribe et al. (1967) reported no change in soil temperature below 5 cm during a burn in Colombia. Masson (1948) recorded temperatures beneath burning grasslands in Senegal, and found that soil temperature increased only -140C at a soil depth of 2 cm.
Although the fire that races through the slash can be spectacular, its impact on the soil is really very mod- erate. This conclusion has been noted by others (Po- penoe 1960, Nye and Greenland 1960, Seubert et al. 1977, Lal and Cummings 1979), but is often ignored in the rhetoric deploring the fires associated with tropical agriculture. Nye and Greenland (1960) point out that heating to 450-50'C can increase soil fertility, perhaps through increased rates of N mineralization. Sertsu and Sanchez (1978) heated an amorphous Ethiopian soil, and found that fertility increased upon heating to 200'C because of increases in availability of N, P, Fe, and Mn. Temperatures >4000C, however, were det- rimental because of organic matter destruction, fusion of clay particles, and reduced cation exchange capac- ity.
The effect of the burn is ameliorated by the insula- tion of the soil by the slash. Even though a slashed field is a blistering hot environment, the soil surface is well protected and soil moisture is conserved by this nontranspiring layer of dead plant material (Table 3). Thus in our study, the soil moisture not only buffered

822 JOHN EWEL ET AL. Ecology, Vol. 62, No.'
SOIL SEED STORAGE 2
O 10 E
5 8 FOREST
04
0
DAYS AFTER BURN OF 22 MARCH
FIG. 2. Seeds germinated from soil sampled from the for- est, the 1 l-wk-old slash, and after the burn. On each vertical bar, center symbol of each type shows the mean. Top and bottom symbols mark ? 1 SD. Circles refer to forest, triangles to slash, and squares to postburn.
temperatures during the burn, but enabled plants to initiate growth soon after the fire, even before the rains began 2 wk later.
Chemistry
Soil pH increases as a result of burning, and affects P and cation availability. Increases comparable to those at our site (Table 1) have been reported from Zaire ( Laudelot 1954), Guatemala (Popenoe 1960), Ghana (Nye and Greenland 1964), Thailand (Zinke et al. 1978), Brazil (Brinkmann and Nascimento 1973), Peru (Seubert et al. 1977), and Nigeria (Lal and Cum- mings 1979). During the initial postburn phase, ele- ments are readily available for plant uptake, but are also susceptible to leaching.
The amount of nutrient-rich ash deposited on our
site (670 g/m2) was substantially larger than the only other value in the literature: 400 g/m2, measured by Seubert et al. (1977). We are confident that our large sample size (n = 71 ash collectors and 300 depth mea- surements) resulted in an accurate estimate of ash pro- duction and that the fire that produced it was repre- sentative of the intensity used by shifting cultivators. Within days after the burn, the dry season breezes had blown away substantial amounts of the uppermost fluffy white ash. After the onset of the rains, the less thoroughly combusted gray-white ash washed off the site or into the soil, leaving only charcoal fragments on the surface. Charcoal was still evident in the sur- face soil nearly 1 yr after the burn.
Three of the elements studied, Ca, Mg, and P, have sedimentary biogeochemical cycles, and are relatively immobile. The fates of these three elements at our site are summarized in Fig. 3. None of these elements was lost during the burn, but small amounts of Ca (2.6 g/ mi2) and substantial amounts of P (0.3 g/m2) were lost during the 1 1-wk decomposition period. Wood harvest removed 11-16% of the total stock of each of these three elements, but accounted for substantially less than the amount lost by postburn leaching, erosion, and wind (40-5 1%). After the burn and onset of the rains >40%o of the Ca and Mg, but only 20% of the initial amount of P, remained in or above the surface 3 cm of the site. Much of the reduction in P probably resulted from fire-mediated conversion to forms not extracted by our technique. Fassbender (1975) heated seven tropical soils and found that there was a signif- icant release of P as H2PO4-, which then formed stable phosphates of Ca, Fe, and Al.
The other four elements monitored were much more mobile, either because they were readily leached (K), and/or because they were subject to physically or bi- ologically mediated volatilization (C, N, S). One dif- ference often cited as distinguishing temperate and tropical forests is that the nutrients in tropical forests
PHOSPHORUS (2.2 g/m2) CALCIUM (87g/m2) MAGNESIUM (17 g/m2)
WOOD ~~~~~~~~~~~OD DECOMPOSITION
HARVESTHART3HRVS
POST -BDRN S-BR
WINOD LEACHING MPOSITION POST-BURN WIN O LEACHING
(51%) (13%)~~~~~~~~~~~~~41(4%
RE MD IN INS
(20%)
Fic. 3. Fates of the three most immobile elements: P, Ca, and Mg. Amount shown (g/m2) is the initial content of the pre- burn forest, including all aboveground biomass, plus soil and roots to 3 cm.

June 1981 TROPICAL DEFORESTATION IMPACTS 823
CARBON (kg/m2) TO 3 cm IN SOIL
(5,3) ABOVEGROUND
(3.0)
W POST BURN WINDl N HA TO
LEACHINGO 11%;
RuRNED (39%I
16)
P0ST BURN WN
NITROGEN (g/m2)
TO 3 cm IN SOIL (219)
WOOD
HARVESTABVGON <~~~~~~~~~~~~~~~~~ MO0V E OR OU N D
1 (5?00) / \ (68) REMAINN N
RURNED POST- BURN WIND
(23%) 8 LEACHING (14%)
REMAININGI\ I
(57%) RURNED
\ \ (~~~~~~~~~~40%) / \POST BRN WIND
X~~~~~~ LEACHING
SULFUR (g/m2)
TO 3 cm IN SOIL ABOVEGROUND (15) (14)
M AING POST RURN WIND R AININ
(19%) WOOD LEACHING (13 %) PAROST 16 %) WOOD
31 %) 3 4WO)
B OREO BURNED
(44 % 16001( 7%
\\,,>s _ _ ,, 8 L E A C LEACHGN
FIG. 4. Differences in fates of C, N, and S when budget includes only aboveground biomass or extends to soil depth of 3 cm. Amount shown (above pie diagram; kg/m2 C or g/m2 N and S) is the initial content of the preburn forest. There was some accretion of N and S during decomposition.
are primarily immobilized in aboveground biomass, whereas the bulk of the nutrients in most temperate- zone forests are in the soil. At our site this generali- zation is valid for P, Ca, Mg, and K, but not for C, N, or S (Fig. 4). Assuming that the ecosystem potentially affected by the burn extends from whatever is above- ground to a soil depth of 3 cm, we find that 43% of the C, 69W of the N, and 48% of the S (but only 10% of the K) are contained in the upper 3 cm of soil.
These soil storages are relatively immune to vola- tilization during the fire, and thus remain on site after
the burn. Vine (1948, cited by Nye and Greenland 1964) reported that felling and burning a 30-yr-old Ni- gerian forest had little effect on soil C and N; Nye and Greenland (1964) reported increases in soil C and N (presumably because of admixture of vegetation) after felling an ~50-yr-old forest in Ghana; and Seubert et al. (I1977) found that soil C and N increased after felling and burning of a 17-yr-old forest in Amazonian Peru.
Most of this belowground storage is in organic mat- ter other than roots, which account for only 4% of the belowground C, 2% of the belowground N, and 7%

824 JOHN EWEL ET AL. Ecology, Vol. 62, No. 3
of the belowground S. N incorporated in soil organic matter is not likely to be in forms readily available for plant uptake, but the popular idea that burning results in loss of most N is clearly incorrect.
The soil at our site is relatively nutrient rich, so one might assume that the conservation of N, C, and S during the burn is an artifact of this site characteristic. This is not correct. On the most nutrient-poor tropical sites, such as the sterile sands of Amazonia and Bor- neo (Andriesse 1969, Herrera et al. 1978, Stark and Jordan 1978), the stature of the aboveground com- munity is low and the soil surface is topped with a deep (up to 30 cm, Stark and Spratt 1977) layer of organic matter and roots (Klinge and Herrera 1977). If this layer is not consumed by fires associated with tropical forest clearing, the fraction of C, N, and S conserved by the surface-soil organic mat is probably even more marked on these extremely infertile soils than on the relatively fertile soils of our site. However, Anderson (in press) noted that, on nonhydromorphic white-sand soils of central Amazonia, the root mat is often consumed by fire after the vegetation is felled. On our site the conservation of a substantial fraction of total C, N, and S in the upper portion of the soil reflects both high soil storage (although less than on more nutrient-poor sites) and modest aboveground biomass ( 5.2 kg/M2).
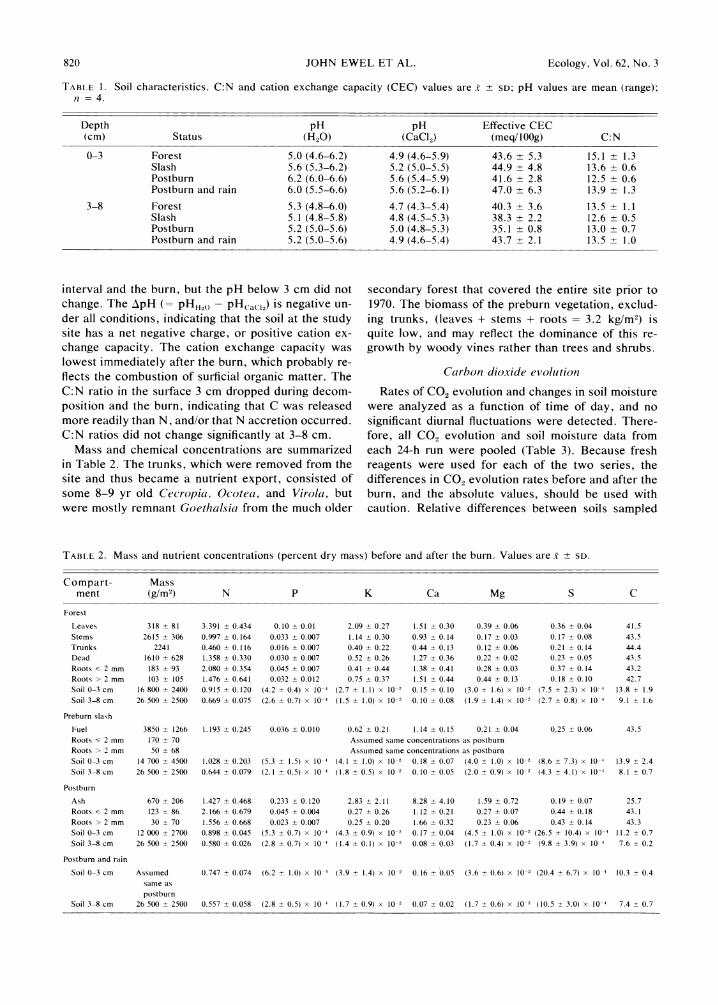
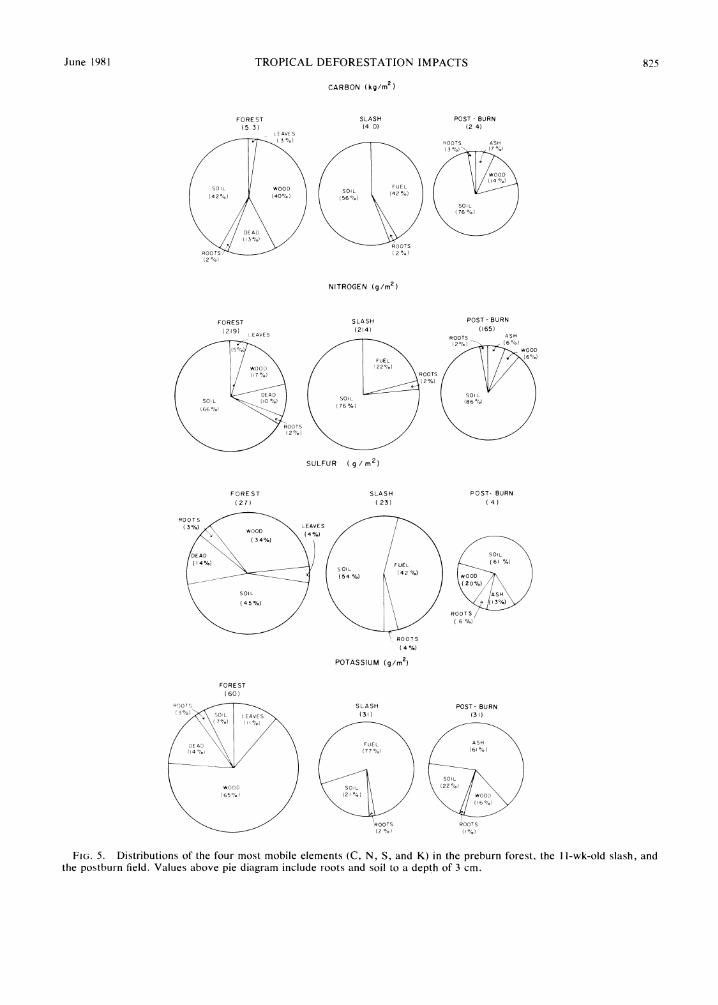
The distributions of K, C, N, and S in the forest, slash, and after the burn are shown in Fig. 5. The soil accounts for most C, N, and S throughout, whereas most K is accounted for in the wood, fuel, and post- burn wood and ash.
The ash is especially rich in K (analyses averaged 2.8%), and accounts for over half of the postburn K on the site. Similar findings have been reported by Nye and Greenland (1960), Brinkmann and Nascimen- to (1973), and Seubert et al. (1977). The element-rich ash is readily susceptible to wind and water erosion, which may account for the loss of large quantities of nonvolatile elements from burned fields.
Leaves account for only 3-7% of the initial amounts of K, C, N, and S. Leaf decomposition is so complete by 11 wk that most of the nutrients they contain are released to the soil prior to the burn.
Carbon dioxide evolution
Our values of carbon evolution from the soil (Table 3) are higher than most values reported for temperate- zone forests. Schlesinger (1977) reviewed the litera- ture and reported temperate-zone means of 0.3-1.4 kg C.m-2 yr-1, assuming a 9-mo season (= 1.1-5.1 g C-m-2 d-l). Data (g C.m-2 d-1 ) from tropical areas are higher than those from the temperate zone. Mal- dague and Hilger (1963, cited by Schlesinger 1977) re- ported a mean of 3.4 from four equatorial forests; Schulze (1967) reported some of the highest values in the literature (savanna in dry season 2.5 , gallery forest 10.4, wet forest 12. 1, and young succession 19.5) from
his work in Costa Rica; Yoda and Kira (1969) reported nine measurements from rain forests in Thailand, with a mean of 4.4; Odum et al. (1970) evaluated several methodologies in Puerto Rico and reported values ranging from 1.6 to 10.2; Wanner (1970) measured rates of 0.8-1.5 in Java and 0.9-2.0 in Sarawak; John- son et al. (1975) reported ranges of 0.5-3.1 and 2.6- 7.1 from two sites in Costa Rica; and Ogawa (1978) reported 3.9 from Malaysia. Some of the lowest values in the tropical literature are 0.6 and 1.4, reported by Medina (1969) from two sites in Venezuela. However, we calculate that his weak solution (0.5N KOH), small absorbing volume (10 mL), and long absorption inter- val (10-12 h) would not have enabled him to detect accurately amounts of evolved CO2 much larger than those he reported. Some investigators (Schulze 1967, Medina 1969) follow the suggestion of Haber (1958) and multiply the measured amount of absorbed CO2 by a correction factor of 1.33. Most values in the lit- erature (including ours) do not include this correction factor.
Several workers (Reiners 1968, Schlesinger 1977, Schwartzkopf 1978) have stressed the importance of soil moisture, soil temperature, and/or wind velocity at the soil surface as environmental factors that dra- matically affect rates of CO2 evolution. Wind velocity was eliminated as a variable in our experiments be- cause the absorbing receptacles were enclosed be- neath inverted cans.
We anticipated that rates of CO2 evolution would exhibit diurnal trends, tracking the sinusoidal variation in temperature described as typical of data from tem- perate-zone forests by Witkamp (1969). Our data showed no diurnal pattern. In fact, three of our four diurnal runs exhibited minima about midday; the fourth showed one just before midnight. Maxima oc- curred at various times. Under the preburn slash the maximum occurred just prior to dawn, when the con- vection caused by higher soil than air temperature might explain high rates of CO2 evolution, as suggest- ed by Witkamp (1969).
Soil moisture probably exerted a great influence over the rates of CO2 evolution we observed. Before the burn, the slashed field had significantly higher soil moisture content than the surrounding forest (Table 3). The ratio of rate of C evolution from the forest soil to the rate of evolution from the slash (0.69) was al- most equal to the ratio of forest soil moisture content to slash soil moisture content (0.72). Prior to the burn, before the rains began, soil moisture may have limited microbial activity.
The postburn CO2 evolution measurements were made after the first rains. Even though soil moisture was still higher in the burned field than in the forest, the absolute value of soil moisture was greater in both places than it had been prior to the burn. The rains may have increased soil moisture to the point where water was no longer limiting for microbial activity in
June 1981 TROPICAL DEFORESTATION IMPACTS 825
CARBON (kg/m2)
FORE ST SLASH POST - BURN (5.3) (4 0) (2.4)
LEAVES
(3 %) OOTS ASH (3O) (7( 2
(2 %)~~~~~~~~~~~~~~~~~~~~1%
S W SOIL (42 %) (42%) (40%) (56%)
SOIL
(76 %(
ROOTS ROOTS ,0 ' ;;: \ !: ;?(2%) (2 %(/)
NITROGEN (g/m2)
FOREST SLASH POST -BURN (219) (214) (165)
LEAVES ~~~~~~ ~~~~~~~~ROOTS ASH
; 5%) 4D/ ) + ( 54 X(2 %) WOOD
WOOD '22%)~ ~~~~~~~~~~~~~~%
RROOTS
SO 22)SOL OI
ROOTS OOT
(2%)
SULFURIU (g/m )
OREST SLASH POST- BURN
( 7)6 (23) (31)
ROOTS
3 2) % (47) FUEL (614 )
(54) OO (3 %)~~~~~~~~~~~~2%
SOIL ASH~~~~~~~~~~~~~~~~~~~~~~~~~I (45%) ~~~~~~~~ ~FUL(613%)
ROOTS
(4 %)
POTASSIUM (g/m2)
FOREST (60)
ROOTS SLASH POST- BURN
FIL LEAVES (31) (31)
(7%) W aa
DEAD FUEL ASH
SIL
WOOD SIL (22 %)
(65%) (21 %) WO
16)
ROOTS ~~~ROOTS (2%) (I %)
FIG. 5. Distributions of the four most mobile elements (C, N, S, and K) in the preburn forest, the 1 1-wk-old slash, and the postburn field. Values above pie diagram include roots and soil to a depth of 3 cm.
826 JOHN EWEL ET AL. Ecology, Vol. 62, No. 3
either place, which may account for the similarity in the postburn rates of CO, evolution.
Total C (soil organic matter plus roots) in the surface 3 cm after the burn was ~3.4 kg/M2. A soil respiration rate of 4.5 g C.m-2 d-l would deplete that soil C in a little over 2 yr if all inputs were eliminated. How- ever, organic matter breakdown slows as the easily decomposed materials are exhausted and more refrac- tory compounds remain, so depletion would occur more slowly. The postburn decomposition of soil or- ganic matter under clean cultivation systems probably results in more drastic site degradation than the burn itself.
Seeds in the soil
The mean number of seeds that germinated from soil sampled from beneath the forest (7786 seeds/M2) was higher than the values reported for other tropical areas. Data (seed number/M2) on soil seed storage in mature forests from other parts of the tropics include: Thailand, 103, 121, and 182 (Cheke et al. 1979); Mex- ico, 431 and 614 (Guevara and G6mez-Pompa 1972); Sabah, 59 (Liew 1973); and Nigeria, 232 (Keay 1960). Samples from tropical second-growth and agricultural areas are generally higher, but still somewhat lower than ours: Mexico, 1441 and 3125 (Guevara and G6m- ez-Pompa 1972); and Belize, 6488 (Kellman 1974). All of these values, including those from our Costa Rican study site, are considerably lower than the value re- ported from 3-yr-old vegetation on abandoned farm- lands in the Everglades of South Florida: 30,125 seeds/ m2 (Ewel and Conde 1979). The seven sites studied by Ewel and Conde (1979) included three mature com- munities and, excluding the 3-yr-old site, their values ranged from ~500 to 6000 seeds/M2.
Comparisons of the number of species recorded at our site with the numbers reported by others are more tenuous because of differences in numbers and sizes of samples, and the duration of the germination period. Our value from the forest (67 species) is higher than others from the tropics (number of species): Thailand, 16, 22, and 27 (Cheke et al. 1979); Mexico, 14, 21, 27, and 28 (Guevara and G6mez-Pompa 1972); Belize, 54 (Kellman 1974); Sabah, 31 (Liew 1973); and Nigeria, 39 (Keay 1960). Former agricultural lands and succes- sional vegetation usually have more species, as well as more individuals, in their soil seed flora.
During the 11 wk that the felled vegetation was de- composing and drying, both the number of individuals and the number of species stored as seeds in the soil dropped to 76% of the values observed beneath the forest. These decreases were probably due to reduced autochthonous seed inputs, coupled with loss of via- bility of seeds in the soil, and germination.
The burn killed 52% of the seeds and 27% of the species that were present beneath the mulch prior to the fire. Brinkmann and Vieira (1971), working with
seeds of 16 tree species placed in the soil beneath slash in Amazonian Brazil, found that burning reduced ger- mination of seeds in the surface 5 cm of soil to about one-third that of controls. They reported surface tem- peratures during their burn of 100'-150'C, which is cooler than most burns associated with tropical land clearing.
The slash and burn decreased soil seed storage by 63%: 24% loss during the mulch period and an addi- tional 39% during the burn. Burning reduces the amount of initial regrowth, which is one reason it is done by most shifting cultivators. Site accessibility, pest control, and nutrient release are other reasons. The mulch and burn reduce the number of competing individuals more than the number of competing species. The species declined only 51%: 24% during mulch period and 27% during the burn.
CONCLUSIONS
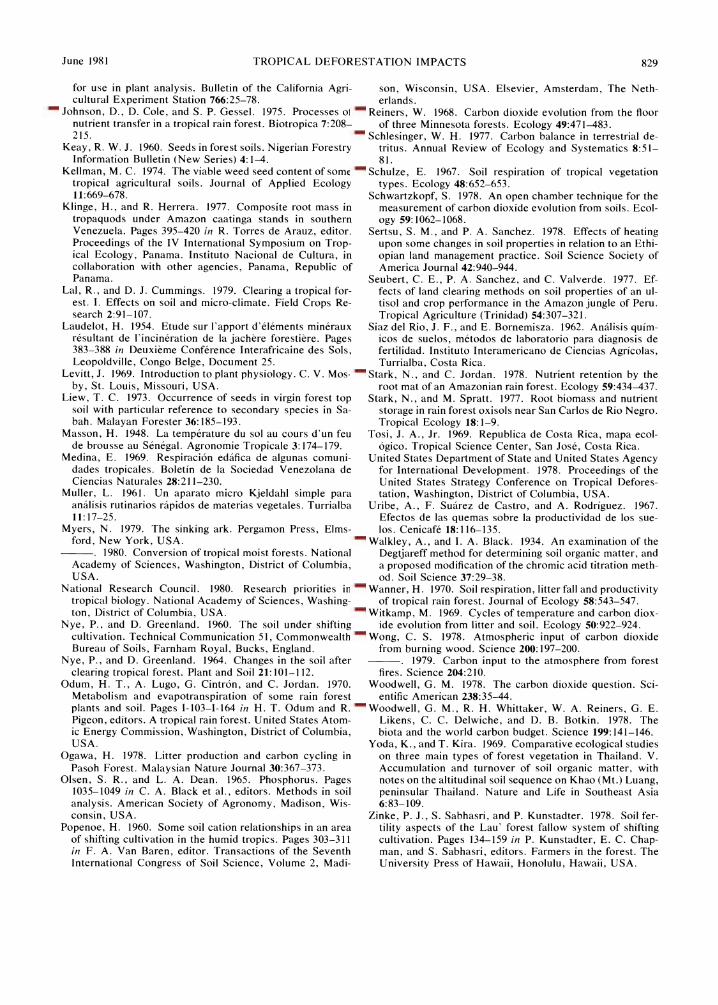
Wood harvest removed >10% of the total standing crop (to 3-cm soil depth) of each of the seven elements studied, except N (Figs. 3 and 6). Descriptions of shift- ing agriculture usually indicate that the forest is felled and burned in situ. Today that is still true in remote areas, but the situation is changing quickly. As acces- sibility increases, forest clearing is more commonly associated with wood harvest, and that trend is sure to continue as wood supplies become more scarce near urban areas. Also, much forest clearing in the tropics today is done by large agricultural and forestry busi- nesses, and wood harvest is often an integral part of their activities. The loss of essential elements via har- vested wood will become an increasingly important consideration in tropical ecosystem management, and may lead to rapid degradation of the most nutrient- poor sites.
The drying and mulching period is an important, but often neglected, part of the shifting cultivation cycle. On our site 33% of the K (Fig. 6) and 13% of the P (Fig. 3) were lost during the 11 wk prior to the burn. The concentration of K increased at both the 0-3 and 3-8 cm soil depths during the mulch period, and P increased in the 0-3 cm sample (Table 2), but more K and P were lost than were trapped by the upper 8 cm of soil. Losses of other elements did not exceed 6%. The slash conserved soil moisture better than the sur- rounding evergreen vegetation, and recolonization be- gan quickly after the burn.
The burn volatilized 31% of the initial amount of C, 22% of the N, and 49% of the S (Fig. 6). C and N supplies might be restored by plant growth and N-fix- ation during succession, but the loss of S may be more permanent. Formerly S was added to tropical agricul- tural soils as part of many N fertilizers [e.g., (NH4)2SO4j, but today, with increasing use of high-N, S-free fertilizers (e.g., urea), S is likely to become in-

June 1981 TROPICAL DEFORESTATION IMPACTS 827
CARBON (kg/rm2)
DECOMPOSITION (O 3)
WIND F O R E S T SSLASH POST BURN A
(4 0) (2 4) LEACHED (Ist RAIN)
(0,3)
WOOD BURN HARVEST (I 6)
(I 0)
NITROGEN (g/rn I DECOMPOSITION
(5)
WIND FOREST SLASH POST-BURN A
(Ist RAIN) (34)
WOOD HARVEST BURN
(I 0) (49)
SULFUR (g/m2) DECOM POSITION
WIND
BUN LEACHES (15) (4) ~~~~~~~~~~~~~~~~~~~(Ist RAIN)
WOOD BURN HARVEST (7)
(5)
POTASSIUM (g/m 2)
DECOMPOSITION (20)
FOREST SLASH POST BURN WIND (60) (31) (31) LECE
LEACHES
(st RAIN) (20)
WOOD HARVEST
(9)
FIG. 6. Summary storages and losses of the four most mobile elements (C, N, S, and K) during wood harvest, decom- position, burning, and postburn erosion.
creasingly limiting, especially where burning is a rou- tine agricultural practice.
The burn also reduced, by more than half, the num- ber of germinable seeds on our site. Nevertheless, within 3 mo the site was covered by a dense, vigorous
regrowth containing >100 species. Burning may re- duce initial weed competition by killing on-site seeds, but it did not significantly retard succession on our site.
Burning did not degrade site quality. Substantial
828 JOHN EWEL ET AL. Ecology, Vol. 62, No. 3
amounts of soil C (essential for cation exchange in many mature tropical soils) and N were conserved, and only S was lost in deleterious quantities. The burn did not consume the root layer and surface soil organic matter, the mycorrhizae survived, and the ability of the site to support vigorous plant life was not im- paired. The release of nutrients that had been immo- bilized in the vegetation significantly increased soil fertility.
After the burn, there was little immediate additional loss of C or S, presumably because they had already been volatilized by the fire. Postburn loss of N (16% of the initial amount) was high (Fig. 6), and may rep- resent the leaching of N as NO:= formed by the burn. The losses of nonvolatile elements after the burn and onset of the rains were very high: P (51%); K (33%); Ca (45%); and Mg (40%) (Figs. 3 and 6). Our post- burn soil sampling may have missed some of the re- maining ash, but we are confident that deficiencies in sampling procedures did not account for the huge loss- es measured. Some of the P showed up as increased concentrations in the 3-8 cm soil sample (Table 2), but most P, K, Ca, and Mg were either leached deeper into the soil, blown or washed off the site by wind and rain, or converted to unavailable forms. The postburn losses of nonvolatile elements through ash losses were as important as the volatilization of C, N, and S during the burn.
The impact of postburn decomposition on the C bal- ance may be as important as the more dramatic burn. During the burn the site lost an average of 699 g C/M2. At the mean rate of C evolution from the soil after the burn (4.5 g-m-2 d-1), 154 d of decomposition equals one burn; 1 year of clean cultivation could seriously deplete soil organic matter.
ACKNOWLEDGMENTS
This work was supported by National Science Foundation grant DEB 78-10721. We thank the Centro Agron6mico Trop- ical de Investigaci6n y Ensefianza, Turrialba, Costa Rica for use of field and laboratory facilities; Roberto Diaz for super- vision of chemical analyses; Ronald Myers for directing the burn; Chantal Blanton for construction and data analysis of the temperature sensors; Alma Lugo and George Fuller for illustrations; Gordon Godshalk for assistance with CO2 titra- tions; Barbara Fischer for typing; and Anthony Anderson. Michael Duever, and Frank Golley for reviews.
LITERATURE CITED
Aguirre, V. 1971. Clasificacion de suelos del IICA-CTEI, Turrialba, Costa Rica. Thesis. Instituto Interamericano de Ciencias Agricolas, Turrialba, Costa Rica.
Anderson, A. In press. White-sand vegetation of Brazilian Amazonia. Biotropica.
Andriesse, J. P. 1969. A study of the environment and char- acteristics of tropical podzols in Sarawak (East Malaysia). Geoderma 2:210-217.
Bolin, B. 1977. Changes of land biota and their importance for the carbon cycle. Science 196:613-615.
Bornemisza, E., M. Constenla, A. Alvarado, E. Ortega, and A. Vasquez. 1979. Organic carbon determination by the Walkley-Black and dry combustion methods in surface
soils and Andept profiles from Costa Rica. Soil Science Society of American Journal 43:78-83.
Bower, C. A., R. F. Reitemeier, and M. Fireman. 1952. Exchangeable cation analysis of saline and alkaline soils. Soil Science 73:251-261.
Bremner, J. M. 1965. Total nitrogen. Pages 1149-1178 in C. A. Black et al., editors. Methods of soil analysis. American Society of Agronomy, Madison, Wisconsin, USA.
Brinkmann, W. L. F., and J. C. do Nascimento. i973. The effect of slash and burn agriculture on plant nutrients in the tertiary region of central Amazonia. Acta Amazonica 3:55-61.
Brinkmann, W. L. F., and A. N. Vieira. 1971. The effect of burning on germination of seeds at different soil depths of various tropical tree species. Turrialba 21:77-82.
Broecker, W. S., T. Takahashi, H. J. Simpson, and T.-H. Peng. 1979. Fate of fossil fuel carbon dioxide and the global carbon budget. Science 206:409-418.
Cheke, A. S., W. Nanakorn, and C. Yankoses. 1979. Dor- mancy and dispersal of seeds of secondary forest species under the canopy of a primary tropical rain forest in north- ern Thailand. Biotropica 11:88-95.
Chesnin, L., and C. H. Yien. 1950. Turbidimetric determi- nation of available sulfates. Soil Science Society of Amer- ica Proceedings 15: 149-151.
De las Salas, G., and H. Foster. 1976. Bioelement loss on clearing a tropical rain forest. Turrialba 26:179-186.
Ewel, J., and L. Conde. 1979. Seeds in soils of former Ev- erglades farmlands. Pages 225-234 in R. M. Linn, editor. Proceedings of the First Conference on Scientific Research in the National Parks. Volume 1. Series 5, National Park Service Transactions and Proceedings, United States De- partment of the Interior, Washington, District of Columbia, USA.
Fassbender, H. W. 1975. Experimentos de laboratorio para el estudio del efecto del fuego de la quema de restos ve- getales sobre las propiedades del suelo. Turrialba 25:249- 254.
Fenner, R. L., and J. R. Bentley. 1960. A simple pyrometer for measuring soil temperatures during wildland fires. Mis- cellaneous Paper 45, United States Forest Service, Pacific Southwest Forest and Range Experiment Station, Berke- ley, California, USA.
Fox, R. L., R. A. Olson, and H. F. Rhoades. 1964. Eval- uating the sulfur status of soils by plant and soil tests. Soil Science Society of America Proceedings 28:243-246.
Greenland, D., and J. Kowal. 1960. Nutrient content of the moist tropical forest of Ghana. Plant and Soil 12:154-174.
Guevara, S. S., and A. Gomez-Pompa. 1972. Seeds from surface soils in a tropical region of Veracruz, Mexico. Journal of the Arnold Arboretum 53:312-335.
Haber, W. 1958. Okologische untersuchungen der boden- atmung. Flora 146: 109-157.
Harcombe, P. A. 1977a. The influence of fertilization on some aspects of succession in a humid tropical forest. Ecology 58: 1375-1383.
. 1977b. Nutrient accumulation by vegetation during the first year of recovery of a tropical forest ecosystem. Pages 347-378 in J. Cairns, Jr., K. L. Dickson, and E. E. Herricks, editors. Recovery and restoration of damaged ecosystems. University of Virginia Press, Charlottesville, Virginia, USA.
Hardy, F. 1961. The soils of the IAIAS area. Mimeo, Insti- tuto Interamericano de Ciencias Agricolas, (TICA). Avail- able through Centro Agron6mico Tropical de Investigacion y Ensefianza (CATIE) library, Turrialba, Costa Rica.
Herrera, R. R., C. F. Jordan, H. Klinge, and E. Medina. 1978. Amazon ecosystems. Their structure and function- ing with particular emphasis on nutrients. Interciencia 3:223-232.
Johnson, C. M., and A. Ulrich. 1959. Analytical methods
June 1981 TROPICAL DEFORESTATION IMPACTS 829
for use in plant analysis. Bulletin of the California Agri- cultural Experiment Station 766:25-78.
Johnson, D., D. Cole, and S. P. Gessel. 1975. Processes of nutrient transfer in a tropical rain forest. Biotropica 7:208- 215.
Keay, R. W. J. 1960. Seeds in forest soils. Nigerian Forestry Information Bulletin (New Series) 4:1-4.
Kellman, M. C. 1974. The viable weed seed content of some tropical agricultural soils. Journal of Applied Ecology 11:669-678.
Klinge, H., and R. Herrera. 1977. Composite root mass in tropaquods under Amazon caatinga stands in southern Venezuela. Pages 395-420 in R. Torres de Arauz, editor. Proceedings of the IV International Symposium on Trop- ical Ecology, Panama. Instituto Nacional de Cultura, in collaboration with other agencies, Panama, Republic of Panama.
Lal, R., and D. J. Cummings. 1979. Clearing a tropical for- est. I. Effects on soil and micro-climate. Field Crops Re- search 2:91-107.
Laudelot, H. 1954. Etude sur l'apport d'616ments mineraux resultant de l'incineration de la jachere forestiere. Pages 383-388 in Deuxieme Conference Interafricaine des Sols, Leopoldville, Congo Belge, Document 25.
Levitt, J. 1969. Introduction to plant physiology. C. V. Mos- by, St. Louis, Missouri, USA.
Liew, T. C. 1973. Occurrence of seeds in virgin forest top soil with particular reference to secondary species in Sa- bah. Malayan Forester 36:185-193.
Masson, H. 1948. La temperature du sol au cours d'un feu de brousse au Senegal. Agronomie Tropicale 3:174-179.
Medina, E. 1969. Respiracidn eddfica de algunas comuni- dades tropicales. Boletin de la Sociedad Venezolana de Ciencias Naturales 28:211-230.
Muller, L. 1961. Un aparato micro Kjeldahl simple para analisis rutinarios rapidos de materias vegetales. Turrialba 11:17-25.
Myers, N. 1979. The sinking ark. Pergamon Press, Elms- ford, New York, USA.
. 1980. Conversion of tropical moist forests. National Academy of Sciences, Washington, District of Columbia, USA.
National Research Council. 1980. Research priorities in tropical biology. National Academy of Sciences, Washing- ton, District of Columbia, USA.
Nye, P., and D. Greenland. 1960. The soil under shifting cultivation. Technical Communication 51, Commonwealth Bureau of Soils, Farnham Royal, Bucks, England.
Nye, P., and D. Greenland. 1964. Changes in the soil after clearing tropical forest. Plant and Soil 21:101-112.
Odum, H. T., A. Lugo, G. Cintr6n, and C. Jordan. 1970. Metabolism and evapotranspiration of some rain forest plants and soil. Pages 1-103-1-164 in H. T. Odum and R. Pigeon, editors. A tropical rain forest. United States Atom- ic Energy Commission, Washington, District of Columbia, USA.
Ogawa, H. 1978. Litter production and carbon cycling in Pasoh Forest. Malaysian Nature Journal 30:367-373.
Olsen, S. R., and L. A. Dean. 1965. Phosphorus. Pages 1035-1049 in C. A. Black et al., editors. Methods in soil analysis. American Society of Agronomy, Madison, Wis- consin, USA.
Popenoe, H. 1960. Some soil cation relationships in an area of shifting cultivation in the humid tropics. Pages 303-311 in F. A. Van Baren, editor. Transactions of the Seventh International Congress of Soil Science, Volume 2, Madi-
son, Wisconsin, USA. Elsevier, Amsterdam, The Neth- erlands.
Reiners, W. 1968. Carbon dioxide evolution from the floor of three Minnesota forests. Ecology 49:471-483.
Schlesinger, W. H. 1977. Carbon balance in terrestrial de- tritus. Annual Review of Ecology and Systematics 8:51- 81.
Schulze, E. 1967. Soil respiration of tropical vegetation types. Ecology 48:652-653.
Schwartzkopf, S. 1978. An open chamber technique for the measurement of carbon dioxide evolution from soils. Ecol- ogy 59:1062-1068.
Sertsu, S. M., and P. A. Sanchez. 1978. Effects of heating upon some changes in soil properties in relation to an Ethi- opian land management practice. Soil Science Society of America Journal 42:940-944.
Seubert, C. E., P. A. Sanchez, and C. Valverde. 1977. Ef- fects of land clearing methods on soil properties of an ul- tisol and crop performance in the Amazon jungle of Peru. Tropical Agriculture (Trinidad) 54:307-321.
Siaz del Rio, J. F., and E. Bornemisza. 1962. Andlisis quim- icos de suelos, metodos de laboratorio para diagnosis de fertilidad. Instituto Interamericano de Ciencias Agricolas, Turrialba, Costa Rica.
Stark, N., and C. Jordan. 1978. Nutrient retention by the root mat of an Amazonian rain forest. Ecology 59:434-437.
Stark, N., and M. Spratt. 1977. Root biomass and nutrient storage in rain forest oxisols near San Carlos de Rio Negro. Tropical Ecology 18:1-9.
Tosi, J. A., Jr. 1969. Republica de Costa Rica, mapa ecol- ogico. Tropical Science Center, San Jose, Costa Rica.
United States Department of State and United States Agency for International Development. 1978. Proceedings of the United States Strategy Conference on Tropical Defores- tation, Washington, District of Columbia, USA.
Uribe, A., F. Suarez de Castro, and A. Rodriguez. 1967. Efectos de las quemas sobre la productividad de los sue- los. Cenicafe 18:116-135.
Walkley, A., and I. A. Black. 1934. An examination of the Degtjareff method for determining soil organic matter, and a proposed modification of the chromic acid titration meth- od. Soil Science 37:29-38.
Wanner, H. 1970. Soil respiration, litter fall and productivity of tropical rain forest. Journal of Ecology 58:543-547.
Witkamp, M. 1969. Cycles of temperature and carbon diox- ide evolution from litter and soil. Ecology 50:922-924.
Wong, C. S. 1978. Atmospheric input of carbon dioxide from burning wood. Science 200:197-200.
. 1979. Carbon input to the atmosphere from forest fires. Science 204:210.
Woodwell, G. M. 1978. The carbon dioxide question. Sci- entific American 238:35-44.
Woodwell, G. M., R. H. Whittaker, W. A. Reiners, G. E. Likens, C. C. Delwiche, and D. B. Botkin. 1978. The biota and the world carbon budget. Science 199:141-146.
Yoda, K., and T. Kira. 1969. Comparative ecological studies on three main types of forest vegetation in Thailand. V. Accumulation and turnover of soil organic matter, with notes on the altitudinal soil sequence on Khao (Mt.) Luang, peninsular Thailand. Nature and Life in Southeast Asia 6:83-109.
Zinke, P. J., S. Sabhasri, and P. Kunstadter. 1978. Soil fer- tility aspects of the Lau' forest fallow system of shifting cultivation. Pages 134-159 in P. Kunstadter, E. C. Chap- man, and S. Sabhasri, editors. Farmers in the forest. The University Press of Hawaii, Honolulu, Hawaii, USA.