sky sox deliverable
TRANSCRIPT

Business Research Division │ Leeds School of Business │University of Colorado at Boulder
1
Colorado Springs Sky Sox
Valuing Non-Traditional Media Inventory
Leeds School of Business
Business of Sports Program
July 23, 2010
Research Team: Mark Ernster
Gregory Hall
Thomas Moles
Spencer Thomas

Business Research Division │ Leeds School of Business │University of Colorado at Boulder
2
Table of Contents Page
Table of Contents i
List of Figures i
List of Tables i
Executive Summary 3
Introduction 4
Methodology 4
Assumptions & Equations 6
Comparative Analysis 8
Air Force Academy 8
Cheyenne Mountain Zoo 9
South Australian National Football League (SANFL): AAM Stadium 10
Theories and Variables Used In Valuing Non-traditional Media 10
Clutter Analysis 13
Suggestions 13
Sky Sox Outfield Sign Adjustment 13
Concourse Signage 15
Standardization of Signage 16
Suggestions for the Future 16
Conclusion 16
Appendix 17
References 19
Bibliography 20
List of Figures
Figure I: Aggregate Square Footage v. $/ft2/K Impressions 5
Figure II: Aggregate Impressions v. Value 6
List of Tables
Table 1 17
Table 2 17
Table 3: Colorado Springs Sky Sox 17
Table 4: Omaha Royals 17
Table 5: Albuquerque Isotopes 18
Table 6: Syracuse Chiefs 18
Table 7: Aggregate 18
Table 8 19
Table 9 14
Table 10 15

Business Research Division │ Leeds School of Business │University of Colorado at Boulder
3
Executive Summary
The CU Business of Sports Sky Sox team has been asked by Assistant General Manager
of Corporate Partnerships & Marketing at Colorado Springs Sky Sox Baseball, Matt Person, to
conduct a study examining methods of valuing signage, specifically, to value an “eyeball,” or an
impression. It was designed to examine the return on investment sponsors are receiving from
advertising at Security Service Field. The Sky Sox fear they are undervaluing their signage, and
without appropriate justification, have no leverage to change their prices. This study will help the
Sky Sox‟s ability to justify prices set on signage to their sponsors.
The Sky Sox market includes companies located in the Colorado Springs area interested
in advertising to the minor league baseball demographic, which is heavily family oriented. Their
competition includes in-house advertising, the Cheyenne Mountain Zoo, the Air Force
Academy‟s Falcon Stadium, the World Arena as well as the numerous outdoor activities
available in the Colorado Springs area.
We are proposing comparative analysis as a means for comparing the cost of signage at
Security Service Field to the cost of signage of other minor league baseball teams, similar sports
clubs and local competition. We have factored attendance for each team, size of the sign,
location and an analysis of clutter into our research. By aggregating the pricing structure of four
minor league teams and analyzing the Sky Sox place within them, the team will be able to justify
their pricing if they decide to increase it. Our team has also included the subjective aspects of
selling signage and theories behind valuing impressions such as the effects of clutter, location
and size. Additionally, there are a number of new ideas presented concerning new sign locations
and orientation of the signs (notably in the concourse).

Business Research Division │ Leeds School of Business │University of Colorado at Boulder
4
The Sky Sox revenue is dependent on a number of aspects. In-stadium revenue sources
include concessions, event sponsorships and stadium signage. Although concessions generate the
most revenue for the Sky Sox, their partnerships with sponsors have a significant impact on the
bottom line.
Introduction
This document presents the challenge facing the Sky Sox, comparative analysis aimed to
aid the Sky Sox in better understanding the situation, and suggestions to help the Sky Sox
accurately measure the return on investment for their inventory. Return on investment on
advertising is difficult to quantify in any industry, because it is difficult to track the effectiveness
of the advertisement. In order to present the Sky Sox with a resolution, comparative analysis
allowed for insight into similar minor league baseball teams as well as local competition, an
international reference and marketing agencies. By doing this the Sky Sox can identify problems
with their current method for valuing signs and create a more justifiable method.
Methodology
Through comparative analysis of four minor league baseball teams we were able to place
an estimated value on stadium signage. We considered three factors for each set of stadium
signs: attendance (impressions), location & clutter of the sign, and size. These factors
allowed us to compare price per square foot values in association with the number of impressions
they receive. This way we have an even playing field, so to speak, in comparing how stadium
signs are priced. Through this analysis, we noticed a downward trending value for the price per
square foot per thousand impressions ($/ft²/K impressions) in relation to total square footage

Business Research Division │ Leeds School of Business │University of Colorado at Boulder
5
across the board. This finding wasn‟t necessarily surprising, but it provided a benchmark for us
to determine a true value in stadium sign sponsorship.
The downward trend in Figure 1 (below; note: each figure is based on a respective table
in the appendix) demonstrates the decreasing price our selected clubs (Albuquerque Isotopes,
Omaha Royals, Syracuse Chiefs and Colorado Springs Sky Sox) charge per square foot of
signage dependant on how many impressions those signs receive. Through this aggregate study,
we can estimate an average value of one thousand impressions in relation to the value of the sign.
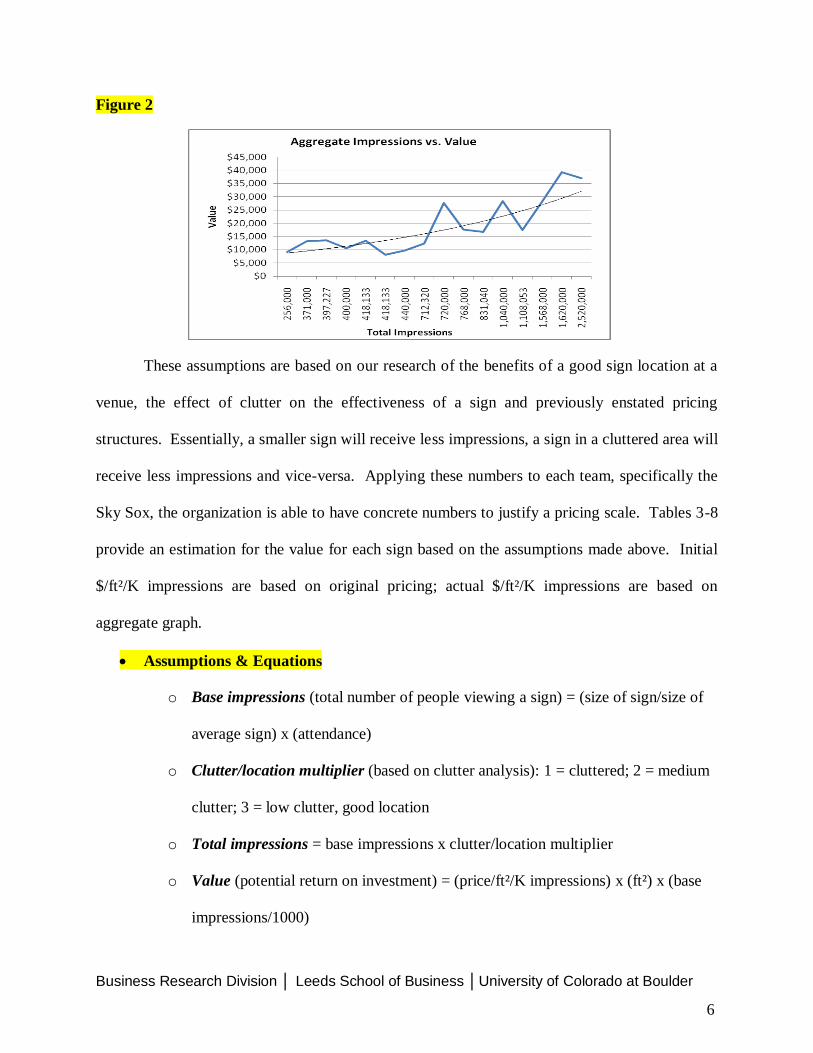
Figure 1
Assuming that a sign of a given size draws a specific price per ft² per thousand
impressions that it coordinates to on this graph (for a value x, there is a y), we can estimate the
value of a sign dependent on its size, location relative to clutter and the number of impressions it
receives. The return value is an approximation for the value of a sign based on the pricing
structure of the four teams‟ prices we analyzed. As indicated by Figure 2, the value of the sign
increases exponentially as the number of impressions increases.
Business Research Division │ Leeds School of Business │University of Colorado at Boulder
6
Figure 2
These assumptions are based on our research of the benefits of a good sign location at a
venue, the effect of clutter on the effectiveness of a sign and previously enstated pricing
structures. Essentially, a smaller sign will receive less impressions, a sign in a cluttered area will
receive less impressions and vice-versa. Applying these numbers to each team, specifically the
Sky Sox, the organization is able to have concrete numbers to justify a pricing scale. Tables 3-8
provide an estimation for the value for each sign based on the assumptions made above. Initial
$/ft²/K impressions are based on original pricing; actual $/ft²/K impressions are based on
aggregate graph.
Assumptions & Equations
o Base impressions (total number of people viewing a sign) = (size of sign/size of
average sign) x (attendance)
o Clutter/location multiplier (based on clutter analysis): 1 = cluttered; 2 = medium
clutter; 3 = low clutter, good location
o Total impressions = base impressions x clutter/location multiplier
o Value (potential return on investment) = (price/ft²/K impressions) x (ft²) x (base
impressions/1000)

Business Research Division │ Leeds School of Business │University of Colorado at Boulder
7
o Estimated price per thousand impressions: based
on aggregate graph of square footage vs. $/ft²/K
impressions
In our initial research, our assumptions led us to believe
that every sign had a value greater than its price, yet this is not
the case. Some values, as indicated in Table 8, are actually less
than the price that is charged. This could be attributed to the
value placed on a sponsor‟s relationship with the team, the
quality of the advertisement, or exclusivity rights we have not
accounted for. The fact remains, however, that sponsors must
see a return on investment in order to advertise with these teams,
so the value of a given sign must be greater than the price being
charged.
Possibilities as to why signs are overpriced:
Competitive sponsorship market
Exclusivity
Perks
Lack of sponsor‟s knowledge
As indicated by the team sign valuations in Tables 3-6, some teams that have overpriced
their signs did not account for the size of their sign at such a considerable distance. A sign at a
distance of at least 400ft (since spectators at a minor league baseball game are concentrated
around the infield) must be an adequate size for the majority of people to read it. Therefore, a
smaller sign (i.e.: 50ft²) as opposed to a 250ft² sign in the outfield isn‟t going to draw enough
impressions to make up for its price, if priced too high.
How we derived a formula for
determining value:
Discover a base value for
price/K impressions
dependant on ft² (based on
graphs).
Multiply this value by the
square footage of the given
sign.
Then multiply by estimated
impressions of that sign and
divide by 1,000 (need to keep
units straight, we’re working
in thousands of impressions).
Units are key:
o $/ft²/K imp * ft² =
$/K imp
o $/K imp * imp/1000
= $ (value)

Business Research Division │ Leeds School of Business │University of Colorado at Boulder
8
Comparative Analysis
With a population of over 300,000, Colorado Springs offers a medium-sized market.
Sport and entertainment events at the Air Force Academy, Cheyenne Mountain Zoo, and the
Colorado Springs Sky Sox offer several forms of entertainment for people to enjoy. In order to
better understand how the Sky Sox could value advertisements, comparative analysis of the Sky
Sox‟s major competitors is believed to be beneficial to our research. Also, an international
comparison to the South Australian National Football League, which plays its matches at AAMI
Stadium in Adelaide, Australia, was taken into account to demonstrate the difficulty almost
every sporting venue faces when valuing signage.
Air Force Academy
CBS Collegiate Sports Properties in partnership with Falcon Sports Marketing holds
exclusive marketing and multimedia rights to Air Force Athletics, most notably Air Force’s
Division I football program. Falcon Stadium, the home of Air Force football, boasts a capacity of
roughly 52,000 and draws an average of 37,000 fans per game. On a yearly basis, Falcon
Stadium hosts approximately 275,000 people. With similar annual average attendance as the
Sky Sox, the Air Force Academy serves as a suitable comparison when analyzing the value of
stadium signage and event nights.
Falcon Sports Marketing uses a rate card as a reference when valuing stadium signage,
but typically the size of the sign, location, and the relationship with the sponsor will cause rate
card prices to fluctuate. Therefore, Falcon Sports Marketing does not use a standardized price for
any of its inventory; rather prices fluctuate according to the characteristics described above.

Business Research Division │ Leeds School of Business │University of Colorado at Boulder
9
Garrick Dorn, CBS Collegiate Sports Properties West Region Sales Manager,
approximated that value to be $0.10 per impression. Though this offers insight to the value of an
advertisement, it is merely an estimate. Additionally, the number of impressions per person is
unknown through the duration of an event. Depending on location, the average spectator at a
sporting event such as baseball or football (similar duration) will see the advertisement anywhere
from ten to thirty times during a game, as approximated by Dorn.
Cheyenne Mountain Zoo
One of the main competitors for the Sky Sox organization within Colorado Springs is the
Cheyenne Mountain Zoo. With an average attendance of over 500,000 people annually, the
Cheyenne Mountain Zoo is a lucrative site for sponsors to pursue. That is why it is important for
the Sky Sox to be able to provide competitive sponsorship packages while still being able to
make money. While interviewing Jeanne Gordon from the Press Box of Cheyenne Mountain
Zoo, we were able to retrieve some interesting information. The main obstacle for the zoo to gain
sponsorships is convincing the sponsors to avoid in-house advertising campaigns and gain
competitive advantage by partnering with the zoo. The zoo pushes their sponsorship packages by
explaining that there is a lot of added value for a company to partner with an organization that is
heavily involved with the community. Their community outreach campaigns, although non-
profit, allow the zoo to push their sponsorship packages for a premium and form positive long-
term relationships with their partners. If the Sky Sox became more heavily involved in
community outreach, then the organization would be able to sell their signage for higher prices
as well as form stronger relationships with their partners. This in turn would increase the return
on investment for the investor and increase the retention of sponsorship partners.

Business Research Division │ Leeds School of Business │University of Colorado at Boulder
10
South Australian National Football League (SANFL): AAMI Stadium
AAMI Stadium is the home to the South Australian National Football League. Its
capacity reaches just over 51,000 and hosts nearly 1 million guests annually through sporting
events as well as other entertainment such as concerts.
According to Mark Lukowicz, Corporate Partnerships Manager of South Australian
National Football League Inc., there is no set in stone equation used to measure the value of a
sign. The reality is that prices are adjusted to allow for several factors with the biggest emphasis
being on exposure or positioning, followed by the size of the sign, length of supplier relations
and demographics. When asked about the quality of the advertisement, he perceived it as a non-
issue stating that a poorly designed sign reflects negatively on the organization as well as the
sponsor.
Theories and Variables Used In Valuing Non-traditional Media
The basic idea of valuing signage is simple as you take the size, location, and comparison
of signs relative to similar clubs in the industry. This can only provide organizations with a
minor justification for their pricing and it is easier for the advertiser to lower its payment.
According to Jon Carlson, Manager of Business Development for the Denver Broncos, the
bottom line is that the value of a sign is only what people are willing to spend on it. If you can
provide more facts to further justify that the value of your sign is greater than what the sponsor is
offering they will be willing to pay more.
Valuing Signage
o Size of sign
o Isolated vs. clutter
o Monetization of signage on TV
= Duration x spot rate x quality impact score

Business Research Division │ Leeds School of Business │University of Colorado at Boulder
11
Other methods attempting to measure the value of signage more precisely include
determining the number of detections certain signs receive. This is done by monitoring the
audience with manpower or, taking a more radical approach, utilizing recent technological
advances. Various companies now track audience detections through RFID (radio-frequency
identification) tags on tickets, video monitoring and laser monitoring systems. These systems
claim to track where people are directing their attention, how long they are looking there, and
whether or not the person is fully engaged with the sign. Although the effectiveness of these
technologies is not completely proven, some stadiums within the sporting industry are beginning
to implement them as they could provide more concrete support when justifying signage value.
Determining Number of Detections
o Proprietary audience measurement
Video audience measurement
Size of walk-by/opportunity for audience to see sign
Number of impressions generated by display
% of walk-by traffic that engaged with sign
Quality of engagement
o Time (lingering, glance)
o Demographic make-up of audience
Age markers
Gender markers
Ethnicity markers
Content reaction
Valuing Detections
o Duration of detection
o Number of detections
o Quality of detection
Duration of detection
Type of detection
Full-attention
Glance
Engagements within an event night
o Tracking members of audience
How do they interact with the display during event
RFID tags in tickets
Concession sales
Laser impression tracking

Business Research Division │ Leeds School of Business │University of Colorado at Boulder
12
Through our research we have found that when pricing a sponsor‟s sign there is an
abundance of ways to sell signage for a higher value. Jon Carlson of the Broncos expressed the
importance of supply and demand. As the number of signs increases, sponsors have more
leverage in lowering the price below the club‟s desired price, potentially claiming clutter and the
lack of exclusivity deteriorate their return on investment. So increasing the size of the signs
overall decreases the overall amount of signs, it then becomes easier to justify a higher price.
However, there is a break-even point. Sponsors of minor league baseball teams are only willing
to pay so much for signage. Therefore, as the number of signs decreases, a price ceiling will be
created, stunting the profitability of increasing the size of signs. Additionally, if the sponsor has
a similar target market as the organization they will be more willing to pay an increased price for
certain signage.
Pricing Signage
o The price of signage is very subjective
o It involves comparative analysis with other industry organizations
o It involves measuring impressions and also the increase in sales by the sponsor
itself
o Monitoring ROI is crucial
o In the end its about selling the signage to the sponsor
You want to get the sponsor to pay as much as they are willing and think
is fair
Providing explanation for signage pricing is key
The final aspects to take into consideration are increasing attendance and the state of the
economy. The Sky Sox have not re-valued their signage in a relatively long-time while their
attendance has steadily increased throughout the years. Therefore, there is an obvious need to
increase the value of signage. Also, it is important to consider the state of the economy. As Jon
Carlson expressed, “It is important to evaluate what is fair, without bastardizing your product by
„giving it away‟.”

Business Research Division │ Leeds School of Business │University of Colorado at Boulder
13
Clutter Analysis
Advertising clutter poses a major problem for sponsors. As the number of signs increases
in a particular area, so do consumer‟s ad avoiding behaviors. Clutter is defined as “perceived
excess of advertising messages within a medium” (Elliott and Speck 1998). Clutter has been
found to reduce attention, processing and memory of advertisements. The effect can be
explained in terms of information overload; due to limited cognitive resources consumers cannot
attend to all the information exposed to them (Nan and Faber 2004). Even if consumers do
attend to an ad and remember the message, clutter makes it difficult for consumers to associate
the message to the right brand (Pham and Johar 1997; Dahlen and Rosengren 2005). The effects
of clutter are stronger when consumers are not necessarily involved and when the advertised
brand is unfamiliar (Burke and Srull 1988; Kellar 1991; Kent and Allen 1994; Laroche 2006).
On one hand clutter can potentially bring in extra advertising revenue, while on the other hand, it
can reduce the effectiveness of the sign. By reducing clutter and increasing the size of signage at
Security Service Field, return on investment for sponsorship partners will increase by providing
exclusivity, which leads to increased brand awareness and overall advertising effectiveness.
Suggestions
Sky Sox Outfield Sign Adjustment
The overall goal for any business is to increase revenue. If this is so, then the Sky Sox
must look into how they may go forward and possibly change signage size and price based on
our analysis. The Sky Sox may choose to eliminate a number of signs, and replace them with
larger, more clutter free signs; specifically concerning the 128ft² outfield signs. Table 9 shows

Business Research Division │ Leeds School of Business │University of Colorado at Boulder
14
how an increase in the size of the sign will eventually lead to an increase in revenue, assuming
that the team will price the sign at 75% of the sign‟s value.
Table 9: Potential Revenue Adjustment
size (ft²) Base impressionsClutter/Location ratingTotal Imp Price Actual $/ft²/K impressionsInitial $/ft²/K impressionsValue Est. total # Revenue
128 256,000 1 256,000 $5,250 $0.28 $0.16 $9,175 40 $210,000
150 300,000 1 300,000 $4,050 $0.12 $0.09 $5,400 34 $137,700
180 360,000 1.5 540,000 $8,019 $0.11 $0.12 $10,692 28 $224,532
200 400,000 2 800,000 $12,000 $0.10 $0.15 $16,000 25 $300,000
225 450,000 2 900,000 $13,669 $0.09 $0.14 $18,225 21 $287,044
256 512,000 2 1,024,000 $17,695 $0.09 $0.14 $23,593 20 $353,894
Note that revenue initially dips. This is due to the fact that the team is merely removing
signs, and not providing enough benefits in terms of lack of clutter. Another important point is
that at an initial estimation of 40 total signs sized 128ft², the total area is set at 5,120ft². There
are only so many sign combinations that can fit within an outfield wall configuration. Therefore,
it is reasonable to double the initial size of 128ft² to 256ft² in order to ensure that all the signs
will fit within the outfield wall configuration. Reviewing Table 3, one may notice that the price
and values for the 256ft² sign are deflated. With this proposal, the decrease in total signage will
decrease clutter for this size of sign and increase value. The final point in this case indicates a
revenue increase of $143,894.
One flaw in changing the Sky Sox‟s sign structure overnight is alienating previous
sponsors that will no longer be able to fit within the Sky Sox‟s outfield sign inventory. A
solution to this problem would be to only eliminate 50% of the original 128ft² signs, and replace
them with 256ft² signs. While the price charged in this case would be less (due to remaining
clutter), a revenue increase would still occur, as indicated by Table 10. Note that the revenue
and estimated total number of signs are halved due to the assumption that we are working with
50% of the current inventory.

Business Research Division │ Leeds School of Business │University of Colorado at Boulder
15
Table 10: Potential Revenue Adjustment @ 50%
size (ft²) Base impressionsClutter/Location ratingTotal Imp Price Actual $/ft²/K impressionsInitial $/ft²/K impressionsValue Est. total # Revenue
128 256,000 1 256,000 $5,250 $0.28 $0.16 $9,175 20 $105,000
150 300,000 1 300,000 $4,050 $0.12 $0.09 $5,400 17 $68,850
180 360,000 1.5 540,000 $8,019 $0.11 $0.12 $10,692 14 $112,266
200 400,000 1.5 600,000 $9,000 $0.10 $0.11 $12,000 12 $108,000
225 450,000 1.5 675,000 $10,252 $0.09 $0.10 $13,669 11 $112,767
256 512,000 1.5 768,000 $13,271 $0.09 $0.10 $17,695 10 $132,710
Additionally, sponsors that can no longer advertise in the outfield have several other methods of
advertising in Security Service Field such as concourse signs and advertisements located near
concessions.
Concourse Signage
Considering the current configuration of the concourse signs, our team noticed they are
relatively small compared to the amount of space available. Also, there is no obvious reason to
look up at the concourse signs. Therefore we suggest that the size of the concourse signs be
increased, which will allow the Sky Sox to better justify the pricing of their partnership
packages. Next, in order to better draw the eyes of the venue‟s attendees to the concourse signs
we suggest that the concourse section number signs be placed parallel with the concourse
signage. This will not only allow for guests to more easily find their section but will also draw
their eyes to the concourse advertisements. This would allow the Sky Sox to have another
justification for their pricing as well as increase return on investments for their partners. We
believe if the concourse signage is reconfigured it will benefit both the Sky Sox and associated
sponsors.

Business Research Division │ Leeds School of Business │University of Colorado at Boulder
16
Standardization of Signage
While attending a Sky Sox game our team noticed some signs with poorly designed
advertisements. According to Mark Lukowicz of the SANFL, poorly designed signage
deteriorates the return on investment for the sponsor simultaneously reflecting poorly on Security
Service Field and the Sky Sox organization. Our team suggests that the Sky Sox standardize the
criteria for their signage. For example, there could be a limited number of characters allowed on
each sign making the advertisement more readable for the spectators. This will not only increase
the return on investment for sponsorship partners but will enhance the aesthetic viability of
Security Service Field.
Suggestions for the Future
As previously mentioned, the Sky Sox could employ technologies designed by companies
like Micro Target Media to better track impressions within the stadium. Micro Target Media
uses video and laser monitoring to track people‟s eyes, how long they are looking in that
direction, and how focused they are on signage. This allows for the exact measurement of
impressions on certain signage, which provides concrete justification for the pricing of signage.
Conclusion
Ultimately, when considering the value of non-traditional media there are many aspects
that must be taken into account. Clearly, a comparative analysis of other organizations within
the industry is necessary as well as a review of competition within Colorado Springs. After
performing the comparative analysis it is indubitable that the Sky Sox can make changes to their
signage and pricing structure, which will positively influence the bottom line. Additionally,
there are many theories that play into selling signage and sponsorships that all can affect the final

Business Research Division │ Leeds School of Business │University of Colorado at Boulder
17
price and the value of the partnership. Conclusively, valuing non-traditional media is a complex
process that has an imminent affect on an organizations profit margin.
Appendix
Table 1: ft² vs. $/ft²/K impressions
size (ft²) $/ft²/K impressions
50 $1.04
76 $0.26
80 $0.60
120 $0.69
128 $0.16
128 $0.17
130 $0.23
135 $0.09
144 $0.08
160 $0.16
168 $0.11
200 $0.02
210 $0.08
220 $0.06
224 $0.05
256 $0.08
Table 3: Colorado Springs Sky Sox Location size (ft²) Base impressionsClutter/Location ratingTotal Imp Price Actual $/ft²/K impressionsInitial $/ft²/K impressionsValue Difference
Scoreboard 120 240,000 3 720,000 $20,000 $0.32 $0.69 $27,648 $7,648
Outfield wall 128 256,000 1 256,000 $5,250 $0.28 $0.16 $9,175 $3,925
Scoreboard video ribbon220 440,000 1 440,000 $6,000 $0.10 $0.06 $9,680 $3,680
Outfield wall 256 512,000 1.5 768,000 $10,500 $0.09 $0.08 $17,695 $7,195
Table 4: Omaha Royals
Location size (ft²) Base impressionsClutter/Location ratingTotal Imp Price Actual $/ft²/K impressionsInitial $/ft²/K impressionsValue Difference
Outfield fence 128 371,000 1 371,000 $8,200 $0.28 $0.17 $13,297 $5,097
Scoreboard 144 356,160 2 712,320 $8,200 $0.12 $0.08 $12,309 $4,109
Scoreboard 168 415,520 2 831,040 $14,700 $0.12 $0.11 $16,754 $2,054
Outfield fence 224 554,027 2 1,108,053 $13,500 $0.07 $0.05 $17,374 $3,874
Table 2: Total Impressions vs.
Value
Total Imp Value
256,000 $9,175
371,000 $13,297
397,227 $13,585
400,000 $10,600
418,133 $13,380
418,133 $8,028
440,000 $9,680
712,320 $12,309
720,000 $27,648
768,000 $17,695
831,040 $16,754
1,040,000 $28,392
1,108,053 $17,374
1,568,000 $28,224
1,620,000 $39,366
2,520,000 $37,044

Business Research Division │ Leeds School of Business │University of Colorado at Boulder
18
Table 5: Albuquerque Isotopes
Location size (ft²) Base impressionsClutter/Location ratingTotal Imp Price Actual $/ft²/K impressionsInitial $/ft²/K impressionsValue Difference
Scoreboard 50 200,000 2 400,000 $20,800 $0.53 $1.04 $10,600 -$10,200
Scoreboard 130 520,000 2 1,040,000 $30,800 $0.21 $0.23 $28,392 -$2,408
Scoreboard 135 540,000 3 1,620,000 $20,000 $0.18 $0.09 $39,366 $19,366
Scoreboard 210 840,000 3 2,520,000 $40,800 $0.07 $0.08 $37,044 -$3,756
Table 6: Syracuse Chiefs
Location size (ft²) Base impressionsClutter/Location ratingTotal Imp Price Actual $/ft²/K impressionsInitial $/ft²/K impressionsValue Difference
Scoreboard 76 198,613 2 397,227 $8,000 $0.45 $0.26 $13,585 $5,585
Scoreboard 80 209,067 2 418,133 $20,000 $0.40 $0.60 $13,380 -$6,620
8x20 Outfield wall 160 418,133 1 418,133 $11,000 $0.12 $0.16 $8,028 -$2,972
Rotating (3) scoreboard200 522,667 3 1,568,000 $7,000 $0.09 $0.02 $28,224 $21,224
Table 7: Aggregate based on ft²
size (ft²) Base impressionsClutter/Location ratingTotal Imp Price Actual $/ft²/K impressionsInitial $/ft²/K impressionsValue
50 200,000 2 $400,000 $20,800 $0.53 $1.04 $10,600
76 198,613 2 $397,227 $8,000 $0.45 $0.26 $13,585
80 209,067 2 $418,133 $20,000 $0.40 $0.60 $13,380
120 240,000 3 $720,000 $20,000 $0.32 $0.69 $27,648
128 256,000 1 $256,000 $5,250 $0.28 $0.16 $9,175
128 371,000 1 $371,000 $8,200 $0.28 $0.17 $13,297
130 520,000 2 $1,040,000 $30,800 $0.21 $0.23 $28,392
135 540,000 3 $1,620,000 $20,000 $0.18 $0.09 $39,366
144 356,160 2 $712,320 $8,200 $0.12 $0.08 $12,309
160 418,133 1 $418,133 $11,000 $0.12 $0.16 $8,028
168 415,520 2 $831,040 $14,700 $0.12 $0.11 $16,754
200 522,667 3 $1,568,000 $7,000 $0.09 $0.02 $28,224
210 840,000 3 $2,520,000 $40,800 $0.07 $0.08 $37,044
220 440,000 1 $440,000 $6,000 $0.10 $0.06 $9,680
224 554,027 2 $1,108,053 $13,500 $0.07 $0.05 $17,374
256 512,000 1.5 $768,000 $10,500 $0.09 $0.08 $17,695

Business Research Division │ Leeds School of Business │University of Colorado at Boulder
19
Table 8: Aggregate based on total impressions
size (ft²) Base impressionsClutter/Location ratingTotal Imp Price Actual $/ft²/K impressionsInitial $/ft²/K impressionsValue Difference
128 256,000 1 256,000 $5,250 $0.28 $0.16 $9,175 $3,925
128 371,000 1 371,000 $8,200 $0.28 $0.17 $13,297 $5,097
76 198,613 2 397,227 $8,000 $0.45 $0.26 $13,585 $5,585
50 200,000 2 400,000 $20,800 $0.53 $1.04 $10,600 -$10,200
80 209,067 2 418,133 $20,000 $0.40 $0.60 $13,380 -$6,620
160 418,133 1 418,133 $11,000 $0.12 $0.16 $8,028 -$2,972
220 440,000 1 440,000 $6,000 $0.10 $0.06 $9,680 $3,680
144 356,160 2 712,320 $8,200 $0.12 $0.08 $12,309 $4,109
120 240,000 3 720,000 $20,000 $0.32 $0.69 $27,648 $7,648
256 512,000 1.5 768,000 $10,500 $0.09 $0.08 $17,695 $7,195
168 415,520 2 831,040 $14,700 $0.12 $0.11 $16,754 $2,054
130 520,000 2 1,040,000 $30,800 $0.21 $0.23 $28,392 -$2,408
224 554,027 2 1,108,053 $13,500 $0.07 $0.05 $17,374 $3,874
200 522,667 3 1,568,000 $7,000 $0.09 $0.02 $28,224 $21,224
135 540,000 3 1,620,000 $20,000 $0.18 $0.09 $39,366 $19,366
210 840,000 3 2,520,000 $40,800 $0.07 $0.08 $37,044 -$3,756
References
Mike Baron, Vice President of Business Development and Sales for Image Impact
Jon Carlson, Manager of Business Development for the Denver Broncos
Garrick Dorn, CBS Collegiate Sports Properties West Regional Sales Manager
Megan Eisenhard, General Manger Buffalo Sports Properties
Jeanne Gordon, Press Box of Cheyenne Mountain Zoo
Chuck Griswold, Sponsorship Account Executive Altoona Curve
Brian Gurnee, President of California Outdoor Advertising Inc.
Mark Lukowicz, Corporate Partnerships Manager SA National Football League
Dave Madsen, Associate General Manager Buffalo Sports Properties
Roger Payne, Research, Valuation, Sponsorship ROI for Navigate Marketing
Robert Wickstrom, Associate California Outdoor Advertising Inc.
Business Research Division │ Leeds School of Business │University of Colorado at Boulder
20
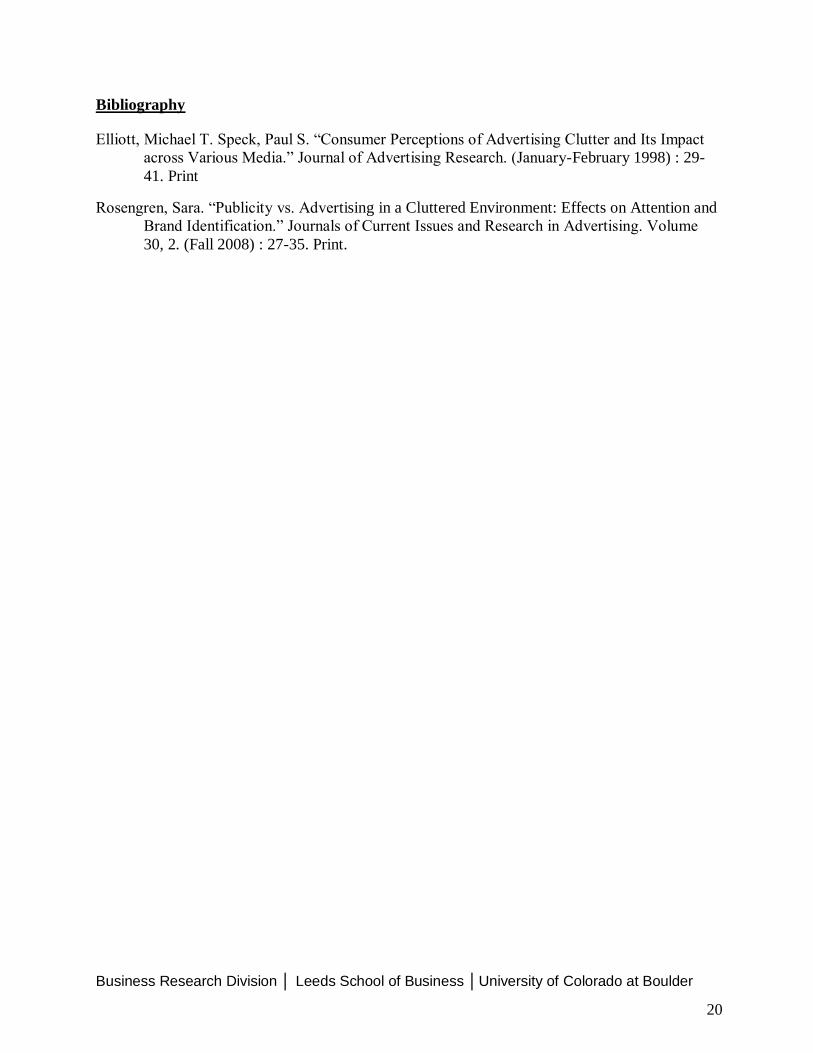
Bibliography
Elliott, Michael T. Speck, Paul S. “Consumer Perceptions of Advertising Clutter and Its Impact
across Various Media.” Journal of Advertising Research. (January-February 1998) : 29-
41. Print
Rosengren, Sara. “Publicity vs. Advertising in a Cluttered Environment: Effects on Attention and
Brand Identification.” Journals of Current Issues and Research in Advertising. Volume
30, 2. (Fall 2008) : 27-35. Print.