skope research paper no. 117 june 2013 hubert ertl, … degrees worth higher fees? perceptions of...
TRANSCRIPT

Are Degrees Worth Higher Fees? Perceptions of the Financial Benefits
of Entering Higher Education
SKOPE Research Paper No. 117 June 2013
Hubert Ertl, Helen Carasso and Craig Holmes
SKOPE, University of Oxford

Editor’s Foreword
SKOPE Publications
This series publishes the work of the members and associates of SKOPE. A formal editorial process ensures that standards of quality and objectivity are maintained.
Orders for publications should be addressed to the SKOPE Secretary, School of Social Sciences, Cardiff University, Glamorgan Building,
King Edward VII Avenue, Cardiff CF10 3WT Research papers can be downloaded from the website:
www.skope.ox.ac.uk
ISSN 1466-1535
© 2013 SKOPE


Abstract
Politicians regularly cite an expected individual economic gain (the ‘graduate premium’) as a justification for greater private contributions to the cost of higher education, most recently as part of the rationale for the increase in England of the cap on Home/EU undergraduate fees to £9000 from 2012 (e.g. Willetts 2011a). However, the choices that potential students make about whether to apply to university, and if so where and what to study, are not influenced directly by the, necessarily impersonal, and highly contested (Thompson 2012), theoretical and often overly generalised estimates of the financial benefits for recent graduates over their careers (e.g. BIS 2011: 111-115). Rather, views that individual applicants hold about outcomes that they envisage personally can be expected to be significant; these are explored in this paper which is based on research conducted in seven secondary schools/colleges among Year 13 pupils taking courses that would make them eligible to apply for higher education. A questionnaire was followed by focus groups with applicants in five of the participating institutions.
The research found that there are high levels of uncertainty amongst potential applicants regarding the costs and possible financial benefits of studying for a degree. However, attitudes towards the concept of a graduate premium have a strong influence on the propensity of applying to higher education. The differences in the expected cost of studying at different institutions was not a predominant factor in participants’ choices about where to apply – this was partly because the difference in costs of studying at different institutions were seen as small and students did not expect to have precise information until they started at university or college.


1
Introduction
As undergraduate fees at English universities have gradually increased since 1998, a
number of studies have considered the extent to which costs, net costs, expected
financial outcomes (such as levels of debt) and perceived benefits (in the form of
higher lifetime earnings) have influenced the higher education choices of potential
undergraduates. They have explored the extent to which the shift in the balance of
‘cost sharing’ (Johnstone 2004), that places greater financial burdens on individual
participants in higher education while reducing those on the state, has affected the
decision-making of groups within society differentially.
The first significant shift in this direction in England came in 1998, when a
£1000 means-tested student contribution to fees was introduced. At the same time, all
grants were abolished, meaning that the only source of support for undergraduates’
living costs was Student Loans. The political controversy that surrounded the
introduction of these changes focused on the ending of ‘free’ degrees, however, it was
soon clear that attitudes to debt played a major role in the choices made by potential
applicants to higher education. A study looking at the 2002 admissions round found:
Debt aversion, and aversion to debt arising from student loans in particular, may not appear to be economically rational, especially given the in-built safeguards on repayments for low earners. However, decisions and choices are not informed purely by economic calculations. Other important factors, such as cultural values, also play a role… However, given the risks of failure, non-completion and financial hardship associated with HE participation, especially for those from low-income families, debt aversion and concerns about debt may be highly rational. Research clearly shows that the costs of participation and debt levels on graduation are inversely related to the risks involved. They are highest for those with the lowest rates of return on HE and who take the greatest risks – low-income students. (Callender 2003: 155)
It also found that a tolerant attitude to debt made an individual 1.25 times as
likely to go to university than someone who was debt-averse. Groups identified as
being particularly debt-averse were: those from the lowest social classes; lone parents;
Muslims (especially Pakistanis); and members of black and ethnic minority groups
(Callender 2003: 10). Although the concept of ‘graduate premium’ was not one that
was promoted strongly by politicians or institutions in the early 2000s, ‘a desire to
improve labour market prospects’ played a strong part in the decision-making of
university applicants (Callender 2003: 114).
2
The next major shift in undergraduate fees and funding took effect in 2006;
looking at applicants entering university with a maximum fee of £3000, members of
this group were found to remain highly positive about both the social and the
economic value of higher education (Purcell et al 2008). Although perceptions of the
return on investment in higher education varied by course as well as by institution,
there was a view that more expensive courses may be a better investment because of
the careers and earning potential they open up (UUK/HEFCE 2010: 41). While cost
and possible returns played a role in decision-making relating to higher education,
younger applicants and those from higher socio-economic groups were more likely to
select a course out of interest or because they thought they were best at this subject,
rather than due to career or salary expectations (Purcell et al 2008).
Nevertheless, financial considerations were found to have an impact on degree
choices, with some groups more concerned about debt than others. Specifically, those
from lower socio-economic groups were slightly more likely to be concerned about
financial outcomes after graduation than others (CHERI/LSBU 2005, UUK/HEFCE
2010) and financial concerns were significantly more likely to constrain their higher
education choices (Callender and Jackson 2008). However, many young people from
across the social spectrum made their decisions about whether or not to apply for
higher education with limited awareness of the financial support for which they might
be eligible (Davies et al 2008: 34-35).
Although some concern about student debt is more or less universal, different
attitudes to this, and to returns on a degree, were found among young people from
different ethnic backgrounds: Asian Bangladeshi were most likely, and Asian Chinese
least likely, to be concerned about the levels of debt they would have to repay on
graduation (a consideration that is in part related to perceptions of expected graduate
premium) (UUK/HEFCE 2010). Similarly, identifying ‘the salary I could earn on
graduation’ as ‘very important’ in choice of course was only significant for some
groups of applicants: males; Chinese; those from low income families; and mature
students (Davies et al 2010: 8).
The overall upward trend in UCAS applications (shown in Figure 1)
nevertheless suggests that, with fees capped at an (index-linked) £3000, the price-
sensitivity point was not reached, at least as far as participation in higher education as
a whole – rather than at specific universities or for particular subjects – is concerned.

3
Figure 1: UG applicants and acceptances (000s) 1994-2011 Source: UCAS
However, the 2012 iteration of an annual panel survey (OpinonPanel 2012)
found the prospect of significantly increased tuition fees from that autumn had
changed the behaviour of almost a quarter (23%) of applicants; a number of changes
were identified, but the most common trend was not to look for a cheaper place to
study, but to seek a greater return on investment, by aiming for institutions with
higher reputations or courses with higher earnings potential. These effects are not
evenly distributed, with an effect size of 0.38 for those from lower socio-economic
groups with lower predicted grades, as compared to 0.18 for those from higher socio-
economic groups with higher predicted grades.
A separate study conducted among Year 12 students (Wilkins et al 2012), also
found that financial issues played a key role in intentions about whether to apply to
higher education and if so where; however, it found that the effect was most
pronounced in the two highest socio-economic groups, where applicants were more
likely to be considering alternative options for further study due to their lower cost1.
Across the sample as a whole, options cited most frequently were: study at a
university outside the UK (36.0% of respondents); taking time out to work before
1 This may be entirely rational as these students can expect to receive little or no non-repayable support from schemes such as institutional bursaries and the National Scholarship Programme.
Applicants
Acceptances
0
100
200
300
400
500
600
700
0
100
200
300
400
500
600
700
1994 1995 1996 1997 1998 1999 2000 2001 2002 2003 2004 2005 2006 2007 2008 2009 2010 2011
Applicants and acceptances via UCASThousands
4
entering higher education (25.2%); and study at non-university providers (either
private, or FE for HND, followed by a year at university for a bachelor’s degree –
18.6%).
However, UCAS data (looking at applications from 2004 to 2012) shows a
decline in the application rate of 18 year olds to higher education in 2012 of 1%
(when adjusted for demographic changes in the population as a whole). This
translates into a number of about 15,000 young people (UCAS 2012a: 4) and may be
a similar one-year drop to those seen with increases in fees in 1998 and 2006 (as
shown in Figure 1). A more detailed analysis of the 2012 admissions cycle (UCAS
2012b: 30) notes though that there was no ‘above-trend’ increase in applications from
18 year olds in 2011, as would be expected if a larger proportion of potential entrants
had decided to progress to university immediately after leaving school or college,
without taking a gap year.
Another study, which compared the profile of admissions in 2012 to that in
2006 (when maximum fees increased to £3000) found that there was no conclusive
evidence that the most recent changes in undergraduate fees and funding had
discouraged enrolments (Thompson and Bekhradnia 2012); however it suggested that
the picture after one year of the new system was not definitive and evidence from
further admissions cycles would be needed to establish whether there had been any
deterrent effect for all, or some groups of, potential applicants.
Differences are though more marked when considering other groups of the
population. The decline in applications from backgrounds with higher participation in
higher education (POLAR quintile 52) is 2-3%, compared to 0.1-0.2% for lower
participation backgrounds (POLAR quintile 1) (UCAS 2012a: 6) and the trend is
significantly more pronounced for mature students. Applicants from England aged
over 18 are 15-20% less likely to apply in 2012 than in 2011; this equates to around
30,000 individuals who could have been expected to apply for higher education if
rates had remained as in 2011 (UCAS 2012a: 8, para13).
In this context, the current research is designed to explore the reasoning of
university applicants which has resulted in differential effects of financial factors on
higher education application decisions in different parts of the population, while
2 POLAR categorises postcode areas into five quintiles, with quintile 1 comprising the 20% of postcode areas with the lowest higher education progression rates amongst young people and quintile 5 the highest.
5
recognising that – at present – there is no clear pattern to be found across individual
studies. It is relevant to note that, for young applicants from England, there is no
significant shift in choice of course or institution either to, or away from, those
charging the maximum £9000 from 2012 (UCAS 2012a: 10).
It is important to be aware though that those starting their degrees in 2012 – the
group which forms the subject of this study – were making decisions about complex
educational and financial matters in a quasi-market that was evolving around them.
The Parliamentary vote to increase the cap on Home/EU undergraduate fees at
English universities to £9000 was held on 9 December 2010, by when they were
already in Year 12 studying for qualifications which (it is to be hoped) they selected at
least partly with options and plans for subsequent study or employment in mind. They
have been facing an information deficit similar to that identified within the US higher
education system by the Spellings Commission, which found:
...a lack of clear, reliable information about the cost and quality of postsecondary institutions, along with a remarkable absence of accountability mechanisms to ensure that colleges succeed in educating students. The result is that students, parents, and policymakers are often left scratching their heads over the answers to basic questions, from the true cost of private colleges (where most students don’t pay the official sticker price) to which institutions do a better job than others not only of graduating students but of teaching them what they need to learn. (Spellings 2006: x)
Furthermore, students applying for university in 2012 had no comparable experience
of earlier cohorts on which to draw. In an attempt to address this information deficit,
institutions are being required to produce data about their courses in a standardised
format as Key Information Sets (KIS). These have been strongly endorsed by the
Minister for Universities and Science, David Willetts:
One prerequisite for putting students at the heart of the system is to improve radically the information on offer to prospective students. The new Key Information Set and existing initiatives like Unistats and the National Student Survey are important here. Student Charters will be a step forward. But we need to go much further. Our goal should be to make as much information available as we can about different courses, different institutions and different outcomes and to let whoever wants to use this data do so in innovative ways. The best way to encourage improvements in the quality of information is to start using it in more transparent ways.
There are few things that cost as much as higher education where the costs are so murky. When you receive your Council Tax bill, you often get a pie chart showing what you are getting for your money. Why
6
shouldn’t prospective students be able to see similarly useful information about where their money is being spent? (Willetts 2011b)
The data contained in the KIS is described by HEFCE, which is responsible for its
collection and collation, as:
It gives prospective students access to robust, reliable and comparable information in order to help them make informed decisions about what and where to study…
It contains information which prospective students have identified as useful, such as student satisfaction, graduate outcomes, learning and teaching activities, assessment methods, tuition fees and student finance, accommodation and professional accreditation. (HEFCE 2012)
However, due to the time taken to develop and test the data collection system and then
populate it with accurate information, KIS were launched in September 2012, with
information for those applying to higher education in 2013; thus they were not
available to the potential applicants studied here. It remains to be seen whether the
provision of improved information will offset the conclusion of a recent study of
secondary school pupils’ views of their need for a higher education qualification, that:
Our data shows a striking increase in the percentage of young people who believe they can be successful without qualifications since the announcement of the increase in tuition fees. This implies that many young people are now considering whether there are alternative means by which they can pursue their goals; without the need for the expense of a university degree. (Benton 2012: 9)
The Study
Against the background of higher fees for undergraduate study and the provision of
new bursaries and scholarships offered by higher education institutions, this study
examines the decision-making rationales of students in year 13 in schools and
colleges shortly after the UCAS application deadline in January 2012. This target
group was chosen because the study was interested in gaining insights into the
considerations of the people who were most immediately affected by the new higher
education funding regime that came into force with the beginning of the 2012/13
academic year. While engaging with this target group just after the UCAS application
deadline ensured that their decisions were still very much at the forefront of their
minds, the timing of the investigation also prevented the study from influencing
decision-making processes.

7
One particular focus of the study is the notion of private economic gain of
individuals, as this is frequently cited by politicians as a justification of higher private
contributions to the cost of higher education. Linked to this is the study’s exploration
of participants’ expectations of debt and future financial benefits of studying. A
second focus is on the factors that influence the choice of particular institutions and
subjects. Sources of information and guidance are a third area of interest.
Due to the exploratory character of the study, seven different types of schools
and colleges in one geographic area (six institutions in Oxfordshire, one in
Buckinghamshire) were selected, utilising to some extent the connections the Oxford
University Department of Education has with local schools through its PGCE
partnership programme. The participating institutions included state comprehensive
schools, sixth form colleges and an independent school. Thus, the sample includes
individuals from a broad range of year 13 students, however, no attempt was made to
structure it to be nationally statistically representative.
In part one of the study, questionnaires were administered to the year 13
cohorts of all participating institutions, either in electronic or paper format. The
questionnaire included questions on the following areas:
• background of participants (gender, age, ethnicity, postcode, higher education participation of parents/carers and siblings, etc.),
• their current studies (school, subjects, qualifications),
• their decisions regarding higher education (whether or not to apply to higher education, if yes, where and for what subject),
• their rationales for making these decisions (in particular focussing on financial issues such as expectations of benefits and costs), and
• the main sources of information and guidance used for making their decisions.
The questionnaire mainly consisted of a combination of closed and Likert-scale items.
Over 700 questionnaires were returned and analysed using descriptive techniques and
factor analysis.
In part two, in order to gain a deeper understanding of the decision making
processes and rationales suggested by the questionnaires, five focus group interviews
were conducted, each at a different participating institution. With the support of sixth
form coordinators at the institutions, groups of five to 12 interviewees were selected
for 45 to 60 minute interviews. The 43 focus group participants represented a broad
8
range of characteristics and backgrounds in terms of their current and anticipated
studies, but all were applying to higher education at the time they were recruited3.
These interviews generated additional data on the plans and expectations of
students beyond their anticipated studies in higher education and deeper insights into
the connection between perceived financial burdens and benefits of studying and
institutional and subject choices. The focus groups were also used to present the
participants with some of the findings from the questionnaire. For instance,
participants were asked to comment on the quarter of questionnaire respondents who
indicated that they had not thought about the financial implications of entering higher
education. Focus group data was analysed by developing and refining themes
identified in the literature and the questionnaire data.
In the next sections, results and findings drawn from the questionnaire data are
presented. These findings resulted from descriptive analysis of the data as well as
common exploratory factor analysis of the questions that elicited Likert scale
responses.
Results and Findings
The decision to apply to higher education
The survey collected data on the following characteristics and background
variables of respondents: gender, age, ethnicity, school attended, home postcode,
higher education participation of parents and siblings, and qualifications and subjects
currently studied.4 The questionnaire then asked whether respondents have applied to
higher education or not. Table 1 provides an overview of the likelihood of applying
for different groups of respondents in our sample.
This overview shows that just under three-quarters of respondents applied to
higher education, with female respondents significantly more likely to apply than
male respondents, in line with higher application rates of female students nationally
(UCAS 2012b: 7). Asian respondents were the most likely to apply, whereas
respondents of mixed ethnicity were the least likely to apply. Respondents who were
studying for A-levels were significantly more likely to apply to higher education than
3 One participant had withdrawn her application by the time the focus group took place and another (in a different group) it transpired in discussion, had decided not to apply to higher education. 4 For a breakdown of the main background variables of the participants in the sample see Appendix 1, Section 1.
9
students who were working towards other types of qualifications. The likelihood of
applying for respondents who would be the first in their immediate family to
participate in higher education is lower (70.5%) than for respondents who have
parents and/or siblings in higher education (75.3%), but this difference is not
statistically significant.
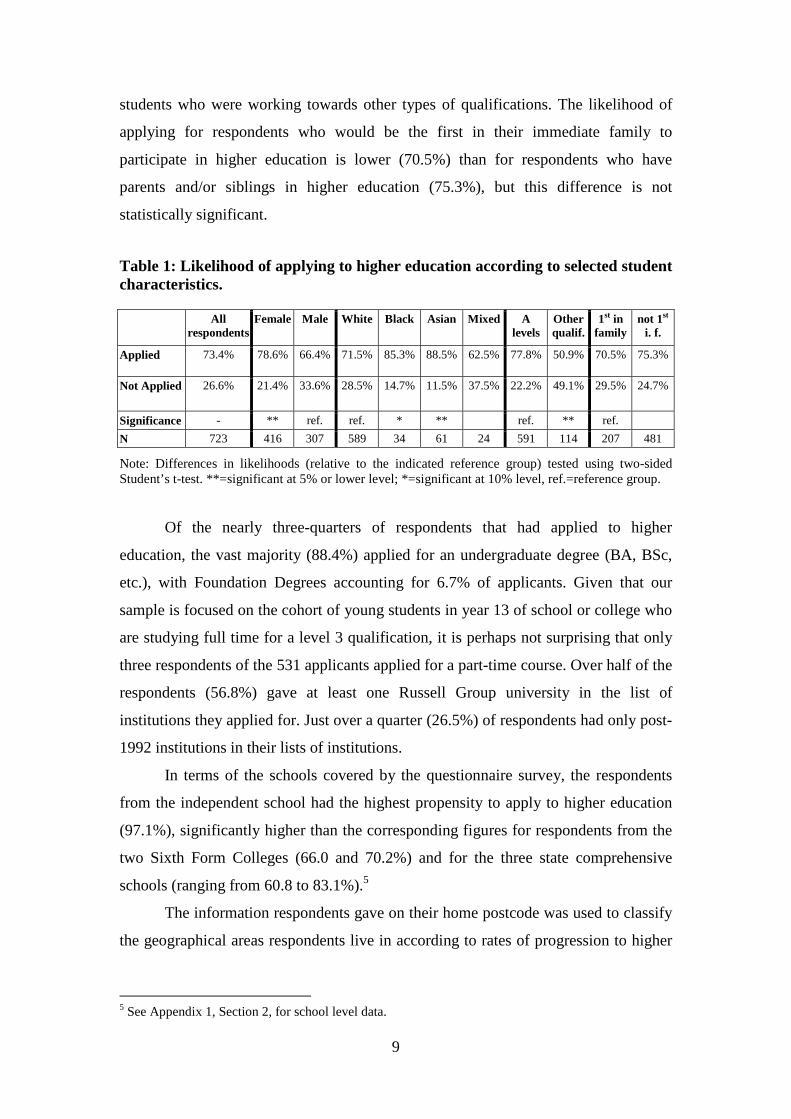
Table 1: Likelihood of applying to higher education according to selected student characteristics.
All respondents
Female Male White Black Asian Mixed A levels
Other qualif.
1st in family
not 1st i. f.
Applied 73.4% 78.6% 66.4% 71.5% 85.3% 88.5% 62.5% 77.8% 50.9% 70.5% 75.3%
Not Applied 26.6% 21.4% 33.6% 28.5% 14.7% 11.5% 37.5% 22.2% 49.1% 29.5% 24.7%
Significance - ** ref. ref. * ** ref. ** ref.
N 723 416 307 589 34 61 24 591 114 207 481
Note: Differences in likelihoods (relative to the indicated reference group) tested using two-sided Student’s t-test. **=significant at 5% or lower level; *=significant at 10% level, ref.=reference group.
Of the nearly three-quarters of respondents that had applied to higher
education, the vast majority (88.4%) applied for an undergraduate degree (BA, BSc,
etc.), with Foundation Degrees accounting for 6.7% of applicants. Given that our
sample is focused on the cohort of young students in year 13 of school or college who
are studying full time for a level 3 qualification, it is perhaps not surprising that only
three respondents of the 531 applicants applied for a part-time course. Over half of the
respondents (56.8%) gave at least one Russell Group university in the list of
institutions they applied for. Just over a quarter (26.5%) of respondents had only post-
1992 institutions in their lists of institutions.
In terms of the schools covered by the questionnaire survey, the respondents
from the independent school had the highest propensity to apply to higher education
(97.1%), significantly higher than the corresponding figures for respondents from the
two Sixth Form Colleges (66.0 and 70.2%) and for the three state comprehensive
schools (ranging from 60.8 to 83.1%).5
The information respondents gave on their home postcode was used to classify
the geographical areas respondents live in according to rates of progression to higher
5 See Appendix 1, Section 2, for school level data.

10
education (using POLAR 2).6 The respondents from the various schools and colleges
differed markedly in terms of coming from higher or lower participating areas. Figure
2 illustrates the mean POLAR values of respondents from the six institutions.
Figure 2: Mean POLAR 2 values for participating schools/colleges
Key:
Institutions 1, 2, 4: state comprehensive schools
Institutions 3, 5: Sixth form colleges
Institution 6: Independent school
POLAR (participation of local areas) values: the higher the value, the higher higher education participation in a postcode area
Despite the differences in the background of respondents from different
institutions, using the POLAR 2 classifications did not produce a clear picture in
terms of propensity for applying to higher education amongst respondents to the
questionnaire, with differences in mean POLAR scores between respondents who
applied and who did not apply to higher education being small (see Table 2).
Respondents from the lowest higher education participation quintile had the highest
application rate, which seems counter-intuitive. However, the small number of
respondents who fell into POLAR quintile 1 might distort the picture to some extent.
6 See http://www.hefce.ac.uk/whatwedo/wp/ourresearch/polar/
Note that this analysis was conducted before the new POLAR data (POLAR 3) became available and is based on data on higher education participation of 2007.
2.91
4.48
3.93
4.17
4.48
4.63
0.00 0.50 1.00 1.50 2.00 2.50 3.00 3.50 4.00 4.50 5.00
1
2
3
4
5
6

11
For quintiles 2 to 5 the expected positive correlation between background and
application rate was found: respondents with postcodes in the higher quintiles (i.e.
areas with higher participation in higher education) are more likely to apply to higher
education.
Table 2: Propensity of applying to higher education according to POLAR 2 classification of postcodes
POLAR 2 quintile
applied not applied
application rate
overall N in sample
share
1 14 2 87.5% 16 2.6% 2 26 12 68.4% 38 6.1% 3 51 23 68.9% 74 11.8% 4 162 57 74.0% 219 35% 5 212 66 76.3% 278 44.5% Mean POLAR 2 4.14 4.08 Key:
POLAR (participation of local areas) quintile 1: 20% of postcode areas with lowest higher education participation, quintile 5: 20% of postcode areas with highest higher education participation.
However, there also seems to be a ‘school effect’ that has an impact on
students’ likelihood to apply to higher education that is not directly linked with the
geographic background of students (in terms of the participation of their local
community in higher education). This can be illustrated by comparing the mean
POLAR value and the higher education application rate of institutions (see Appendix
1, Section 2). Somewhat predictably, the independent school (school 6) in the sample
has the highest mean POLAR value and also the highest application rate (97.1%).
However, the participants at school 1, a state comprehensive school, had the lowest
mean POLAR value by some margin but also had the second highest higher education
application rate (83.1%).
Financial considerations regarding higher education
Expected earnings
Participants who applied to higher education were asked about their expectations
regarding their earnings in their first job after graduation. This was done using a series
of income brackets (0-£15,000, £15-21,000, etc.) and an option ‘don’t know / have
not thought about this’. This latter option was selected by 28.6% of respondents,
indicating a high degree of uncertainty about, or little engagement with, questions of
future earnings. This figure was particularly high for respondents who only applied to
12
post-1992 universities (31.5%). A further 28.4% of respondents indicated that they
expect annual earnings below the loan repayment threshold of £21,000. The share of
respondents who expect their earnings after graduation to be below the repayment
threshold varies with gender (female: 32.6%, male: 21.2%) and first in family in
higher education (37.2%) or not (24.9%). Of those who expected the earnings in their
first job to be below the repayment threshold, 24.7% did not expect to repay their loan
in full. For those who expected to earn above the threshold in their first job, this figure
was lower (13.8% for those expecting earnings between £21,000 and £30,000, and
13.4% for those anticipating a first job salary in excess of £30,000).
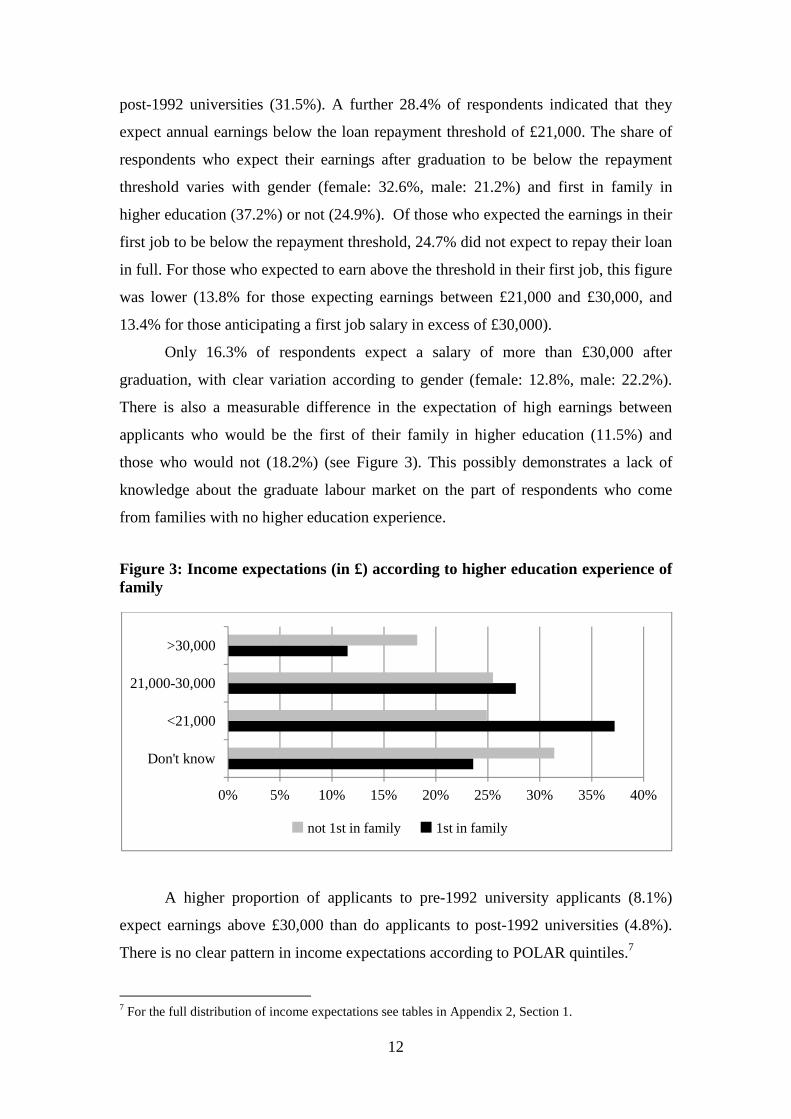
Only 16.3% of respondents expect a salary of more than £30,000 after
graduation, with clear variation according to gender (female: 12.8%, male: 22.2%).
There is also a measurable difference in the expectation of high earnings between
applicants who would be the first of their family in higher education (11.5%) and
those who would not (18.2%) (see Figure 3). This possibly demonstrates a lack of
knowledge about the graduate labour market on the part of respondents who come
from families with no higher education experience.
Figure 3: Income expectations (in £) according to higher education experience of family
A higher proportion of applicants to pre-1992 university applicants (8.1%)
expect earnings above £30,000 than do applicants to post-1992 universities (4.8%).
There is no clear pattern in income expectations according to POLAR quintiles.7
7 For the full distribution of income expectations see tables in Appendix 2, Section 1.
0% 5% 10% 15% 20% 25% 30% 35% 40%
Don't know
<21,000
21,000-30,000
>30,000
not 1st in family 1st in family

13
Expected debts
Participants who applied to higher education were also asked about the level of debt
they expected to accumulate during their studies. Again, the questionnaire used
clustered answer ranges to generate this data, including the option of ‘don’t know /
have not thought about this’, which was selected by 20.7% of respondents. This
option was chosen by fewer respondents who would be the first in their family to
enter higher education (16.2%) than respondents who would follow members of their
immediate family (23%). Thus respondents who cannot draw on family experience of
higher education are more likely to look into the issue of debt. Possibly as a result of
this, first in family respondents are more likely (27.7%) to expect high levels of debt
(over £40,000) than their counterparts (21.3%).
Again, there are significant gender differences in the expectations of the
financial aspects of studying, with male respondents expecting higher debts overall
(see Figure 4). 8 The expectation of accumulating debt is linked to levels of concern
about debt. Overall, just over 40% of respondents indicated that they were
‘concerned’ or ‘very concerned’ about this debt. Unsurprisingly, students who
expected higher levels of debt were more concerned about debt (see Table A2.9). The
results also show a clear gender difference: while 48.6% of female respondents
indicated concern about debt, the corresponding figure for male respondents is
27.5%.9
Figure 4: Debt expectations (in £) according to gender
8 For the full distribution of debt expectations see tables in Appendix 2, Section 2. 9 For the full information on debt concern see tables in Appendix 2, Section 3.
23.1%
21.5%
32.4%
23.1%
17.6%
17.6%
40.7%
24.0%
0% 10% 20% 30% 40% 50%
Don't know/haven't thought about this
<25,000
25-40,000
>40,000
Male Female
14
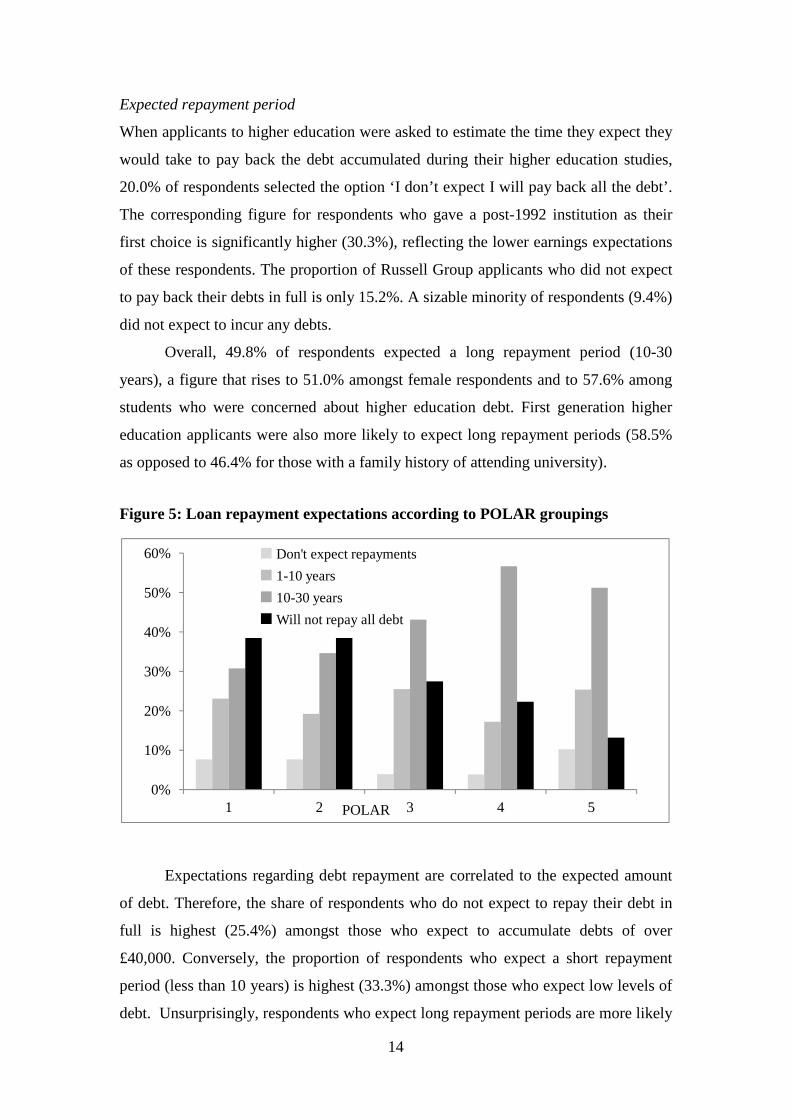
Expected repayment period
When applicants to higher education were asked to estimate the time they expect they
would take to pay back the debt accumulated during their higher education studies,
20.0% of respondents selected the option ‘I don’t expect I will pay back all the debt’.
The corresponding figure for respondents who gave a post-1992 institution as their
first choice is significantly higher (30.3%), reflecting the lower earnings expectations
of these respondents. The proportion of Russell Group applicants who did not expect
to pay back their debts in full is only 15.2%. A sizable minority of respondents (9.4%)
did not expect to incur any debts.
Overall, 49.8% of respondents expected a long repayment period (10-30
years), a figure that rises to 51.0% amongst female respondents and to 57.6% among
students who were concerned about higher education debt. First generation higher
education applicants were also more likely to expect long repayment periods (58.5%
as opposed to 46.4% for those with a family history of attending university).
Figure 5: Loan repayment expectations according to POLAR groupings
Expectations regarding debt repayment are correlated to the expected amount
of debt. Therefore, the share of respondents who do not expect to repay their debt in
full is highest (25.4%) amongst those who expect to accumulate debts of over
£40,000. Conversely, the proportion of respondents who expect a short repayment
period (less than 10 years) is highest (33.3%) amongst those who expect low levels of
debt. Unsurprisingly, respondents who expect long repayment periods are more likely
0%
10%
20%
30%
40%
50%
60%
1 2 3 4 5POLAR
Don't expect repayments
1-10 years
10-30 years
Will not repay all debt
to be concerned about debt (see Table A2.13). There are some variations by POLAR
group – those from higher groups are less
debt and (consequently) more likely to expect to repay in full between 10 and 30
years, as seen in Figure 5.10
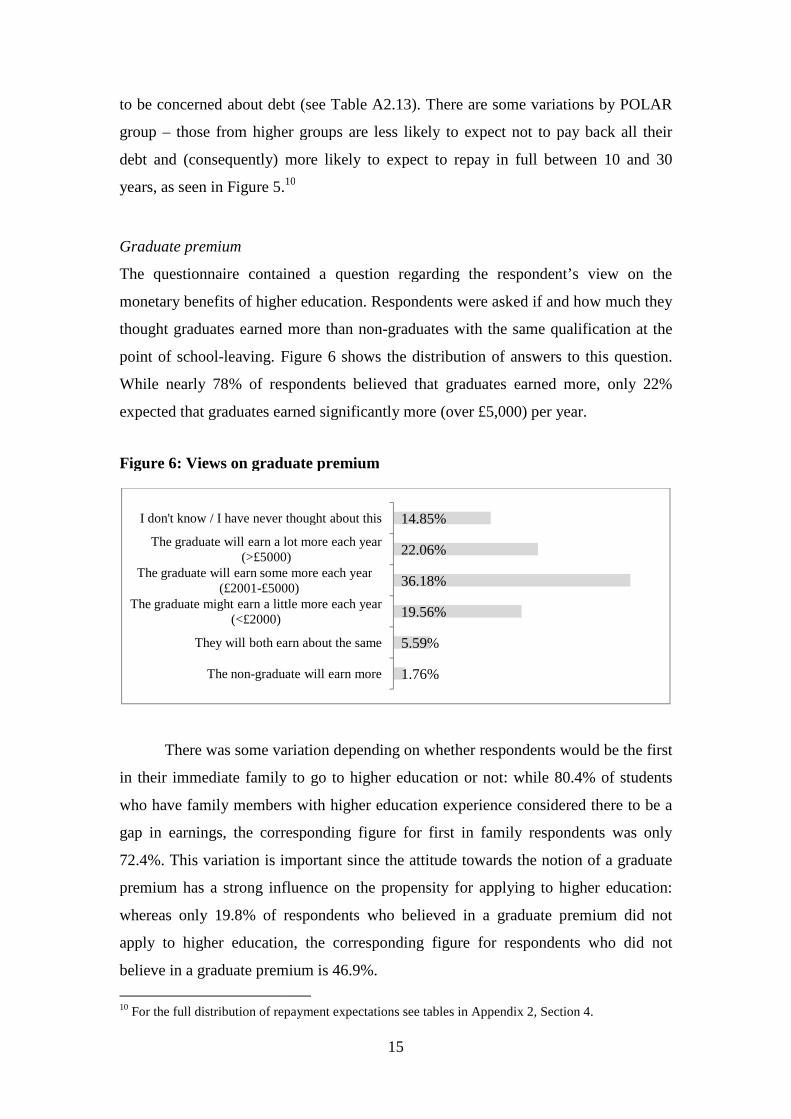
Graduate premium
The questionnaire contained a question regarding
monetary benefits of higher education. Respondents were asked if and how much they
thought graduates earned more than non
point of school-leaving. Figure 6 shows the distribution of answers to this question.
While nearly 78% of respondents believed that graduates earned more, only 22%
expected that graduates earned significant
Figure 6: Views on graduate premium
There was some variation depending on whethe
in their immediate family to go to higher education or not: while 80.4% of students
who have family members with higher education experience considered there to be a
gap in earnings, the corresponding figure for first in fa
72.4%. This variation is important since the attitude towards the notion of a graduate
premium has a strong influence on the propensity for applying to higher education:
whereas only 19.8% of respondents who believed in a graduate
apply to higher education, the corresponding figure for respondents who did not
believe in a graduate premium is 46.9%.
10 For the full distribution of repayment expectations see tables in Appendix 2, Section 4.
The non-graduate will earn more
They will both earn about the same
The graduate might earn a little more each year (<£2000)
The graduate will earn a some more each year (£2001-£5000)
The graduate will earn a lot more each year (>£5000)
I don't know / I have never thought about this
some more each year
15
to be concerned about debt (see Table A2.13). There are some variations by POLAR
those from higher groups are less likely to expect not to pay back all their
debt and (consequently) more likely to expect to repay in full between 10 and 30 10
The questionnaire contained a question regarding the respondent’
monetary benefits of higher education. Respondents were asked if and how much they
thought graduates earned more than non-graduates with the same qualification at the
leaving. Figure 6 shows the distribution of answers to this question.
le nearly 78% of respondents believed that graduates earned more, only 22%
expected that graduates earned significantly more (over £5,000) per year.
Figure 6: Views on graduate premium
There was some variation depending on whether respondents would be the first
in their immediate family to go to higher education or not: while 80.4% of students
who have family members with higher education experience considered there to be a
gap in earnings, the corresponding figure for first in family respondents was only
72.4%. This variation is important since the attitude towards the notion of a graduate
premium has a strong influence on the propensity for applying to higher education:
whereas only 19.8% of respondents who believed in a graduate premium did not
apply to higher education, the corresponding figure for respondents who did not
believe in a graduate premium is 46.9%.
For the full distribution of repayment expectations see tables in Appendix 2, Section 4.
1.76%
5.59%
19.56%
36.18%
22.06%
14.85%
graduate will earn more
They will both earn about the same
The graduate might earn a little more each year
The graduate will earn a some more each year £5000)
The graduate will earn a lot more each year (>£5000)
I don't know / I have never thought about this
some more each year
to be concerned about debt (see Table A2.13). There are some variations by POLAR
likely to expect not to pay back all their
debt and (consequently) more likely to expect to repay in full between 10 and 30
’s view on the
monetary benefits of higher education. Respondents were asked if and how much they
graduates with the same qualification at the
leaving. Figure 6 shows the distribution of answers to this question.
le nearly 78% of respondents believed that graduates earned more, only 22%
ly more (over £5,000) per year.
r respondents would be the first
in their immediate family to go to higher education or not: while 80.4% of students
who have family members with higher education experience considered there to be a
mily respondents was only
72.4%. This variation is important since the attitude towards the notion of a graduate
premium has a strong influence on the propensity for applying to higher education:
premium did not
apply to higher education, the corresponding figure for respondents who did not
For the full distribution of repayment expectations see tables in Appendix 2, Section 4.

16
Rationales underpinning higher education decisions
Reasons for applying to higher education
The 528 respondents who indicated that they applied for a place in higher education
were asked how important items on a list of considerations were in their decision
making. This question used a five-point Likert scale format, providing the options of
‘very important’, ‘important’, ‘slightly important’, ‘hardly at all’, ‘not at all’11. The
list of 13 considerations suggested ranged from items focused on the subject chosen,
to the future benefits of studying, to items on the financial implications of their
decision. Table 3 lists the considerations suggested in the order of perceived
importance, combining ‘very important’ and ‘important’ responses into an approval
rate for each item. The table also reports the mean score for each item and the
standard deviation of responses.
Table 3: Responses to ‘How important were the following considerations in your decision making?’ AR12 Mean SD
1 I am interested in learning more about my subject 81.6% 3.08 1.35
2 A further qualification will help me to get a better job 79.4% 2.97 1.35
3 A further qualification is essential for my intended profession/career
68.4% 2.68 1.61
4 A further qualification will help me to get a job with higher earnings
63.1% 2.47 1.57
5 As jobs become scarcer I am more likely to find one if I have a higher qualification
43.9% 1.77 1.59
6 I am doing well academically so it seems to make sense to continue my studies
36.6% 1.64 1.47
7 The financial support I could get 23.3% 1.08 1.44
8 The amount I would have to pay 20.3% 1.02 1.39
9 It’s what my family/friends/teachers expect me to do 14.8% 0.92 1.25
10 I don’t know what I want to do next so I might as well go to university
11.4% 0.66 1.16
11 There are no jobs available so I might as well study for longer
9.1% 0.54 1.06
12 It’s what everyone in my family has done 6.6% 0.44 0.97
13 It’s what all my friends are doing 4.7% 0.43 0.87
11 These ratings were translated into a 4-0 scale for the quantitative analysis. 12 AR = Approval Rate – share of respondents that regarded item as ‘very important’ or ‘important’.

17
The results indicate that interest in the subject (item 1) and considerations
concerning the future career-related benefits of having a degree (items 2, 3, 4, 5) are
the most important issues for students’ decisions about whether or not to continue to
higher education. Item 4 gives an indication of the degree to which respondents have
taken the prospect of earning more in the future (i.e. graduate premium) into account,
an issue discussed in a previous section. Items that indicate that higher education is
regarded as a ‘default’ option that is entered without any particular reason (items 6,
10, 11) are less important than those that indicate a career-related rationale. Short-
term financial considerations (items 7, 8) are also less important, with social
expectations least important (items 9, 12, 13).
A common factor analysis of the data generated by the question about the
considerations that guided the decisions of respondents concerning whether or not to
apply to higher education revealed five underlying factors,13 with the first factor
explaining 73% of the total variance in responses. Table 4 gives the loadings of each
of these five factors onto each of the questions. The first factor was most strongly
connected to questions about fees and financial support. The second factor was
connected to questions about job and earning prospects. The third factor related to
questions about the lack of alternative options to further study (including no jobs and
uncertainty about what to do next). The fourth factor identified is connected to social
norms, where the respondent may have felt they were expected to go to university.
The final factor relates to an interest in further study for its own sake.
The factor scores for each respondent are calculated using a linear projection.
Table 5 compares mean factor scores between different groups. The most important
factor, which is linked to financial concerns, is significantly different within two
groups – those with and without other family members in higher education and those
with different levels of concern about future debt. Concerns about future prospects
(and the benefits of having a degree for future earnings and employment
opportunities) are stronger for those applying to pre-1992 universities (especially
those applying to Russell Group universities), and for those who believe that
graduates do earn more than non-graduates. By contrast, those who do not believe in a
graduate premium are more strongly influenced by feelings that there are no
13 For more details on the way the common factor analysis was conducted and the criteria used for determining the number of factors see Appendix 3.

18
alternatives to higher education. Finally, the motivation to study further for its own
sake is more strongly felt by those applying to pre-1992 universities.
Table 4: Factors influencing the decision to apply to higher education
Item Factor 1 Factor 2 Factor 3 Factor 4 Factor 5
I am interested in learning more about my subject
0.2428 0.1533 -0.1285 -0.0495 0.3269
A further qualification is essential for my intended profession/career
0.1438 0.3547 -0.1864 0.1627 0.0152
A further qualification will help me to get a better job
0.1048 0.6358 0.0595 0.0612 0.1025
A further qualification will help me to get a job with higher earnings
0.1654 0.6656 0.0718 0.1538 -0.0228
It’s what all my friends are doing 0.1836 0.0851 0.3304 0.5157 0.0546
It’s what everyone in my family has done 0.1609 0.1285 0.1395 0.5696 0.0117
It’s what my family/friends /teachers expect me to do
0.1218 0.1581 0.1928 0.5770 -0.0102
The amount I would have to pay 0.7370 0.0889 0.1696 0.1048 0.0206
The financial support I could get 0.7479 0.1472 0.1113 0.1122 0.0475
I don’t know what I want to do next so I might as well go to university
0.1716 0.0055 0.6606 0.2190 -0.0021
There are no jobs available so I might as well study for longer
0.2393 0.1744 0.5832 0.1586 0.0005
As jobs become scarcer I’m more likely to find one if I have a higher qualification
0.1919 0.4389 0.3602 0.0768 0.0729
I am doing well academically so it seems to make sense to continue my studies
0.2497 0.2783 0.2186 0.2240 0.2956
Factor name Financial Job prospects
Default Social Learning
Note: Principal factor analysis; varimax rotation
The questionnaire asked participants who had applied to higher education
whether they planned to take a gap year and if so whether they would use the year to
earn money for financing their higher education studies. Of the 17% of respondents
that were planning a gap year, two-thirds indicated that they would want to earn
money to help to pay for their subsequent studies.

19
Table 5: Factor cross-tabulation, question 10
Financial Prospects Default Social Learning n
Female -0.043 -0.025 -0.050 -0.024 !0.009 319
Male -0.069 !0.036 !0.078 !0.040 -0.012 208
Difference -0.112 -0.060 -0.128* -0.064 !0.021
Pre-1992 -0.010 !0.063 -0.016 !0.008 !0.066 347
Post-1992 -0.014 -0.118 -0.060 -0.021 -0.132 126
Difference !0.004 !0.182** !0.044 !0.028 !0.198***
Russell Group -0.037 !0.089 !0.000 !0.053 !0.086 270
Non-Russell Group !0.031 -0.078 -0.052 -0.062 -0.079 205
Difference -0.068 !0.168** !0.050 !0.115* !0.165***
Not first in HE -0.049 !0.042 !0.019 !0.064 !0.007 367
First in HE !0.134 -0.085 -0.064 -0.160 -0.008 153
Difference -0.182** !0.127* !0.083 !0.224*** !0.015
Doesn't believe in graduate premium
-0.01 -0.21 !0.23 !0.11 -0.03 81
Believes in graduate premium -0.01 !0.05 -0.04 -0.01 !0.01 416
Difference !0.003 -0.257*** !0.276*** !0.121 -0.042
Not concerned about debt -0.177 !0.024 -0.002 !0.039 !0.021 303
Concerned about debt !0.264 -0.024 !0.020 -0.040 -0.028 204
Difference -0.441*** !0.048 -0.022 !0.079 !0.049
Notes: Significance of difference in scores tested using two-sided Student’s t-test. ***=1% significance, **=5% significance * = 10% significance.
Institutional choice
Participants were asked to which institution they had applied. 73.6% of respondents
applied to at least one pre-1992 university, of whom 75.3% applied to at least one
Russell Group university. This was followed by a question about the relative
importance of a series of aspects that might influence their decision about where to
apply. This question used a five-point Likert scale format, providing the options of
‘very important’, ‘important’, ‘slightly important’, ‘hardly at all’, ‘not at all’. This was
done by providing a list of 15 aspects and asking respondents to evaluate their
importance on a 5-point Likert scale (from ‘very important’ to ‘not at all important’).
Table 6 reports the results for this question in the same way as for the previous Likert
scale question.

20
Table 6: Responses to ‘How important were the following aspects in your decision on where to apply?’
N AR Mean SD 1 Content of course 518 85.5% 3.24 1.25 2 Facilities for study 509 70.1% 2.60 1.51 3 Reputation of institution 524 68.1% 2.56 1.46 4 Success of graduates in getting jobs 524 55.2% 2.06 1.68 5 Professional accreditation of course 524 49.6% 1.90 1.72 6 Social life 524 48.9% 2.00 1.55 7 Wanted to go away from home 524 32.4% 1.45 1.53 8 Sports facilities 524 26.1% 1.19 1.48
9 Recommendations of teacher(s) family member(s)
friend(s) 524 16.6% 0.86 1.30
10 Bursaries/scholarships available 524 15.8% 0.82 1.29 11 High level of fees 524 13.5% 0.72 1.24 12 Wanted to live at home 524 8.8% 0.42 1.06 13 Low level of fees 524 5.3% 0.46 0.96 14 It’s where my family/friends have gone in the past 524 3.2% 0.22 0.70 15 It’s where my friends are going 524 2.7% 0.22 0.65
The content of the course was the most important aspect for respondents when
choosing their university, corresponding with the interest in learning more about the
chosen subject in the earlier question on the main considerations for entering higher
education (see Table 3). For more than two-thirds of respondents study facilities and
the reputation of the institution played a very important or important part in their
institutional choice, followed by career-related aspects (transition to the labour market
and professional accreditation of course) with approval rates of around 50%. The
social life offered by an institution was important or very important for just under half
of respondents, nearly double the approval rate for sports facilities. As in the previous
question on reasons for studying, social expectations and recommendations (items 9,
14, 15) were relatively less important in deciding on an institution. Short-term
financial considerations were not considered as important by many respondents (items
10, 11, 13). Linked to this is a low approval rate for item 12 ‘Wanted to live at home’,
which also has financial implications which were deemed less important by
respondents. Indeed, the approval rate of item 7 (‘Wanted to go away from home’)
was more than three times higher than that for item 12.
The factor analysis identified five factors underlying the institutional choice.14
Once again, financial considerations are most important – here, it is the concern about
14 See Figures and Tables in Appendix 3 for Eigenvalues and loadings of the identified factors.

21
the levels of fees and bursaries at a particular institution that matters. This concern is
combined with giving significance to recommendations by teachers or family
members, which suggests individuals that care more about cost also rely more heavily
on personal advice. This first factor explains 77% of the total variance in responses.
More objective differences in the quality of institutions and courses also matter, as
captured by the second and fourth factor. As with the previous analysis, decisions
made by friends and family also matter. Finally, some individuals are motivated by
being able to get away from home and enjoy the social life aspects of university.
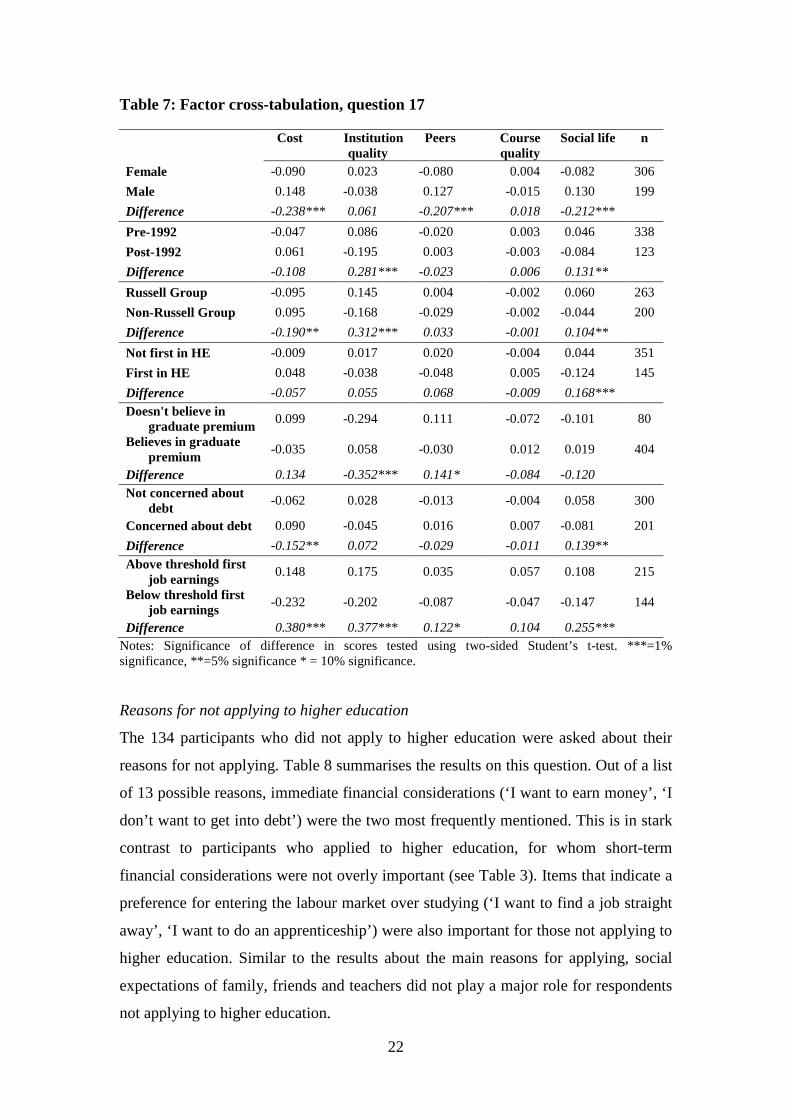
Table 7 compares predicted scores for these factors between different sub-
groups. Concerns about cost are higher for men, for those applying to post-1992
universities (as compared to those applying to Russell Group universities) and,
unsurprisingly, for those concerned about the debt burden. Those who expect to earn
above the repayment threshold in their first job after graduation were also more
concerned with costs. This suggests cost is less of a concern if individuals do not
expect to start repayments immediately. We may also tentatively conclude from this
that respondents view repayments as an income-contingent obligation (like a tax)
rather than as a debt, and are therefore happy to delay it and worry less about its size.
If they viewed it like a regular debt (like a mortgage or a credit card bill), then we
would expect individuals who anticipate longer repayment periods to be more
concerned about the total cost.
Respondents who have applied to pre-1992 (including Russell Group)
institutions were more concerned about the reputation and quality of the institution.
Those anticipating higher earnings (both for themselves, and in general) were more
motivated by the quality of the institution, perhaps reflecting a belief that the choice
of institutions matters for achieving success in the labour market after graduation.
Male respondents were more motivated by the choices of their peers, either
those made by friends or those made previously by family members. Respondents
who did not believe graduates earn more were also more motivated by this. Course
quality does not appear to be a factor that differs much across the various subgroups,
however, a concern about the social aspects of going to university does matter. Those
applying to the older universities, those who are not the first to go to university and
those who anticipated higher earnings when they completed their studies were more
influenced by social life issues.
22
Table 7: Factor cross-tabulation, question 17
Cost Institution !quality
Peers Course quality
Social life n
Female -0.090 !0.023 -0.080 !0.004 -0.082 306
Male !0.148 -0.038 !0.127 -0.015 !0.130 199
Difference -0.238*** !0.061 -0.207*** !0.018 -0.212***
Pre-1992 -0.047 !0.086 -0.020 !0.003 !0.046 338
Post-1992 !0.061 -0.195 !0.003 -0.003 -0.084 123
Difference -0.108 !0.281*** -0.023 !0.006 !0.131**
Russell Group -0.095 !0.145 !0.004 -0.002 !0.060 263
Non-Russell Group !0.095 -0.168 -0.029 -0.002 -0.044 200
Difference -0.190** !0.312*** !0.033 -0.001 !0.104**
Not first in HE -0.009 !0.017 !0.020 -0.004 !0.044 351
First in HE !0.048 -0.038 -0.048 !0.005 -0.124 145
Difference -0.057 !0.055 !0.068 -0.009 !0.168***
Doesn't believe in graduate premium
!0.099 -0.294 !0.111 -0.072 -0.101 80
Believes in graduate premium
-0.035 !0.058 -0.030 !0.012 !0.019 404
Difference !0.134 -0.352*** !0.141* -0.084 -0.120
Not concerned about debt
-0.062 !0.028 -0.013 -0.004 !0.058 300
Concerned about debt !0.090 -0.045 !0.016 !0.007 -0.081 201
Difference -0.152** !0.072 -0.029 -0.011 !0.139**
Above threshold first job earnings
!0.148 !0.175 !0.035 !0.057 !0.108 215
Below threshold first job earnings
-0.232 -0.202 -0.087 -0.047 -0.147 144
Difference !0.380*** !0.377*** !0.122* !0.104 !0.255***
Notes: Significance of difference in scores tested using two-sided Student’s t-test. ***=1% significance, **=5% significance * = 10% significance.
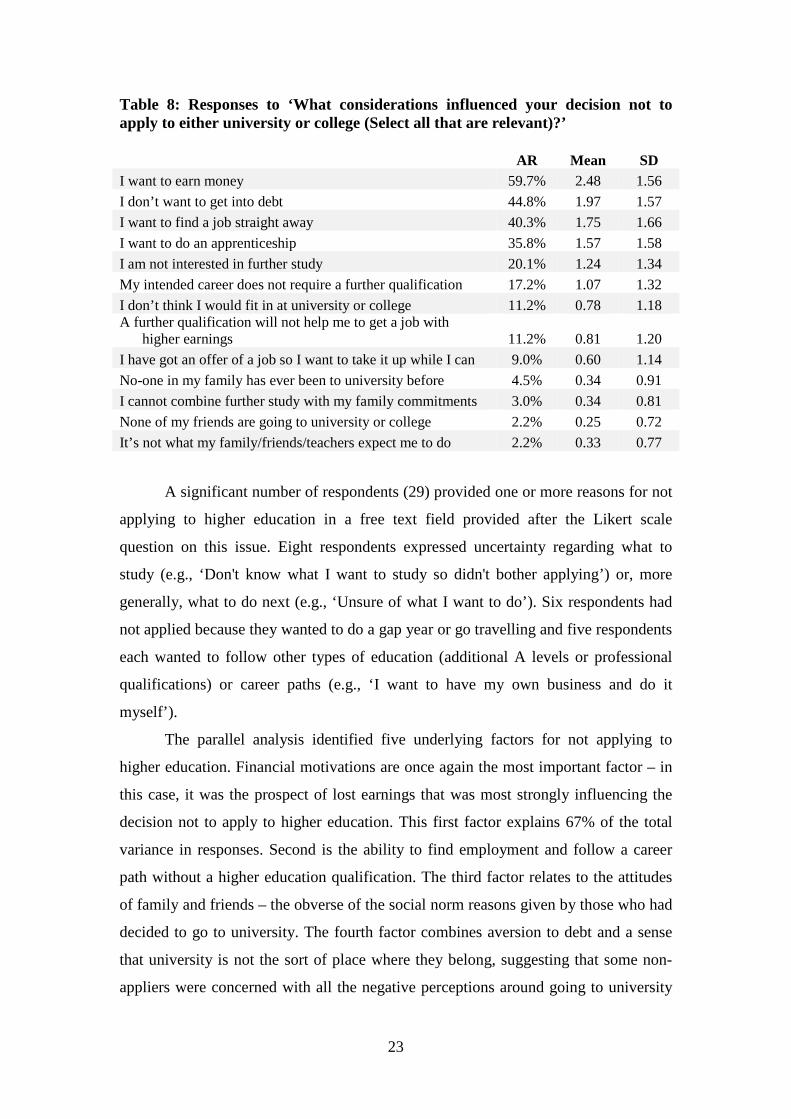
Reasons for not applying to higher education
The 134 participants who did not apply to higher education were asked about their
reasons for not applying. Table 8 summarises the results on this question. Out of a list
of 13 possible reasons, immediate financial considerations (‘I want to earn money’, ‘I
don’t want to get into debt’) were the two most frequently mentioned. This is in stark
contrast to participants who applied to higher education, for whom short-term
financial considerations were not overly important (see Table 3). Items that indicate a
preference for entering the labour market over studying (‘I want to find a job straight
away’, ‘I want to do an apprenticeship’) were also important for those not applying to
higher education. Similar to the results about the main reasons for applying, social
expectations of family, friends and teachers did not play a major role for respondents
not applying to higher education.
23
Table 8: Responses to ‘What considerations influenced your decision not to apply to either university or college (Select all that are relevant)?’
AR Mean SD I want to earn money 59.7% 2.48 1.56
I don’t want to get into debt 44.8% 1.97 1.57
I want to find a job straight away 40.3% 1.75 1.66
I want to do an apprenticeship 35.8% 1.57 1.58
I am not interested in further study 20.1% 1.24 1.34
My intended career does not require a further qualification 17.2% 1.07 1.32
I don’t think I would fit in at university or college 11.2% 0.78 1.18 A further qualification will not help me to get a job with
higher earnings 11.2% 0.81 1.20
I have got an offer of a job so I want to take it up while I can 9.0% 0.60 1.14
No-one in my family has ever been to university before 4.5% 0.34 0.91
I cannot combine further study with my family commitments 3.0% 0.34 0.81
None of my friends are going to university or college 2.2% 0.25 0.72
It’s not what my family/friends/teachers expect me to do 2.2% 0.33 0.77
A significant number of respondents (29) provided one or more reasons for not
applying to higher education in a free text field provided after the Likert scale
question on this issue. Eight respondents expressed uncertainty regarding what to
study (e.g., ‘Don't know what I want to study so didn't bother applying’) or, more
generally, what to do next (e.g., ‘Unsure of what I want to do’). Six respondents had
not applied because they wanted to do a gap year or go travelling and five respondents
each wanted to follow other types of education (additional A levels or professional
qualifications) or career paths (e.g., ‘I want to have my own business and do it
myself’).
The parallel analysis identified five underlying factors for not applying to
higher education. Financial motivations are once again the most important factor – in
this case, it was the prospect of lost earnings that was most strongly influencing the
decision not to apply to higher education. This first factor explains 67% of the total
variance in responses. Second is the ability to find employment and follow a career
path without a higher education qualification. The third factor relates to the attitudes
of family and friends – the obverse of the social norm reasons given by those who had
decided to go to university. The fourth factor combines aversion to debt and a sense
that university is not the sort of place where they belong, suggesting that some non-
appliers were concerned with all the negative perceptions around going to university
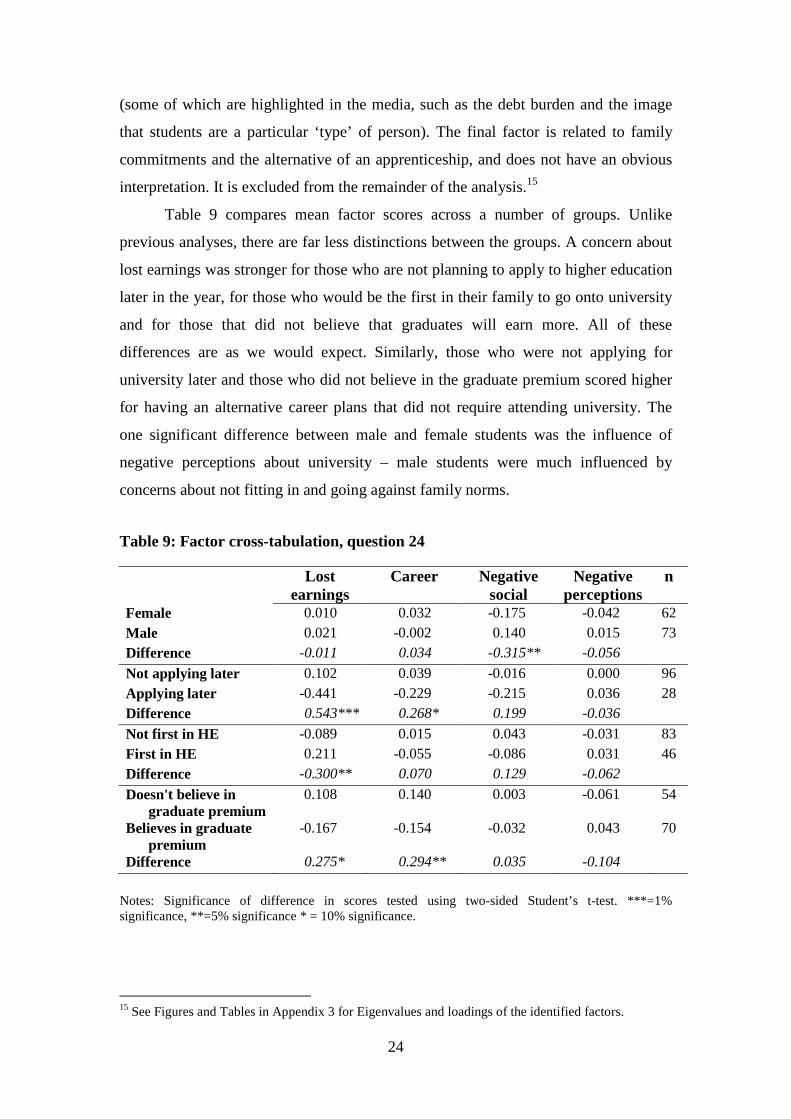
24
(some of which are highlighted in the media, such as the debt burden and the image
that students are a particular ‘type’ of person). The final factor is related to family
commitments and the alternative of an apprenticeship, and does not have an obvious
interpretation. It is excluded from the remainder of the analysis.15
Table 9 compares mean factor scores across a number of groups. Unlike
previous analyses, there are far less distinctions between the groups. A concern about
lost earnings was stronger for those who are not planning to apply to higher education
later in the year, for those who would be the first in their family to go onto university
and for those that did not believe that graduates will earn more. All of these
differences are as we would expect. Similarly, those who were not applying for
university later and those who did not believe in the graduate premium scored higher
for having an alternative career plans that did not require attending university. The
one significant difference between male and female students was the influence of
negative perceptions about university – male students were much influenced by
concerns about not fitting in and going against family norms.
Table 9: Factor cross-tabulation, question 24
Lost earnings
Career Negative social
Negative perceptions
n
Female -0.010 -0.032 -0.175 -0.042 62 Male -0.021 -0.002 -0.140 -0.015 73 Difference -0.011 -0.034 -0.315** -0.056
Not applying later -0.102 -0.039 -0.016 -0.000 96 Applying later -0.441 -0.229 -0.215 -0.036 28 Difference -0.543*** -0.268* -0.199 -0.036
Not first in HE -0.089 -0.015 -0.043 -0.031 83 First in HE -0.211 -0.055 -0.086 -0.031 46 Difference -0.300** -0.070 -0.129 -0.062
Doesn't believe in graduate premium
-0.108 -0.140 -0.003 -0.061 54
Believes in graduate premium
-0.167 -0.154 -0.032 -0.043 70
Difference -0.275* -0.294** -0.035 -0.104
Notes: Significance of difference in scores tested using two-sided Student’s t-test. ***=1% significance, **=5% significance * = 10% significance.
15 See Figures and Tables in Appendix 3 for Eigenvalues and loadings of the identified factors.

25
Sources of information and advice
All 652 respondents to the questionnaire were asked where they sought information
and advice when deciding whether or not to apply to university16. They were asked to
choose as many of the 13 options stated as relevant for them and to provide further
sources. Table 10 provides an overview of the answers to this question and shows that
advice from a student’s teachers and social network are particularly important. UCAS
and university open days follow closely in this respect.
Table 10: Responses to ‘When reaching your decision about whether or not to study, where did you seek advice (Select all that apply)?’
AR Mean SD Teachers or tutors at school 61.2% 2.44 1.33 Parents/carers 49.1% 2.02 1.56 University open days 45.9% 1.83 1.69 UCAS 45.2% 1.91 1.57 Friends/family who are now or have recently
been at university 35.9% 1.51 1.55
Universities own publications/www site 28.8% 1.26 1.51 University directories league tables or
comparison www sites 26.4% 1.19 1.48
Other family or friends 23.9% 1.15 1.43 Careers fairs 11.7% 0.67 1.13 OFFA 1.4% 0.19 0.60
Factor analysis indicated there are four underlying patterns for the use of
information sources in the decision to apply to higher education. The first underlying
factor combines items on formal sources of information (such as UCAS, university
websites and open days) and explains 83% of the total variance in responses. The
second factor brings together informal sources (such as parents or friends), and a third
factor loads onto information from OFFA (Office for Fair Access) and careers fairs –
there is not an obvious interpretation here. Information from teachers is the fourth
factor.17
Table 11 compares factor scores across groups. As this survey question was
asked both to those who applied to higher education and to those who did not, we can
compare scores for information sources between the two. Those who did apply relied
16 KIS were not published for candidates applying for 2012 entry, but will be available to subsequent cohorts. 17 See Figures and Tables in Appendix 3 for Eigenvalues and loadings of the identified factors.

26
much more heavily on official information and teachers. Those that did not apply
relied more heavily on informal sources, OFFA and careers fairs. Care should be
taken with interpretation here. We are not able to say that those looking at formal
sources were, consequently, more likely to apply. Without additional information, it is
equally likely that those who were more likely to apply to higher education anyway
would look at university and UCAS information. Similarly, those who were less pre-
disposed to applying may have preferred to speak to friends and relied on information
from OFFA (perhaps because they were from a family with little background in
attending university) and careers fairs (because they were already thinking about non-
higher education jobs).
Table 11: Factor cross-tabulation, question 26
Formal Informal Careers Teachers n
Didn't apply to HE -0.427 -0.226 -0.081 -0.177 154 Applied to HE -0.105 -0.112 -0.047 -0.062 473 Difference -0.532*** -0.338*** -0.127*** -0.239***
Female -0.004 -0.000 -0.031 -0.021 367 Male -0.004 -0.019 -0.049 -0.031 278 Difference -0.000 -0.019 -0.080** -0.052
Pre-1992 -0.156 -0.107 -0.052 -0.066 322 Post-1992 -0.129 -0.120 -0.038 -0.127 123 Difference -0.027 -0.013 -0.014 -0.061
Russell Group -0.151 -0.031 -0.055 -0.075 248 Non-Russell Group -0.161 -0.195 -0.028 -0.087 198 Difference -0.010 -0.164** -0.027 -0.012
Not first in HE -0.013 -0.067 -0.003 -0.016 442 First in HE -0.041 -0.152 -0.006 -0.036 195 Difference -0.054 -0.219*** -0.003 -0.051
Doesn't believe in graduate
premium -0.162 -0.036 -0.047 -0.145 130
Believes in graduate premium
-0.035 -0.023 -0.012 -0.032 500
Difference -0.197** -0.059 -0.059 -0.177***
Not concerned about debt -0.101 -0.119 -0.018 -0.040 287 Concerned about debt -0.182 -0.016 -0.035 -0.097 193 Difference -0.082 -0.103 -0.017 -0.057
Notes: Significance of difference in scores tested using two-sided Student’s t-test. ***=1% significance, **=5% significance * = 10% significance.

27
When asked in a separate question about the main sources of information
concerning the cost of studying for a degree, respondents who applied to higher
education indicated very similar sources. However, this time UCAS was the most
widely used source of information (by over 70% of respondents), followed by
university open days. Only then teachers or tutors at schools and parents and carers
are mentioned (see Table A2.15, Appendix 2). The lack of experience with the new
fee and financial support regime on the side of teachers and family members may be a
reason for this result.
Decision to apply to university: further analysis
The analysis tested the factors that affect the decision to apply to university using a
logistic regression. The model estimates the marginal effects of various individual
characteristics on the probability of survey respondents applying to HE. This analysis
aimed at a better understanding of the factors associated with a higher probability of
choosing to apply to higher education. It does not make any claims about causality.
A number of variables were included which the above analysis would suggest
has an effect on the decision to apply to HE, for example demographic information on
gender and racial background. The analysis looks at the effect of whether anyone in
the family has applied to higher education in the past, and the POLAR 2 code for the
individual’s postcode. Academic qualifications are included via an indicator variable
for whether the student is currently doing A levels, and a second one for if the student
is currently doing AS levels. The reference group for these variables are those doing
all other qualifications, including BTECs, NVQs and the IB.
Finally, the analysis includes measures which capture individual attitudes and
perceptions about university and its value. One of the variables captures whether the
student believes in the graduate premium. It would have been desirable to include a
measure of whether the student is concerned about debt, but this was not asked to
non-appliers, so this variable was constructed using the question that asked about
reasons they did not apply to HE. The student is considered to be concerned about
debt if they list that as a reason for not applying. However, this variable needs to be
treated carefully, as it is potentially endogenous if non-appliers respond to the two
questions differently. For instance, if they were asked about why they did not apply,
they might mention debt as being a factor (as there was the option to do so), even if it
was not the major factor and even if they are not in general concerned about debt.

28
Finally, the factor scores for the sources of information used, as discussed above,
were included. Several specifications of the model were tested, shown in Table 12.
Figures in brackets are the p-values of the coefficients.
Table 12: Specifications of model
(1) (2) (3) (4) (5) (6) (7)
FEMALE 0.485** 0.440** 0.428** 0.492** 0.745*** 0.550** 0.876***
(2.60) (2.33) (2.21) (2.36) (2.93) (2.34) (2.91)
WHITE -0.907*** -0.814** -0.788** -0.698** -1.203** -0.946** -1.443***
-(2.90) -(2.59) -(2.45) -(2.05) -(2.50) -(2.57) -(2.77)
POLAR2 0.138 0.131 0.135 0.133 0.215* 0.217* 0.354**
(1.47) (1.38) (1.39) (1.28) (1.75) (1.82) (2.35)
FIRST IN HE
-0.142 -0.070 -0.067 -0.064 -0.148 -0.161
-(0.71) -(0.34) -(0.30) -(0.24) -(0.58) -(0.51)
A LEVELS 1.468*** 1.269*** 0.428 1.324*** 0.388
(4.90) (3.88) (1.03) (3.44) (0.74)
AS LEVELS 0.740 0.557 0.521 0.821 0.940
(1.53) (1.07) (0.77) (1.40) (1.18)
A LEVELS * AS LEVELS
-1.043** -0.775 -0.499 -1.170* -1.105
-(1.97) -(1.37) -(0.68) -(1.81) -(1.29)
GRADUATE PREMIUM
1.127*** 1.381*** 0.843*** 1.214***
(4.89) (5.09) (3.12) (3.65)
DEBT CONCERN
-1.335***
-1.193***
-(5.08)
-(3.96)
FORMAL 1.144*** 1.880***
(5.83) (6.41)
INFORMAL -0.763*** -0.685***
-(4.08) -(2.85)
CAREERS -0.910*** -1.605***
-(3.00) -(3.99)
TEACHERS 0.516** 0.231
(1.96) (0.69)
CONSTANT 1.020** 1.050** -0.129 -0.935 0.570 -0.555 0.958
(2.25) (2.27) -(0.24) -(1.57) (0.77) -(0.84) (1.12)
N 621 611 610 566 516 540 492
Pseudo R2 0.0246 0.0214 0.0568 0.0974 0.1600 0.2326 0.3468

29
The estimations show that female students are more likely to apply to
university than male students, even after controlling for a number of other factors.
White students apply in smaller numbers – this could be explored further and to look
at black and Asian students separately, but the small numbers do not allow it. From
the earlier analysis, it can be supposed that this result is driven by the higher
application numbers of Asian students in tis sample.
Perceptions about earnings are important – students that believe graduates earn
more than non-graduates are far more likely to apply. Students doing A-Levels, the
traditional pathway into higher education, are more likely to go into higher education
in some of the specifications. However, once attitudes towards debt are controlled for,
this variable loses its significance. This could be interpreted as either meaning that A-
Level students do not have a greater propensity to apply to higher education than
others, once other demographic and perception factors are controlled for, or that there
are some problems with the ‘concern about debt’ variable, as indicated above.
Finally, the table shows that the ‘sources of information’ variables are an
important predictor of the decision to apply to HE. It is not immediately clear why
that might be the case. Firstly, it could be that those who are predisposed towards
going to university look for information in different places to those who are less
certain about wanting to apply. Secondly, it could be that formal guidance actively
encourages applications, while informal guidance makes higher education seem less
desirable. To investigate this in more detail, the connection between the use of formal
and informal information and family expectations is further investigated. In particular
it seem important to question, for those who apply to HE, the use of formal and
informal information for those who reported that one of the reasons for applying was
because their family expected them to. For those not applying, how information
sources relate to family expectations about not going to university seems particularly
relevant. Table 13 shows these comparisons.
It becomes clear that non-appliers whose family do not expect them to go to
higher education use formal information sources less and tend to rely more heavily on
informal sources, which includes family members. This suggests these expectations
are important – having taken negative information from their family about going to
university, these students are less likely to make use of other information and will
therefore be likely to base their decisions on their family’s initial expectations for
them. For appliers, those with family who expect them to go to higher education use

30
both formal and non-formal information sources more. Here, positive informal
information (such as a family push for the student to go university) seems to
encourage the student to look for more information from other sources.
Table 13 – Family expectations of appliers and non-appliers
N Formal Informal
Non-appliers
Family expects them not to apply 63 -0.6585 -0.4057 Family does not expect them not to apply 91 -0.0919 -0.1008 Difference
-0.5666*** -0.3049***
Mean
-0.3237 -0.2255
Appliers
Family expects them to apply 193 -0.3133 -0.0698 Family does not expect them to apply 280 -0.0387 -0.2376 Difference
-0.3520*** -0.3074***
Mean
-0.1049 -0.1122
Therefore, it can be conjectured (given the data generated for this study) that
the information source effect in the regression partly reflects family expectations.
Positive expectations jointly lead to greater use of formal sources of information and
greater rates of application. Negative expectations lead to both a heavy reliance on
informal sources of information and lower rates of application.
Discussion and Conclusion
Financial considerations clearly influence the decisions potential applicants make with
regard to higher education. The data presented here show that views regarding the
graduate premium have a profound impact on the decision of sixth formers about
whether or not to apply to higher education. This is compounded by the effect that
expectations potential applicants’ families have on consulting different sources of
information on higher education institutions and programmes. For those that are
applying to university, financial issues relating to labour market success and careers
remain a big factor in that decision, while financial issues relating to course cost play
some part in the choice of institution. Indirect experience of higher education, through
family, friends or local community, plays a role in the way perceptions about these

31
financial issues are formed – first-generation appliers tend to be more pessimistic
about the financial benefits of going to university, and more concerned about student
debt.
While differences in expected cost of studying at different institutions was not
the only factor in choices about where to apply, the high level of debt prospective
students expect plays an important role in their decisions about higher education.
Questions of employability upon graduation are regarded as highly important.
The levels of selectivity that prospective students sampled for this study
demonstrated suggested that the Clearing process might operate differently as fees
increased, with a reduced number of applicants accepting places on courses or at
institutions that they have not previously considered and short-listed. In practice,
however, UCAS data on the 2012 admissions cycle (released 13 September 2012)
showed a slight increase in places accepted in Clearing 2012, over Clearing 2011
(52,570 as opposed to 49,740), contradicting this possible implication of the findings
of this research. It may be that, for applicants who have made a commitment to going
to university, the intentions and motivations expressed during this research (conducted
more than six months before the start of the new academic year) are less influential
just a few weeks before enrolment, making them more open to consider a wider range
of courses and institutions than they had originally planned.
This research was not able to clarify conclusively at what point in their
decision-making process potential applicants consider the cost implications of
studying for a degree. There are some indications cost considerations influence
decisions at a number of stages in different ways, but what triggers these
considerations remains less clear. This study also highlighted some of the main
sources of information potential applicants use when making their decisions and point
at connections between which sources of information are used and some of the
outcomes of these decisions. Data from the focus group interviews conducted (not
reported in this paper) also raises the question whether potential applicants have
sufficient information on the cost of studying at specific higher education institutions.
There is perceived to be little differentiation between the net cost of attending
different institutions, an issue that the introduction of key information sets could, at
least partly, address.
32
References
Benton, T. (2012) Do I Really Need a Degree? The Impact of Tuition Fee Increases on Young People’s Attitudes Towards the Need for Qualifications, Slough: NFER.
BIS (Department for Business, Innovation and Skills) (2011) The Returns to Higher Education Qualifications, Research Paper no 45, London: BIS.
Callender, C. (2003) Attitudes to Debt, London: Universities UK.
Callender, C. and Jackson, J. (2008) ‘Does fear of debt constrain choice of university and subject of study?’ Studies in Higher Education, 33: 4, 405-429.
CHERI/LSBU (Centre for Higher Education Research and Information and London South Bank University) (2005) Survey of Higher Education Students’ Attitudes to Debt and Term-Time Working and Their Impact on Attainment, London: Universities UK.
Davies, P., Slack, K., Hughes, A., Mangan, J. and Vigurs, K. (2008) ‘Knowing where to study? Fees, bursaries and fair access’, Institute for Educational Policy Research and Institute for Access Studies, Staffordshire University: Staffordshire, UK.
Davies P, Mangan, J., Hughes, A. and Slack, K. (2010) ‘Labour market motivation and undergraduates’ choice of degree subject’, Paper presented at SRHE Conference 14-16 December Newport, Gwent.
HEFCE (Higher Education Funding Council for England) (2012) Key Information Sets, http://www.hefce.ac.uk/whatwedo/lt/publicinfo/kis/ (accessed 7 December 2012).
Johnstone, D. (2004) ‘The economics and politics of cost sharing in higher education: comparative perspectives’, Economics of Education Review, 23, 403-410.
OpinionPanel (2012) 2012 Applicants Survey: How Have Higher Fees Affected the Decision-Making Processes of 2012 Applicants? London: OpinionPanel.
Purcell, K., Elias, P., Ellison R, Atfield, G., Adam, D. and Livanos, I. (2008) Futuretrack – Applying for Higher Education – The Diversity of Career Choices, Plans and Expectations, HECSU/Warwick Institute for Employment Research.
Spellings (The Secretary of Education’s Commission on the Future of Higher Education) (2006) A Test of Leadership: Charting the Future of US Higher Education, Washington DC: US Department of Education.
Thompson, J. (2012) Returns on Investment in HE, Oxford: HEPI.
Thompson, J. and Bekhradnia, B. (2012) The Impact on Demand of the Government's Reforms of Higher Education, Oxford: HEPI.
UCAS (Universities and Colleges Admissions Service) (2012a) How Have Applications for Full-Time Undergraduate Education in the UK Changed in 2012? Cheltenham: UCAS.
UCAS (2012b) End of Cycle Report 2012, Cheltenham: UCAS.
UUK/HEFCE (Universities UK/HEFCE) (2010) Changes in Student Choices and Graduate Employment, London: Universities UK.

33
Wilkins, S., Shams, F. and Huisman, J. (2012) ‘The decision-making and changing behavioural dynamics of potential higher education students: the impacts of increasing tuition fees in England’, Educational Studies, 39, 2, 125-141.
Willetts, D. (2011a) ‘Speech at Guardian HE Summit’, 16 March 2011, London.
Willetts, D. (2011b) ‘Speech at UUK Spring Conference’, 25 February 2011, London.

34
Appendix 1: Description of sample
1. Respondents
Respondents Share
Gender:
female 423 56.70% male 323 43.30%
Ethnicity:
White 610 81.77% Black 35 4.69% Asian 62 8.31% Mixed 26 3.49% Other 1 0.13% I prefer not to provide this information 12 1.61%
Age: Average: 17.6 17 351 47.76% 18 320 43.54% 19 43 5.85% 20+ 7 0.95% No information provided 13 1.90%
First in family in higher education
Yes 221 31.00% No 492 69.00%
Qualifications currently studied for (Select all that apply): AS-levels 320 26.58% A-levels 619 51.41% International Baccalaureate 20 1.66% Other Baccalaureate 4 0.33% BTEC 104 8.64% NVQ 8 0.66% Diploma 19 1.58% Advanced Diploma 28 2.33% AVCE 0 0.00% Extended Project 59 4.90% Other 23 1.91%

35
2. Schools/Colleges
The sample of schools and colleges includes four state comprehensive schools (1, 2,
4, 7), two sixth form colleges (3, 5) and one independent girls’ school (6). School 1 is
in Buckinghamshire; all institutions are located in Oxfordshire. Due to the small
number of responses from school 7, responses from this school were excluded from
institution-level analysis.
School/College Respondents Share 1 118 17.25% 2 182 26.61% 3 47 06.87% 4 97 14.18% 5 162 23.68% 6 70 10.23% 7 8 01.17%
Applied to HE Application rate POLAR 2 mean 1 98 83.1% 2.91 2 139 76.4% 4.48 3 33 70.2% 3.93 4 59 60.8% 4.17 5 107 66.0% 4.48 6 68 97.1% 4.63

36
Appendix 2: Results from questionnaire
1. Expected earnings
Table A2.1: Responses to ‘How much do you expect to earn in your first job after you finished your degree?’
Respondents Share £0 – £15,000 034 006.5% £15,001 – £21,000 114 021.9% £21,001 – £30,000 139 026.7% £30,001 – £40,000 047 009.0% £40,001 – £50,000 014 002.7% >£50,000 024 004.6% don't know/have not thought about this 149 028.6% Total 521 100.0%
Table A2.2: Expected earnings according to gender, 1st in family in higher education
Overall Female Male First in HE
Not first in HE
Don't know 149 28.6% 094 30.0% 055 27.1% 035 23.6% 112 31.4%
<21,000 148 28.4% 102 32.6% 043 21.2% 055 37.2% 089 24.9% 21,000-30,000
139 26.7% 077 24.6% 060 29.6% 041 27.7% 091 25.5%
>30,000 085 16.3% 040 12.8% 045 22.2% 017 11.5% 065 18.2%
Total 521
313
203
148
357
Table A2.3: Expected earnings according to type of institution applied to
Overall Pre-1992 HEI
(of which) Russell Group
Post-1992 HEI
Don't know 149 28.6% 95 27.6% 76 28.6% 39 31.5%
<21,000 148 28.4% 100 29.1% 78 29.3% 34 27.4%
21,000-30,000 139 26.7% 92 26.7% 68 25.6% 35 28.2%
>30,000 85 16.3% 57 16.6% 44 16.5% 16 12.9%
Total 521
344
266
124

37
Table A2.4: Expected earning according to POLAR 2 quintiles (adult higher education participation in an area)
Quintile 1 Quintile 2 Quintile 3 Quintile 4 Quinti le 5
Don't know 3 18.8% 12 25.0% 24 28.6% 49 28.3% 41 29.5%
<21,000 2 12.5% 17 35.4% 25 29.8% 49 28.3% 38 27.3% 21,000-30,000
6 37.5% 14 29.2% 21 25.0% 49 28.3% 33 23.7%
>30,000 5 31.3% 5 10.4% 14 16.7% 26 15.0% 27 19.4%
16
48
84
173
139
2. Expected debts
Table A2.5 Responses to ‘How much do you expect to owe by the time you have completed the course for which you are applying now (including through Student Loans and from other lenders)?’
Respondents Share
£0 – £5,000 41 7.9%
£5,001 – £10,000 12 2.3%
£10,001 – £15,000 11 2.1%
£15,001 – £20,000 16 3.1%
£20,001 – £25,000 26 5.0%
£25,001 – £30,000 59 11.3%
£30,001 – £35,000 50 9.6%
£35,001 – £40,000 75 14.4%
£40,001 – £45,000 45 8.6%
£45,001 – £50,000 33 6.3%
>£50,000 45 8.6%
don't know/have not thought about this 108 20.7%
Total 521 100.0%
Table A2.6: Debt expectations according to gender, 1st in family in higher education
Overall Female Male First in HE Not first in HE
Don't know 108 20.7% 72 23.1% 36 17.6% 24 16.2% 82 23.0%
<25,000 106 20.3% 67 21.5% 36 17.6% 29 19.6% 70 19.6% 25,000-40,000
184 35.3% 101 32.4% 83 40.7% 54 36.5% 129 36.1%
>40,000 123 23.6% 72 23.1% 49 24.0% 41 27.7% 76 21.3%
Total 521
312
204
148
357

38
Table A2.7: Debt expectations according to type of institution applied to
Overall Pre-1992 HE (of which)
Russell Group Post-1992 HEI
Don't know 108 20.7% 63 18.4% 49 18.4% 33 26.6%
<25,000 106 20.3% 58 16.9% 42 15.8% 28 22.6% 25,000-40,000
184 35.3% 129 37.6% 99 37.2% 44 35.5%
>40,000 123 23.6% 93 27.1% 76 28.6% 19 15.3%
Total 521
343
266
124
3. Concern about debt
Table A2.8: Responses to ‘How concerned are you about owing money after your studies in higher education?’
Responses Share
hardly at all 125 24.04%
slightly concerned 185 35.58%
concerned 117 22.50%
very concerned 93 17.88%
Total 520
Table A2.9: Expected debt levels and concern about debt
Expected debt level
Concerned about debt
Not concerned about debt
Don't know 39 36.4% 68 63.6%
<25,000 29 28.2% 74 71.8%
25,000-40,000 82 45.3% 99 54.7%
>40,000 58 47.5% 64 52.5%
Total 208 40.5% 305 59.5%
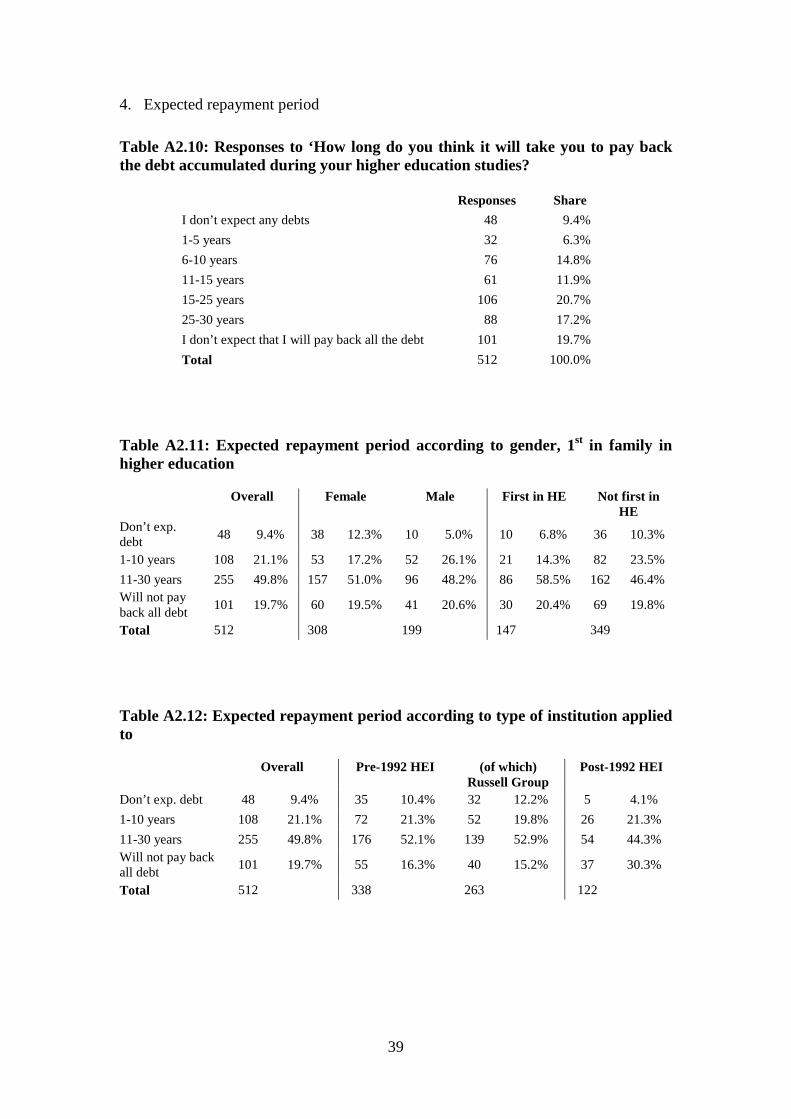
39
4. Expected repayment period
Table A2.10: Responses to ‘How long do you think it will take you to pay back the debt accumulated during your higher education studies?
Responses Share
I don’t expect any debts 48 9.4%
1-5 years 32 6.3%
6-10 years 76 14.8%
11-15 years 61 11.9%
15-25 years 106 20.7%
25-30 years 88 17.2%
I don’t expect that I will pay back all the debt 101 19.7%
Total 512 100.0%
Table A2.11: Expected repayment period according to gender, 1st in family in higher education
Overall Female Male First in HE Not first in HE
Don’t exp. debt
48 9.4% 38 12.3% 10 5.0% 10 6.8% 36 10.3%
1-10 years 108 21.1% 53 17.2% 52 26.1% 21 14.3% 82 23.5%
11-30 years 255 49.8% 157 51.0% 96 48.2% 86 58.5% 162 46.4% Will not pay back all debt
101 19.7% 60 19.5% 41 20.6% 30 20.4% 69 19.8%
Total 512
308
199
147
349
Table A2.12: Expected repayment period according to type of institution applied to
Overall Pre-1992 HEI (of which)
Russell Group Post-1992 HEI
Don’t exp. debt 48 9.4% 35 10.4% 32 12.2% 5 4.1%
1-10 years 108 21.1% 72 21.3% 52 19.8% 26 21.3%
11-30 years 255 49.8% 176 52.1% 139 52.9% 54 44.3% Will not pay back all debt
101 19.7% 55 16.3% 40 15.2% 37 30.3%
Total 512
338
263
122

40
Table A2.13: Expected repayment period and concern about debt
Expected repayment period Concerned about debt Not concerned about debt
Don’t exp. debt 10 21.7% 36 78.3%
1-10 years 33 30.8% 74 69.2%
11-30 years 118 46.8% 134 53.2%
Will not pay back all debt 44 43.6% 57 56.4%
Total 205 40.5% 301 59.5%
Table A2.14: Expected repayment period and expected levels of debt
Expected debt Expected repayment period Don’t know <£25,000 £25-40,000 >£40,000
Don’t exp. debt 17 16.5% 28 26.7% 1 0.6% 1 0.8%
1-10 years 24 23.3% 35 33.3% 36 20.0% 13 10.7%
11-30 years 44 42.7% 34 32.4% 100 55.6% 77 63.1%
Will not pay back all debt 18 17.5% 8 7.6% 43 23.9% 31 25.4%
Total 103
105
180
122
5. Sources of information
Table A2.15: Responses to ‘Where have you looked for information and/or advice on the cost of studying for a degree (Select all that apply)?’
Mentions Share of respondents
UCAS 381 72.57%
University open days 267 50.86%
Teachers or tutors at school 251 47.81%
Universities’ own publications/www site 234 44.57%
Parents/carers 197 37.52%
Student Loans Company 179 34.10% From friends/family who are now or have recently been at
university 100 19.05%
University directories, league tables or comparison www sites 83 15.81%
Other family or friends 74 14.10%
Bank/building society 35 6.67%
Careers fairs 35 6.67% Independent financial advice (e.g. www sites such as
moneysavingexpert.com) 32 6.10%
Other (please specify) 12 2.29%
OFFA 1 0.19%
Total 1881 525

41
Appendix 3: Factor analysis
1. Method
Questions 10, 17, 24 and 26 elicit a series of Likert scale responses. We conducted an
exploratory common factor analysis on each of these questions to find out if there was
a small number of underlying themes or latent variables driving the responses. To
choose the number of factors included, we applied a number of criteria. Firstly, we
look at a scree plot of the eigenvalues of the factor analysis (which indicate the
amount of variance in the scores given to the questions explained by each factor, in
descending order). Typically, factors are included if they are before a point in the
scree plot where there is a discrete drop in eigenvalues, followed by a levelling off. In
most cases, this did not produce a clear idea of where the cut-off was, so we generally
relied on a more rigorous procedure called a parallel analysis. This produces a random
dataset with the same numbers of observations and variables as the original data. A
correlation matrix is computed from the randomly generated dataset. When the
eigenvalues from the random dataset correlation matrix are larger than the eigenvalues
from the factor analysis, the factors are no better than random noise.
Once a set of factors was found by these computational methods, the final
criteria applied was that each factor should have a meaningful interpretation. Factors
which most heavily related to two or more seemingly unrelated issues are excluded
from our subsequent analysis.
2. Factors influencing decision to apply
Question 10 consisted of 13 items about the importance of different considerations in
the decision to apply to a higher education institution. The parallel analysis indicated
there are five underlying factors (see Figure A3.1), with the first factor explaining
73% of the total variance in responses.
3. Factors influencing institution choice
Question 17 consisted of fifteen items about the importance of different motivations
in the choice of which higher education institutions to apply to. The parallel analysis
indicated there are five underlying factors (see Figure A3.2), with the first factor
explaining 77% of the total variance in responses.

42
Figure A3.1: Eigenvalues of factors underlying the decision to apply to higher education
Figure A3.2: Eigenvalues of factors underlying the decision where to apply
-0.5
0
0.5
1
1.5
2
2.5
3
3.5
0 2 4 6 8 10 12 14
Eig
enva
lue
Factors
Eigenvalue
Parallel Analysis
-0.5
0
0.5
1
1.5
2
2.5
3
3.5
0 2 4 6 8 10 12 14 16
Eig
enva
lue
Factor
Eigenvalue
Parallel Analysis

43
Table A3.1: Factors influencing the decision where to apply
Question Factor 1 Factor 2 Factor 3 Factor 4 Factor 5
Content of course 0.0234 0.1602 -0.0365 0.5252 -0.0253
Facilities for study 0.1793 0.2511 -0.0151 0.5408 0.0707
Reputation of institution -0.0059 0.5156 0.0829 0.1705 0.0456
Professional accreditation of course 0.2215 0.6265 0.0287 0.1245 0.0765
Success of graduates in getting jobs 0.1902 0.6115 0.0246 0.116 0.0511
Social life 0.1709 0.3902 0.1242 0.0325 0.4493
Sports facilities 0.3519 0.2104 0.1769 0.0784 0.337
Wanted to live at home 0.2264 0.0221 0.3322 0.0188 -0.275
Wanted to go away from home 0.2602 0.0235 -0.0086 0.0249 0.4365
Its where my friends are going 0.3142 0.0984 0.5179 -0.0887 0.1178
Its where my family/friends have gone in the past
0.1955 0.0239 0.5274 0.0103 0.0275
High level of fees 0.6041 0.2633 0.211 0.0718 0.1785
Low level of fees 0.4876 0.0702 0.286 0.1262 -0.0088
Bursaries/scholarships available 0.5277 0.2233 0.1336 0.1737 0.067
Recommendations of teacher(s) family member(s) friend(s)
0.4516 0.1499 0.1156 -0.0595 0.081
Factor name Cost Institution
quality Peers
Course quality
Social life
Notes: Principal factor analysis; varimax rotation
4. Factor influencing decision not to apply
Question 24 contained 13 items about the importance of different motivations for
those who decided not to apply to higher education. The parallel analysis indicated
there are five underlying factors (see Figure A3.3, which also clearly shows a discrete
drop-off in eigenvalues at this point). Table A3.2 shows the factor loadings for these
factors. Financial motivations are once again the most important factor – in this case,
it is the prospect of lost earnings that is most strongly motivating the decision not to
apply to higher education. Second to that is the ability to find employment and follow
a career path without a higher education qualification. The third factor relates to the
attitudes of family and friends, which are the opposite of the social norm reasons
given by those who had decided to go to university.

44
Figure A3.3: Eigenvalues of factors underlying the decision not to apply
Table A3.2: Factors influencing the decision not to apply
Factor 1 Factor 2 Factor 3 Factor 4 Factor 5
I am not interested in further study 0.3000 -0.0114 0.1555 -0.0614 0.1314
I want to find a job straight away 0.7609 0.2606 0.0555 0.0374 0.0034
I want to do an apprenticeship 0.1103 0.0709 0.1497 0.1584 0.5091
I want to earn money 0.7261 0.0432 0.1389 0.0350 0.1505
I don’t think I would fit in at university or college
-0.0442 -0.0384 0.2196 0.3996 0.1866
No-one in my family has ever been to university before
0.1135 0.1463 0.1647 0.4461 0.1031
I don’t want to get into debt 0.1086 -0.0165 0.0632 0.4958 0.0490
I cannot combine further study with my family commitments
0.3089 0.2135 0.0546 0.0469 0.4371
My intended career does not require a further qualification
0.2726 0.6005 0.0596 -0.0679 0.253
A further qualification will not help me to get a job with higher earnings
0.3703 0.5642 0.1064 0.1810 -0.0753
None of my friends are going to university or college
0.1783 0.0926 0.6306 0.0614 0.2186
It’s not what my family/friends/ teachers expect me to do
0.1340 0.0963 0.5402 0.1828 -0.1173
I have got an offer of a job so I want to take it up while I can
0.0461 0.4035 0.3522 -0.0828 -0.0359
Factor name Lost
earnings Career
Negative social
Negative perceptions
Apprenticeship
Notes: Principal factor analysis; varimax rotation
-1
-0.5
0
0.5
1
1.5
2
2.5
3
0 2 4 6 8 10 12 14
Eig
enva
lue
Factor
Eigenvalue
Parallel Analysis

45
5. Sources of information when deciding to apply
Question 26 asked ten questions about the importance of sources of information for
students as they decide whether or not to apply to higher education. The parallel
analysis indicated there are four underlying factors (see Figure A3.4). The first factor
explains 83% of the total variance in responses. Table A3.3 shows the loadings for
these four factors. The two most important factors are those linked to formal
information sources (such as UCAS, university websites and open days) and informal
sources (such as parents or friends). A third factor loads onto information from OFFA
and careers fairs – there is not an obvious interpretation here. Information from
teachers is the fourth factor.
Table A3.3: Factors influencing the use of sources of information
Notes: Principal factor analysis; varimax rotation
Figure A3.4: Eigenvalues of factors underlying the data regarding sources of information
-0.5
0
0.5
1
1.5
2
2.5
0 2 4 6 8 10 12
Eig
enva
lue
Factor
Eigenvalue
Parallel Analysis
Factor 1 Factor 2 Factor 3 Factor 4
UCAS 0.5419 -0.0490 -0.0293 0.3328
Teachers or tutors at school 0.2347 0.2267 0.0083 0.3927 University directories league tables or
comparison www sites 0.6692 0.1334 0.1166 0.0235
OFFA 0.3368 0.2893 0.3730 -0.0701
Universities own publications/www site 0.6615 0.0513 0.0898 -0.0158
Careers fairs 0.3002 0.2313 0.4029 0.0557
University open days 0.5617 -0.0485 0.1283 0.1974 Friends/family who are now or have recently
been at university 0.1313 0.5179 0.0752 0.0410
Parents/carers -0.0506 0.5473 0.0337 0.0662
Other family or friends 0.0513 0.5873 0.1447 0.0059
Factor name Formal Informal Careers Teachers