skin inflammation copyright © 2018 ror -expressing t
TRANSCRIPT

Malhotra et al., Sci. Immunol. 3, eaao6923 (2018) 2 March 2018
S C I E N C E I M M U N O L O G Y | R E S E A R C H A R T I C L E
1 of 12
S K I N I N F L A M M A T I O N
ROR-expressing T regulatory cells restrain allergic skin inflammationNidhi Malhotra,1*†‡ Juan Manuel Leyva-Castillo,1*‡ Unmesh Jadhav,2,3 Olga Barreiro,4 Christy Kam,1 Nicholas K. O’Neill,2,3 Francoise Meylan,5 Pierre Chambon,6 Ulrich H. von Andrian,4 Richard M. Siegel,5 Eddie C. Wang,7 Ramesh Shivdasani,2,3 Raif S. Geha1‡
Atopic dermatitis is an allergic inflammatory skin disease characterized by the production of the type 2 cytokines in the skin by type 2 innate lymphoid cells (ILC2s) and T helper 2 (TH2) cells, and tissue eosinophilia. Using two distinct mouse models of atopic dermatitis, we show that expression of retinoid-related orphan receptor (ROR) in skin- resident T regulatory cells (Tregs) is important for restraining allergic skin inflammation. In both models, targeted deletion of ROR in mouse Tregs led to exaggerated eosinophilia driven by interleukin-5 (IL-5) production by ILC2s and TH2 cells. Expression of ROR in skin-resident Tregs suppressed IL-4 expression and enhanced expression of death receptor 3 (DR3), which is the receptor for tumor necrosis factor (TNF) family cytokine, TNF ligand–related molecule 1 (TL1A), which promotes Treg functions. DR3 is expressed on both ILC2s and skin-resident Tregs. Upon deletion of ROR in skin-resident Tregs, we found that Tregs were no longer able to sequester TL1A, resulting in enhanced ILC2 activation. We also documented higher expression of ROR in skin-resident Tregs than in peripheral blood circulating Tregs in humans, suggesting that ROR and the TL1A-DR3 circuit could be therapeutically targeted in atopic dermatitis.
INTRODUCTIONAtopic dermatitis (AD) is the most common skin inflammatory dis-ease affecting ~17% of children in developed nations (1). AD lesions are characterized by the presence of activated T helper 2 (TH2) cells, as well as by the expansion of type 2 innate lymphoid cells (ILC2s) (2–4). Both TH2 cells and ILC2s may contribute to allergic skin inflammation in AD. Cutaneous inflammation elicited by topical application of cal-cipotriol (MC903), a low-calcemic analog of vitamin D, has been used as a mouse model of acute AD (5, 6). Allergic inflammation in this model is accompanied by expansion of ILC2s driven by epithelial cyto-kines (2, 4). More importantly, it is dependent on ILC2s; it is preserved in Rag1−/− mice and is severely attenuated in Tslpr−/− mice, ILC- depleted Rag1−/− mice, and ILC2-deficient Rorasg/sg/wild-type (WT) bone marrow chimeras (2, 4). Cutaneous inflammation elicited by re-peated epicutaneous (EC) application of ovalbumin (OVA) or peanut extract to tape-stripped mouse skin provides an antigen-driven mouse model of acute AD (7–9). Allergic inflammation in this model is de-pendent on T cells, because it is abolished in Rag2−/− mice (9, 10).
CD4+FOXP3+ T regulatory cells (Tregs) constitute a substantial sub-set of immune cells residing in murine and human skin (11). Lack of Tregs in humans and mice results in immune dysregulation associated with allergic skin inflammation (12, 13). Treg numbers are unaltered in AD skin lesions (14). Thus, the role of skin-resident Tregs in controlling
allergic skin inflammation is unclear. Here, we have dissected the mo-lecular architecture of skin-resident Tregs and identified retinoid-related orphan receptor (ROR) as a regulator of genes in Tregs responsible for suppressing allergic skin inflammation.
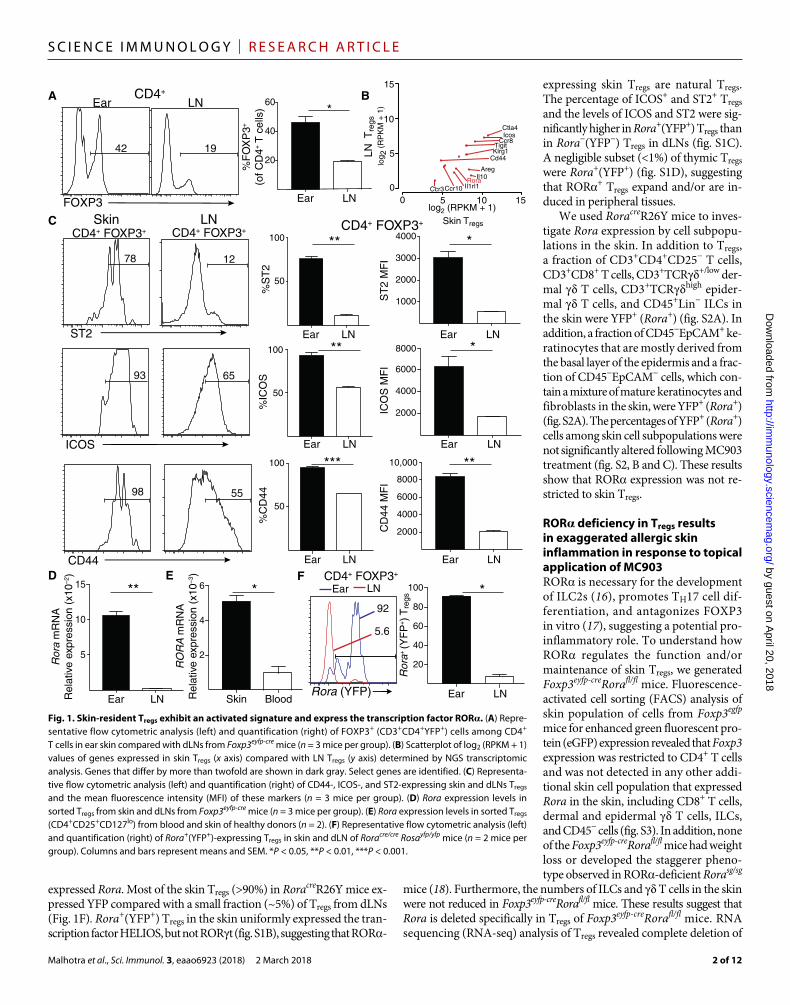
RESULTSSkin-resident Tregs exhibit an activated signature and express the transcription factor RORSpecialization of tissue-resident Tregs is an important factor in main-taining tissue homeostasis and modulating local immune responses. To investigate whether skin-resident Tregs exhibit a specialized phe-notype, we compared the phenotype of skin-resident Tregs and Tregs in skin-draining lymph node (dLN). About 45% of CD4+ T cells in ear skin expressed FOXP3 compared with ~20% of CD4+ T cells in dLNs (Fig. 1A). Skin Tregs localized around dermal blood vessels and interfollicular areas (fig. S1A). We compared the transcriptome of CD3+CD4+YFP+ Tregs from the skin and dLN of Foxp3eyfp-cre mice. Skin Tregs differed from dLN Tregs by more than 5000 genes [fold change > 2; false discovery rate (FDR) < 0.05]. Skin Tregs were enriched for the ex-pression of genes encoding signaling receptors [Icos and Il1rl1 (ST2)], activation markers (Cd44 and Klrg1), effector molecules (Il10, Ctla4, and Areg), and tissue-homing receptors (Ccr3, Ccr8, and Ccr10) (Fig. 1B). Flow cytometry demonstrated that the percentage of T cells that ex-pressed ST2, ICOS, and CD44 and the expression levels of these mark-ers were significantly higher in skin Tregs than in dLN Tregs (Fig. 1C). Rora, the gene encoding the transcriptional regulator ROR, was high-ly up-regulated in skin Tregs (Fig. 1B). This was confirmed by quantita-tive polymerase chain reaction (qPCR) (Fig. 1D). RORA expression was significantly higher in CD4+CD25+CD127lo skin Tregs than in cir-culating Tregs in humans (Fig. 1E). Human skin Tregs, similar to mouse skin Tregs, display an activated signature with increased expression of ICOS, CTLA4, and CD44 (15).
To examine and map the fate of ROR-expressing Tregs, we bred Roracre mice to Rosa26Yfp (R26Y) mice. In RoracreR26Y mice, yellow fluorescent protein (YFP) marks cells that are expressing or previously
1Division of Immunology, Boston Children’s Hospital, Harvard Medical School, Boston, MA 02115, USA. 2Department of Medical Oncology and Center for Functional Cancer Epigenetics, Dana-Farber Cancer Institute, Boston, MA 02115, USA. 3Department of Medicine, Harvard Medical School, Boston, MA 02115, USA. 4Department of Microbi-ology and Immunobiology and Center for Immune Imaging, Harvard Medical School, Boston, MA 02115, USA. 5Immunoregulation Section, Autoimmunity Branch, National Institute of Arthritis and Musculoskeletal and Skin Diseases, National Institutes of Health, Bethesda, MD 20892, USA. 6Institut de Génétique et de Biologie Moléculaire et Cellu-laire (CNRS UMR7104, INSERM U964), Illkirch 67404, France. 7Department of Microbial Microbiology and Infectious Diseases, School of Medicine, Cardiff University, Cardiff, UK.*These authors contributed equally to this work.†Present address: Elstar Therapeutics, 840 Memorial Drive, Cambridge, MA 02139, USA.‡Corresponding author. Email: [email protected] (N.M.); [email protected] (J.M.L.-C.); [email protected] (R.S.G.)
Copyright © 2018 The Authors, some rights reserved; exclusive licensee American Association for the Advancement of Science. No claim to original U.S. Government Works
by guest on April 20, 2018
http://imm
unology.sciencemag.org/
Dow
nloaded from
Malhotra et al., Sci. Immunol. 3, eaao6923 (2018) 2 March 2018
S C I E N C E I M M U N O L O G Y | R E S E A R C H A R T I C L E
2 of 12
expressed Rora. Most of the skin Tregs (>90%) in RoracreR26Y mice ex-pressed YFP compared with a small fraction (~5%) of Tregs from dLNs (Fig. 1F). Rora+(YFP+) Tregs in the skin uniformly expressed the tran-scription factor HELIOS, but not RORt (fig. S1B), suggesting that ROR-
expressing skin Tregs are natural Tregs. The percentage of ICOS+ and ST2+ Tregs and the levels of ICOS and ST2 were sig-nificantly higher in Rora+(YFP+) Tregs than in Rora−(YFP−) Tregs in dLNs (fig. S1C). A negligible subset (<1%) of thymic Tregs were Rora+(YFP+) (fig. S1D), suggesting that ROR+ Tregs expand and/or are in-duced in peripheral tissues.
We used RoracreR26Y mice to inves-tigate Rora expression by cell subpopu-lations in the skin. In addition to Tregs, a fraction of CD3+CD4+CD25− T cells, CD3+CD8+ T cells, CD3+TCR+/low der-mal T cells, CD3+TCRhigh epider-mal T cells, and CD45+Lin− ILCs in the skin were YFP+ (Rora+) (fig. S2A). In addition, a fraction of CD45−EpCAM+ ke-ratinocytes that are mostly derived from the basal layer of the epidermis and a frac-tion of CD45−EpCAM− cells, which con-tain a mixture of mature keratinocytes and fibroblasts in the skin, were YFP+ (Rora+) (fig. S2A). The percentages of YFP+ (Rora+) cells among skin cell subpopulations were not significantly altered following MC903 treatment (fig. S2, B and C). These results show that ROR expression was not re-stricted to skin Tregs.
ROR deficiency in Tregs results in exaggerated allergic skin inflammation in response to topical application of MC903ROR is necessary for the development of ILC2s (16), promotes TH17 cell dif-ferentiation, and antagonizes FOXP3 in vitro (17), suggesting a potential pro-inflammatory role. To understand how ROR regulates the function and/or maintenance of skin Tregs, we generated Foxp3eyfp-creRorafl/fl mice. Fluorescence- activated cell sorting (FACS) analysis of skin population of cells from Foxp3egfp mice for enhanced green fluorescent pro-tein (eGFP) expression revealed that Foxp3 expression was restricted to CD4+ T cells and was not detected in any other addi-tional skin cell population that expressed Rora in the skin, including CD8+ T cells, dermal and epidermal T cells, ILCs, and CD45− cells (fig. S3). In addition, none of the Foxp3eyfp-creRorafl/fl mice had weight loss or developed the staggerer pheno-type observed in ROR-deficient Rorasg/sg
mice (18). Furthermore, the numbers of ILCs and T cells in the skin were not reduced in Foxp3eyfp-creRorafl/fl mice. These results suggest that Rora is deleted specifically in Tregs of Foxp3eyfp-creRorafl/fl mice. RNA sequencing (RNA-seq) analysis of Tregs revealed complete deletion of
19
93
78
98
42
55
12
65
FOXP3
Ear LN
Skin LN
ST2
ICOS
CD44
Rora (YFP)
D E F
2
4
6 *
20
40
60
80
100
5.6
92
Ear LN *CD4+ FOXP3+
2000
4000
6000
8000
10,000
1000
2000
3000
4000
2000
4000
6000
8000
A B
C
20
40
60
***
**
*
**
*
*CD4+
100
50
100
50
100
50
**
5
10
15 **
log2 (RPKM + 1)5 10 150
5
10
15
0
Icos
RoraIl1rl1
Il10Areg
Cd44
Tigit
LN T
regs
Skin Tregs
log 2
(R
PK
M +
1)
Ctla4
Ccr10Ccr3
Klrg1
Ccr8
Ear LN
Ear LN Ear LN
Ear LN Ear LN
Ear LN Ear LN
Ear LN Skin Blood Ear LN
%F
OX
P3+
(of C
D4+
T c
ells
)
CD4+ FOXP3+ CD4+ FOXP3+ CD4+ FOXP3+
%S
T2
%IC
OS
%C
D44
ST
2 M
FI
ICO
S M
FI
CD
44 M
FI
Ror
a m
RN
AR
elat
ive
expr
essi
on (
x10–2
)
RO
RA
mR
NA
Rel
ativ
e ex
pres
sion
(x1
0–3)
Ror
a+ (Y
FP
+) T
regs
Fig. 1. Skin-resident Tregs exhibit an activated signature and express the transcription factor ROR. (A) Repre-sentative flow cytometric analysis (left) and quantification (right) of FOXP3+ (CD3+CD4+YFP+) cells among CD4+ T cells in ear skin compared with dLNs from Foxp3eyfp-cre mice (n = 3 mice per group). (B) Scatterplot of log2 (RPKM + 1) values of genes expressed in skin Tregs (x axis) compared with LN Tregs (y axis) determined by NGS transcriptomic analysis. Genes that differ by more than twofold are shown in dark gray. Select genes are identified. (C) Representa-tive flow cytometric analysis (left) and quantification (right) of CD44-, ICOS-, and ST2-expressing skin and dLNs Tregs and the mean fluorescence intensity (MFI) of these markers (n = 3 mice per group). (D) Rora expression levels in sorted Tregs from skin and dLNs from Foxp3eyfp-cre mice (n = 3 mice per group). (E) Rora expression levels in sorted Tregs (CD4+CD25+CD127lo) from blood and skin of healthy donors (n = 2). (F) Representative flow cytometric analysis (left) and quantification (right) of Rora+(YFP+)-expressing Tregs in skin and dLN of Roracre/cre Rosayfp/yfp mice (n = 2 mice per group). Columns and bars represent means and SEM. *P < 0.05, **P < 0.01, ***P < 0.001.
by guest on April 20, 2018
http://imm
unology.sciencemag.org/
Dow
nloaded from

Malhotra et al., Sci. Immunol. 3, eaao6923 (2018) 2 March 2018
S C I E N C E I M M U N O L O G Y | R E S E A R C H A R T I C L E
3 of 12
the floxed fourth exon of Rora in these mice (fig. S4A). The numbers of YFP+ Tregs were not altered in the skin or dLNs of these mice (fig. S4B), indicating that ROR is not required for the accumulation or main-tenance of Tregs in the skin. The cytokine interleukin-10 (IL-10) is important for Treg function in the gut and lungs (19). There was an increased percentage of IL-10+ Tregs in Foxp3eyfp-creRorafl/fl mice com-pared with controls (fig. S4C).
Topical application of MC903 to ear skin of WT mice results in increased dermal thickness and infiltration of CD45+ cells that include eosinophils and CD4+ T cells (5). There was an increased ear thickness, accompanied with an intense cellular infiltrate, and significantly in-creased dermal thickness in Foxp3eyfp-creRorafl/fl mice compared with Foxp3eyfp-cre controls (Fig. 2, A to C). FACS analysis revealed a three-fold increase in dermal infiltration by CD45+ cells in Foxp3eyfp-creRorafl/fl mice compared with Foxp3eyfp-cre controls (Fig. 2D). Eosinophils accounted for ~45% of CD45+ cells in the dermis of MC903-treated Foxp3eyfp-creRorafl/fl mice, compared with 15% in controls, yielding an eightfold increase in eosinophil numbers (Fig. 2E). The percentages of basophils (ckit−IgE+), mast cells (ckit+IgE+), neutrophils (CD11b+Gr1hi), T effector cells (Teffs) (CD4+FOXP3−), Tregs (CD4+FOXP3+), and ILCs (Lin−CD90+) infiltrating MC903-treated skin were comparable in Foxp3eyfp-creRorafl/fl mice and controls. Nevertheless, the numbers of these cell populations were two- to threefold higher in Foxp3eyfp-creRorafl/fl mice (Fig. 2, F and G), reflecting the approximately threefold increase in CD45+ cells. MC903-driven allergic inflammation in mice of C56BL/6 background is largely dependent on thymic stromal lympho-poietin (TSLP) (2, 4). The exaggerated cutaneous inflammatory response in Foxp3eyfp-creRorafl/fl mice, which are on a C56BL/6 background, was not due to increased Tslp expression (fig. S5A). Serum immunoglob-ulin E (IgE) levels were higher in MC903-treated Foxp3eyfp-creRorafl/fl mice than in controls (fig. S5B), indicative of a heightened type 2 response.
ROR deficiency in Tregs results in increased expression of eotaxins and IL-5 in MC903-treated skinThe proportion of eosinophils in blood was comparable in MC903- treated Foxp3eyfp-creRorafl/fl mice and controls (fig. S6A), suggesting that the exaggerated eosinophilia in MC903-treated skin of Foxp3eyfp-creRorafl/fl mice resulted from increased eosinophil recruitment. Eotaxins are the major eosinophil chemoattractants (20). There was increased expres-sion of Ccl11 and Ccl24, which encode for eotaxins 1 and 2, in MC903- treated skin of Foxp3eyfp-creRorafl/fl mice compared with controls (Fig. 3A). IL-5 plays a critical role in tissue eosinophilia by synergizing with eotaxins and promoting eosinophil survival in tissues (21, 22). IL-5 levels were significantly higher in MC903-treated skin of Foxp3eyfp-creRorafl/fl mice than of controls (Fig. 3B). IL-4 and IL-13 levels were comparable in the two groups (fig. S6B).
IL-5 is predominantly produced by ILC2s and by a subset of acti-vated TH2 cells (23). ILC2s exist as preactivated resident sentinels in the dermis that rapidly release IL-5 and IL-13 upon stimulation (21). In contrast, TH2 cells are recruited to the skin at a later stage of allergic inflammation. MC903 treatment up-regulated IL-33/ST2 and CD69 expression, down-regulated CD25 expression, and had negligible ef-fect on KLRG1 expression on skin Lin−CD90+ ILCs, but the changes were comparable in Foxp3eyfp-creRorafl/fl mice and Foxp3eyfp-cre controls. However, in Il5, mRNA levels were significantly increased in ILCs from MC903-treated skin of Foxp3eyfp-creRorafl/fl mice compared with controls (Fig. 3C). There was also a twofold increase in Il4 and Il13 mRNA levels in ILCs from MC903-treated skin of Foxp3eyfp-creRorafl/fl
mice; however, it did not reach statistical significance (fig. S6C). There was a significant increase in CD4+FOXP3−IL-5+, but not CD4+IL-13+ or CD4+IL-4+, Teffs in Foxp3eyfp-creRorafl/fl mice compared with con-trols (Fig. 3D). The chemokine CCL8 is up-regulated in AD skin le-sions (24) and is critical for the recruitment of CCR8-expressing IL-5+ TH2 cells to the skin in a mouse model of AD (24). Ccl8 expression was strongly increased in MC903-treated skin of Foxp3eyfp-creRorafl/fl mice (Fig. 3E). In contrast, Ccl17, Ccl22, Ccl4, and Ccl5 expression was comparable in Foxp3eyfp-creRorafl/fl mice and controls (fig. S6D). Cxcl1, Ccl2, and Ccl7 expression demonstrated a trend toward an increase in MC903-treated skin of Foxp3eyfp-creRorafl/fl mice, which could underlie the increased influx of myeloid cells in these mice (Fig. 2F).
ROR deficiency in Tregs alters the expression of genes involved in Treg cell migration and function and skews Tregs to IL-4–producing effectorsTo gain an understanding of how ROR regulates the function of skin Tregs, we performed next-generation sequencing (NGS) transcriptomic analysis on Tregs isolated from untreated and MC903-treated skin of Foxp3eyfp-creRorafl/fl mice and Foxp3eyfp-cre controls (table S1 and fig. S7). We observed a change in ~1700 genes across the four groups exam-ined (fold change > 2; FDR < 0.05) (Fig. 4A). Expression of the central circadian rhythm genes Nr1d1 and Nr1d2 was decreased in skin Tregs from Foxp3eyfp-creRorafl/fl mice compared with controls, consistent with the role of ROR as a circadian rhythm regulator (25). Genes involved in signaling via transforming growth factor– (TGF) (Smad3), tumor necrosis factor– (TNF) (Tnfa), nuclear factor B (NF-B) (Irak4 and Tirap), and mitogen-activated protein kinase (MAPK) (Fos and Jun) and in cell adhesion (Icam2 and Itga4) were comparably ex-pressed in Tregs from untreated skin of Foxp3eyfp-creRorafl/fl mice and Foxp3eyfp-cre controls and underwent comparable changes after MC903 treatment. Genes in the phosphatidylinositol 3-kinase (PI3K)/AKT pathway were down-regulated in ROR-deficient skin Tregs. Dysregu-lated PI3K/AKT signaling affects Foxp3 and Il2ra expression in Tregs and increases their conversion to TH1 cells (26). We did not observe any effect on Foxp3, Il2ra, or Ifng expression in our transcriptomic and flow cytometric analyses of skin Tregs from Foxp3eyfp-creRorafl/fl mice. Several genes encoding chemokines and chemokine receptors (Ccl2, Ccr3, and Ccr5) were up-regulated upon allergic skin inflammation in all mice, but to greater extent in Foxp3eyfp-creRorafl/fl mice. Up-regulation of these genes is consistent with the increased numbers, and higher velocity, of Tregs in MC903-treated skin of Foxp3egfp mice (Fig. 2G; fig. S8, A and B; and movies S1 and S2). Furthermore, Tregs in MC903- treated skin showed less directed movement (fig. S8C). Expression of Ccr6 and CCR6, thought to be important for migration of Tregs into neonatal skin (27), was strongly decreased in skin Tregs from Foxp3eyfp-creRorafl/fl mice compared with controls both before and after MC903 treatment (Fig. 4, A to C). However, the numbers of skin Tregs in Foxp3eyfp-creRorafl/fl mice were not reduced (Fig. 3G).
Treg suppressive activity is mediated in part by the nucleotides ade-nosine and cyclic adenosine 3′,5′-monophosphate (cAMP) (28). Tregs from untreated and MC903-treated skin showed strongly decreased expression of Nt5e, which encodes the 5′ ectonucleotidase CD73 that metabolizes AMP to adenosine (28), and reduced surface expression of CD73 compared with controls (Fig. 4, B and D), whereas expression of Pde3b, which encodes the phosphodiesterase 3B that breaks down cAMP (29), was increased (Fig. 4B). Expression of Gzmb, which encodes granzyme B that mediates Treg cytotoxic activity, was up-regulated
by guest on April 20, 2018
http://imm
unology.sciencemag.org/
Dow
nloaded from

Malhotra et al., Sci. Immunol. 3, eaao6923 (2018) 2 March 2018
S C I E N C E I M M U N O L O G Y | R E S E A R C H A R T I C L E
4 of 12
(Fig. 4B), indicating that not all genes involved in Treg function were down-regulated in the absence of ROR.
Expression of IL-4 in Tregs inhibits their ability to suppress TH2 cells and ILC2s (30, 31). Il4 levels were elevated in skin Tregs from Foxp3eyfp-creRorafl/fl mice compared with controls (Fig. 4, A and B).
This was confirmed by qPCR (Fig. 4E). Furthermore, the percentage of CD4+Foxp3+ Tregs among IL-4–expressing CD4+ cells in MC903- treated skin was significantly higher in Foxp3eyfp-creRorafl/fl mice than in controls (Fig. 4F). These results suggest that ROR expression prevents the conversion of Tregs into IL-4–producing effectors. The transcription
A
D
E
F G
B C
Fig. 2. ROR deficiency in Tregs results in exaggerated skin inflammation in response to topical application of MC903. (A to G) Quantification of ear thickness at day 7 (A); representative H&E-stained sections (B); quantification of dermal thickness (C); representative FACS analysis (left) and quantification of the percentages (middle) and numbers (right) of CD45+ cells (D), eosinophils (E), mast cells, neutrophils, and basophils (F), and CD4+FOXP3+ Tregs, CD4+FOXP3− Teffs, and ILCs (G) in vehicle or MC903-treated ears of Foxp3eyfp-creRorafl/fl mice and Foxp3eyfp-cre controls. n = 3 to 8 mice per group. Columns and bars represent means and SEM. *P < 0.05, ***P < 0.001.
by guest on April 20, 2018
http://imm
unology.sciencemag.org/
Dow
nloaded from

Malhotra et al., Sci. Immunol. 3, eaao6923 (2018) 2 March 2018
S C I E N C E I M M U N O L O G Y | R E S E A R C H A R T I C L E
5 of 12
factor RUNX1 inhibits Il4 expression in Tregs (32). Runx1 expres-sion was decreased in Tregs from Foxp3eyfp-creRorafl/fl mice (Fig. 5B), suggesting that reduced RUNX1 activity may derepress Il4 expres-sion in ROR- deficient Tregs. Tregs from MC903-treated skin of Foxp3eyfp-creRorafl/fl mice, but not controls, expressed Ccl8 and Ccl24 transcripts (Fig. 4B), suggesting that these Tregs contribute to the exaggerated eosinophil-dominated allergic skin inflammation in Foxp3eyfp-creRorafl/fl mice.
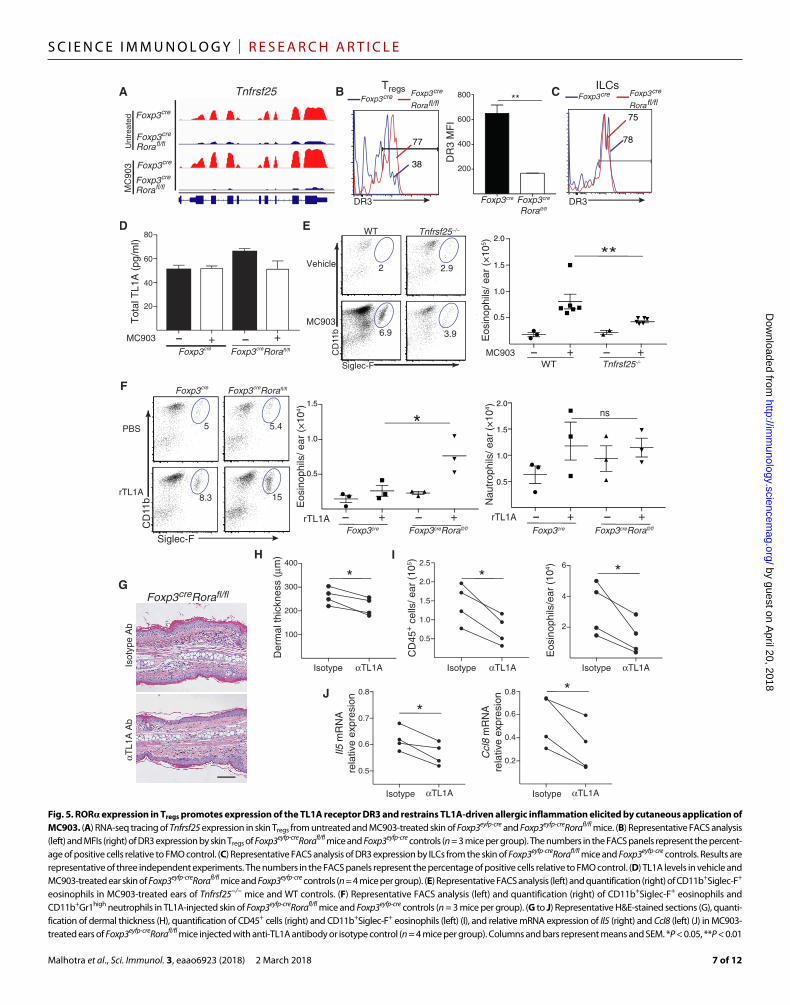
ROR expression in Tregs promotes expression of the TL1A ligand DR3 and restrains TL1A-driven allergic inflammation elicited by cutaneous application of MC903Tnfrsf25 encodes the TNF receptor family member DR3 (death recep-tor 3), which is expressed constitutively on T cells, including Tregs and ILC2s (33, 34). Tnfrsf25 expression, as determined by RNA-seq analy-sis, and DR3 surface expression, as determined by FACS analysis, were both strongly reduced in skin Tregs from Foxp3eyfp-creRorafl/fl mice compared with Foxp3eyfp-cre controls (Figs. 4B and 5, A and B). In contrast, DR3 surface expression by skin ILC2s was comparable in Foxp3eyfp-creRorafl/fl mice and controls (Fig. 5C). The DR3 ligand TL1A is released by endothelial and myeloid cells. TL1A synergizes with the epithelial cytokines IL-33, IL-7, and IL-25 to enhance IL-5 expression in human and murine ILC2s and to promote allergic inflammation (33, 35, 36). TL1A also acts on Tregs to increase their proliferation and their ability to suppress allergic airway inflammation (34). Skin TL1A levels were not altered after MC903 treatment and were comparable in Foxp3eyfp-creRorafl/fl mice and Foxp3eyfp-cre controls (Fig. 5D). Given this finding, we tested the hypothesis that selective down-regulation of the TL1A receptor DR3 on Tregs from skin of Foxp3eyfp-creRorafl/fl mice may play an important role in the exaggerated MC903-driven allergic inflammation observed in these mice. MC903-mediated eosinophilia was attenuated in Tnfrsf25−/− mice (Fig. 5E), demonstrating a role for TL1A in MC903-driven allergic skin inflammation. Intradermal in-
jection of TL1A into ear skin resulted in a significant increase in the percentage and numbers of eosinophils, but not neutrophils, in Foxp3eyfp-creRorafl/fl mice compared with controls (Fig. 6F). More im-portantly, local TL1A blockade during MC903 treatment by intrader-mal injection of neutralizing antibody to TL1A significantly reduced MC903-driven allergic skin inflammation in Foxp3eyfp-creRorafl/fl mice. This was evidenced by a significant decrease in dermal thickness, infil-tration by CD45+ cells and eosinophils, and expression of Il5 and Ccl8 compared with isotype control antibody–treated mice (Fig. 6, G to J). These results suggest that ROR expression in Tregs restrains TL1A- mediated allergic skin inflammation and eosinophilia elicited by cuta-neous application of MC903.
ROR deficiency in Tregs results in exaggerated skin inflammation in response to EC sensitizationTo investigate whether ROR deficiency in Tregs plays a role in re-straining antigen-driven T cell–dependent allergic skin inflammation, we subjected Foxp3eyfp-creRorafl/fl mice and Foxp3eyfp-cre controls to EC sensitization. EC sensitization was elicited by repeated application of the antigen OVA to tape-stripped skin, as illustrated in Fig. 6A. Skin inflammation in this model shares many characteristics of acute AD skin lesions, including epidermal thickening, dermal infiltration by CD45+ cells (including eosinophils), and increased expression of type 2 cytokines (8, 9). Foxp3eyfp-creRorafl/fl mice EC sensitized with OVA exhibited significantly increased epidermal thickness and significantly increased infiltration by CD45+ cells compared with Foxp3eyfp-cre con-trols EC sensitized with OVA (Fig. 6, B to D). Furthermore, the num-bers of all cell populations analyzed, including eosinophils, basophils, neutrophils, mast cells, CD4+Foxp3− T cells, Tregs, and ILCs, were two- to fourfold higher in OVA-sensitized skin of Foxp3eyfp-creRorafl/fl mice compared with Foxp3eyfp-cre controls (Fig. 6, E and F). Il4, but not Il13, mRNA levels in OVA-sensitized skin were significantly higher in Foxp3eyfp-creRorafl/fl mice than in controls (Fig. 6G). Il5 mRNA was not
A B
200
400
600
800
0.2
0.4
0.6
0.8
1.0
0.05
0.10
0.15
0.20C
***
0.02
0.04
0.06
0.08
0.10* * *
2
4
6
8
5
10
15
IL-4
4D
C
8.59.4
Ens *
IL-5
*D
5
10
15
20
25
2
4
6
IL-13
161560.8
4D
C
4D
C
ns
Ccl
11 m
RN
Are
lativ
e ex
pres
sion
Foxp3cre Foxp3cre
Rorafl/fl
Ccl
24 m
RN
Are
lativ
e ex
pres
sion
Foxp3cre Foxp3cre
Rorafl/fl
Foxp3cre Foxp3cre
Rorafl/fl
IL-5
(pg
/ml)
Il5 m
RN
Are
lativ
e ex
pres
sion
Foxp3cre Foxp3creRorafl/fl Foxp3cre Foxp3creRorafl/fl
% C
D4+
IL-5
+ T
cel
ls
% C
D4+
IL-1
3+ T
cel
ls
Foxp3cre Foxp3cre
Rorafl/fl
Foxp3creFoxp3cre
Rorafl/fl
Foxp3cre Foxp3cre
Rorafl/fl
Foxp3cre Foxp3creRorafl/fl
Foxp3cre Foxp3cre
Rorafl/flFoxp3cre Foxp3cre
Rorafl/fl
% C
D4+
IL-4
+ T
cel
ls
Ccl
8 m
RN
Are
lativ
e ex
pres
sion
Fig. 3. Increased expression of eotaxins and IL-5 in MC903-treated skin of Foxp3eyfp-creRorafl/fl mice. (A to E) Relative Ccl11 and Ccl24 mRNA expression (A); IL-5 levels (B); relative Il5 expres-sion in sorted Lin−CD90+ ILCs (C); representative FACS analysis and quantitation of the percentages of CD4+IL-5+, CD4+IL-13+, and CD4+IL-4+ Teffs (D); and relative Ccl8 mRNA expression in MC903- treated skin of Foxp3eyfp-creRorafl/fl mice and Foxp3eyfp-cre controls (E). n = 4 to 7 mice per group. Columns and bars represent means and SEM. *P < 0.05, ***P < 0.001. ns, not significant.
by guest on April 20, 2018
http://imm
unology.sciencemag.org/
Dow
nloaded from

Malhotra et al., Sci. Immunol. 3, eaao6923 (2018) 2 March 2018
S C I E N C E I M M U N O L O G Y | R E S E A R C H A R T I C L E
6 of 12
Min. Max.
Circadian rhythm- Nr1d1, Nr1d2
Chemokine- Ccl12, Ccl24
NF-κB signaling- Irak4, Tirap
PI3K-AKT signaling- Bcl2, Itgb3
Chemokine receptor-Ccr3, Ccr5
Cytokine-Il4, Il22
TNF signaling- Tnf
Foxp3creFoxp3cre
Rorafl/flFoxp3cre
Rorafl/fl Foxp3cre
MC903Untreated
Cell adhesion- Icam2, Itga4
TGFβ signaling- Smad3
Chemokine receptor- Ccr6, Cxcr6
MAPK signaling- Fos, Jun
Min. Max.
Ccr6
Ccr3
Tnfrsf25
Nt5e
Pde3b
Lrrc32
Gzmb
Runx1
Il4
Ccl8
Ccl24
Foxp3creFoxp3cre
Rorafl/flFoxp3cre
Rorafl/fl Foxp3cre
MC903Untreated
Migration
Function
Inflamm
ation
24
83
CCR6
Foxp3cre
Foxp3creRorafl/fl
C
D
IL-4
4D
C
F
FOXP3
09D
C
10
20
30
40
50 **11 12
3812
E
*
0.001
0.002
0.003
0.004
Il4 m
RN
Are
lativ
e ex
pres
sion
Ccr6
Foxp3cre
Rora fl/fl
Foxp3cre
Rorafl/fl
Foxp3cre
Foxp3cre
MC
903
Unt
reat
ed
250
500
CC
R6
MF
I
**
26
73
CD73
Foxp3cre
Foxp3creRorafl/fl Nt5e
Foxp3cre
Rora fl/fl
Foxp3cre
Rora fl/fl
Foxp3cre
Foxp3cre
MC
903
Unt
reat
ed
1250
2500C
D73
MF
I***
A B
%T
regs
of C
D4+
IL-4
+ T
cel
ls
Foxp3cre Foxp3cre
Rorafl/fl
Foxp3cre Foxp3cre
Rorafl/fl
Foxp3cre Foxp3cre
Rorafl/fl
CD4+
Foxp3cre Foxp3cre
Rorafl/fl
CD4+IL-4+
Foxp3cre Foxp3creRorafl/fl
Fig. 4. ROR deficiency in Tregs alters the expression of genes involved in Treg cell migration and function and skews Tregs to IL-4–producing effectors. (A) Heat map showing relative expression of genes clustered by K-mean values in skin Tregs of Foxp3eyfp-cre and Foxp3eyfp-creRorafl/fl mice in the steady state and after MC903 treatment (n = 4 to 5 mice per group). (B) Heat map showing the relative expression of select chemotaxis, function, and inflammation genes in skin Tregs from Foxp3eyfp-creRorafl/fl mice and controls (n = 4 to 5 mice per group). (C and D) RNA-seq tracing of Ccr6 and Nt5e expression (left), representative FACS analysis (middle), and MFIs (right) of CCR6 and CD73 expression in skin Tregs of Foxp3eyfp-cre and Foxp3eyfp-creRorafl/fl mice (n = 4 to 5 mice per group). The numbers in the FACS panels represent the percentage of positive cells relative to fluorescence minus one (FMO) control. (E) Relative Il4 mRNA levels in Tregs from MC903-treated skin of Foxp3eyfp-creRorafl/fl mice and controls (n = 4 to 5 mice per group). (F) Representative FACS analysis of IL-4 expression in CD4+ cells and of FOXP3 versus CD90 expression in IL-4+CD4+ cells (left) and quantitation of the percent-age of IL-4+CD4+FOXP3+ cells among IL-4+CD4+ cells in the skin of MC903-treated Foxp3eyfp-creRorafl/fl mice and controls.
by guest on April 20, 2018
http://imm
unology.sciencemag.org/
Dow
nloaded from
Malhotra et al., Sci. Immunol. 3, eaao6923 (2018) 2 March 2018
S C I E N C E I M M U N O L O G Y | R E S E A R C H A R T I C L E
7 of 12
38
77
DR3
200
600
400
800 **
E
Tnfrsf25
5.4
15
5
8.3
PBS
rTL1A
b11D
C
Siglec-F
F
WT Tnfrsf25−/−
Siglec-F
b11D
C
2 2.9
6.9 3.9
Vehicle
MC903
A B C
− + +−
Tot
al T
L1A
(pg
/ml)
80
60
40
20
Isot
ype
Ab
αTL1
A A
b
Foxp3 creRorafl/flG
D
erm
al th
ickn
ess
(µm
)
100
300
200
400
Isotype αTL1A αTL1A αTL1A
αTL1A αTL1A
*
E
osin
ophi
ls/e
ar (
104 )
2
4
6
Isotype
*
C
D45
+ c
ells
/ ear
(10
5 )
1.0
2.0
1.5
2.5
Isotype
*
0.5
J
Il5
mR
NA
rela
tive
expr
esio
n
0.6
0.7
0.8
Isotype
0.5
*
C
cl8
mR
NA
rela
tive
expr
esio
n
0.4
0.6
0.8
Isotype
0.2
*
DR3
Tregs ILCs
78
75
Foxp3cre
Rorafl/fl
Foxp3cre
Rorafl/fl
Foxp3cre
Foxp3cre
MC
903
Unt
reat
ed
D
rTL1A
1.0
1.5
+− +−
0.5
*
0.5
1.0
1.5
2.0
rTL1A + +−
ns
0.5
Tnfrsf25-/-WT
**
MC903
1.5
2.0
1.0
+− +−
H
Foxp3 cre Foxp3 cre
Rorafl/flFoxp3 cre Foxp3 cre
Rorafl/fl
DR
3 M
FI
Foxp3cre Foxp3creRorafl/fl
Foxp3cre Foxp3creRorafl/fl
MC903 Eos
inop
hils
/ ear
(×
105 )
Foxp3cre Foxp3cre
Rorafl/fl
Eos
inop
hils
/ ear
(×
104 )
Nau
trop
hils
/ ear
(×
104 )
Foxp3cre Foxp3creRorafl/fl Foxp3cre Foxp3creRorafl/fl
−
I
Fig. 5. ROR expression in Tregs promotes expression of the TL1A receptor DR3 and restrains TL1A-driven allergic inflammation elicited by cutaneous application of MC903. (A) RNA-seq tracing of Tnfrsf25 expression in skin Tregs from untreated and MC903-treated skin of Foxp3eyfp-cre and Foxp3eyfp-creRorafl/fl mice. (B) Representative FACS analysis (left) and MFIs (right) of DR3 expression by skin Tregs of Foxp3eyfp-creRorafl/fl mice and Foxp3eyfp-cre controls (n = 3 mice per group). The numbers in the FACS panels represent the percent-age of positive cells relative to FMO control. (C) Representative FACS analysis of DR3 expression by ILCs from the skin of Foxp3eyfp-creRorafl/fl mice and Foxp3eyfp-cre controls. Results are representative of three independent experiments. The numbers in the FACS panels represent the percentage of positive cells relative to FMO control. (D) TL1A levels in vehicle and MC903-treated ear skin of Foxp3eyfp-creRorafl/fl mice and Foxp3eyfp-cre controls (n = 4 mice per group). (E) Representative FACS analysis (left) and quantification (right) of CD11b+Siglec-F+ eosinophils in MC903-treated ears of Tnfrsf25−/− mice and WT controls. (F) Representative FACS analysis (left) and quantification (right) of CD11b+Siglec-F+ eosinophils and CD11b+Gr1high neutrophils in TL1A-injected skin of Foxp3eyfp-creRorafl/fl mice and Foxp3eyfp-cre controls (n = 3 mice per group). (G to J) Representative H&E-stained sections (G), quanti-fication of dermal thickness (H), quantification of CD45+ cells (right) and CD11b+Siglec-F+ eosinophils (left) (I), and relative mRNA expression of Il5 (right) and Ccl8 (left) (J) in MC903- treated ears of Foxp3eyfp-creRorafl/fl mice injected with anti-TL1A antibody or isotype control (n = 4 mice per group). Columns and bars represent means and SEM. *P < 0.05, **P < 0.01
by guest on April 20, 2018
http://imm
unology.sciencemag.org/
Dow
nloaded from

Malhotra et al., Sci. Immunol. 3, eaao6923 (2018) 2 March 2018
S C I E N C E I M M U N O L O G Y | R E S E A R C H A R T I C L E
8 of 12
detectable in sensitized skin in either group. Nevertheless, intra-cellular FACS analysis revealed that OVA sensitization caused a small but significant increase in the numbers of IL-5+ ILCs and IL-5+ CD4+FOXP3− Teffs in Foxp3eyfp-cre control mice. The numbers of IL-5+ ILCs and IL-5+ CD4+FOXP3− Teffs were four- to fivefold higher in OVA- sensitized skin of Foxp3eyfp-creRorafl/fl mice than in controls (Fig. 6H). OVA sensitization did not result in significant changes in IL-33R/ST2, CD69, CD25, or KLRG1 expression by skin ILCs in Foxp3eyfp-creRorafl/fl or Foxp3eyfp-cre controls. These results suggest that
ROR+ Tregs play an important role in constraining antigen-driven skin inflammation.
DISCUSSIONWe show that skin Tregs express high levels of the transcription factor ROR. Deletion of Rora in Tregs does not alter the number of skin Tregs but results in exaggerated type 2 allergic skin inflammation in response to topical application of MC903 or EC sensitization with OVA. Thus,
SALFoxp3cre Foxp3cre
Rorafl/fl
Foxp3cre Foxp3cre
Rorafl/fl
Foxp3cre Foxp3cre
Rorafl/flFoxp3cre Foxp3cre
Rorafl/fl Foxp3cre Foxp3cre
Rorafl/flFoxp3cre Foxp3cre
Rorafl/fl
2
4
6
10
*
OVA SAL OVA
8
Fox
p3cr
eF
oxp3
cre R
orafl/
fl
Saline OVA
SALEC OVA SAL OVA
0.2
0.4
0.8
1.2
Eos
inop
hil n
umbe
r x1
04/c
m2
*
SALFoxp3cre Foxp3cre
Rorafl/fl
EC OVA SAL OVA
10
20
30
50
40
Epi
derm
al th
ickn
ess
(µm
) ***
CD
45+
cel
l num
ber
x104
/cm
2
5
10
15
20
Mast cells
S OWT cKO WT cKO WT cKO
Basophils Neutrophils
EC S O S O S O S O S O
Mye
loid
cel
l num
ber
x102
/cm
2
1
2
3
4
ILCs
S OWT cKO WT cKO WT cKO
CD4+ Teff Tregs
EC S O S O S O S O S OLy
mph
oid
cell
num
ber
x103
/cm
2
SALEC OVA SAL OVA
20
40
60
80
CD
4+IL
-5+
T c
ells
/cm
2
**
SALEC OVA SAL OVA
10
20
30
40C
D3−
Lin−
CD
90+
IL-5
+
cel
ls/c
m2
*
SALEC OVA SAL OVA
2
4
6
Il4 m
RN
A (
fold
indu
ctio
n)
SALEC OVA SAL OVA
1
2
3
Il13
mR
NA
(fo
ld i
tndu
ctio
n)
**
* *
*
**
*
Tape stripping +OVA or saline
D0 D2 D4 D6 D8 D10 D12Analysis
A
B C D
E F
G H
Fig. 6. ROR deficiency in Tregs results in exaggerated skin inflammation in response to EC sensitization. (A) Schematic of the experimental mouse model. (B to H) Rep-resentative H&E-stained sections (B); quantification of epidermal thickness (C); number of CD45+ cells (D), CD11b+Siglec-F+ eosinophils (E), mast cells, neutrophils, and basophils (left), and CD4+FOXP3− Teffs, CD4+FOXP3+ Tregs, and ILCs (right) (F); relative Il4 (right) and Il13 (left) mRNA expression (G); and numbers of IL-5+ CD4+ T cells and ILCs (H) in saline and OVA-sensitized skin of Foxp3eyfp-creRorafl/fl mice (also designated as cKO) and Foxp3eyfp-cre controls (also designated as WT). n = 3 to 7 mice per group. Columns and bars represent means and SEM. *P < 0.05, ***P < 0.001.
by guest on April 20, 2018
http://imm
unology.sciencemag.org/
Dow
nloaded from

Malhotra et al., Sci. Immunol. 3, eaao6923 (2018) 2 March 2018
S C I E N C E I M M U N O L O G Y | R E S E A R C H A R T I C L E
9 of 12
we have identified ROR as a regulator of Treg genes responsible for suppressing allergic skin inflammation.
The vast majority of mouse skin Tregs expressed ROR and had an activated phenotype. In contrast, a small minority of Tregs in skin dLNs expressed ROR and had an activated phenotype. It remains to be de-termined whether circulating ROR+ Tregs are specifically attracted to the skin or whether the skin environment drives ROR expression in Tregs. The numbers of skin Tregs are not altered in Foxp3eyfp-creRorafl/fl mice. Furthermore, although the majority of human blood Tregs ex-press the skin-homing receptor CLA (37), human blood Tregs ex-pressed fivefold less RORA mRNA compared with skin Tregs. These findings argue for local acquisition of ROR expression by Tregs in the skin.
We demonstrated that ROR expression in Tregs restrains allergic skin inflammation induced by topical application of MC903, an AD model dependent on ILC2s (2, 4). This was evidenced by increased ear swelling and dermal thickness in Foxp3eyfp-creRorafl/fl mice, with a threefold increase in the influx of inflammatory cells that included T cells, basophils, neutrophils, and mast cells, and a selective enrich-ment in eosinophils that showed an eightfold increase over controls. Type 2 cytokines, such as IL-4, are documented to drive eotaxin ex-pression (21, 38). Increased eosinophilia in MC903-treated skin of Foxp3eyfp-creRorafl/fl mice may be explained by synergy between in-creased skin IL-5 expression and increased skin and Tregs eotaxin ex-pression, likely driven by increased expression of IL-4 and IL-13. The exaggerated skin inflammation in Foxp3eyfp-creRorafl/fl mice was not caused by increased cutaneous expression of TSLP, the epithelial cyto-kine essential for MC903-driven skin inflammation in mice on the C57BL/6 background, the background of the Foxp3eyfp-creRorafl/fl mice we used. ROR was essential for repressing IL-5 expression in fast- responding ILC2s and for restricting the CCL8-dependent recruit-ment of IL-5+ TH2 effector cells to the skin, likely by dampening the expression of Ccl8 in the skin, and particularly in skin Tregs. ROR also repressed IL-13 and IL-4 expression by skin ILCs, although the effect did not reach statistical significance, but had no effect on IL-4 and IL-13 expression by T cells. We propose that in addition to their role in re-straining adaptive immunity, a central function of Tregs resident in bar-rier interfaces, such as skin, is to inhibit the rapid activation of innate lymphocytes. The unrestrained activation of these innate sentinels may contribute to acute flare-ups in allergic diseases.
ROR regulated the expression of several genes important for Treg migration and function. Changes in chemokine receptor expression may underlie the increased motility of Tregs in Foxp3eyfp-creRorafl/fl mice. Our data suggest that decreased expression by ROR-deficient Tregs of Tnfrsf25 encoding DR3, a gene important for Treg function, con-tributed to the enhanced skin inflammation in Foxp3eyfp-creRorafl/fl mice. The exaggerated skin inflammation in Foxp3eyfp-creRorafl/fl mice may be a direct effect of decreased TL1A activation of Tregs and/or in-creased availability of TL1A to activate ILC2s. Definitive evidence of the role of DR3 expression on Tregs in limiting allergic skin inflam-mation and its mechanism of action awaits the generation and study of mice with selective deficiency of Tnfrsf25 in Tregs and/or ILC2s. Furthermore, our data indicate that ROR restrains the conversion of Tregs into IL-4–producing effector cells, possibly because ROR drives the expression of Runx1, which inhibits Il4 gene transcription. Derepression of the TH2 proinflammatory genes in ROR-deficient skin Tregs likely contributes to the enhanced allergic skin response in Foxp3eyfp-creRorafl/fl mice. Furthermore, IL-10 expression was increased in ROR-deficient skin Tregs. The transcription factor AhR (aryl hydro-
carbon receptor) enhances IL-10 production in Tregs (39), whereas IL-4 suppresses it (40). We observed increased Ahr and Il4 expression in ROR-deficient skin Tregs. Increased expression of AhR and IL-4 may underlie the enhanced IL-10 expression by these cells.
In addition to its role in suppressing ILC2-dependent allergic skin inflammation driven by topical application of MC903, ROR expres-sion in Tregs was important for suppressing T cell–dependent allergic skin inflammation driven by topical application of the antigen OVA to tape-stripped skin, a T cell–dependent mouse model of AD. This was evidenced by increased epidermal thickness, increased dermal infiltra-tion by CD45+ inflammatory cells (including eosinophils, mast cells, neutrophils, T cells, and ILC2s), increased cutaneous expression of Il4, and increased expression of IL-5 by T cells and ILCs.
We demonstrate significantly higher expression of RORA in hu-man skin Tregs than in blood Tregs, suggesting that our results may be applicable to humans. Our results may be particularly relevant to pa-tients with AD, a disease in which both TH2 cells and ILC2s play im-portant roles in allergic skin inflammation. RORA polymorphisms in asthma (41) and Rora down-regulation in dogs with AD (42) further suggest that ROR may play a regulatory role in atopic diseases. More-over, expression of Rora in Tregs resident in tissues such as the gut (43) may endow them with the ability to dampen allergic inflammation in organs other than skin.
MATERIALS AND METHODSMiceFoxp3eyfp-cre (C57BL/6), R26R (C57BL/6), Rag1−/− (C57BL/6), and Rorcgfp (C57BL/6) mice were purchased from the Jackson Laborato-ry (Bar Harbor, ME). Rorafl/fl (C57BL/6) mice were generated in the laboratory of P. Chambon (France) (44). Roracre (C57BL/6) mice were generated in the laboratory of D. O’Leary (45). Tnfrsf25−/− mice were generated by E. Y. Wang and obtained from the laboratory of R. Siegel. Foxp3egfp reporter mice were a gift from T. Chatila. All mice were kept in a pathogen-free environment. All procedures performed on the mice were in accordance with the Animal Care and Use Committee of the Children’s Hospital Boston.
Preparation of skin cell homogenates from mice and human skinDorsal and ventral ear murine skin was separated using tweezers, chopped, and digested in complete Dulbecco’s modified Eagle’s medi-um containing Liberase TL (2.5 mg/ml, Roche, Life Technologies) and deoxyribonuclease (DNase) I (20 ng/ml, Sigma) for 90 min at 37°C, with vigorous shaking. Digested tissue was mechanically disrupted with a plunger, filtered, washed, and suspended in media for flow cy-tometric analysis. Human skin surgical discards of facial skin were ob-tained from the laboratory of R. Clark (Brigham and Women’s Hospital). To obtain cells from human skin, we removed all the fat using a scal-pel and chopped the skin into small pieces and digested for 2 hours at 37°C with vigorous shaking in complete RPMI containing collagenase IV (2 ng/ml, Worthington Pharmaceuticals), hyaluronidase (2 ng/ml, Sigma), and DNase I. Digested tissue was mechanically disrupted using a plunger, filtered, centrifuged, and resuspended for cell sorting.
Flow cytometryAll antibodies were obtained from eBioscience and BioLegend, except anti-mouse Siglec-F, which was purchased from BD Biosciences. Cells were preincubated with Fc receptor–specific blocking monoclonal
by guest on April 20, 2018
http://imm
unology.sciencemag.org/
Dow
nloaded from

Malhotra et al., Sci. Immunol. 3, eaao6923 (2018) 2 March 2018
S C I E N C E I M M U N O L O G Y | R E S E A R C H A R T I C L E
10 of 12
antibody (2.4G2) and washed before staining. Staining with CD45 and fixable viability dye (eBioscience) was used for FACS analysis of skin cell homogenates. One hundred twenty-three count beads from eBioscience were used for estimating cell counts. Cells were analyzed on LSRFortessa (BD Biosciences), and the data were analyzed with FlowJo software (v9.7).
Intracellular staining analysis for cytokines and transcription factorsLN and skin cell suspensions were incubated with media containing phorbol 12,13-dibutyrate, ionomycin, GolgiPlug, and GolgiStop for 3 hours. Staining for surface markers was performed, followed by fix-ation and permeabilization using BD Cytofix/Cytoperm buffer. Cells were incubated with antibodies against cytokines, IL-4, IL-5, and IL-13, along with antibodies to FOXP3, overnight in Perm/Wash buf-fer (BD Biosciences). This protocol was also used to stain cells with anti-FOXP3 and anti-HELIOS markers without quenching the emis-sion of YFP in Roracre R26R mice.
MC903 treatmentMC903 (catalog no. 2700) was purchased from Tocris Biochemicals. The stock was reconstituted in ethanol. MC903 (2 nM) (in a volume of 20 ml) was topically applied on the ears of mice every other day, for a total of four applications. Ethanol (vehicle) was applied on the control ear. Mice were sacrificed 1 day after the last application.
RNA preparation and qPCRCells were sorted directly into the lysis buffer of RNA Isolation Micro kit (Zymo Research), and RNA was prepared on the basis of kit in-structions. For analysis of transcripts in skin, skin tissue was stored in RNAlater (Ambion) and homogenized using a tissue homogenizer, and RNA was prepared using RNA isolation kits (Zymo Research). Reverse transcription was performed with an iScript cDNA synthesis kit (Bio-Rad Laboratories). PCRs were run on an ABI Prism 7300 (Applied Biosystems) sequence detection system platform. TaqMan primers and probes were obtained from Life Technologies. The house-keeping gene 2-microglobulin was used as a control. Relative mRNA expression was quantified using the 2−Ct method.
RNA-seq and transcriptomic analysisCD3+CD4+Foxp3+(YFP+) Tregs from skin and dLNs were sorted on Aria cell sorter into the lysis buffer (PicoPure RNA Isolation kit, Life Technologies). RNA was prepared after DNase treatment (Qiagen) and sent to Dana-Farber Cancer Institute Molecular Biology Core Facility for library preparation and sequencing. Replicates with a min-imum RIN (RNA integrity number) score of 7 were processed. Com-plementary DNA (cDNA) was synthesized using Clontech SMART-Seq v4 reagents from 500 pg of RNA and fragmented to a mean size of 150 base pairs (bp) with a Covaris M220 ultrasonicator. Illumina libraries were prepared from cDNA using Rubicon Genomics ThruPLEX DNA-seq reagents according to the manufacturer’s protocol. The finished double- stranded DNA libraries were quantified and sequenced on a single Illumina NextSeq 500 sequencing system run with single-end 75-bp reads by the Dana-Farber Cancer Institute Molecular Biology Core Facility. TopHat was used to align reads to mouse genome [Mm9, National Center for Biotechnology Information (NCBI)], and HTSeq was used to estimate read counts. Read counts from all experiments are listed in table S1. Highly correlated triplicate samples were used for comparative analysis (fig. S6). DEseq2 was used to normalize data and
access differential gene expression with an FDR of <0.05. Expression levels for individual genes are represented as reads per kilobase of tran-script per million mapped reads (RPKM). Heat maps were generated using GENE-E software (Broad Institute). RNA-seq raw data can be accessed through accession no. GSE99086.
Intravital two-photon imagingFoxp3egfp (Balb/c) mice were anesthetized intraperitoneally using ketamine (100 mg/kg) and xylazine (10 mg/kg). One of the ears was gently attached to an aluminum block using double-sided tape. Ear temperature was maintained at 33°C using a heating pad. GenTeal (Novartis) eye gel was spread over the ear to allow immersion of the 20× objective (0.95 numerical aperture). Images were acquired using an upright microscope (Prairie Technologies) coupled to a Mai Tai Ti:Sapphire laser (Spectra-Physics). To visualize vasculature, mice were intravenously injected with Qdot655 (Molecular Probes) diluted in phosphate-buffered saline. Images were acquired with a laser wavelength of 900 nm for optimal GFP excitation and second- harmonic generation. Epidermis and dermis were analyzed by acqui-sition of ~100-mm optical stacks every 30 to 60 s for 15 to 60 min with 4-mm spacing. Images were transformed into four-dimensional time-lapse movies and analyzed using Imaris software versions 7.4.2 and 8.4.1 (Bitplane). Imaging experiments were performed in the Balb/c background, but similar results were observed using Foxp3egfp (C57BL/6) mice. Balb/c mice were preferred to avoid autofluorescence from melanin.
HistologyTissue samples were stored in 10% formalin and sent to the histology core at Boston Children’s Hospital for processing and hematoxylin and eosin (H&E) staining. Slides were analyzed on the 20× objective of bright-field microscope (Nikon), and captured images were analyzed using ImageJ software for enumeration of dermal thickness.
Local treatments by intradermal injectionRecombinant TL1A (0.9 g/l; catalog no. 753008, BioLegend) was injected intradermally into the ear of mice in a total volume of 10 ml every day for 3 days. Isotype antibody or anti-human/mouse TL1A antibody (R&D Systems) was injected intradermally into the ears in a total volume of 10 l every other day for 3 days. Cells from ears were prepared, and flow cytometric analysis was performed as described earlier.
Epicutaneous sensitizationSix- to 8-week-old female mice were epicutaneously sensitized for 2 weeks, as described previously (9). In brief, for each treatment, female mice were anesthetized, and then their back skin was shaved and tape-stripped with a film dressing (Tegaderm, 3M). EC sensitization consisted of applying a 1-cm2 gauze containing 200 g of OVA (Sigma- Aldrich) to the skin after each tape stripping and securing it with a film dressing. Analyses were done at day 12.
Enzyme-linked immunosorbent assaysFor detection of total IgE levels, mouse sera were prepared and enzyme- linked immunosorbent assay (ELISA) was performed (88-50460-88, eBioscience) as per the manufacturer’s instructions. For quantification of cytokines in the tissue, mouse ears were flash-frozen in liquid nitro-gen. Tissue was chopped, lysed, and homogenized in 500 ml of T-PER tissue protein extraction buffer (catalog no. 78510, Thermo Fisher
by guest on April 20, 2018
http://imm
unology.sciencemag.org/
Dow
nloaded from
Malhotra et al., Sci. Immunol. 3, eaao6923 (2018) 2 March 2018
S C I E N C E I M M U N O L O G Y | R E S E A R C H A R T I C L E
11 of 12
Scientific) in the presence of complete protease inhibitor and phos-phatase inhibitors. Total protein was quantified using a bicinchoninic acid protein assay kit (catalog no. 23227, Pierce), and levels of IL-5 were enumerated after normalizing to the total protein content in the tissue. IL-5 levels in ear skin were measured using Quantikine IL-5 kit (M5000, R&D Systems), and TL1A levels were measured using DuoSet ELISA kit (DY1896-05, R&D Systems).
Statistical analysisStatistical significance was determined by the Mann-Whitney test or analysis of variance (ANOVA) analysis using GraphPad Prism. P < 0.05 was considered statistically significant.
SUPPLEMENTARY MATERIALSimmunology.sciencemag.org/cgi/content/full/3/21/eaao6923/DC1Fig. S1. ROR-expressing skin Tregs are HELIOS+ natural Tregs that express high levels of ST2 and ICOS.Fig. S2. Multiple skin-resident cell types express ROR.Fig. S3. CD4+ T cells are the only cells that express eGFP in Foxp3egfp mice.Fig. S4. Treg-specific ROR deficiency does not affect Treg numbers in the skin, nor their ability to produce IL-10.Fig. S5. Skin TSLP and serum IgE levels in Foxp3eyfp-creRorafl/fl mice and Foxp3eyfp-cre controls.Fig. S6. Effect of lack of ROR in Tregs on MC903-driven blood eosinophilia and on IL-4, IL-13, and chemokines in MC903-treated skin.Fig. S7. Analysis of correlation of RNA-seq samples.Fig. S8. Increased number and motility of Tregs in MC903-treated ear skin.Table S1. Summary of RNA-seq experiments.Movie S1. Intravital two-photon imaging of the untreated ear dermis of a Foxp3egfp animal.Movie S2. Intravital two-photon imaging of the MC903-treated ear dermis of Foxp3egfp mice.
REFERENCES AND NOTES 1. J. M. Spergel, A. S. Paller, Atopic dermatitis and the atopic march. J. Allergy Clin. Immunol.
112, S118–S127 (2003). 2. M. Salimi, J. L. Barlow, S. P. Saunders, L. Xue, D. Gutowska-Owsiak, X. Wang, L.-C. Huang,
D. Johnson, S. T. Scanlon, A. N. J. McKenzie, P. G. Fallon, G. S. Ogg, A role for IL-25 and IL-33–driven type-2 innate lymphoid cells in atopic dermatitis. J. Exp. Med. 210, 2939–2950 (2013).
3. B. Roediger, R. Kyle, K. H. Yip, N. Sumaria, T. V. Guy, B. S. Kim, A. J. Mitchell, S. S. Tay, R. Jain, E. Forbes-Blom, X. Chen, P. L. Tong, H. A. Bolton, D. Artis, W. E. Paul, B. Fazekas de St Groth, M. A. Grimbaldeston, G. Le Gros, W. Weninger, Cutaneous immunosurveillance and regulation of inflammation by group 2 innate lymphoid cells. Nat. Immunol. 14, 564–573 (2013).
4. B. S. Kim, M. C. Siracusa, S. A. Saenz, M. Noti, L. A. Monticelli, G. F. Sonnenberg, M. R. Hepworth, A. S. Van Voorhees, M. R. Comeau, D. Artis, TSLP elicits IL-33–independent innate lymphoid cell responses to promote skin inflammation. Sci. Transl. Med. 5, 170ra16 (2013).
5. M. Li, P. Hener, Z. Zhang, S. Kato, D. Metzger, P. Chambon, Topical vitamin D3 and low-calcemic analogs induce thymic stromal lymphopoietin in mouse keratinocytes and trigger an atopic dermatitis. Proc. Natl. Acad. Sci. U.S.A. 103, 11736–11741 (2006).
6. J. M. Leyva-Castillo, M. Li, Thymic stromal lymphopoietin and atopic diseases. Rev. Fr. Allergol. 54, 364–376 (2014).
7. L. M. Bartnikas, M. F. Gurish, O. T. Burton, S. Leisten, E. Janssen, H. C. Oettgen, J. Beaupré, C. N. Lewis, K. F. Austen, S. Schulte, J. L. Hornick, R. S. Geha, M. K. Oyoshi, Epicutaneous sensitization results in IgE-dependent intestinal mast cell expansion and food-induced anaphylaxis. J. Allergy Clin. Immunol. 131, 451–460.e6 (2013).
8. J. M. Spergel, E. Mizoguchi, J. P. Brewer, T. R. Martin, A. K. Bhan, R. S. Geha, Epicutaneous sensitization with protein antigen induces localized allergic dermatitis and hyperresponsiveness to methacholine after single exposure to aerosolized antigen in mice. J. Clin. Invest. 101, 1614–1622 (1998).
9. J. M. Leyva-Castillo, P. Hener, H. Jiang, M. Li, TSLP produced by keratinocytes promotes allergen sensitization through skin and thereby triggers atopic march in mice. J. Invest. Dermatol. 133, 154–163 (2013).
10. A. L. Woodward, J. M. Spergel, H. Alenius, E. Mizoguchi, A. K. Bhan, E. Castigli, S. R. Brodeur, H. C. Oettgen, R. S. Geha, An obligate role for T-cell receptor + T cells but not T-cell receptor + T cells, B cells, or CD40/CD40L interactions in a mouse model of atopic dermatitis. J. Allergy Clin. Immunol. 107, 359–366 (2001).
11. M. Panduro, C. Benoist, D. Mathis, Tissue Tregs. Annu. Rev. Immunol. 34, 609–633 (2016).
12. T. A. Chatila, F. Blaeser, N. Ho, H. M. Lederman, C. Voulgaropoulos, C. Helms, A. M. Bowcock, JM2, encoding a fork head–related protein, is mutated in X-linked autoimmunity–allergic disregulation syndrome. J. Clin. Invest. 106, R75–R81 (2000).
13. V. L. Godfrey, J. E. Wilkinson, L. B. Russell, X-linked lymphoreticular disease in the scurfy (sf) mutant mouse. Am. J. Pathol. 138, 1379–1387 (1991).
14. A. Szegedi, S. Baráth, G. Nagy, P. Szodoray, M. Gál, S. Sipka, E. Bagdi, A. H. Banham, L. Krenács, Regulatory T cells in atopic dermatitis: Epidermal dendritic cell clusters may contribute to their local expansion. Br. J. Dermatol. 160, 984–993 (2009).
15. R. Sanchez Rodriguez, M. L. Pauli, I. M. Neuhaus, S. S. Yu, S. T. Arron, H. W. Harris, S. H.-Y. Yang, B. A. Anthony, F. M. Sverdrup, E. Krow-Lucal, T. C. MacKenzie, D. S. Johnson, E. H. Meyer, A. Löhr, A. Hsu, J. Koo, W. Liao, R. Gupta, M. G. Debbaneh, D. Butler, M. Huynh, E. C. Levin, A. Leon, W. Y. Hoffman, M. H. McGrath, M. D. Alvarado, C. H. Ludwig, H.-A. Truong, M. M. Maurano, I. K. Gratz, A. K. Abbas, M. D. Rosenblum, Memory regulatory T cells reside in human skin. J. Clin. Invest. 124, 1027–1036 (2014).
16. S. H. Wong, J. A. Walker, H. E. Jolin, L. F. Drynan, E. Hams, A. Camelo, J. L. Barlow, D. R. Neill, V. Panova, U. Koch, F. Radtke, C. S. Hardman, Y. Y. Hwang, P. G. Fallon, A. N. J. McKenzie, Transcription factor ROR is critical for nuocyte development. Nat. Immunol. 13, 229–236 (2012).
17. X. O. Yang, R. Nurieva, G. J. Martinez, H. S. Kang, Y. Chung, B. P. Pappu, B. Shah, S. H. Chang, K. S. Schluns, S. S. Watowich, X.-H. Feng, A. M. Jetten, C. Dong, Molecular antagonism and plasticity of regulatory and inflammatory T cell programs. Immunity 29, 44–56 (2008).
18. I. Dussault, D. Fawcett, A. Matthyssen, J.-A. Bader, V. Giguère, Orphan nuclear receptor ROR-deficient mice display the cerebellar defects of staggerer. Mech. Dev. 70, 147–153 (1998).
19. Y. P. Rubtsov, J. P. Rasmussen, E. Y. Chi, J. Fontenot, L. Castelli, X. Ye, P. Treuting, L. Siewe, A. Roers, W. R. Henderson Jr., W. Muller, A. Y. Rudensky, Regulatory T cell-derived interleukin-10 limits inflammation at environmental interfaces. Immunity 28, 546–558 (2008).
20. M. E. Rothenberg, A. D. Luster, P. Leder, Murine eotaxin: An eosinophil chemoattractant inducible in endothelial cells and in interleukin 4-induced tumor suppression. Proc. Natl. Acad. Sci. U.S.A. 92, 8960–8964 (1995).
21. J. C. Nussbaum, S. J. Van Dyken, J. von Moltke, L. E. Cheng, A. Mohapatra, A. B. Molofsky, E. E. Thornton, M. F. Krummel, A. Chawla, H.-E. Liang, R. M. Locksley, Type 2 innate lymphoid cells control eosinophil homeostasis. Nature 502, 245–248 (2013).
22. A. W. Mould, K. I. Matthaei, I. G. Young, P. S. Foster, Relationship between interleukin-5 and eotaxin in regulating blood and tissue eosinophilia in mice. J. Clin. Invest. 99, 1064–1071 (1997).
23. S. J. Van Dyken, J. C. Nussbaum, J. Lee, A. B. Molofsky, H.-E. Liang, J. L. Pollack, R. E. Gate, G. E. Haliburton, C. J. Ye, A. Marson, D. J. Erle, R. M. Locksley, A tissue checkpoint regulates type 2 immunity. Nat. Immunol. 17, 1381–1387 (2016).
24. S. A. Islam, D. S. Chang, R. A. Colvin, M. H. Byrne, M. L. McCully, B. Moser, S. A. Lira, I. F. Charo, A. D. Luster, Mouse CCL8, a CCR8 agonist, promotes atopic dermatitis by recruiting IL-5+ TH2 cells. Nat. Immunol. 12, 167–177 (2011).
25. A. M. Jetten, Retinoid-related orphan receptors (RORs): Critical roles in development, immunity, circadian rhythm, and cellular metabolism. Nucl. Recept. Signal. 7, e003 (2009).
26. A. Huynh, M. DuPage, B. Priyadharshini, P. T. Sage, J. Quiros, C. M. Borges, N. Townamchai, V. A. Gerriets, J. C. Rathmell, A. H. Sharpe, J. A. Bluestone, L. A. Turka, Control of PI(3) kinase in Treg cells maintains homeostasis and lineage stability. Nat. Immunol. 16, 188–196 (2015).
27. T. C. Scharschmidt, K. S. Vasquez, M. L. Pauli, E. G. Leitner, K. Chu, H.-A. Truong, M. M. Lowe, R. Sanchez Rodriguez, N. Ali, Z. G. Laszik, J. L. Sonnenburg, S. E. Millar, M. D. Rosenblum, Commensal microbes and hair follicle morphogenesis coordinately drive Treg migration into neonatal skin. Cell Host Microbe 21, 467–477.e5 (2017).
28. S. Deaglio, K. M. Dwyer, W. Gao, D. Friedman, A. Usheva, A. Erat, J.-F. Chen, K. Enjyoji, J. Linden, M. Oukka, V. K. Kuchroo, T. B. Strom, S. C. Robson, Adenosine generation catalyzed by CD39 and CD73 expressed on regulatory T cells mediates immune suppression. J. Exp. Med. 204, 1257–1265 (2007).
29. M. A. Gavin, J. P. Rasmussen, J. D. Fontenot, V. Vasta, V. C. Manganiello, J. A. Beavo, A. Y. Rudensky, Foxp3-dependent programme of regulatory T-cell differentiation. Nature 445, 771–775 (2007).
30. M. Noval Rivas, O. T. Burton, H. C. Oettgen, T. Chatila, IL-4 production by group 2 innate lymphoid cells promotes food allergy by blocking regulatory T-cell function. J. Allergy Clin. Immunol. 138, 801–811.e9 (2016).
31. M. Noval Rivas, O. T. Burton, P. Wise, L.-M. Charbonnier, P. Georgiev, H. C. Oettgen, R. Rachid, T. A. Chatila, Regulatory T cell reprogramming toward a Th2-cell-like lineage impairs oral tolerance and promotes food allergy. Immunity 42, 512–523 (2015).
32. A. Kitoh, M. Ono, Y. Naoe, N. Ohkura, T. Yamaguchi, H. Yaguchi, I. Kitabayashi, T. Tsukada, T. Nomura, Y. Miyachi, I. Taniuchi, S. Sakaguchi, Indispensable role of the Runx1-Cbf transcription complex for in vivo-suppressive function of FoxP3+ regulatory T cells. Immunity 31, 609–620 (2009).
33. F. Meylan, E. T. Hawley, L. Barron, J. L. Barlow, P. Penumetcha, M. Pelletier, G. Sciumè, A. C. Richard, E. T. Hayes, J. Gomez-Rodriguez, X. Chen, W. E. Paul, T. A. Wynn,
by guest on April 20, 2018
http://imm
unology.sciencemag.org/
Dow
nloaded from

Malhotra et al., Sci. Immunol. 3, eaao6923 (2018) 2 March 2018
S C I E N C E I M M U N O L O G Y | R E S E A R C H A R T I C L E
12 of 12
A. N. J. McKenzie, R. M. Siegel, The TNF-family cytokine TL1A promotes allergic immunopathology through group 2 innate lymphoid cells. Mucosal Immunol. 7, 958–968 (2014).
34. T. H. Schreiber, D. Wolf, M. S. Tsai, J. Chirinos, V. V. Deyev, L. Gonzalez, T. R. Malek, R. B. Levy, E. R. Podack, Therapeutic Treg expansion in mice by TNFRSF25 prevents allergic lung inflammation. J. Clin. Invest. 120, 3629–3640 (2010).
35. A. I. Lim, S. Menegatti, J. Bustamante, L. Le Bourhis, M. Allez, L. Rogge, J.-L. Casanova, H. Yssel, J. P. Di Santo, IL-12 drives functional plasticity of human group 2 innate lymphoid cells. J. Exp. Med. 213, 569–583 (2016).
36. X. Yu, R. Pappu, V. Ramirez-Carrozzi, N. Ota, P. Caplazi, J. Zhang, D. Yan, M. Xu, W. P. Lee, J. L. Grogan, TNF superfamily member TL1A elicits type 2 innate lymphoid cells at mucosal barriers. Mucosal Immunol. 7, 730–740 (2014).
37. K. Hirahara, L. Liu, R. A. Clark, K.-i. Yamanaka, R. C. Fuhlbrigge, T. S. Kupper, The majority of human peripheral blood CD4+CD25highFoxp3+ regulatory T cells bear functional skin-homing receptors. J. Immunol. 177, 4488–4494 (2006).
38. M. Mochizuki, J. Bartels, A. I. Mallet, E. Christophers, J.-M. Schröder, IL-4 induces eotaxin: A possible mechanism of selective eosinophil recruitment in helminth infection and atopy. J. Immunol. 160, 60–68 (1998).
39. R. Gandhi, D. Kumar, E. J. Burns, M. Nadeau, B. Dake, A. Laroni, D. Kozoriz, H. L. Weiner, F. J. Quintana, Activation of the aryl hydrocarbon receptor induces human type 1 regulatory T cell–like and Foxp3+ regulatory T cells. Nat. Immunol. 11, 846–853 (2010).
40. D. Kolodin, N. van Panhuys, C. Li, A. M. Magnuson, D. Cipolletta, C. M. Miller, A. Wagers, R. N. Germain, C. Benoist, D. Mathis, Antigen- and cytokine-driven accumulation of regulatory T cells in visceral adipose tissue of lean mice. Cell Metab. 21, 543–557 (2015).
41. M. F. Moffatt, I. G. Gut, F. Demenais, D. P. Strachan, E. Bouzigon, S. Heath, E. von Mutius, M. Farrall, M. Lathrop, W. O. C. M. Cookson; GABRIEL Consortium, A large-scale, consortium-based genomewide association study of asthma. N. Engl. J. Med. 363, 1211–1221 (2010).
42. A. Majewska, M. Gajewska, K. Dembele, H. Maciejewski, A. Prostek, M. Jank, Lymphocytic, cytokine and transcriptomic profiles in peripheral blood of dogs with atopic dermatitis. BMC Vet. Res. 12, 174 (2016).
43. C. Schiering, T. Krausgruber, A. Chomka, A. Fröhlich, K. Adelmann, E. A. Wohlfert, J. Pott, T. Griseri, J. Bollrath, A. N. Hegazy, O. J. Harrison, B. M. J. Owens, M. Löhning, Y. Belkaid,
P. G. Fallon, F. Powrie, The alarmin IL-33 promotes regulatory T-cell function in the intestine. Nature 513, 564–568 (2014).
44. A. Mukherji, A. Kobiita, T. Ye, P. Chambon, Homeostasis in intestinal epithelium is orchestrated by the circadian clock and microbiota cues transduced by TLRs. Cell 153, 812–827 (2013).
45. S.-J. Chou, Z. Babot, A. Leingärtner, M. Studer, Y. Nakagawa, D. D. M. O’Leary, Geniculocortical input drives genetic distinctions between primary and higher-order visual areas. Science 340, 1239–1242 (2013).
Acknowledgments: We thank the flow cytometry core at Boston Children’s Hospital, the sequencing core at Dana-Farber Cancer Institute, and the Human Skin Disease Resource Core at Brigham and Women’s Hospital for their service; T. Chatila for a gift of Foxp3egfp mice; D. O’Leary for a gift of RoraCre/Cre mice; R. Clark for sharing human skin samples; and T. Chatila, L. M. Charbonnier, H. Oettgen, and J. Chou for reading the manuscript and useful discussions. Funding: This work was supported by NIH grant AI113294-01A1, HHSN272201000020C, and intramural funding from the National Institute of Arthritis and Musculoskeletal and Skin Diseases, NIH. Author contributions: N.M., J.M.L.-C., and R.S.G. designed the experiments; N.M., J.M.L.-C., U.J., O.B., N.K.O., and C.K. performed the experiments and analyzed the data. F.M., P.C., U.H.v.A., R.M.S., E.C.W., and R.S. contributed critical reagents, mice, or analytic tools. N.M., J.M.L.-C., and R.S.G. interpreted the data and wrote the manuscript. N.M. and J.M.L.-C. performed the statistical analyses. Competing interests: The authors declare that they have no competing interests. Data and materials availability: The RNA-seq data reported in this paper are archived at the NCBI Gene Expression Omnibus database (accession no. GSE99086).
Submitted 16 August 2017Accepted 17 January 2018Published 2 March 201810.1126/sciimmunol.aao6923
Citation: N. Malhotra, J. M. Leyva-Castillo, U. Jadhav, O. Barreiro, C. Kam, N. K. O’Neill, F. Meylan, P. Chambon, U. H. von Andrian, R. M. Siegel, E. C. Wang, R. Shivdasani, R. S. Geha, ROR-expressing T regulatory cells restrain allergic skin inflammation. Sci. Immunol. 3, eaao6923 (2018).
by guest on April 20, 2018
http://imm
unology.sciencemag.org/
Dow
nloaded from

-expressing T regulatory cells restrain allergic skin inflammationαROR
Meylan, Pierre Chambon, Ulrich H. von Andrian, Richard M. Siegel, Eddie C. Wang, Ramesh Shivdasani and Raif S. GehaNidhi Malhotra, Juan Manuel Leyva-Castillo, Unmesh Jadhav, Olga Barreiro, Christy Kam, Nicholas K. O'Neill, Francoise
DOI: 10.1126/sciimmunol.aao6923, eaao6923.3Sci. Immunol.
possibility of targeting the TL1A-DR3 in the context of dermatitis and other skin allergies. are unable to sequester TL1A that drives effector functions of ILC2s. The studies open up theregsskin-resident T
,α and that, upon deletion of RORregs) drives expression of DR3 in Tα (RORαretinoid-related orphan receptor ) and type 2 innate lymphoid cells (ILC2) that drive skin inflammation. They report thatregsregulatory cells (T
(TL1A), and its receptor death receptor 3 (DR3) as being critical in regulating cross-talk between skin-resident T related molecule 1−. have identified tumor necrosis factor (TNF) family cytokine, TNF ligandet aldermatitis, Malhotra
Atopic dermatitis is an allergic disease driven by type 2 immune responses in the skin. Using mouse models ofCurbing ILC2 enthusiasm
ARTICLE TOOLS http://immunology.sciencemag.org/content/3/21/eaao6923
MATERIALSSUPPLEMENTARY http://immunology.sciencemag.org/content/suppl/2018/02/27/3.21.eaao6923.DC1
REFERENCES
http://immunology.sciencemag.org/content/3/21/eaao6923#BIBLThis article cites 45 articles, 9 of which you can access for free
Terms of ServiceUse of this article is subject to the
a registered trademark of AAAS. isScience ImmunologyAssociation for the Advancement of Science. No claim to original U.S. Government Works. The title
New York Avenue NW, Washington, DC 20005. 2017 © The Authors, some rights reserved; exclusive licensee American (ISSN 2470-9468) is published by the American Association for the Advancement of Science, 1200Science Immunology
by guest on April 20, 2018
http://imm
unology.sciencemag.org/
Dow
nloaded from