skin-coupled pvdf microphones for ... pvdf microphones for noninvasive vascular blood sound...
TRANSCRIPT
SKIN-COUPLED PVDF MICROPHONES FOR NONINVASIVE VASCULAR BLOOD SOUND
MONITORING
B. Panda1,2, Member, IEEE, S. Chin1,3, S. Mandal2, Senior Member, IEEE, and
S. Majerus3, Senior Member, IEEE
1Department of Biomedical Engineering, Case Western Reserve University;
2Department of Electrical Engineering and Computer Science, Case Western Reserve University; 3Advanced Platform Technology Center, Louis Stokes Cleveland Veterans Affairs Medical Center, Cleveland, OH
{bxp219, slc103, sxm833, sjm18}@case.edu
Abstract—Vascular access is the “Achilles Heel” of
hemodialysis, as maintaining high flow characteristics
(access patency) is critical to achieving efficient dialysis
treatment. Thus, monitoring of vascular access is essential
for maintaining long-term dialysis success. Blood sounds
change in the presence of stenosis and can be analyzed
digitally as phonoangiograms (PAGs) to determine changes
in hemodynamic flow. We propose a multi-channel PAG
recording sensor suitable for rapid, non-invasive vascular
access monitoring. Here we present the initial design and
characterization of sensors appropriate for recording PAGs
from the skin surface. An optimized sensor size and backing
material was selected to improve sensitivity and to provide
a neutral frequency response. The sensor performance was
finally compared with a conventional stethoscope on a
controlled blood flow stenosis benchtop phantom.
I. INTRODUCTION
Access dysfunction accounts for 20-30% of hospital
visits for dialysis patients and the loss of access patency
can double their mortality risk [1]. The predominant
causes of access dysfunction are stenosis (vascular
narrowing) and thrombosis (vascular occlusion), which
have a combined incidence of 66-73% in Arteriovenous
fistula (AVFs) and 85% in Arteriovenous Grafts (AVGs).
Thus, monitoring access function at the point of dialysis
may be able to reduce emergency interventions [2]. Prior
studies have found a robust link between PAG temporal-
spectral variation and degree of stenosis (DOS) [3-5].
A simple, reliable, and automated dialysis access
monitoring tool which could be placed on a patient's
access prior to dialysis would provide real-time tracking
of access health, but does not exist [6]. The current
standard of care includes using a stethoscope for physical
examination of an access, but existing models are not
suitable for surveillance over large vascular accesses.
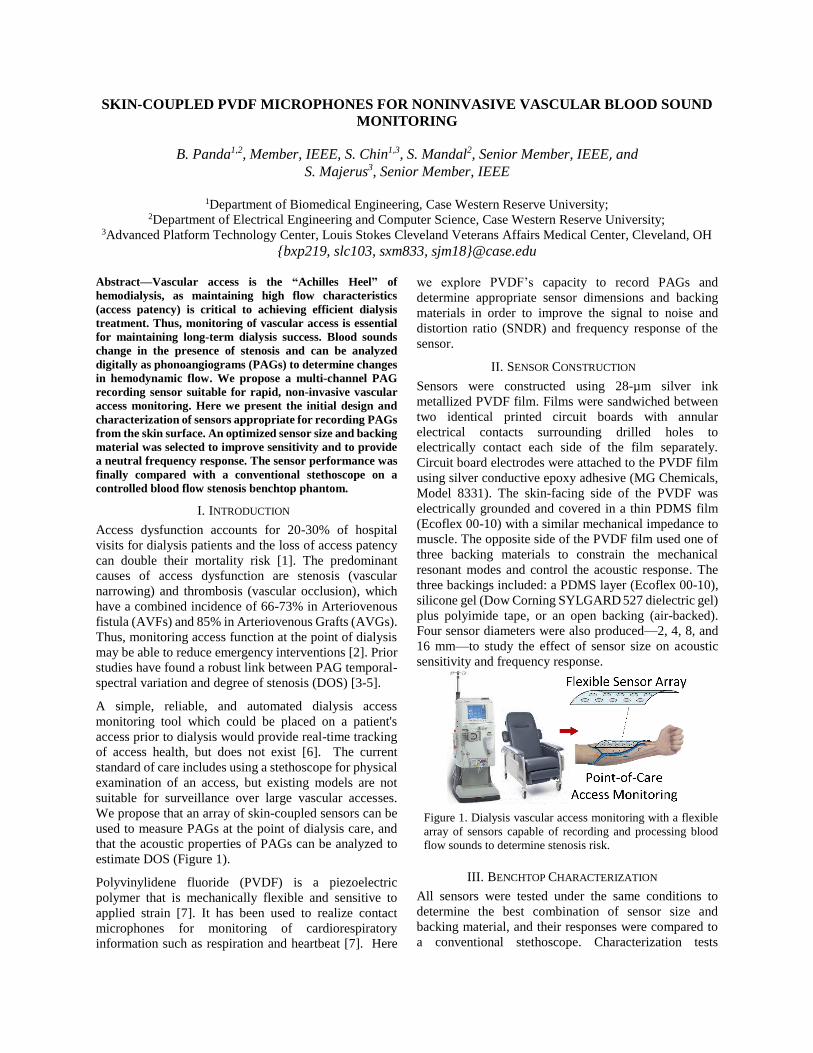
We propose that an array of skin-coupled sensors can be
used to measure PAGs at the point of dialysis care, and
that the acoustic properties of PAGs can be analyzed to
estimate DOS (Figure 1).
Polyvinylidene fluoride (PVDF) is a piezoelectric
polymer that is mechanically flexible and sensitive to
applied strain [7]. It has been used to realize contact
microphones for monitoring of cardiorespiratory
information such as respiration and heartbeat [7]. Here
we explore PVDF’s capacity to record PAGs and
determine appropriate sensor dimensions and backing
materials in order to improve the signal to noise and
distortion ratio (SNDR) and frequency response of the
sensor.
II. SENSOR CONSTRUCTION
Sensors were constructed using 28-µm silver ink
metallized PVDF film. Films were sandwiched between
two identical printed circuit boards with annular
electrical contacts surrounding drilled holes to
electrically contact each side of the film separately.
Circuit board electrodes were attached to the PVDF film
using silver conductive epoxy adhesive (MG Chemicals,
Model 8331). The skin-facing side of the PVDF was
electrically grounded and covered in a thin PDMS film
(Ecoflex 00-10) with a similar mechanical impedance to
muscle. The opposite side of the PVDF film used one of
three backing materials to constrain the mechanical
resonant modes and control the acoustic response. The
three backings included: a PDMS layer (Ecoflex 00-10),
silicone gel (Dow Corning SYLGARD 527 dielectric gel)
plus polyimide tape, or an open backing (air-backed).
Four sensor diameters were also produced—2, 4, 8, and
16 mm—to study the effect of sensor size on acoustic
sensitivity and frequency response.
Figure 1. Dialysis vascular access monitoring with a flexible
array of sensors capable of recording and processing blood
flow sounds to determine stenosis risk.
III. BENCHTOP CHARACTERIZATION
All sensors were tested under the same conditions to
determine the best combination of sensor size and
backing material, and their responses were compared to
a conventional stethoscope. Characterization tests
included slow frequency sweeps to determine the
acoustic frequency response and single-tone tests to
determine SNDR. Functional tests involved signal
recordings from a vascular flow phantom to simulate the
recording of hemoacoustics. Sensor data was collected
using LabVIEW at sampling rate of 10 kHz. Sensor data
was compared to data collected from a digital recording
stethoscope (3M Littmann Stethoscope 3200). The
sampling rate of the stethoscope was 4 kHz, but this was
digitally upsampled to 10 kHz to match the sample rate
of the PVDF sensors for frequency analysis.
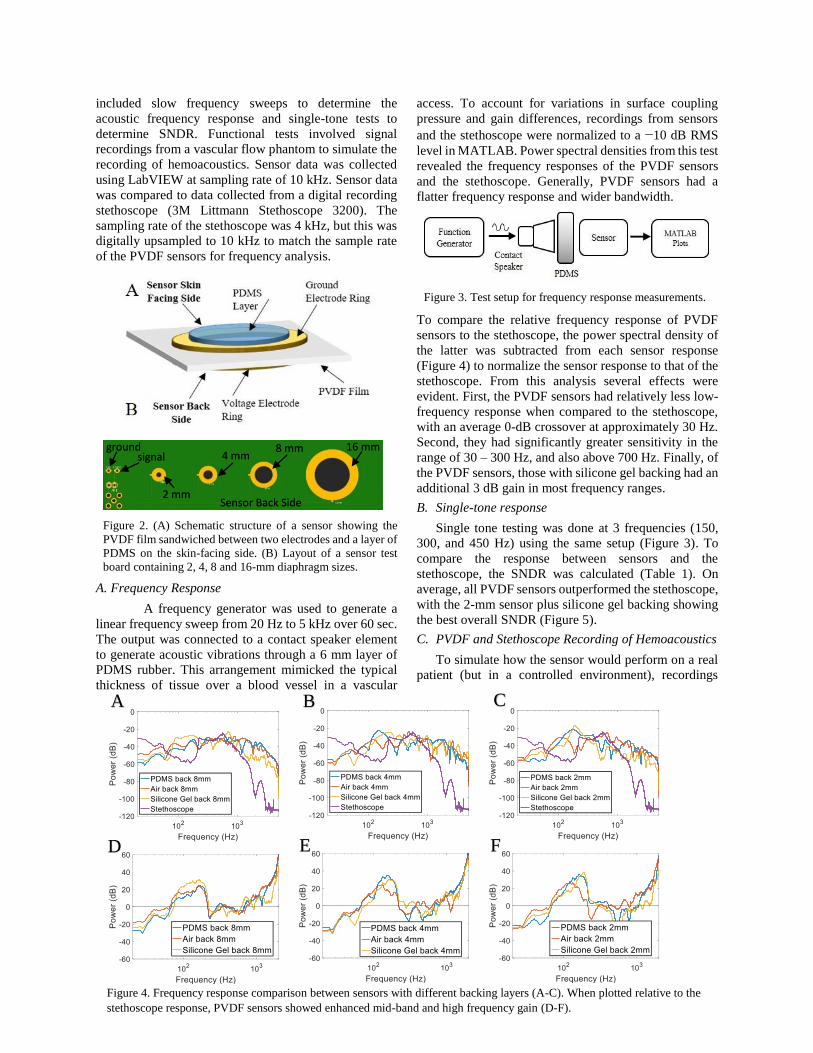
Figure 2. (A) Schematic structure of a sensor showing the
PVDF film sandwiched between two electrodes and a layer of
PDMS on the skin-facing side. (B) Layout of a sensor test
board containing 2, 4, 8 and 16-mm diaphragm sizes.
A. Frequency Response
A frequency generator was used to generate a
linear frequency sweep from 20 Hz to 5 kHz over 60 sec.
The output was connected to a contact speaker element
to generate acoustic vibrations through a 6 mm layer of
PDMS rubber. This arrangement mimicked the typical
thickness of tissue over a blood vessel in a vascular
access. To account for variations in surface coupling
pressure and gain differences, recordings from sensors
and the stethoscope were normalized to a −10 dB RMS
level in MATLAB. Power spectral densities from this test
revealed the frequency responses of the PVDF sensors
and the stethoscope. Generally, PVDF sensors had a
flatter frequency response and wider bandwidth.
Figure 3. Test setup for frequency response measurements.
To compare the relative frequency response of PVDF
sensors to the stethoscope, the power spectral density of
the latter was subtracted from each sensor response
(Figure 4) to normalize the sensor response to that of the
stethoscope. From this analysis several effects were
evident. First, the PVDF sensors had relatively less low-
frequency response when compared to the stethoscope,
with an average 0-dB crossover at approximately 30 Hz.
Second, they had significantly greater sensitivity in the
range of 30 – 300 Hz, and also above 700 Hz. Finally, of
the PVDF sensors, those with silicone gel backing had an
additional 3 dB gain in most frequency ranges.
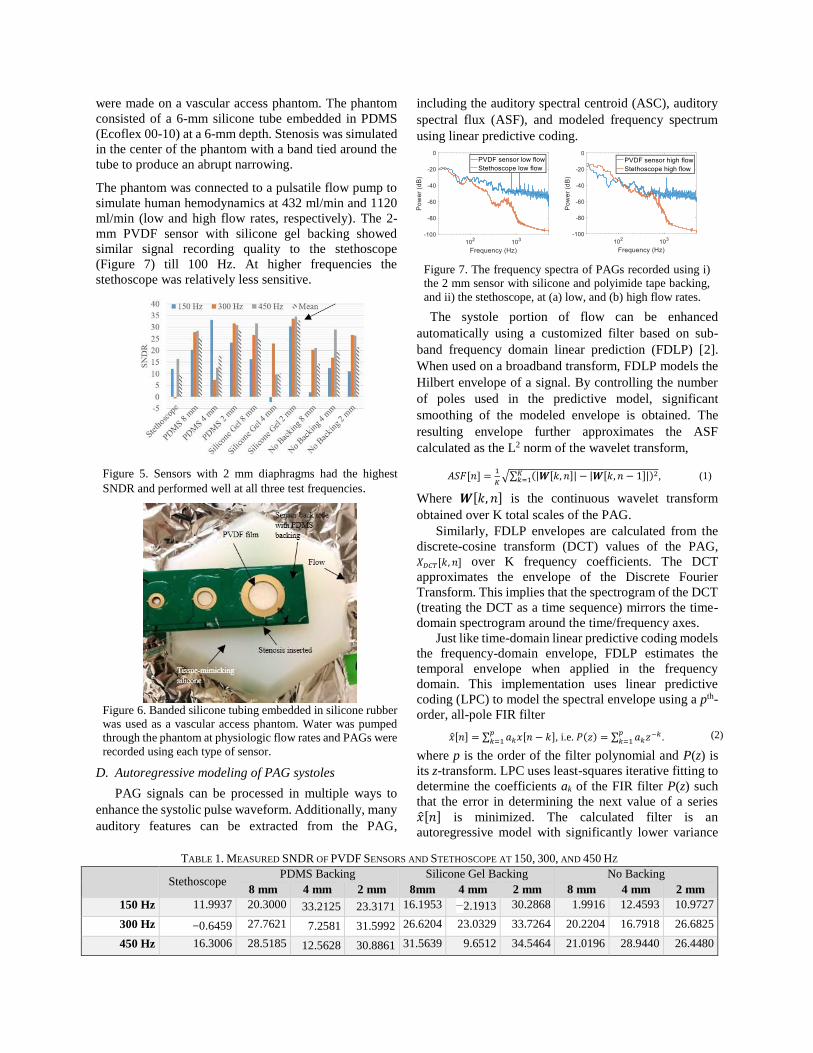
B. Single-tone response
Single tone testing was done at 3 frequencies (150,
300, and 450 Hz) using the same setup (Figure 3). To
compare the response between sensors and the
stethoscope, the SNDR was calculated (Table 1). On
average, all PVDF sensors outperformed the stethoscope,
with the 2-mm sensor plus silicone gel backing showing
the best overall SNDR (Figure 5).
C. PVDF and Stethoscope Recording of Hemoacoustics
To simulate how the sensor would perform on a real
patient (but in a controlled environment), recordings
Figure 4. Frequency response comparison between sensors with different backing layers (A-C). When plotted relative to the
stethoscope response, PVDF sensors showed enhanced mid-band and high frequency gain (D-F).
A B C
D E F
16 mm 8 mm 4 mm
2 mm Sensor Back Side
signal ground
were made on a vascular access phantom. The phantom
consisted of a 6-mm silicone tube embedded in PDMS
(Ecoflex 00-10) at a 6-mm depth. Stenosis was simulated
in the center of the phantom with a band tied around the
tube to produce an abrupt narrowing.
The phantom was connected to a pulsatile flow pump to
simulate human hemodynamics at 432 ml/min and 1120
ml/min (low and high flow rates, respectively). The 2-
mm PVDF sensor with silicone gel backing showed
similar signal recording quality to the stethoscope
(Figure 7) till 100 Hz. At higher frequencies the
stethoscope was relatively less sensitive.
Figure 5. Sensors with 2 mm diaphragms had the highest
SNDR and performed well at all three test frequencies.
Figure 6. Banded silicone tubing embedded in silicone rubber
was used as a vascular access phantom. Water was pumped
through the phantom at physiologic flow rates and PAGs were
recorded using each type of sensor.
D. Autoregressive modeling of PAG systoles
PAG signals can be processed in multiple ways to
enhance the systolic pulse waveform. Additionally, many
auditory features can be extracted from the PAG,
including the auditory spectral centroid (ASC), auditory
spectral flux (ASF), and modeled frequency spectrum
using linear predictive coding.
Figure 7. The frequency spectra of PAGs recorded using i)
the 2 mm sensor with silicone and polyimide tape backing,
and ii) the stethoscope, at (a) low, and (b) high flow rates.
The systole portion of flow can be enhanced
automatically using a customized filter based on sub-
band frequency domain linear prediction (FDLP) [2].
When used on a broadband transform, FDLP models the
Hilbert envelope of a signal. By controlling the number
of poles used in the predictive model, significant
smoothing of the modeled envelope is obtained. The
resulting envelope further approximates the ASF
calculated as the L2 norm of the wavelet transform,
𝐴𝑆𝐹[𝑛] =1
𝐾√∑ (|𝑾[𝑘, 𝑛]| − |𝑾[𝑘, 𝑛 − 1]|)2𝐾
𝑘=1 , (1)
Where 𝑾[𝑘, 𝑛] is the continuous wavelet transform
obtained over K total scales of the PAG.
Similarly, FDLP envelopes are calculated from the
discrete-cosine transform (DCT) values of the PAG,
𝑋𝐷𝐶𝑇[𝑘, 𝑛] over K frequency coefficients. The DCT
approximates the envelope of the Discrete Fourier
Transform. This implies that the spectrogram of the DCT
(treating the DCT as a time sequence) mirrors the time-
domain spectrogram around the time/frequency axes.
Just like time-domain linear predictive coding models
the frequency-domain envelope, FDLP estimates the
temporal envelope when applied in the frequency
domain. This implementation uses linear predictive
coding (LPC) to model the spectral envelope using a pth-
order, all-pole FIR filter
�̂�[𝑛] = ∑ 𝑎𝑘𝑥[𝑛 − 𝑘]𝑝𝑘=1 , i.e. 𝑃(𝑧) = ∑ 𝑎𝑘𝑧−𝑘𝑝
𝑘=1 . (2)
where p is the order of the filter polynomial and P(z) is
its z-transform. LPC uses least-squares iterative fitting to
determine the coefficients ak of the FIR filter P(z) such
that the error in determining the next value of a series
�̂�[𝑛] is minimized. The calculated filter is an
autoregressive model with significantly lower variance
TABLE 1. MEASURED SNDR OF PVDF SENSORS AND STETHOSCOPE AT 150, 300, AND 450 HZ
Stethoscope
PDMS Backing Silicone Gel Backing No Backing
8 mm 4 mm 2 mm 8mm 4 mm 2 mm 8 mm 4 mm 2 mm
150 Hz 11.9937 20.3000 33.2125 23.3171 16.1953 −2.1913 30.2868 1.9916 12.4593 10.9727
300 Hz −0.6459 27.7621 7.2581 31.5992 26.6204 23.0329 33.7264 20.2204 16.7918 26.6825
450 Hz 16.3006 28.5185 12.5628 30.8861 31.5639 9.6512 34.5464 21.0196 28.9440 26.4480
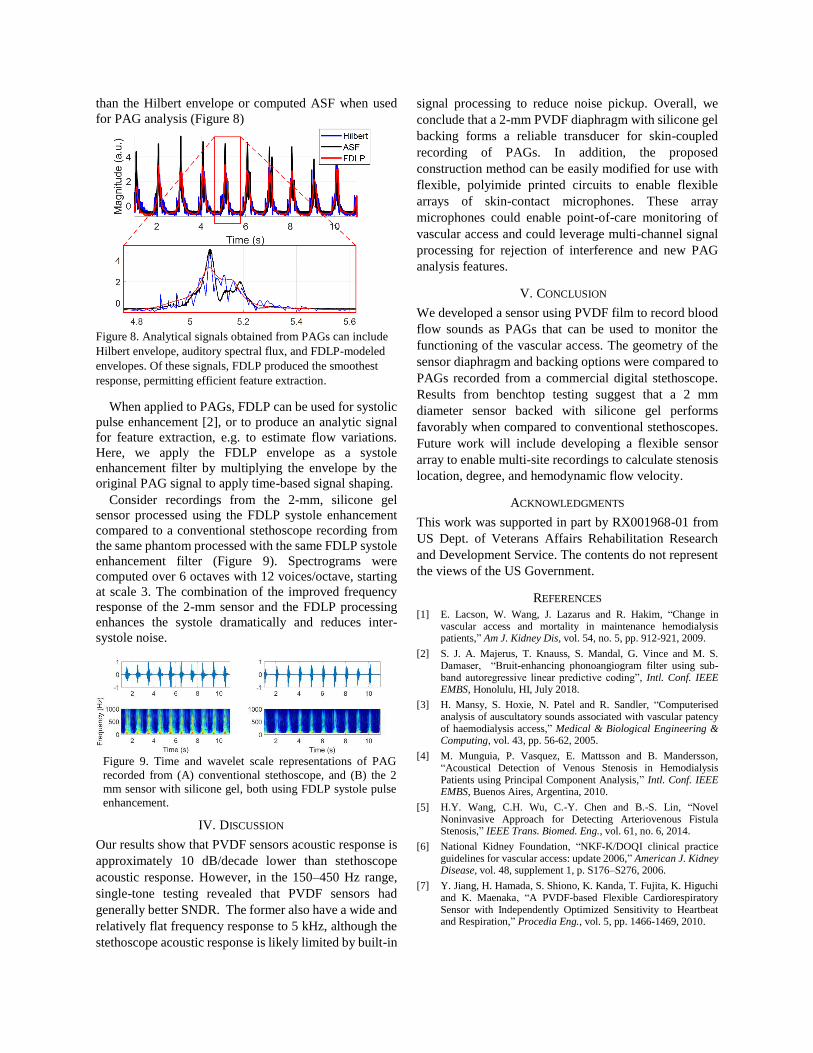
than the Hilbert envelope or computed ASF when used
for PAG analysis (Figure 8)
Figure 8. Analytical signals obtained from PAGs can include
Hilbert envelope, auditory spectral flux, and FDLP-modeled
envelopes. Of these signals, FDLP produced the smoothest
response, permitting efficient feature extraction.
When applied to PAGs, FDLP can be used for systolic
pulse enhancement [2], or to produce an analytic signal
for feature extraction, e.g. to estimate flow variations.
Here, we apply the FDLP envelope as a systole
enhancement filter by multiplying the envelope by the
original PAG signal to apply time-based signal shaping.
Consider recordings from the 2-mm, silicone gel
sensor processed using the FDLP systole enhancement
compared to a conventional stethoscope recording from
the same phantom processed with the same FDLP systole
enhancement filter (Figure 9). Spectrograms were
computed over 6 octaves with 12 voices/octave, starting
at scale 3. The combination of the improved frequency
response of the 2-mm sensor and the FDLP processing
enhances the systole dramatically and reduces inter-
systole noise.
Figure 9. Time and wavelet scale representations of PAG
recorded from (A) conventional stethoscope, and (B) the 2
mm sensor with silicone gel, both using FDLP systole pulse
enhancement.
IV. DISCUSSION
Our results show that PVDF sensors acoustic response is
approximately 10 dB/decade lower than stethoscope
acoustic response. However, in the 150–450 Hz range,
single-tone testing revealed that PVDF sensors had
generally better SNDR. The former also have a wide and
relatively flat frequency response to 5 kHz, although the
stethoscope acoustic response is likely limited by built-in
signal processing to reduce noise pickup. Overall, we
conclude that a 2-mm PVDF diaphragm with silicone gel
backing forms a reliable transducer for skin-coupled
recording of PAGs. In addition, the proposed
construction method can be easily modified for use with
flexible, polyimide printed circuits to enable flexible
arrays of skin-contact microphones. These array
microphones could enable point-of-care monitoring of
vascular access and could leverage multi-channel signal
processing for rejection of interference and new PAG
analysis features.
V. CONCLUSION
We developed a sensor using PVDF film to record blood
flow sounds as PAGs that can be used to monitor the
functioning of the vascular access. The geometry of the
sensor diaphragm and backing options were compared to
PAGs recorded from a commercial digital stethoscope.
Results from benchtop testing suggest that a 2 mm
diameter sensor backed with silicone gel performs
favorably when compared to conventional stethoscopes.
Future work will include developing a flexible sensor
array to enable multi-site recordings to calculate stenosis
location, degree, and hemodynamic flow velocity.
ACKNOWLEDGMENTS
This work was supported in part by RX001968-01 from
US Dept. of Veterans Affairs Rehabilitation Research
and Development Service. The contents do not represent
the views of the US Government.
REFERENCES
[1] E. Lacson, W. Wang, J. Lazarus and R. Hakim, “Change in vascular access and mortality in maintenance hemodialysis patients,” Am J. Kidney Dis, vol. 54, no. 5, pp. 912-921, 2009.
[2] S. J. A. Majerus, T. Knauss, S. Mandal, G. Vince and M. S. Damaser, “Bruit-enhancing phonoangiogram filter using sub-band autoregressive linear predictive coding”, Intl. Conf. IEEE EMBS, Honolulu, HI, July 2018.
[3] H. Mansy, S. Hoxie, N. Patel and R. Sandler, “Computerised analysis of auscultatory sounds associated with vascular patency of haemodialysis access,” Medical & Biological Engineering & Computing, vol. 43, pp. 56-62, 2005.
[4] M. Munguia, P. Vasquez, E. Mattsson and B. Mandersson, “Acoustical Detection of Venous Stenosis in Hemodialysis Patients using Principal Component Analysis,” Intl. Conf. IEEE EMBS, Buenos Aires, Argentina, 2010.
[5] H.Y. Wang, C.H. Wu, C.-Y. Chen and B.-S. Lin, “Novel Noninvasive Approach for Detecting Arteriovenous Fistula Stenosis,” IEEE Trans. Biomed. Eng., vol. 61, no. 6, 2014.
[6] National Kidney Foundation, “NKF-K/DOQI clinical practice guidelines for vascular access: update 2006,” American J. Kidney Disease, vol. 48, supplement 1, p. S176–S276, 2006.
[7] Y. Jiang, H. Hamada, S. Shiono, K. Kanda, T. Fujita, K. Higuchi and K. Maenaka, “A PVDF-based Flexible Cardiorespiratory Sensor with Independently Optimized Sensitivity to Heartbeat and Respiration,” Procedia Eng., vol. 5, pp. 1466-1469, 2010.