skills audit analysis results, 2011 - unsiap.or.jp ip-2 skill… · skills audit analysis ... most...
TRANSCRIPT
1
SKILLS AUDIT ANALYSIS RESULTS, 2011
Compiled by the Secretariat of the Pacific Community (SPC)
Statistics for Development Division (SDD) at the request of the
Pacific Statistics Steering Committee (PSSC)
Distributed on 18 July, 2013 for participants of the 4th Regional Conference of Heads of
Statistics and Planning, Nouméa, New Caledonia, July 22-26, 2013

2
1 Background An NSO staff skills audit was undertaken in late 2011, focusing on all countries and US territories (18)
where SPC is engaged in regular training; all countries and territories participated except for PNG
resulting in the participation by 17 countries. French territories were excluded, as our training
activities are very limited there, given the provision of assistance coverage from Paris.
It is important to state up-front when considering the provision of skills training by various statistical
providers, that this audit provides a snapshot of the situation prevailing in these offices at the time.
Given the high degree of staff turn-over, more often than not involving trained staff leaving for
employment elsewhere, this has an obvious impact on the training profile of key training providers
in the region, such as SPC, SIAP, PFTAC, USP, UN Agencies and the statistical agencies of Australia
and New Zealand. It also means that any staff recruited since the audit are not covered in the results
of this report.
In general, the focus of this first report is to provide an overview and a general snapshot of the
major findings.
2 Executive Summary Office Profile
The total number of staff surveyed was 224, covering every staff working in these 17 offices, with
staff numbers ranging from 44 in Samoa to 1 in Tokelau.
4 NSOs had a staff contingent of 25 staff or more (24%), with 8 of the 17 NSOs surveyed having less
than 5 staff (47%).
The mean age of staff was 38 (median 37), with ages ranging from 19 to 80 (not a typo).
53 percent of NSO staff were women, with Guam (72%) and Tonga (70%) employing the highest
proportion of female staff. This gender parity, however, does not quite translate across job levels,
showing a substantial divergence in male and female employment across broad categories. Senior
management remains the domain of men, with only 2 of 21 Pacific Island NSOs currently headed by
women, whereas administrative support is 100 percent “women only” (Figure 3.16).
On average, length of service totals 12 years – with the Solomon Islands (19) and Guam (18) having
the longest established workforce, with staff in Samoa, Vanuatu and Tuvalu showing an average of 7
years of service.
Contrary to popular belief, most NSO staff worked in economic divisions (34%), followed by social
and demographic statistics (26%).
79 percent of staff were employed at the professional level, with just 21 percent engaged as support
staff or junior officers. The Solomon Islands (50%) and Cook Islands (40%) employed the largest
proportion of senior professionals. Tonga (41%), Guam (33%) and Samoa (32%) had the largest
proportion of statistical support staff.
3
Job Duties
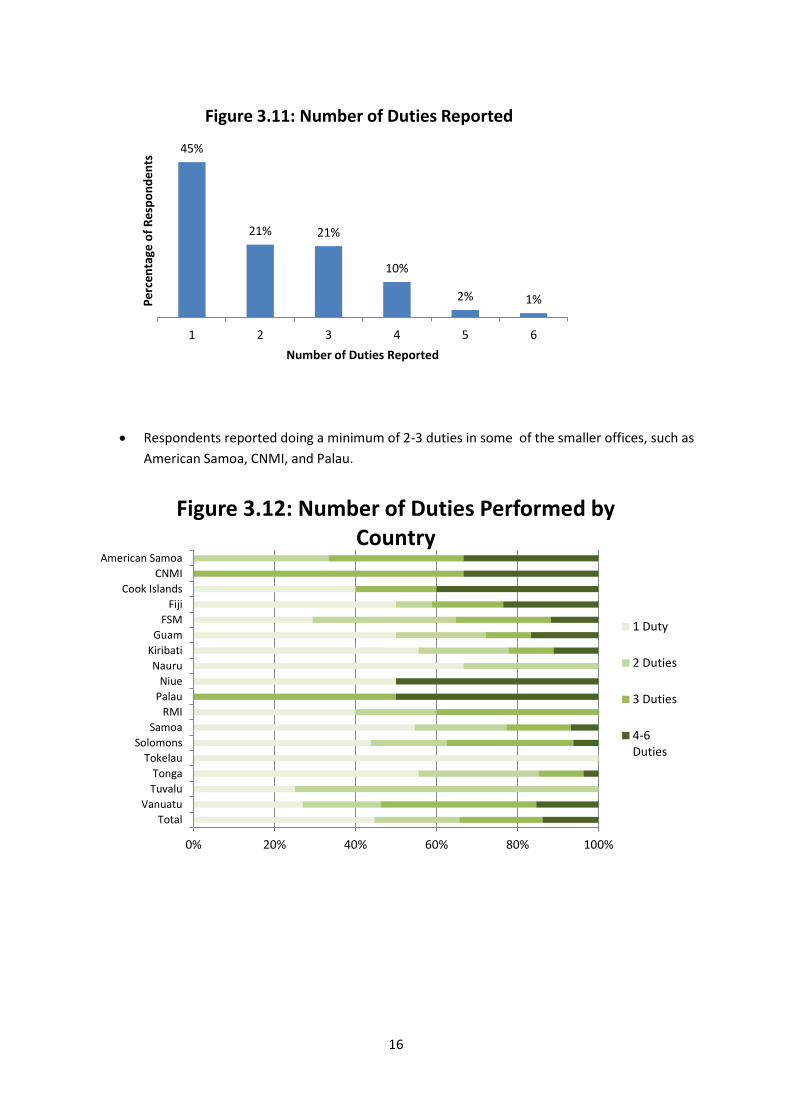
On average, staff performed 2 different duties. 45 percent reported having one principal duty, 21
percent reported 2 or 3 duties, 10 percent covering 4 duties, and 3 percent multi-tasking 5 or more
duties. Reported duties were aggregated into 17 different job tasks.
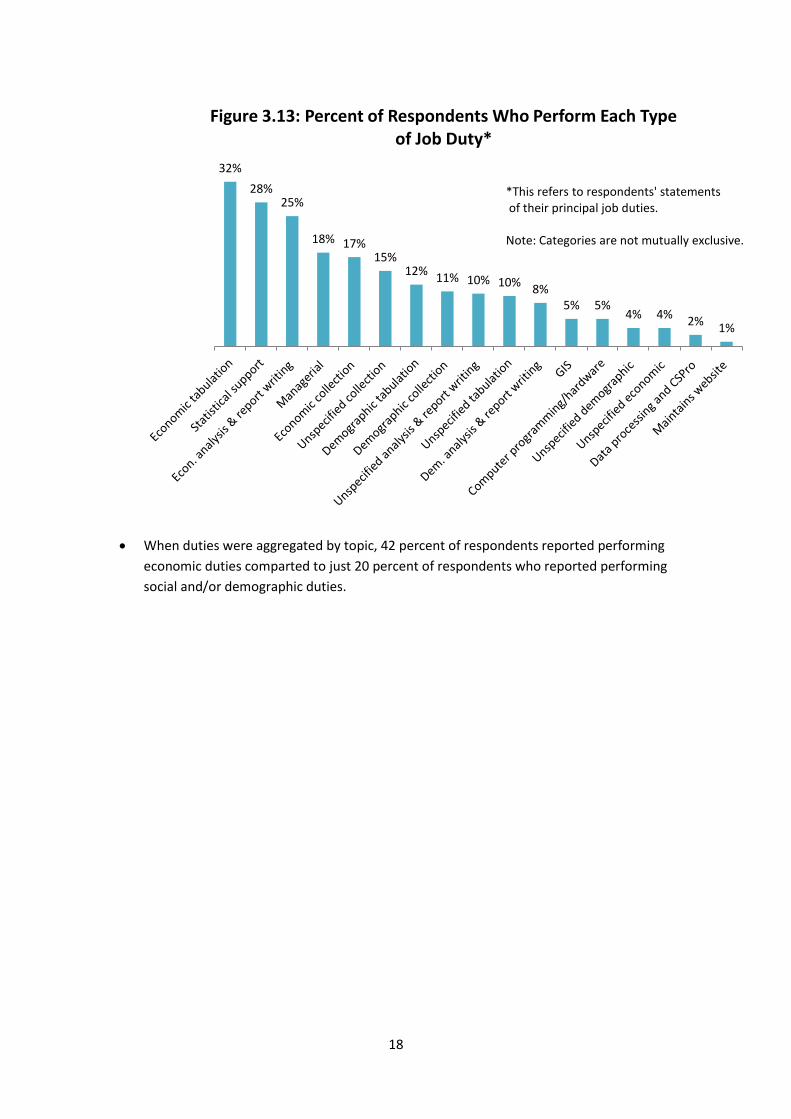
Producing economic statistics tables was the most commonly reported job duty, involving one in
three NSO staff (32%), followed by statistical support (28%) and economic analysis and report
writing (25%).
It is worth noting that 3 of the 5 most commonly reported duties were economics-related, with data
processing (2%) and website maintenance (1%) the least frequently reported duties.
Aggregating the 17 main job duties, 42 percent of NSO staff undertook economic statistical-related
tasks, which was twice the percentage of staff working in the social and demographic area (20%).
Formal statistical Training summary
NSO staff averaged 3 participations in formal training events, ranging from formal and thematic
short-term workshops or seminars, to the six-month SIAP course in official statistics (university
courses are excluded here, and will be addressed in a separate section).
24 per cent of staff never attended any formal training, with one person managing 32 such training
events.
Quite marked contrasts emerge between countries, with Kiribati averaging 6 such training events,
closely followed by FSM, RMI, Solomon Islands, and Tuvalu with 5 each.
Male NSO staff accessed more training opportunities on average (4) compared to women (2.6).
Education
This section covers four areas pertaining to NSO staff’s educational background: (i) highest level of
secondary education completed; (ii) highest level of post-secondary education attended; (iii) highest
level of post-secondary education completed: and (iv) highest post-secondary qualifications
achieved.
i. highest level of secondary education completed More than half of respondents completed Form 7 or equivalent of High School (56%), 28
percent completed Form 6, 10 percent completed Form 5, and 5 per cent left school before
completing Form 5.
ii. highest level of post-secondary education attended One in two NSO staff has attended university (49%), 18 percent attended Community College
(13%) or a poly-technical institute or TAFE (5%), with one in three (32%) listing no post-
secondary education attended.
iii. highest level of post-secondary education completed

4
41 percent completed a university education, 15 percent completed Community College
(13%) or a poly-technical institute or TAFE (2%). Levels of completed post-secondary
education varied quite markedly between countries.
iv. highest post-secondary qualifications achieved One in three NSO staff completed either a degree (29.5%) or a Masters (6.7%), and one in
four obtained either a diploma (14.3%) or a certificate (10.3%).
Post-secondary education by job duties
Table 4.1 provides a comprehensive account of highest post-secondary educational qualifications
achieved against the seventeen principal job categories.
While 61 per cent of all statistical leaders and those undertaking managerial duties have university
qualifications, having achieved either a degree (39%) or Masters (22%), a very diverse picture
emerges across the remaining job categories. This may have significant implications on future
statistical training and capacity building strategies.
While a university degree is not itself a guarantee for statistical capacity or excellence, Table 4.1
highlights some worrying features. The primary concerns being:
about half of the NSO staff involved in demographic (54.2%) or economic collections (48.7%) have no post-secondary educational/professional qualifications
a similar pattern emerged with regards to demographic tabulations/compilations (59.3%) and economic tabulations/compilations (41.7%), and
far too many people involved in demographic (42.1%) or economic (43.9%) analysis and report writing not having experienced technical training from a post-secondary education , skills which a secondary school education simply cannot provide.
This picture is deeply worrying, and needs urgent attention by PSSC, given its intent to developing a
long-term Pacific statistical training strategy.
Job-Specific Training - General
The objective here was to establish the prevalence of job-specific training for staff to perform the
principal duties they engaged in – irrespective of whether this training was provided on the job, by a
supervisor or senior colleagues, or in a more formal learning environment such as attending specific
technical workshops or professional attachments provided by different statistical training providers.
Since the emphasis was on current activities, this covers both new staff (induction type activities) or
staff working in new positions. With many staff having had different job duties during their working
life at the NSO, job-specific training for each job cannot be established.
5
Most staff (73%) indicated they did indeed receive job-specific training for the activities they are
currently engaged in. On average, staff experienced between 2 and 3 of such trainings, with 17
percent stating that they had received 4 or more such opportunities.
Of this group, the vast majority (87%) participated in formal training events provided by different
statistical training providers such as SIAP, SPC, USP, UN agencies, statistical agencies of Australia, NZ
and the US, PFTAC, IMF, and the World Bank. Most staff (72%) had exposure to between 1 and 3
such opportunities.
The three most commonly referred to trainings covered census/survey planning (34.8%),
specialized-thematic workshops (34.1%) and Data analysis and Report Writing workshops (26.8%).
Around 10 percent of staff were trained in data processing, leadership/project management type
activities, and introduction to basic computer skills.
The three most common training providers for Pacific island statistical agencies, in terms of staff
numbers having attended courses, were SPC (41.5%), SIAP (29.9%) and trainings received in-house
by colleagues of the respective NSO (27.4%).
Job-Specific Training – by duty of respondents
A substantial training gap exists between current professional work undertaken by NSO staff, and
formal training received in this particular field of activity (Table 5.1). Most staff working across each
of the 17 major task categories have not been exposed to formal training in the areas they currently
work in.
Notable exceptions are
the two staff who claim website maintenance is their principal duty, and who both have been exposed to programming and web-design training; and
people engaged in managerial duties, many of who have been exposed to specialized/thematic/ technical training (51.2%), census and survey planning (36.6%), Data analysis and Report writing (26.8%) and Leadership/Project management courses (24.4%)
When it comes to the majority of NSO staff performing core statistical business, such as data
collection, tabulations, analysis and report writing, the training gap is substantial. This is, in our
view, one of the more worrying findings of this skills audit, requiring urgent attention, including a
better dialogue between training providers and NSOs, and improved governance arrangements
pertaining to the organization and management of such learning events.
Job-Specific Training Sufficiency
Apart from a not always perfect fit between technical job demands and having had access to job-
specific training, a second major finding is that only one in three people having received job-specific
training (38%) believed this training to be sufficient to do a competent job in their office.

6
Nearly half of all staff having received job-specific in specialized fields (44.6%) stated they require further training in this area;
the same applies to staff having been exposed to Data processing (CSPro) training, with one in three expressing the need for more training (38.1%); and
one in four people having attended Data analysis and Report writing training (27.3%) or leadership/ project management courses (23.5%) stated they require further training in these fields
While these findings should not come as a surprise considering that most such learning events are of
a short-term duration (with the exception of the 6 month SIAP course in official statistics), these
findings should alert the PSSC TWG on statistical training given the substantial investment in time
and resources in such training.
In terms of what NSO staff identified as their own specific training needs, one in four staff (24.6%)
was interested in specialized thematic courses (e.g. economic and social/demographic topics and
methods) , Data Analysis and Report Writing (18.3%) – ahead of basic computer skills (12.5%),
census and survey planning (12.1%) and data processing (9.8%).
Of staff who never received any job-specific training, basic computer courses (29%) and specialized/
thematic courses top the list, ahead of Data Analysis and Report Writing (17%) and census and
Survey planning (17%).
General Statistical Training and Training providers
Apart from job-specific training received, 61 percent of NSO staff indicated they had participated in,
on average, two additional statistical training events.
The most popular training received was in Data analysis and Report writing, attended by 24 percent
of all 224 NSO staff surveyed, followed by census and survey planning (16.5%), the SIAP six-month
introductory course in official statistics (16.1%), Data processing (14.3%), National Accounts/BoP
(12.1%), and the SPC-SIAP Three-week introductory course in general statistical concepts and
procedures (10.3%).
One out of three NSO staff have taken courses provided by SPC (36%) and SIAP (30.4%), which
together with UN technical agencies (19.2%) are the main providers of statistical training in the
region.
Other Statistical Skills
Staff were also asked to identify other professional skills they have that they consider useful to help
them in their job (Table 7.1).
More than half claimed skills in spread sheets (78%), data analysis (64%), report writing (64%) and databases (51%). While this may look as a distinct positive, it could be argued that work in a statistical agency might call for universal coverage in spreadsheet proficiency, and a higher skill coverage working with databases.
7
46 percent indicated having data processing skills, and 24 per cent claimed GIS skills – a surprise finding from where we sit, as this is something clearly not reflected in statistical outputs in most NSOs.
Across the 10 skills identified, formal training by training providers played a major role in the areas of data analysis, report writing, GIS, project management and web publishing (Table 7.1, 7.2 and 7.3).
NSO focused/on the job-training by colleagues played a major role in acquiring skills with spreadsheets, data processing, database work and accounting;
IT skills, in most cases, were self-taught, or learned on the job.
Where people identified they acquired “other” skills from formal training providers, SPC , SIAP and
USP are listed as the main providers (Table 7.3). Having said this, some care is advised in reading too
much into this, considering the large proportion of respondents who failed to list the training
provider – 29 percent or more of responses were unspecified.
Despite claiming some proficiency across many skills not necessarily related to the respondents’
principal duties, more than half of respondents indicated a need for further training in 8 of the 10
different skills.
Training Summary
Combining staff exposure to the various types of training they have been exposed to – job-specific
training, general statistical training, and formal trainings in “other” skills shows the following:
more than half of all NSO staff claim to have had some exposure to data analysis and report writing (55.4%);
one in three had some formal training in census/survey planning (34.4%) and basic computer skills (33.9%), followed by data processing (30.8%); and
one in five received formal training in project management and working with databases.
Matching formal training in these various areas with the duties staff currently undertake supports an
earlier observation about skill gaps in specific sectors. Furthermore, it highlights additional NSO
management challenges dealing with skill loss and mismatches between available skills (in the
office) which are not applied to related jobs, due to career development (promotion) or changing
duty requirements. Table 8.1 illustrates this quite succinctly.
On the positive side, staff involved in data analysis and report writing had the highest level of complementary skill training, with between 51 and 74 percent claiming to have received formal training in this field.
A similar picture emerges amongst those undertaking managerial duties, with nearly 50% having attended formal leadership and/or project management training, and two out of three having received training in census and survey planning.
More problematic challenges emerge when it comes to one of the core activities of any NSO – statistical tabulations, where formal training in database management was very low (22-26%), and only between 36.1 and 51.9 per cent had formal training in data processing, and between 33.3 and 55.6 percent had formal training in basic computer skills.

8
And amongst statistical support staff, only 29 percent have had some formal training in basic computer skills, including spreadsheets.
3 A General Profile of the Offices
3.1 Office size
NSOs in the Pacific region ranged in size from 44 staff members to 1 staff member.
The average office size was about 10 staff, while the median was slightly larger at 12 staff.
Table 3.1: National Statistical Office Staff Profiles in the Pacific Region
Number of Staff Mean 9.9
Median 12
Minimum 1
Maximum 44
Number of Offices with 5 or Less People 8
Percent of Offices with 5 or Less People 47.1%
N=224
Samoa was the largest office with 44 staff members. Tokelau was the smallest, employing
just 1 person.
Almost 50 percent of offices in the region had 5 staff or less (47%). This equated to 8 of the
17 offices surveyed.
Five offices (29%) had employed 6-15 staff members.
9
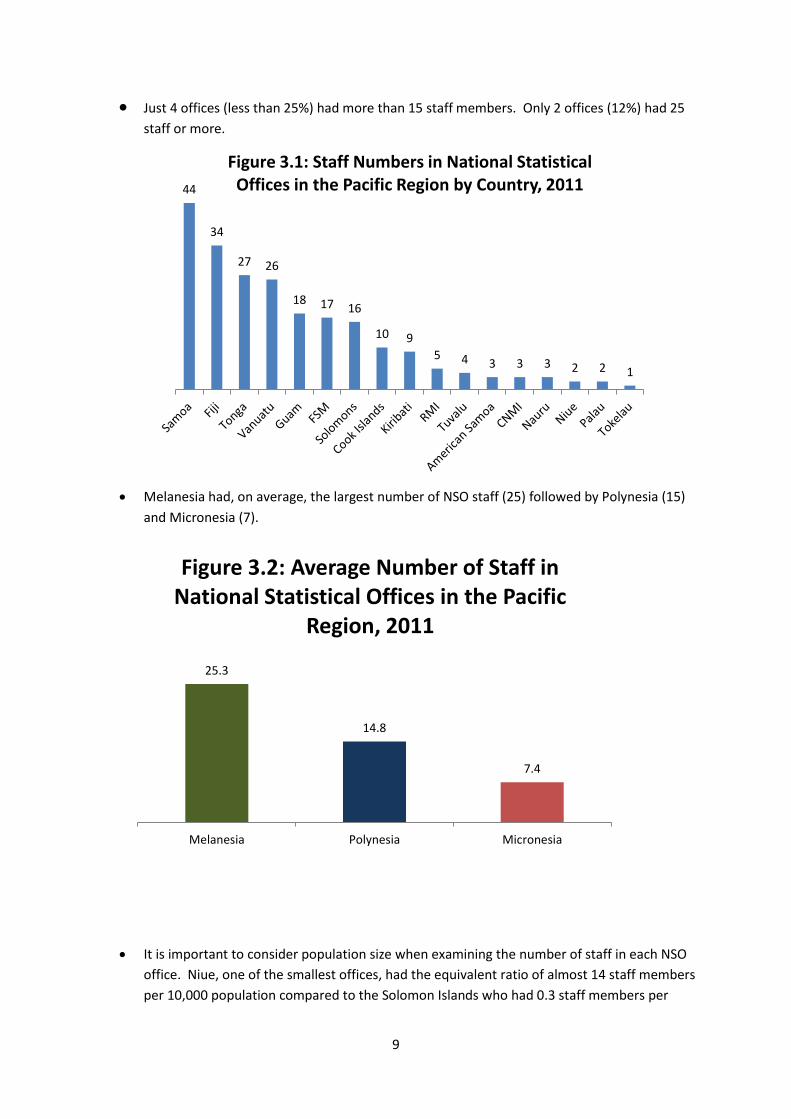
Just 4 offices (less than 25%) had more than 15 staff members. Only 2 offices (12%) had 25
staff or more.
Melanesia had, on average, the largest number of NSO staff (25) followed by Polynesia (15)
and Micronesia (7).
It is important to consider population size when examining the number of staff in each NSO
office. Niue, one of the smallest offices, had the equivalent ratio of almost 14 staff members
per 10,000 population compared to the Solomon Islands who had 0.3 staff members per
44
34
27 26
18 17 16
10 9
5 4 3 3 3 2 2 1
Figure 3.1: Staff Numbers in National Statistical Offices in the Pacific Region by Country, 2011
25.3
14.8
7.4
Melanesia Polynesia Micronesia
Figure 3.2: Average Number of Staff in National Statistical Offices in the Pacific
Region, 2011

10
10,000 population. Niue only had a population of 1,446 in 2011 and an NSO with 2 staff
members. The Solomon Islands had a population of 553,254 in 2011 (a population 382 times
larger than Niue’s) and an office of 16 staff.
While smaller offices may find it difficult to complete all the tasks required of them with a
staff of less than 5, it may not be necessary to have an office as large as some of the more
populous countries. It is necessary to have the appropriate balance between the complexity
of duties undertaken and the number of staff required to perform these duties.
3.2 Age, Sex, and Years Working in the NSO
The average age of office staff was 38 and median age was 37.
The youngest staff member was 19 while the oldest was 80.
Micronesia had the oldest mean age at 42 years, followed by Melanesia (38), and Polynesia
(36).
05101520253035404550
0
2
4
6
8
10
12
14
16
Off
ice
sie
ze
Staf
f p
er
10
,00
0 p
op
ula
tio
n
Figure 3.3: Staff per 10,000 Population and Office Size
Office size
Staff per10,000population
42
51
41 39 39 38 42
38 35 36
39 38 35 33
38
Figure 3.4: Mean Age by Country and Region
Note: Countries with 3 or less staff are not displayed for confidentiality purposes. Regions and total include all 17 countries.

11
Table 3.2: Age of Office Staff
Mean 38
Median 37
Minimum 19
Maximum 80
Only 20 percent of staff were under age 30 while about 28 percent of staff were aged 45 and
older.
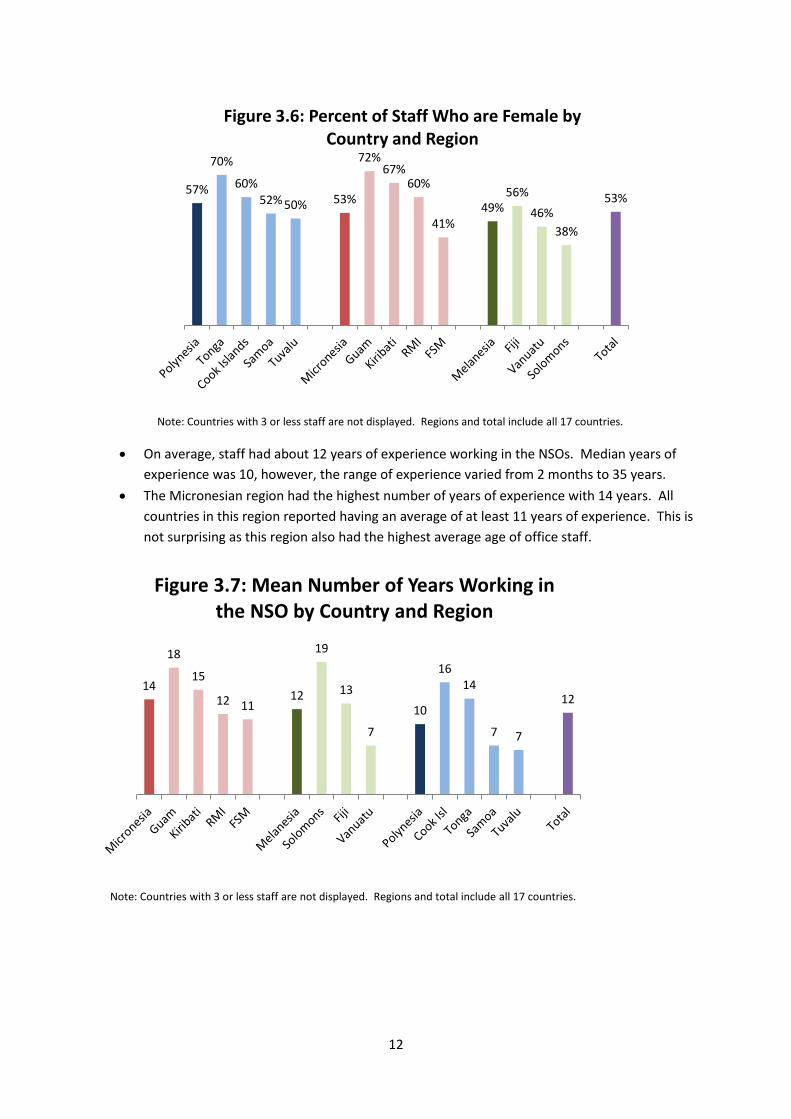
Overall, 53 percent of staff were women. Polynesia was the region with the highest
percentage of female staff (57%). All NSOs in the Polynesian region employed at least 50
percent female staff.
Guam (72%) and Tonga (70%) had large percentages of female staff while Solomon Islands
(38%) and FSM (41%) experienced the lowest.
Gender will be explored in more detail in section 3.6.
8.5%
11.6%
30.4%
21.4%
17.9%
9.8%
Figure 3.5: Percent Distribution of Staff by Age Group
19-24
25-29
30-37
38-44
45-49
50+
Age Group
12
On average, staff had about 12 years of experience working in the NSOs. Median years of
experience was 10, however, the range of experience varied from 2 months to 35 years.
The Micronesian region had the highest number of years of experience with 14 years. All
countries in this region reported having an average of at least 11 years of experience. This is
not surprising as this region also had the highest average age of office staff.
57%
70%
60% 52% 50% 53%
72% 67%
60%
41% 49%
56%
46%
38%
53%
Figure 3.6: Percent of Staff Who are Female by Country and Region
Note: Countries with 3 or less staff are not displayed. Regions and total include all 17 countries.
14
18
15
12 11 12
19
13
7
10
16 14
7 7
12
Figure 3.7: Mean Number of Years Working in the NSO by Country and Region
Note: Countries with 3 or less staff are not displayed. Regions and total include all 17 countries.
13
Table 3.3: Number of years working in the NSO
Mean 11.9
Median 10.0
Minimum .17
Maximum 35.0
3.3 Job Title and Divisional Category
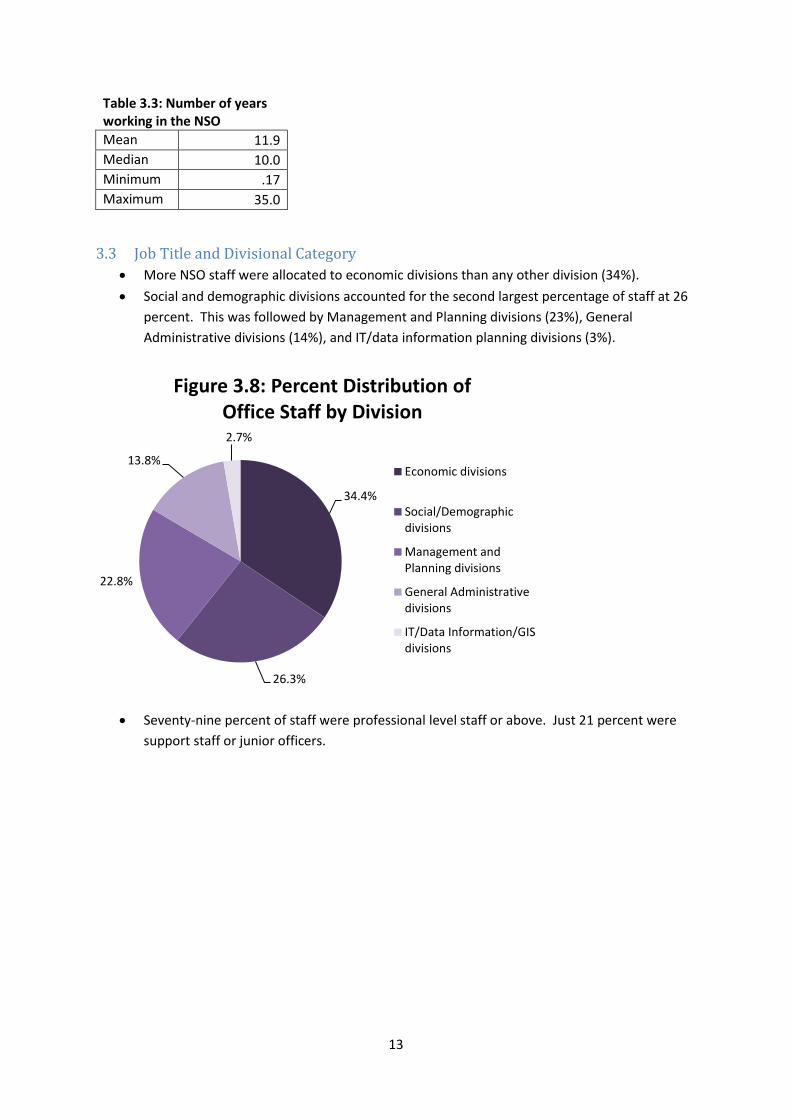
More NSO staff were allocated to economic divisions than any other division (34%).
Social and demographic divisions accounted for the second largest percentage of staff at 26
percent. This was followed by Management and Planning divisions (23%), General
Administrative divisions (14%), and IT/data information planning divisions (3%).
Seventy-nine percent of staff were professional level staff or above. Just 21 percent were
support staff or junior officers.
34.4%
26.3%
22.8%
13.8%
2.7%
Figure 3.8: Percent Distribution of Office Staff by Division
Economic divisions
Social/Demographicdivisions
Management andPlanning divisions
General Administrativedivisions
IT/Data Information/GISdivisions
14
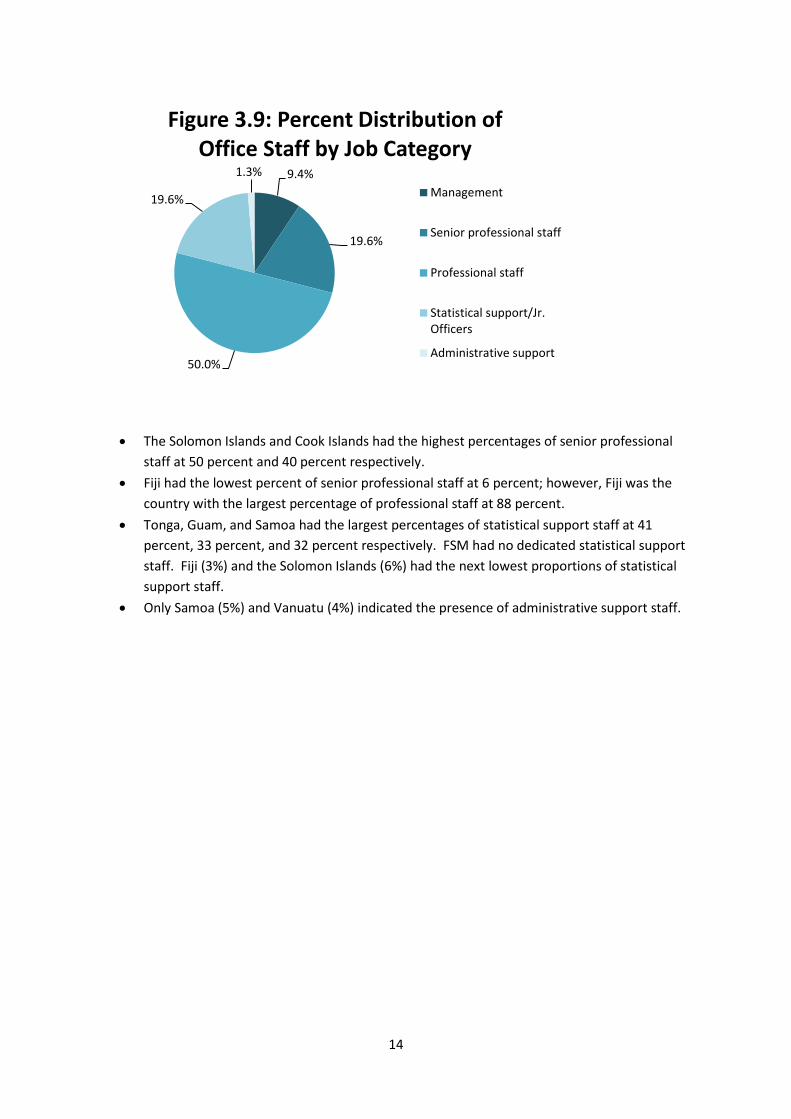
The Solomon Islands and Cook Islands had the highest percentages of senior professional
staff at 50 percent and 40 percent respectively.
Fiji had the lowest percent of senior professional staff at 6 percent; however, Fiji was the
country with the largest percentage of professional staff at 88 percent.
Tonga, Guam, and Samoa had the largest percentages of statistical support staff at 41
percent, 33 percent, and 32 percent respectively. FSM had no dedicated statistical support
staff. Fiji (3%) and the Solomon Islands (6%) had the next lowest proportions of statistical
support staff.
Only Samoa (5%) and Vanuatu (4%) indicated the presence of administrative support staff.
9.4%
19.6%
50.0%
19.6%
1.3%
Figure 3.9: Percent Distribution of Office Staff by Job Category
Management
Senior professional staff
Professional staff
Statistical support/Jr.Officers
Administrative support

15
3.4 Reported Job Duties
Respondents were asked to write in their principal job duties in the first section of the
questionnaire. Job duties were analyzed and reclassified into 17 distinct tasks. Respondents
were assigned as many different tasks as they listed in the response section. Because of this,
it was possible for respondents to have 1 duty or as many as 17 duties.
Some care is advised in interpretting these findings as some people may have answered this
question in line with what duties they were performing at the time, and excluded other
duties that are part of their general job description. In this respect, this survey may be best
regarded as a snapshot rather than an all-ecompassing explanation of the range of job duties
undertaken by an individual.
On average, respondents reported performing 2 different job duties.
Forty-five percent of respondents reported 1 job duty, 21 percent reported 2 or 3 job duties,
and 10 percent reported 4 job duties.
Just 3 percent of respondents reported 5-6 job duties
0% 20% 40% 60% 80% 100%
Solomons
Cook Islands
FSM
Samoa
Vanuatu
Kiribati
Guam
Tonga
Fiji
Total
Figure 3.10: Percent Distribution of Office Staff by Job Category by Country
Management
Senior professionalstaff
Professional staff
Statisticalsupport/Jr. Officers
Administrativesupport
Note: Countries with 5 or less staff are not displayed. Total includes all 17 countries.
16
Respondents reported doing a minimum of 2-3 duties in some of the smaller offices, such as
American Samoa, CNMI, and Palau.
45%
21% 21%
10%
2% 1%
1 2 3 4 5 6
Pe
rce
nta
ge o
f R
esp
on
de
nts
Number of Duties Reported
Figure 3.11: Number of Duties Reported
0% 20% 40% 60% 80% 100%
American Samoa
CNMI
Cook Islands
Fiji
FSM
Guam
Kiribati
Nauru
Niue
Palau
RMI
Samoa
Solomons
Tokelau
Tonga
Tuvalu
Vanuatu
Total
Figure 3.12: Number of Duties Performed by Country
1 Duty
2 Duties
3 Duties
4-6Duties

17
Countries with 1-5 staff members reported performing more duties, on average, than the larger
countries.
Economic tablulation was the most commonly reported job duty (32%) followed by
statistical support (28%) and economic analysis and report writing (25%).
It is worth noting that 3 of the 5 most commonly reported job duties were economically-
related.
Some of the least commonly-reported duties were IT-related, such as using GIS (5%),
performing computer programming and building computer hardware (5%), and maintaining
the website (1%).
Only 2 percent of respondents listed data processing and using CSPro as one of their job
duties.
0% 20% 40% 60% 80% 100%
30+ staff
20-29 staff
6-19 staff
1-5 staff
Total
Figure 3.12: Percent Distribution of Number of Duties Performed by Office Size
1 Duty
2 Duties
3 Duties
4-6Duties
18
When duties were aggregated by topic, 42 percent of respondents reported performing
economic duties comparted to just 20 percent of respondents who reported performing
social and/or demographic duties.
32%
28% 25%
18% 17% 15%
12% 11% 10% 10%
8% 5% 5%
4% 4% 2%
1%
Figure 3.13: Percent of Respondents Who Perform Each Type of Job Duty*
*This refers to respondents' statements of their principal job duties. Note: Categories are not mutually exclusive.

19
Eighteen percent of respondents listed managerial duties while 11 percent indicated they
performed IT-related duties.
With the exception of the Cook Islands, less than 50 percent of staff reported performing
social and/or demographic duties.
In all countries, more staff reported performing economic-related duties than social and
demographic-related duties.
Only 4 countries had staff who reported doing data processing and/or CSPro duties.
Three countries did not have any staff who reported performing IT-related duties such as
website maintenance, GIS use, or computer maintenance.
42%
28%
21% 20% 18%
11%
2%
Figure 3.14: Percent of Respondents Who Perform Each Type of Job Duty*
*This refers to respondents' statements of their principal job duties. Note: Categories are not mutually exclusive and have been aggregated.

20
Table 3.4: Percent of Staff Who Perform Each Duty By Country*
Countries Managerial Economic duties
Demographic duties
Unspecified statistical duties
Data processing/ CSPro
GIS /computer/ website/IT
Statistical support
Cook Islands 10.0 70.0 50.0 0.0 0.0 10.0 0.0
Fiji 14.7 41.2 23.5 17.6 0.0 23.5 20.6
FSM 23.5 47.1 11.8 58.8 0.0 5.9 5.9
Guam 16.7 38.9 11.1 16.7 0.0 5.6 55.6
Kiribati 22.2 77.8 22.2 11.1 0.0 0.0 0.0
RMI 20.0 20.0 0.0 60.0 20.0 20.0 40.0
Samoa 15.9 34.1 11.4 13.6 4.5 11.4 43.2
Solomons 6.3 43.8 25.0 18.8 0.0 0.0 18.8
Tonga 11.1 29.6 14.8 14.8 3.7 11.1 40.7
Tuvalu 25.0 75.0 25.0 25.0 0.0 0.0 25.0
Vanuatu 30.8 30.8 23.1 26.9 3.8 11.5 30.8
Countries with 3 or less staff 35.7
57.1 42.9 21.4 0.0 7.1 7.1
Total 18.3 41.5 20.1 21.0 2.2 10.7 28.1 *This refers to respondents' statements of their principal job duties. Note: Categories are not mutually exclusive and have been aggregated.
21
3.5 Formal Trainings
3.5.1 Formal Training Summary
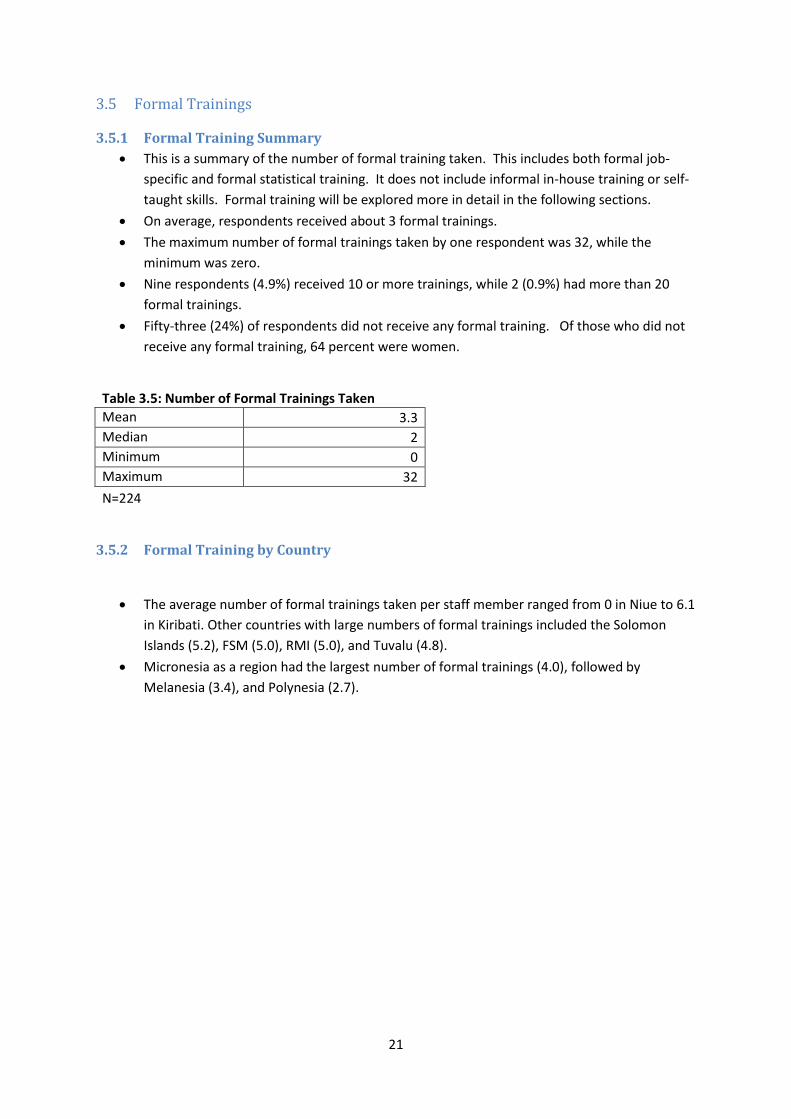
This is a summary of the number of formal training taken. This includes both formal job-
specific and formal statistical training. It does not include informal in-house training or self-
taught skills. Formal training will be explored more in detail in the following sections.
On average, respondents received about 3 formal trainings.
The maximum number of formal trainings taken by one respondent was 32, while the
minimum was zero.
Nine respondents (4.9%) received 10 or more trainings, while 2 (0.9%) had more than 20
formal trainings.
Fifty-three (24%) of respondents did not receive any formal training. Of those who did not
receive any formal training, 64 percent were women.
Table 3.5: Number of Formal Trainings Taken
Mean 3.3
Median 2
Minimum 0
Maximum 32
N=224
3.5.2 Formal Training by Country
The average number of formal trainings taken per staff member ranged from 0 in Niue to 6.1
in Kiribati. Other countries with large numbers of formal trainings included the Solomon
Islands (5.2), FSM (5.0), RMI (5.0), and Tuvalu (4.8).
Micronesia as a region had the largest number of formal trainings (4.0), followed by
Melanesia (3.4), and Polynesia (2.7).

22
3.6 Gender
While it might appear that there is near equality in the number of men and women in the
NSOs of the Pacific region, there is actually a high level of divergence based on level of job
category. A higher percentage of men occupy higher level jobs compared to women. The
higher proportion of women in Pacific NSOs can partially be accounted for by the large
percentage of female support staff.
Only 24 percent of respondents in managerial job categories were women and just 2 of the
21 Pacific Islands Statistics Offices are headed by a woman.
Conversely, 100 percent of administrative support personnel and 73 percent of statistical
support personnel were women.
Only 71 percent of women fell in the “professional” job-title category or above, compared to
89% of men. Amongst senior professional staff, men (57%) outnumbered women (43%)
with a reverse picture emerging amongst professional staff (46% males compared to 54%
females).
Female senior professional staff had about 2 more years of experience than senior male
professional staff (data not shown).
4.0
6.1
5.0 5.0
3.3
2.4 2.0
1.5
3.4
5.2
3.6
2.0
2.7
4.8
2.9 2.9 2.5 2.3
2.0
0.0
3.3
Mic
ron
esi
a
Kir
ibat
i
FSM
RM
I
Nau
ru
Gu
am
CN
MI
Pal
au
Me
lan
esia
Solo
mo
ns
Fiji
Van
uat
u
Po
lyn
esia
Tuva
lu
Co
ok
Isla
nd
s
Sam
oa
Ton
ga
Am
eric
an
Toke
lau
Niu
e
Tota
l
Figure 3.15: Mean Number of Formal Trainings Taken by Country and Region

23
When examining job duties, it emerges that a much larger number of women perform managerial
duties than their job titles might suggest. Of the respondents who reported performing managerial
duties, 37 percent were women compared to the 24 percent of managers that were women.
Looking at job duties, a larger share of women perform statistical support duties than their
job titles might suggest. Within the statistical support job title category, 73 percent of staff
were women. However, Of the respondents who reported performing statistical support
duties, 83 percent were women.
0.0%
20.0%
40.0%
60.0%
80.0%
100.0%
120.0%
Figure 3.16: Job Category by Sex
Female
Male
37%
63%
Figure 3.17: Percent of Staff Who Reported Performing Managerial
Duties by Sex
Female
Male
N=41

24
Furthermore, men received more formal training opportunities than did women on average
(4.0 for men compared to 2.6 for women).
3.7 AGE
All managers were aged 35 and older.
A little more than three-quarters (77%) of professional staff were aged 35 and older.
About 50 percent of professional staff were under age 35.
83%
17%
Figure 3.18: Percent of Staff Who Reported Performing Statistical Support
Duties by Sex
Female
Male
N=63
4.0
2.6 3.0
2.0
Men Women
Figure 3.19: Mean and Median Formal Trainings Taken by Sex
Mean
Median

25
4 Education Respondents were asked to answer 4 questions pertaining to their educational background,
specifically what was their highest level of secondary education completed, highest level of
post-secondary attended, highest level of post-secondary completed, highest post-
secondary qualification achieved?
4.1 Secondary Education More than half (56%) of respondents completed Form 7, 28 percent completed Form 6, 10
percent only completed Form 5, and 5 percent left school before completing Form 5.
Note: A key translating the equivalence between Form, Year, and Grade can be found in the
appendix. For comparison purposes, we report Year completed.
0% 20% 40% 60% 80% 100%
Management
Seniorprofessional
Professional
Statisticalsupport
Figure 3.20: Percent Distribution of Age Groups by Job Category
19-24
25-29
30-37
38-44
45-49
50+
Age Groups
Note: Administrative support category not shown due to small sample size.

26
Excluding staff who did not respond to the questions on secondary education, all staff in
FSM, Guam, and RMI completed Year 13 or the equivalent of U.S. Grade 12.
In other offices, secondary education ranged from 12.8 yeras in Samoa and Tuvalu to 11.4
and 10.8 yeras in Kiribati and the Solomon Islands respectively.
4.2 Post-Secondary Education
Almost half (49%) of respondents attended university. Thirteen percent attended
community college, 5 percent attended a polytech institute (such as TAFE), and 32 percent
of respondent listed no post-secondary education.
4.5% 9.8%
27.7% 55.8%
2.2%
Figure 4.1: Highest Year of Secondary Education Completed
Form 2-4
Form 5
Form 6
Form 7
No response
13.0 13.0 13.0 12.8 12.8 12.4 12.4 12.2
11.8 11.4
10.8
Figure 4.2: Mean Year of Secondary Education Completed by Country
Note: Countries with 3 or less staff are not displayed for confidentiality purposes. Values exclude non-reponses.

27
Forty-one percent of respondents completed a university education. Thirteen percent
completed Community College, 2 percent finished education at a polytech institute, and 44
percent did not list any completed post-secondary education.
Four countries had 50 percent or more of staff complete University: RMI (60%), Guam (56%),
Fiji (50%), and Tuvalu (50%).
The Solomon Islands (19%) and FSM (6%) were the countries with the smallest percentages
of staff who completed University. However, it should be noted that 65 percent of staff in
FSM completed Community College.
Three countries had 50 percent or more of staff who did not list having completed any post-
secondary education: the Solomon Islands (75%), Cook Isalnds (60%), and Vanuatu (50%).
32.1%
5.4%
13.4%
49.1%
Figure 4.3: Percent Distribution of the Highest Level of Post-Secondary Education Attended
None/Not stated
Polytech (TAFE)
Community College
University
44.2%
2.2% 12.5%
41.1%
Figure 4.4: Percent Distribution of the Highest Level of Post-Secondary Education Completed
None/Not stated
Polytech (TAFE)
Community College
University

28
4.3 Highest Post-Secondary Qualification Achieved
Half of all respondents listed having either a diploma, degree, or a Masters degree.
Thirty percent of respondents achieved a degree.
Thirty-nine percent of respondents did not list any post-secondary qualification.
4.4 Post-Secondary Education by Job Category
0%10%20%30%40%50%60%70%80%90%
100%
Figure 4.5: Percent Distribution of Post-Secondary Education Completed by Country
University
Community College
Polytech (TAFE)
None/Not stated
Note: Countries with 3 or less staff are not displayed for confidentiality purposes.
39.3%
10.3% 14.3%
29.5%
6.7%
Figure 4.6: Percent Distribution of the Highest Level of Post-Secondary Qualification Achieved
None/Not stated
Certificate
Diploma
Degree
Masters

29
Managerial staff were the most likely to complete university (86%) followed by senior
professional staff (52%), and professional staff (39%). Only 16 percent of statistical support
staff completed university.
Statistical support was the job category with the highest proportion of staff who did not list
completing any post-seconday education (64%). Additionally, 44 percent of professional
staff, 36 percent of senior professional staff, and 14 percent of managerial staff did not
indicate completing any post-secondary school.
Forty-three percent of managerial staff completed a Master’s degree compared to 7 percent
of senior professional staff and 3 percent of professional staff.
Thirty-eight percent of managers, 48 percent of senior professional staff, 30 percent of
professional staff, and 7 percent of statistical support staff completed a degree.
Ten percent of managerial staff listed no post-secondary qualifications, as did 27 percent of
senior professional staff, 40 percent of professional staff, and 61 of statistical support staff.
0% 20% 40% 60% 80% 100%
Management
Senior professional
Professional
Statistical support
Total
Figure 4.7: Percent Distribution of Highest Level of Post-Secondary Education Completed by Job Category
None listed
Polytech (TAFE)
Community College
University
Note: Administrative support category not shown due to small sample size.

30
0% 20% 40% 60% 80% 100%
Management
Senior professional
Professional
Statistical support
Total
Figure 4.8: Percent Distribution of Highest Level of Qualification Completed by Job Category
None listed
Certificate
Diploma
Degree
Masters
Note: Administrative support category not shown due to small sample size.
31
4.5 Post-Secondary Education by Job Duties
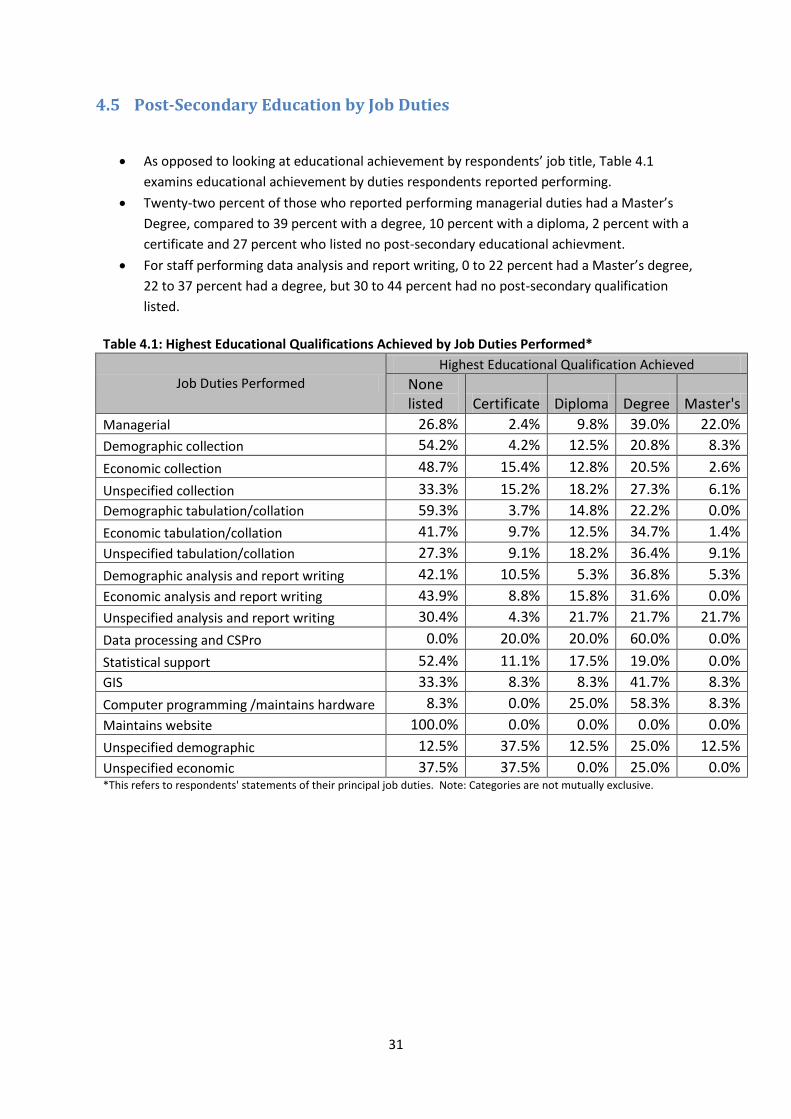
As opposed to looking at educational achievement by respondents’ job title, Table 4.1
examins educational achievement by duties respondents reported performing.
Twenty-two percent of those who reported performing managerial duties had a Master’s
Degree, compared to 39 percent with a degree, 10 percent with a diploma, 2 percent with a
certificate and 27 percent who listed no post-secondary educational achievment.
For staff performing data analysis and report writing, 0 to 22 percent had a Master’s degree,
22 to 37 percent had a degree, but 30 to 44 percent had no post-secondary qualification
listed.
Table 4.1: Highest Educational Qualifications Achieved by Job Duties Performed*
Job Duties Performed
Highest Educational Qualification Achieved
None listed Certificate Diploma Degree Master's
Managerial 26.8% 2.4% 9.8% 39.0% 22.0%
Demographic collection 54.2% 4.2% 12.5% 20.8% 8.3%
Economic collection 48.7% 15.4% 12.8% 20.5% 2.6%
Unspecified collection 33.3% 15.2% 18.2% 27.3% 6.1%
Demographic tabulation/collation 59.3% 3.7% 14.8% 22.2% 0.0%
Economic tabulation/collation 41.7% 9.7% 12.5% 34.7% 1.4%
Unspecified tabulation/collation 27.3% 9.1% 18.2% 36.4% 9.1%
Demographic analysis and report writing 42.1% 10.5% 5.3% 36.8% 5.3%
Economic analysis and report writing 43.9% 8.8% 15.8% 31.6% 0.0%
Unspecified analysis and report writing 30.4% 4.3% 21.7% 21.7% 21.7%
Data processing and CSPro 0.0% 20.0% 20.0% 60.0% 0.0%
Statistical support 52.4% 11.1% 17.5% 19.0% 0.0%
GIS 33.3% 8.3% 8.3% 41.7% 8.3%
Computer programming /maintains hardware 8.3% 0.0% 25.0% 58.3% 8.3%
Maintains website 100.0% 0.0% 0.0% 0.0% 0.0%
Unspecified demographic 12.5% 37.5% 12.5% 25.0% 12.5%
Unspecified economic 37.5% 37.5% 0.0% 25.0% 0.0% *This refers to respondents' statements of their principal job duties. Note: Categories are not mutually exclusive.
32
5 Job-Specific Training
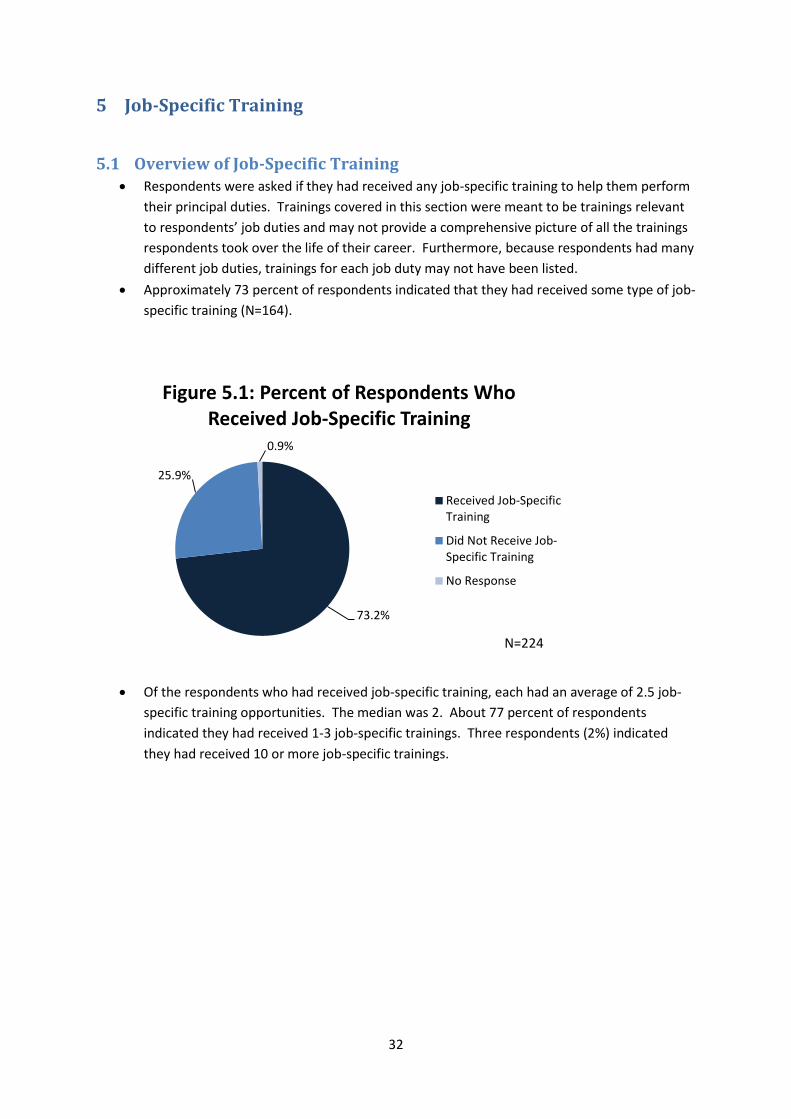
5.1 Overview of Job-Specific Training Respondents were asked if they had received any job-specific training to help them perform
their principal duties. Trainings covered in this section were meant to be trainings relevant
to respondents’ job duties and may not provide a comprehensive picture of all the trainings
respondents took over the life of their career. Furthermore, because respondents had many
different job duties, trainings for each job duty may not have been listed.
Approximately 73 percent of respondents indicated that they had received some type of job-
specific training (N=164).
Of the respondents who had received job-specific training, each had an average of 2.5 job-
specific training opportunities. The median was 2. About 77 percent of respondents
indicated they had received 1-3 job-specific trainings. Three respondents (2%) indicated
they had received 10 or more job-specific trainings.
73.2%
25.9%
0.9%
Figure 5.1: Percent of Respondents Who Received Job-Specific Training
Received Job-SpecificTraining
Did Not Receive Job-Specific Training
No Response
N=224

33
Of staff who indicated they had received job-specific training, the average number of
training opportunities ranged from a high of 3.7 in Kiribati to 2.1 in Vanuatu.
5.2 Formal Job-Specific Training
Formal job-specific training refers to learning opportunities provided by a variety of
statistical training providers, such as universities, statistical training institutes (e.g. SIAP
Singapore), national statistical agencies of metropolitan countries (ABS, Stats NZ, US Census
Bureau etc.) and international technical agencies (e.g. SPC, ESCAP, World Bank etc.).
2.4%
31.7%
23.8% 22.0%
11.0%
4.3% 1.8%
No response 1 2 3 4 5-9 10+
Figure 5.2: Percent Distribution of Number of Job-Specific Training Opportunities
Taken
Number of job-specific training opportunities taken.
N=164 Note: Excludes respondents who did not indicate receiving job-specific training.
3.7
3.0 3.0 2.8 2.8 2.7 2.7 2.5 2.4 2.3 2.3 2.2 2.2 2.1
Figure 5.3: Mean Number of Job-Specific Training Opportunities Taken by Country
Note: Excludes respondents who did not indicate receiving job-specific training. N=164

34
Of all the respondents who indicated that they had received job-specific training, 87 percent
received a formal training.
About 10 percent of respondents only received informal on-the-job/taught by a colleague
job-specific training.
Seventy-two percent indicated they had participated in 1-3 formal job-specific training
opportunities.
Two respondents (1%) indicated they had received 10 or more formal job-specific trainings.
87.2%
10.4%
2.4%
Figure 5.4: Percent of Staff Who Received Formal Job-Specific Training
Received Formal Job-Specific Training
Did Not Receive FormalJob-Specific Training
No Response
Note: Excludes respondents who did not indicate receiving job-specific training. N=164
2.4%
10.4%
28.0%
24.4%
19.5%
7.9% 6.1%
1.2%
NoResponse
0 1 2 3 4 5-9 10+
Figure 5.5: Percent Distribution of Number of Formal Job-Specific Trainings Taken
Number of formal job-specific trainings taken
Note: Excludes respondents who did not indicate receiving job-specific training. N=164

35
5.3 Types of Job-Specific Training and Training Providers Respondents were asked to identify all the job-specific training opportunities they had
taken, the type of training, and who provided the training. The responses below are only for
respondents who indicated they received job-specific training.
The three most common trainings were census and survey planning (34%), specialized
thematic (34%), and data analysis and report writing (26%) trainings.
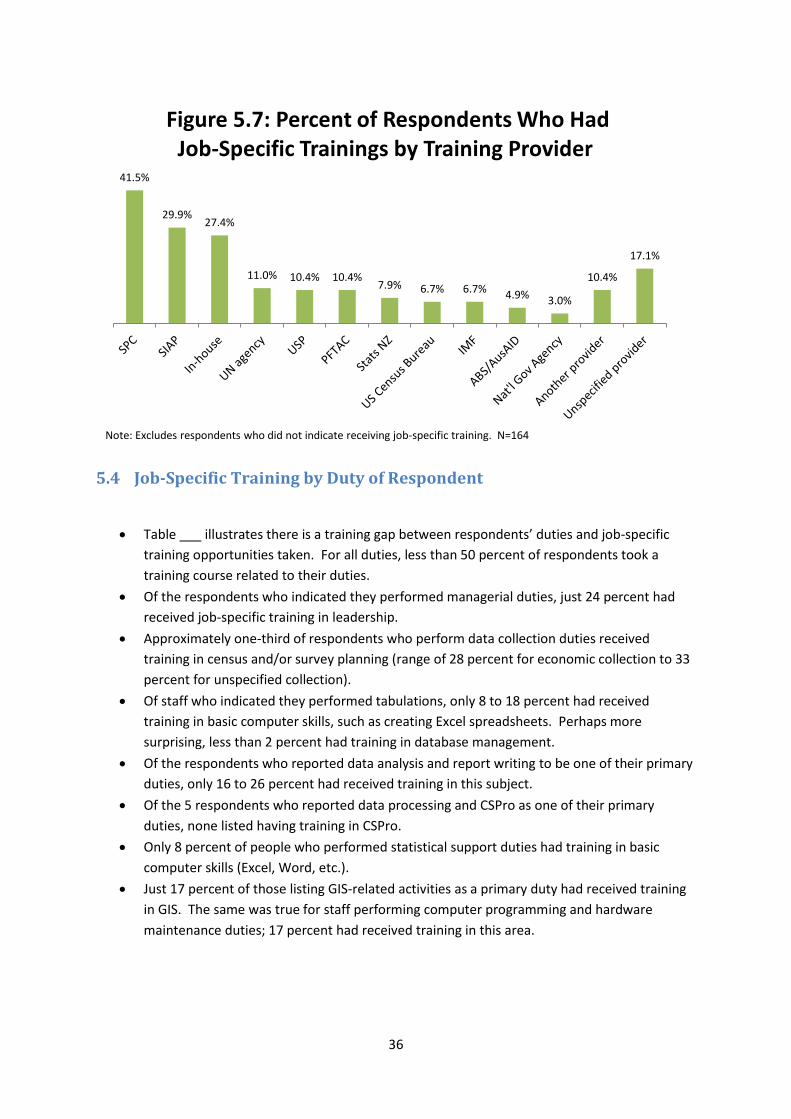
The three most common training providers were SPC, SIAP, and in-house or informal
providers. Forty-two percent of respondents who received job-specific training had a course
from SPC, 30 percent from SIAP, and 27 percent from an in-house/informal source.
Only 3 percent of respondents received formal job-specific training from their national
Government.
34.8% 34.1%
26.8%
12.8% 10.4% 9.1%
5.5% 4.9% 3.7% 3.7% 7.3%
Figure 5.6: Percent of Job-Specific Trained Respondents by Training Topic
Note: Excludes respondents who did not indicate receiving job-specific training. N=164
36
5.4 Job-Specific Training by Duty of Respondent
Table ___ illustrates there is a training gap between respondents’ duties and job-specific
training opportunities taken. For all duties, less than 50 percent of respondents took a
training course related to their duties.
Of the respondents who indicated they performed managerial duties, just 24 percent had
received job-specific training in leadership.
Approximately one-third of respondents who perform data collection duties received
training in census and/or survey planning (range of 28 percent for economic collection to 33
percent for unspecified collection).
Of staff who indicated they performed tabulations, only 8 to 18 percent had received
training in basic computer skills, such as creating Excel spreadsheets. Perhaps more
surprising, less than 2 percent had training in database management.
Of the respondents who reported data analysis and report writing to be one of their primary
duties, only 16 to 26 percent had received training in this subject.
Of the 5 respondents who reported data processing and CSPro as one of their primary
duties, none listed having training in CSPro.
Only 8 percent of people who performed statistical support duties had training in basic
computer skills (Excel, Word, etc.).
Just 17 percent of those listing GIS-related activities as a primary duty had received training
in GIS. The same was true for staff performing computer programming and hardware
maintenance duties; 17 percent had received training in this area.
41.5%
29.9% 27.4%
11.0% 10.4% 10.4% 7.9% 6.7% 6.7% 4.9% 3.0%
10.4%
17.1%
Figure 5.7: Percent of Respondents Who Had Job-Specific Trainings by Training Provider
Note: Excludes respondents who did not indicate receiving job-specific training. N=164

37
Table 5.1: Percent of Job-Specific Training Courses Taken by Duty Type*
Duties
Training Taken
Lead
ersh
ip/P
roje
ct m
anag
emen
t
Cen
sus/
Surv
ey p
lan
nin
g
Dat
a an
alys
is &
rep
ort
wri
tin
g
Spec
ializ
ed/T
he
mat
ic
Job
-sp
ecif
ic a
ttac
hm
ents
Dat
abas
e m
anag
emen
t
Dat
a p
roce
ssin
g
Bas
ic c
om
pu
ter
skill
s
GIS
Co
mp
ute
r p
rog.
/Web
des
ign
Oth
er
Managerial (N=41) 24.4 36.6 26.8 51.2 4.9 4.9 12.2 2.4 4.9 2.4 7.3
Demographic collection (N=24) 12.5 29.2 25.0 20.8 0.0 8.3 16.7 8.3 4.2 4.2 8.3
Economic collection (N=39) 5.1 28.2 17.9 25.6 10.3 2.6 10.3 5.1 2.6 0.0 5.1
Unspecified collection (N=33) 0.0 33.3 27.3 27.3 0.0 0.0 12.1 9.1 6.1 0.0 9.1
Demographic tabulation (N=27) 0.0 22.2 25.9 37.0 3.7 0.0 18.5 14.8 7.4 7.4 11.1
Economic tabulation (N=72) 4.2 29.2 18.1 31.9 8.3 1.4 11.1 8.3 2.8 0.0 2.8
Unspecified tabulation (N=22) 0.0 27.3 45.5 27.3 4.5 0.0 13.6 18.2 13.6 9.1 4.5
Dem. analysis & report writing (N=19)
5.3 21.1 15.8 26.3 5.3
0.0 15.8 0.0 5.3 5.3 10.5
Econ. analysis & report writing (N=19)
5.3 24.6 15.8 33.3 12.3 1.8 10.5 5.3 0.0 0.0 0.0
Unspecified analysis & report writing (N=23)
4.3 21.7 26.1 30.4 4.3
0.0 8.7 8.7 8.7 8.7 8.7
Data processing and CSPro (N=5)
0.0 20.0 20.0 20.0 20.0 20.0 0.0 0.0 40.0 0.0 0.0
Statistical support (N=63) 6.3 22.2 7.9 12.7 0.0 1.6 6.3 7.9 0.0 0.0 4.8
GIS (N=12) 16.7 33.3 25.0 16.7 0.0 0.0 8.3 8.3 16.7 0.0 25.0
Computer programming/hardware (N=12)
8.3 8.3 25.0 16.7 8.3 8.3 8.3 0.0 8.3 16.7 8.3
Maintains website (N=2) 0.0 0.0 0.0 0.0 0.0 0.0 0.0 0.0 0.0 100.0 0.0
Unspecified demographic (N=8) 0.0 12.5 25.0 12.5 0.0 0.0 12.5 12.5 0.0 0.0 0.0
Unspecified economic (N=8) 0.0 25.0 12.5 37.5 0.0 12.5 12.5 0.0 25.0 12.5 0.0
*This refers to respondents' statements of their principal job duties. Note: Categories are not mutually exclusive.
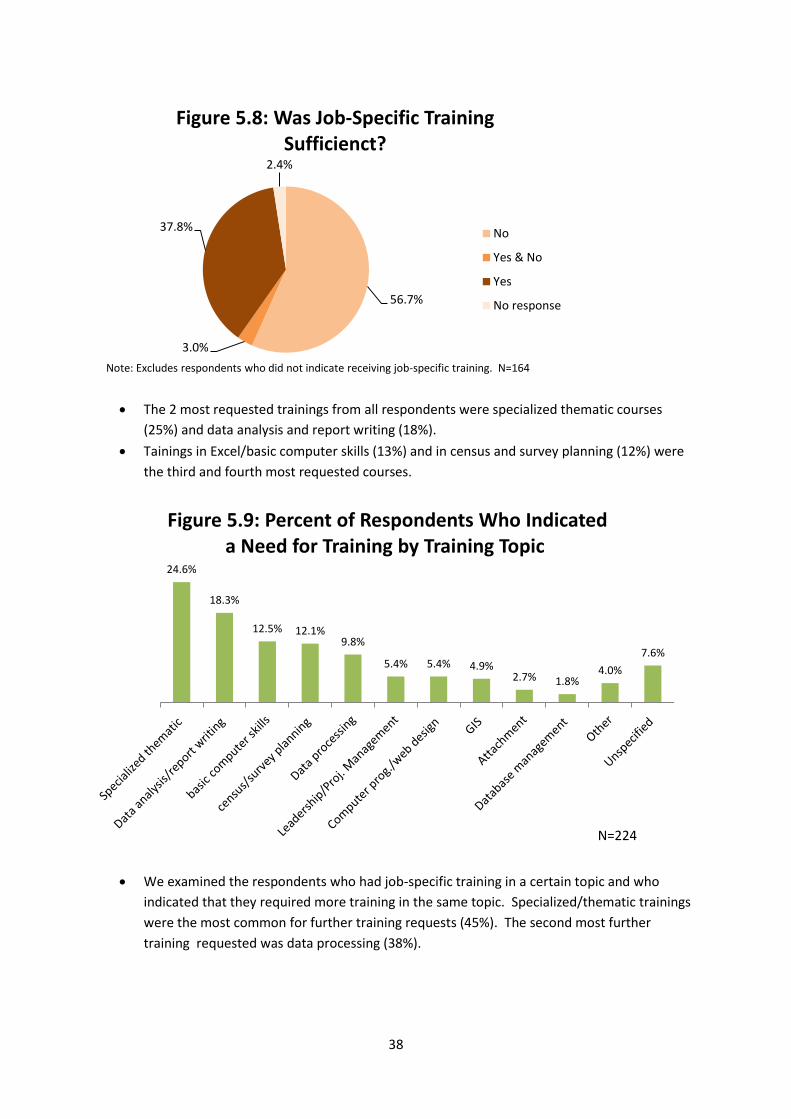
5.5 Job-Specific Training Sufficiency
Of the respondents who received job-specific training, only 38 percent believed their
training to be sufficient to do a competent job in the office.
38
The 2 most requested trainings from all respondents were specialized thematic courses
(25%) and data analysis and report writing (18%).
Tainings in Excel/basic computer skills (13%) and in census and survey planning (12%) were
the third and fourth most requested courses.
We examined the respondents who had job-specific training in a certain topic and who
indicated that they required more training in the same topic. Specialized/thematic trainings
were the most common for further training requests (45%). The second most further
training requested was data processing (38%).
56.7%
3.0%
37.8%
2.4%
Figure 5.8: Was Job-Specific Training Sufficienct?
No
Yes & No
Yes
No response
Note: Excludes respondents who did not indicate receiving job-specific training. N=164
24.6%
18.3%
12.5% 12.1% 9.8%
5.4% 5.4% 4.9% 2.7% 1.8%
4.0%
7.6%
Figure 5.9: Percent of Respondents Who Indicated a Need for Training by Training Topic
N=224

39
Of respondents who had never received job-specific training of any kind, basic computer
courses (29%), specialized thematic courses (26%), data analysis and report writing (17%),
and census and survey planning (17%) were the most commonly requested courses.
44.6%
38.1%
27.3% 23.5%
20.0%
14.0%
Specialized/Thematic Data processing Data analysis &report writing
Leadership/Proj.Management
Basic computer skills Census/Surveyplanning
Figure 5.10: Percent Who Received Job-Specific Training and Required Further Training in That
Same Topic
Courses taken by less than 15 people are not shown.
0.0%
5.0%
10.0%
15.0%
20.0%
25.0%
30.0%
35.0%
40.0%
45.0%
50.0%
Figure 5.11: Percent of Respondents Requiring Training by Training History and Training Type
Allrespondents
Had job-specifictraining in thiscourse
Did not haveany job-specifictraining
N=224

40
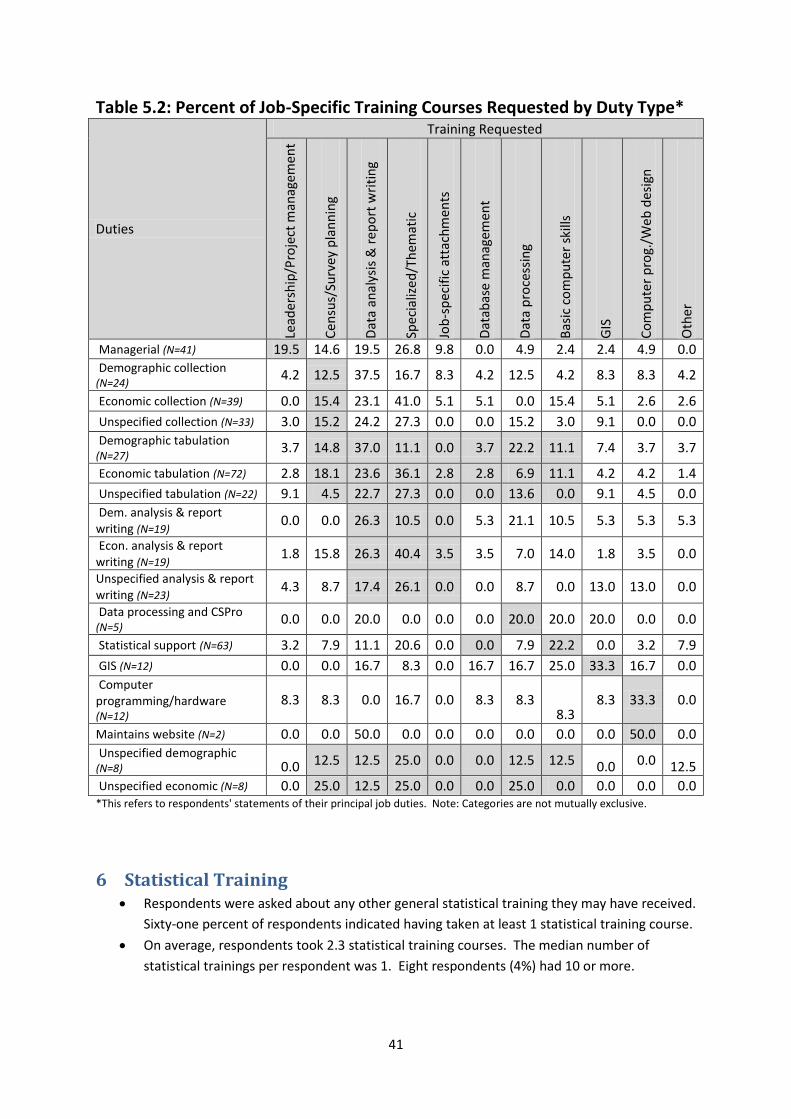
5.6 Job-Specific Training Requested by Duty of Respondent
Just 20 percent of respondents who performed managerial duties requested training in
project management or leadership courses. This is in stark contrast to the 76 percent who
indicated they had no previous training in this subject.
About 13 to 15 percent of staff performing data collection duties requested training in
census and/or survey planning compared to 23 to 26 percent who requested training in data
analysis and report writing.
For staff performing data tabulations, 0 to 11 percent requested basic computer training and
0 to 4 percent requested database management training.
Staff performing data analysis and report writing were the group that was mostly likely to
request training most in line with their job duties. Requests for data analysis and report
writing training ranged from 17 to 26 percent for this group.
Twenty percent of staff performing data processing requested training in CSPro and data
processing.
Twenty-two percent of staff performing statistical support requested training in basic
computer skills with particular emphasis on using Excel.
One-third of respondents performing GIS-related duties requested training in GIS.
One-third of respondents performing computer programming and/or hardware
maintenance requested training in this field.
41
Table 5.2: Percent of Job-Specific Training Courses Requested by Duty Type*
Duties
Training Requested
Lead
ersh
ip/P
roje
ct m
anag
emen
t
Cen
sus/
Surv
ey p
lan
nin
g
Dat
a an
alys
is &
rep
ort
wri
tin
g
Spec
ializ
ed/T
hem
atic
Job
-sp
ecif
ic a
ttac
hm
ents
Dat
abas
e m
anag
emen
t
Dat
a p
roce
ssin
g
Bas
ic c
om
pu
ter
skill
s
GIS
Co
mp
ute
r p
rog.
/Web
des
ign
Oth
er
Managerial (N=41) 19.5 14.6 19.5 26.8 9.8 0.0 4.9 2.4 2.4 4.9 0.0 Demographic collection (N=24)
4.2 12.5 37.5 16.7 8.3 4.2 12.5 4.2 8.3 8.3 4.2
Economic collection (N=39) 0.0 15.4 23.1 41.0 5.1 5.1 0.0 15.4 5.1 2.6 2.6
Unspecified collection (N=33) 3.0 15.2 24.2 27.3 0.0 0.0 15.2 3.0 9.1 0.0 0.0
Demographic tabulation (N=27)
3.7 14.8 37.0 11.1 0.0 3.7 22.2 11.1 7.4 3.7 3.7
Economic tabulation (N=72) 2.8 18.1 23.6 36.1 2.8 2.8 6.9 11.1 4.2 4.2 1.4
Unspecified tabulation (N=22) 9.1 4.5 22.7 27.3 0.0 0.0 13.6 0.0 9.1 4.5 0.0 Dem. analysis & report writing (N=19)
0.0 0.0 26.3 10.5 0.0 5.3 21.1 10.5 5.3 5.3 5.3
Econ. analysis & report writing (N=19)
1.8 15.8 26.3 40.4 3.5 3.5 7.0 14.0 1.8 3.5 0.0
Unspecified analysis & report writing (N=23)
4.3 8.7 17.4 26.1 0.0 0.0 8.7 0.0 13.0 13.0 0.0
Data processing and CSPro (N=5)
0.0 0.0 20.0 0.0 0.0 0.0 20.0 20.0 20.0 0.0 0.0
Statistical support (N=63) 3.2 7.9 11.1 20.6 0.0 0.0 7.9 22.2 0.0 3.2 7.9
GIS (N=12) 0.0 0.0 16.7 8.3 0.0 16.7 16.7 25.0 33.3 16.7 0.0
Computer programming/hardware (N=12)
8.3 8.3 0.0 16.7 0.0 8.3 8.3 8.3
8.3 33.3 0.0
Maintains website (N=2) 0.0 0.0 50.0 0.0 0.0 0.0 0.0 0.0 0.0 50.0 0.0 Unspecified demographic (N=8) 0.0 12.5 12.5 25.0 0.0 0.0 12.5 12.5 0.0 0.0 12.5
Unspecified economic (N=8) 0.0 25.0 12.5 25.0 0.0 0.0 25.0 0.0 0.0 0.0 0.0 *This refers to respondents' statements of their principal job duties. Note: Categories are not mutually exclusive.
6 Statistical Training Respondents were asked about any other general statistical training they may have received.
Sixty-one percent of respondents indicated having taken at least 1 statistical training course.
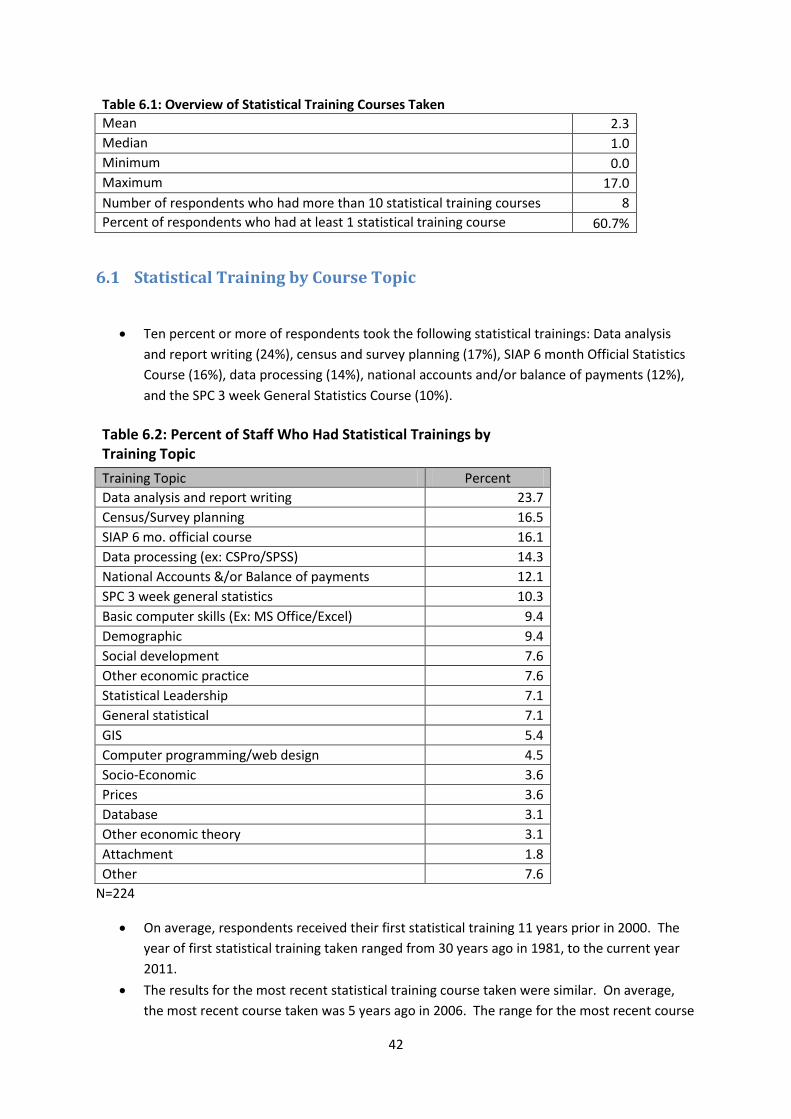
On average, respondents took 2.3 statistical training courses. The median number of
statistical trainings per respondent was 1. Eight respondents (4%) had 10 or more.
42
Table 6.1: Overview of Statistical Training Courses Taken
Mean 2.3
Median 1.0
Minimum 0.0
Maximum 17.0
Number of respondents who had more than 10 statistical training courses 8
Percent of respondents who had at least 1 statistical training course 60.7%
6.1 Statistical Training by Course Topic
Ten percent or more of respondents took the following statistical trainings: Data analysis
and report writing (24%), census and survey planning (17%), SIAP 6 month Official Statistics
Course (16%), data processing (14%), national accounts and/or balance of payments (12%),
and the SPC 3 week General Statistics Course (10%).
Table 6.2: Percent of Staff Who Had Statistical Trainings by Training Topic
Training Topic Percent
Data analysis and report writing 23.7
Census/Survey planning 16.5
SIAP 6 mo. official course 16.1
Data processing (ex: CSPro/SPSS) 14.3
National Accounts &/or Balance of payments 12.1
SPC 3 week general statistics 10.3
Basic computer skills (Ex: MS Office/Excel) 9.4
Demographic 9.4
Social development 7.6
Other economic practice 7.6
Statistical Leadership 7.1
General statistical 7.1
GIS 5.4
Computer programming/web design 4.5
Socio-Economic 3.6
Prices 3.6
Database 3.1
Other economic theory 3.1
Attachment 1.8
Other 7.6
N=224
On average, respondents received their first statistical training 11 years prior in 2000. The
year of first statistical training taken ranged from 30 years ago in 1981, to the current year
2011.
The results for the most recent statistical training course taken were similar. On average,
the most recent course taken was 5 years ago in 2006. The range for the most recent course

43
taken was wide, ranging from 1981 to 2011. Fourteen out of 126 respondents (11%)
indicated that their most recent year of training was more than 10 years ago (data not
shown).
About one-third of respondents (34%) indicated that their first and last training occurred in
the same year.
Table 6.3: Summary of Statistical Training Courses
Mean Median Minimum Maximum
Year of first statistical training course 2000 2002 1981 2011
Year of most recent statistical training course
2006 2009 1981 2011
Percent who's first and last statistical training occurred in same year 33.6
6.2 Statistical Training by Course Provider The 3 most common providers of statistical training were SPC (36%), SIAP (30%), and other
UN agencies (19%).
Five percent or less of respondents received a statistical training from their National
Governments, the U.S. Census Bureau, the University if the South Pacific, the IMF/World
Bank/Asian Development Bank, the Australian Bureau of Statistics/AusAID, Statistics New
Zealand, and PFTAC.
36.2%
30.4%
19.2%
5.4% 4.9% 4.9% 3.1% 2.7% 2.7% 2.2%
10.3%
4.9%
Figure 6.1: Percent of Staff Who Took a Statistical Training Course by Training Provider

44
7 Other Skills Respondents were asked about any other skills they possessed that might be useful in their current
position. They were asked to identity from a list of 10 different skills whether they possessed that
particular skill and if so, how they obtained it, and how long they have had it. All respondents were
asked if they needed further training in each skill regardless of whether they possessed the skill or
not.
7.1 Percent of Respondents with Other Skills and Duration of Skill
Possession More than half of all respondents indicated having 4 of the following skills: spread sheets
(78%), data analysis (64%), report writing (64%), and data bases (51%).
On the IT side of skills, 46 percent of respondents indicated they had data processing skills,
24 percent said they had GIS skills, 14 percent had web publishing skills, and 11 percent had
server/networking/IT-related skills. These categories also had some of the highest non-
response rate for this section of the questionnaire.
Looking at management skills, 40 percent of respondents indicated they had accounting
skills while 22 percent said they had project management skills.
IT-related skills tended to be possessed for a shorter length of time than non IT-related skills.
(Web publishing 4 years, server/networking 5 years, GIS 5 years compared to spread sheets
10 years, data analysis 8 years, report writing 9 years)
On average, respondents possessed each skill for about 7 years (data not shown).
With the exception of web publishing skills, there was quite a large range in the length of
time respondents possessed each skill, ranging from 0 to up to 33 years for data analysis,
report writing, and accounting.

45
Table 7.1: Number and Percent with Other Skills and Number of Years with Each Skill
Other Skills Number and Percent with Other Skills
If Yes, Length of time with these skills (in
years)
Yes No No Response Total Mean Median Min Max
N Percent N Percent N Percent N Percent
Has spread sheet skills 174 77.7 20 8.9 30 13.4 224 100.0 9.5 10.0 0.04 30.0
Has data analysis skills 144 64.3 47 21.0 33 14.7 224 100.0 8.1 6.0 0.04 33.0
Has report writing skills 144 64.3 46 20.5 34 15.2 224 100.0 8.5 7.0 0.02 33.0
Has database skills 115 51.3 65 29.0 44 19.6 224 100.0 8.0 8.0 0.04 29.0
Has data processing skills 104 46.4 68 30.4 52 23.2 224 100.0 7.5 6.5 0.04 26.0
Has accounting skills 89 39.7 81 36.2 54 24.1 224 100.0 10.2 10.0 0.25 33.0
Has GIS skills 54 24.1 102 45.5 68 30.4 224 100.0 5.4 5.0 0.04 15.0
Has project management skills 49 21.9 94 42.0 81 36.2 224 100.0 7.4 7.0 0.02 25.0
Has web publishing skills 31 13.8 110 49.1 83 37.1 224 100.0 4.4 5.0 0.02 8.0
Has server/networking IT skills 25 11.2 116 51.8 83 37.1 224 100.0 4.5 4.0 0.01 15.0
46
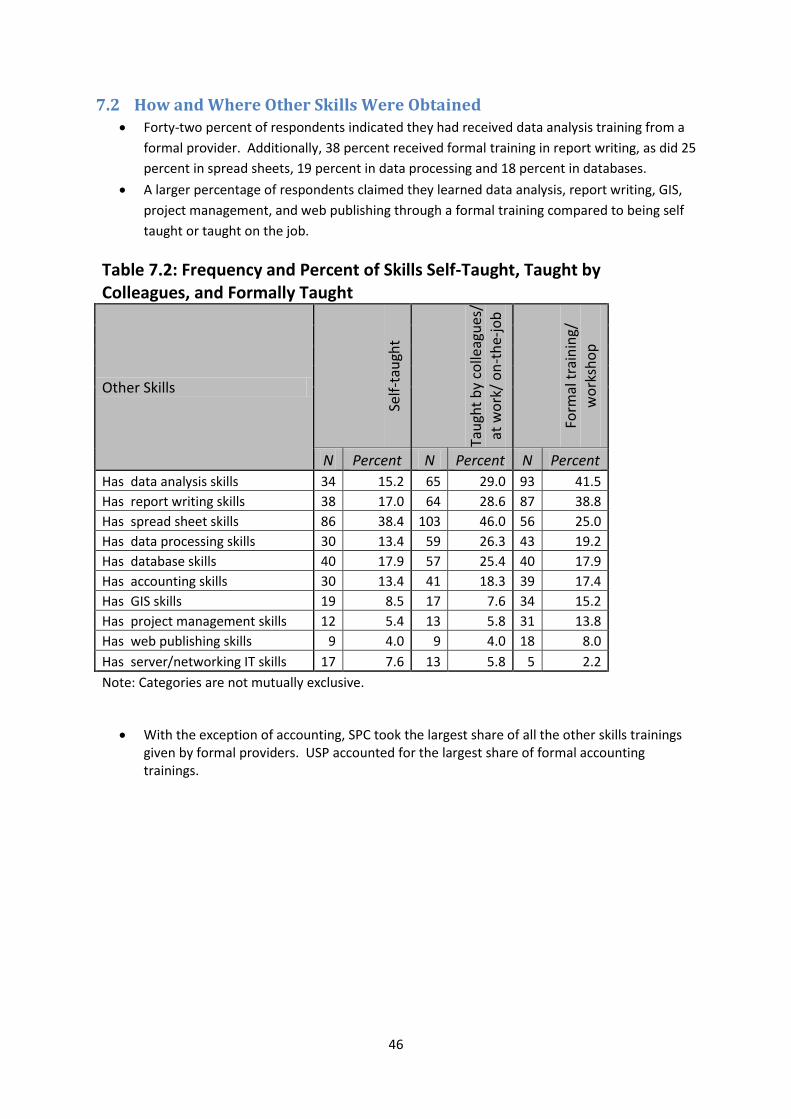
7.2 How and Where Other Skills Were Obtained Forty-two percent of respondents indicated they had received data analysis training from a
formal provider. Additionally, 38 percent received formal training in report writing, as did 25
percent in spread sheets, 19 percent in data processing and 18 percent in databases.
A larger percentage of respondents claimed they learned data analysis, report writing, GIS,
project management, and web publishing through a formal training compared to being self
taught or taught on the job.
Table 7.2: Frequency and Percent of Skills Self-Taught, Taught by Colleagues, and Formally Taught
Other Skills Se
lf-t
augh
t
Tau
ght
by
colle
agu
es/
at w
ork
/ o
n-t
he-
job
Form
al t
rain
ing/
w
ork
sho
p
N Percent N Percent N Percent
Has data analysis skills 34 15.2 65 29.0 93 41.5
Has report writing skills 38 17.0 64 28.6 87 38.8
Has spread sheet skills 86 38.4 103 46.0 56 25.0
Has data processing skills 30 13.4 59 26.3 43 19.2
Has database skills 40 17.9 57 25.4 40 17.9
Has accounting skills 30 13.4 41 18.3 39 17.4
Has GIS skills 19 8.5 17 7.6 34 15.2
Has project management skills 12 5.4 13 5.8 31 13.8
Has web publishing skills 9 4.0 9 4.0 18 8.0
Has server/networking IT skills 17 7.6 13 5.8 5 2.2
Note: Categories are not mutually exclusive.
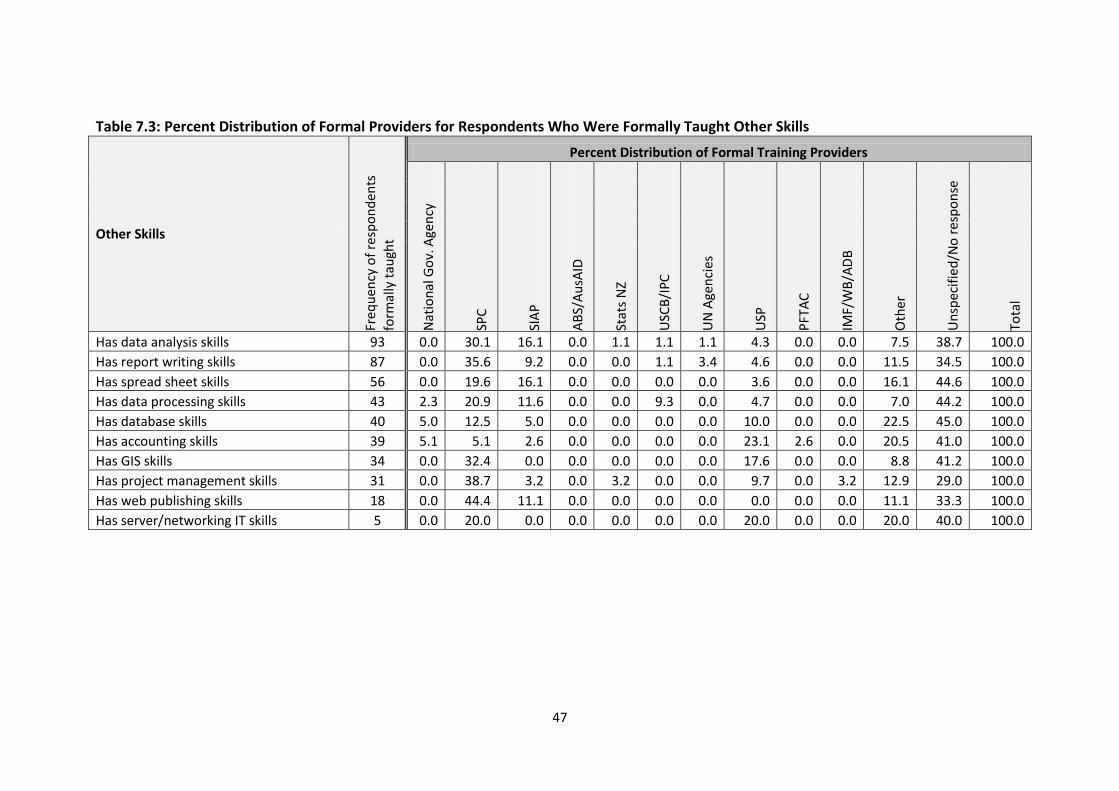
With the exception of accounting, SPC took the largest share of all the other skills trainings given by formal providers. USP accounted for the largest share of formal accounting trainings.
47
Table 7.3: Percent Distribution of Formal Providers for Respondents Who Were Formally Taught Other Skills
Other Skills
Freq
uen
cy o
f re
spo
nd
ents
form
ally
tau
ght
Percent Distribution of Formal Training Providers
Nat
ion
al G
ov.
Age
ncy
SPC
SIA
P
AB
S/A
usA
ID
Stat
s N
Z
USC
B/I
PC
UN
Age
nci
es
USP
PFT
AC
IMF/
WB
/AD
B
Oth
er
Un
spec
ifie
d/N
o r
esp
on
se
Tota
l
Has data analysis skills 93 0.0 30.1 16.1 0.0 1.1 1.1 1.1 4.3 0.0 0.0 7.5 38.7 100.0
Has report writing skills 87 0.0 35.6 9.2 0.0 0.0 1.1 3.4 4.6 0.0 0.0 11.5 34.5 100.0
Has spread sheet skills 56 0.0 19.6 16.1 0.0 0.0 0.0 0.0 3.6 0.0 0.0 16.1 44.6 100.0
Has data processing skills 43 2.3 20.9 11.6 0.0 0.0 9.3 0.0 4.7 0.0 0.0 7.0 44.2 100.0
Has database skills 40 5.0 12.5 5.0 0.0 0.0 0.0 0.0 10.0 0.0 0.0 22.5 45.0 100.0
Has accounting skills 39 5.1 5.1 2.6 0.0 0.0 0.0 0.0 23.1 2.6 0.0 20.5 41.0 100.0
Has GIS skills 34 0.0 32.4 0.0 0.0 0.0 0.0 0.0 17.6 0.0 0.0 8.8 41.2 100.0
Has project management skills 31 0.0 38.7 3.2 0.0 3.2 0.0 0.0 9.7 0.0 3.2 12.9 29.0 100.0
Has web publishing skills 18 0.0 44.4 11.1 0.0 0.0 0.0 0.0 0.0 0.0 0.0 11.1 33.3 100.0
Has server/networking IT skills 5 0.0 20.0 0.0 0.0 0.0 0.0 0.0 20.0 0.0 0.0 20.0 40.0 100.0

48
7.3 Need for Other Skills Trainings Respondents were asked if they needed further training in any of the skills listed. In all but 2
skills, 50 percent or more of respondents indicated a need for further training. This high
level of need should be interpreted with caution as it does not match the job-specific
training requests obtained in the Section 4.
For example, 75 percent of respondents indicated a need for further training in data analysis
and 71 percent indicated a need for report writing. This is in contrast to 18 percent of
respondents who requested job-specific training in data analysis and report writing.
For all skills listed, 70 percent or more of respondents who already possessed each individual
skill indicated a need for further training in that same skill.
Eighty-one percent of respondents who said they had data analysis skills requested further
training in data analysis. Likewise, 82 percent of all the respondents who said they had data
processing skills indicated a need for further training in data processing.
Of those who did not possess an individual skills, the perceived need for training varied
anywhere from 56 percent for accounting to 92 percent for data analysis.
8 Summary of Training Courses This section looks at formal trainings respondents have taken cumulative including job-
specific trainings, statistical trainings, and other trainings. (This corresponds to Part A, B,
and C of the questionnaire.)
Fifty five percent of respondents indicated they had received a formal training in data
analysis and report writing.
Thirty-four percent of respondents indicated they had received a formal training in both
census/survey planning and basic computer skills.
75.4% 71.0% 69.2% 69.2% 67.4%
57.6% 56.3% 50.0% 48.7%
43.3%
Figure 7.1: Percent of Respondents Who Indicated a Need for Further Training in Each Skill Type

49
Thirty-one percent of respondents indicated they had received a formal training in data
processing.
Slightly more than one in five respondents indicated they had a formal training in both
project management and databases.
Eighteen percent of respondents indicated they had a formal training in GIS and 12 percent
in other IT-related topics such as web design and hardware or server maintenance.
When examining courses taken cumulatively, almost half (49%) of staff performing
managerial duties received formal training in project management and/or leadership.
Of those who performed data collection, formal trainings in census or survey planning
ranged from 33 to 42 percent.
Formal training in database management was relatively low (22 to 26%) for staff performing
tabulations.
Staff performing data analysis and report writing had one of the highest levels of
complimentary formal training. Fifty-one to 74 percent of these staff indicated they
received formal training in this area.
Twenty-nine percent of staff who performed statistical support received formal training in
basic computer skills and spread sheets.
55.4%
34.4% 33.9% 30.8%
21.0% 21.0% 17.9%
12.1%
Figure 8.1: Percent of Staff Who Received Formal Training in Each Topic
N=224

50
Table 8.1: Percent of Formal Training Courses Taken by Duty Type*
Duties
Training Taken
Lead
ersh
ip/P
roje
ct m
anag
emen
t
Cen
sus/
Surv
ey p
lan
nin
g
Dat
abas
e m
anag
emen
t
Dat
a an
alys
is &
rep
ort
wri
tin
g
Dat
a p
roce
ssin
g
Bas
ic c
om
pu
ter
skill
s
GIS
Co
mp
ute
r p
rog.
/Web
des
ign
Managerial (N=41) 48.8 63.4 34.1 73.2 43.9 39.0 29.3 12.2
Demographic collection (N=24) 20.8 33.3 29.2 62.5 33.3 41.7 12.5 8.3
Economic collection (N=39) 17.9 41.0 20.5 64.1 33.3 33.3 15.4 15.4
Unspecified collection (N=33) 18.2 42.4 33.3 69.7 39.4 30.3 30.3 9.1
Demographic tabulation (N=27) 22.2 25.9 25.9 66.7 51.9 55.6 22.2 18.5
Economic tabulation (N=72) 19.4 36.1 22.2 54.2 36.1 33.3 12.5 8.3
Unspecified tabulation (N=22) 31.8 40.9 22.7 77.3 45.5 40.9 40.9 27.3
Dem. analysis & report writing (N=19) 15.8 26.3 10.5 63.2 47.4 31.6 21.1 21.1
Econ. analysis & report writing (N=19) 22.8 35.1 19.3 50.9 31.6 31.6 10.5 8.8
Unspecified analysis & report writing (N=23) 21.7 34.8 17.4 73.9 39.1 30.4 21.7 21.7
Data processing and CSPro (N=5) 0.0 20.0 40.0 40.0 60.0 20.0 40.0 20.0
Statistical support (N=63) 9.5 25.4 4.8 30.2 12.7 28.6 4.8 0.0
GIS (N=12) 16.7 41.7 33.3 58.3 41.7 58.3 50.0 16.7
Computer programming/hardware (N=12) 16.7 25.0 33.3 58.3 33.3 41.7 25.0 33.3
Maintains website (N=2) 0.0 0.0 0.0 0.0 0.0 0.0 0.0 100.0
Unspecified demographic (N=8) 25.0 12.5 37.5 62.5 25.0 25.0 12.5 25.0
Unspecified economic (N=8) 25.0 25.0 37.5 50.0 50.0 12.5 37.5 50.0 *This refers to respondents' statements of their principal job duties. Note: Categories are not mutually exclusive.
9 Case Study
Two different job duties to examine in further detail.
9.1 Case Study of Staff Performing Managerial Duties The training history and training requests of respondents who listed managing staff as one
of their principal job duties were examined. In the following examples, project management
refers to both project management and/or general leadership training.
There were 41 staff (18% of all respondents) who performed managerial duties. Overall, 8
managerial staff (20%) requested project management training.
Of the 41 managerial staff, only 10 (24%) indicated having received job-specific project
management training.

51
Of the 31 managerial staff who had never received job-specific project management
training, only 5 (16%) indicated a need for such training.
Of the 10 respondents who had received job-specific project management training, 3 (30%)
requested further training in this area.
Table 9.1: Proportion Performing Managerial Duties Who Received Project Management Training by Proportion Who Requested Project Management Training
Requested project management training
Yes No Total
Had job-specific project management
training
Yes N 3 7 10
% (30%) (70%) (100%)
No N 5 26 31
% (16%) (84%) (100%)
Total N 8 33 41
% (20%) (80%) (100%)
Of the managerial staff who had no previous project management training and did not
request training in this area, 50 percent indicated in the Part C “Other Skills” section of the
questionnaire that they had project management skills.
There is quite a gap in project management skills with 50 percent of those never receiving
training and not requesting training devoid of project management skills.
9.2 Case Study of Staff Performing Data Analysis and Report Writing
Duties
84%
50%
Respondents who reported performingmanagerial duties with no previous training andno requested training in project management
Figure 9.1: Gap Analysis of Staff Performing Managerial Duties
No previous projectmanagement training andproject managementtraining not requested
Perceived possession ofproject management skills
52
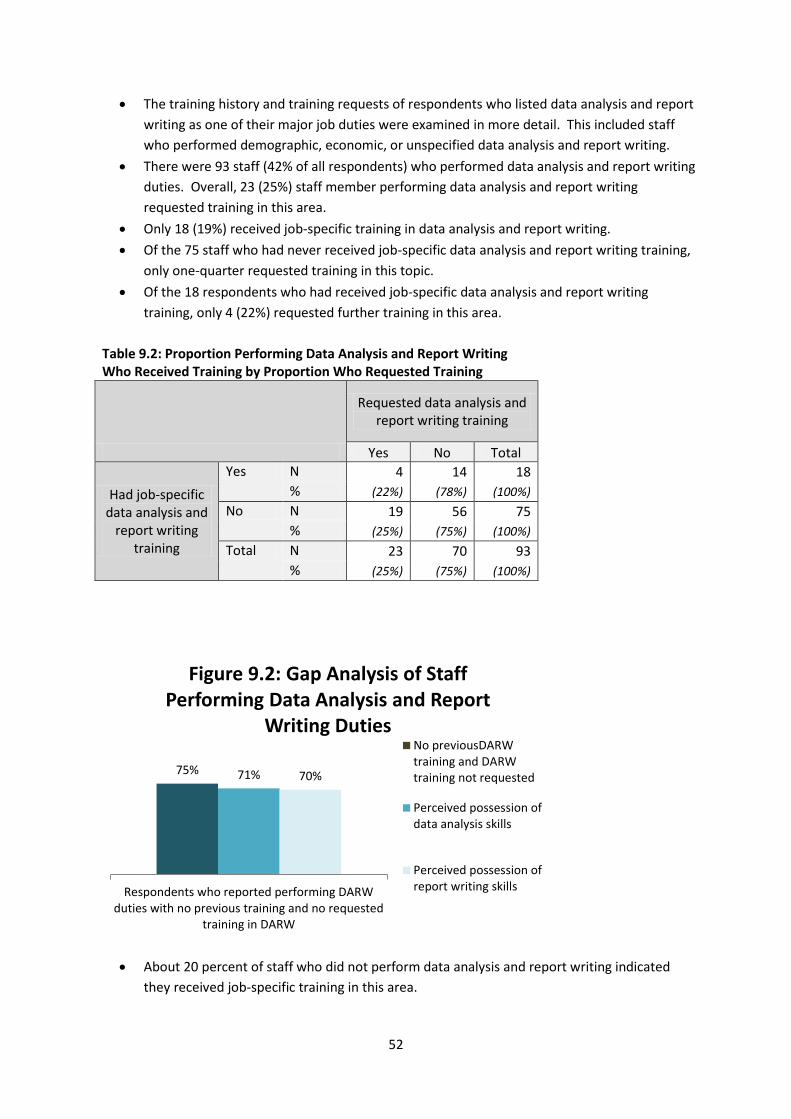
The training history and training requests of respondents who listed data analysis and report
writing as one of their major job duties were examined in more detail. This included staff
who performed demographic, economic, or unspecified data analysis and report writing.
There were 93 staff (42% of all respondents) who performed data analysis and report writing
duties. Overall, 23 (25%) staff member performing data analysis and report writing
requested training in this area.
Only 18 (19%) received job-specific training in data analysis and report writing.
Of the 75 staff who had never received job-specific data analysis and report writing training,
only one-quarter requested training in this topic.
Of the 18 respondents who had received job-specific data analysis and report writing
training, only 4 (22%) requested further training in this area.
Table 9.2: Proportion Performing Data Analysis and Report Writing Who Received Training by Proportion Who Requested Training
Requested data analysis and report writing training
Yes No Total
Had job-specific data analysis and
report writing training
Yes N 4 14 18
% (22%) (78%) (100%)
No N 19 56 75
% (25%) (75%) (100%)
Total N 23 70 93
% (25%) (75%) (100%)
About 20 percent of staff who did not perform data analysis and report writing indicated
they received job-specific training in this area.
75% 71% 70%
Respondents who reported performing DARWduties with no previous training and no requested
training in DARW
Figure 9.2: Gap Analysis of Staff Performing Data Analysis and Report
Writing Duties No previousDARWtraining and DARWtraining not requested
Perceived possession ofdata analysis skills
Perceived possession ofreport writing skills

53
Fourteen percent of staff who did not perform data analysis and report writing requested
training in that area.
Of the staff who had not received training in this area, 90 did not request training.
Table 9.3: Proportion Not Performing Data Analysis and Report Writing Who Received Training by Proportion Who Requested Training
Requested data analysis and report writing training
Yes No Total
Had job-specific data analysis and
report writing training
Yes N 8 18 26 % (31%) (69%) (100%)
No N 10 95 105 % (10%) (90%) (100%)
Total N 18 113 131 % (14%) (86%) (100%)
When examining the number of countries with staff who indicated they had job-specific
training in data analysis and report writing, 12 countries (71%) of countries had received
such training.
Table 9.4: Number of Staff Who Had Job-Specific Training in Data Analysis and Report Writing by Country
Country Number of Staff
Fiji 11
Tonga 6
Vanuatu 5
FSM 4
Guam 4
Solomon Islands 4
American Samoa 3
Kiribati 2
Tuvalu 2
CNMI 1
Cook Islands 1
RMI 1
Nauru 0
Palau 0
Samoa 0
Tokelau 0
Niue 0
Total 44

54
Appendix
Table A-1: Division Recodes New division code Respondent-provided division codes
Economic Divisions
ECONOMIC
TRADE/ EXTERNAL TRADE
BUSINESS AND ECONOMIC STATISTICS PROGRAM
FINANCE
Social Demographic Divisions
SOCIAL STATISTICS
DEMOGRAPHY
CENSUS & SURVEYS/EPPSO
TOURISM & MIGRATION/OCCUPANCY STATISTICS
SOCIO-ECONOMIC PLANNING
BIRTHS DEATHS AND MARRIAGES
Management and Planning
CORPORATE /GOVERNMENT/STRATEGIC LEADERSHIP + COORDINATION UNIT/LEADERSHIP AND ADMINISTRATION
COORDINATION & INFORMATION SYSTEM
COORDINATION & RESEARCH
STRATEGIC PLANNING & RESEARCH
PLANNING INFORMATION SYSTEM
IT/Data Information/GIS
STATISTICAL DATA & INFORMATION MANAGEMENT/PUBLICATIONS
GIS UNIT
IT/DATA PROCESSING UNIT
LAND USE PLANNING/COASTAL MANAGEMENT
General Administrative
ADMINISTRATION
NATIONAL STATISTICS OFFICE
GENERAL STATISTICS DIVISION/CENTRAL STATISTICS OFFICE

55
Table A-2: Job Title Category Recodes New job title category Respondent-provided job title
Management
GOVERNMENT STATISTICIAN/CHIEF PLANNER/ACTING CHIEF/STAT MANAGER/DIRECTOR/NATIONAL STATISTICIAN
DEPUTY GOVERNMENT STATISTICIAN/ACEO/DEPUTY SECRETARY
Senior Professional Staff
PRINCIPAL STATISTICIAN/CHIEF ECONOMIST/DIRECTOR OF DIVISION/CHIEF STATISTICAL UNIT/PRINCIPAL OFFICER/DEPUTY ASSISTANT /BRANCH MANAGER/DIRECTOR/CHIEF TRADE OFFICER/EXECUTIVE ADMINISTRATIVE MANAGER/GIS MANAGER/CHIEF PROGRAMMER/IT MANAGER/DEPUTY REGISTRAR
SENIOR STATISTICIAN/SENIOR STATISTICAL OFFICER/SENIOR REGISTRY OFFICER/SENIOR PLANNING ANALYST
Professional Staff
STATISTICIAN/STATISTICAL OFFICER/PLANNER
ASSISTANT STATISTICIAN/ASSISTANT STATISTICAL OFFICER/SENIOR STATISTICAL ASSISTANT/FIELD SUPERINTENDENT
INFORMATION SYSTEM OFFICER/DISSEMINATION OFFICER
STATISTICAL SPECIALIST/COMPUTER SPECIALIST/STAT ANALYST/PLANNING ANALYST/TRADE/NATIONAL ACCOUNTS COMPILER/BOP/EDUCATION/DATA PROCESSING/CARTOGRAPHER/COMPUTER PROGRAMMER/SYSTEM ANALYST/GIS OFFICER/INFORMATION SYSTEM OFFICER/IT OFFICER
RESEARCH OFFICER/ STAT INVESTIGATOR
Statistical support/Jr. Officers
STATISTICAL CLERK/CLERICAL OFFICER/ CLERK/ACCOUNTS OFFICER
DATA ENTRY OPERATOR/CLERK/CENSUS OPERATOR/DATA CONTROL CLERK/KEYPUNCH OPERATOR/ASSISTANT COMPUTER PROGRAMMER/COMPUTER ASSISTANT/COMPUTER OPERATOR/COMPILER/REGISTRY OFFICER/RECORDS MANAGEMENT OFFICER
STATISTICS TRAINEE
PLANNING TECHNICIAN/ TECHNICIAN/STATISTICAL TECHNICIAN
GRADUATE PROGRAM OFFICER
Administrative support
ADMIN SUPPORT/ EXECUTIVE ASSISTANT/SECRETARY/RECEPTIONIST/CASHIER/OFFICE ASSISTANT

56
Table A-3: Educational Measurement Comparison Table Australia US Grade Other Year
Form 2 7 8
Form 3 8 9
Form 4 9 10
Form 5 10 NZ School Certificate/SC 11
Form 6 11 12
Form 7 12 NCEA Level 3/PSSC 13/NZUE/Foundation level 13
Pacific Statistics Steering Committee Monitoring implementation of the Ten Year Pacific Statistics Strategy 2011-2020
________________________________________________________________________________________________________
PSSC Activity: Skills audit of national and territorial statistical agencies, 2011
Skills audit of NSO staff (Ten-Year Pacific Statistics Strategy, Objective 3, Output 3-1 Activity)
Objective: Skill audit undertaken by Heads of NSO and supported by SPC and PFTAC, to establish a baseline for development of long-term training and professional development strategy Implementation: Heads of Pacific Island NSOs, supported by SPC and PFTAC Time: May – June 2011 (6 weeks) Preparation of Report: July-August 2011, SPC, for presentation at 3rd PSSC meeting in October 2011, which will review findings/recommendations and decide on next steps. _____________________________________________________________________________________ Country/Territory: ______________________________________ Name of staff: _____________________________________ Age: [ ___] Sex: [m] [f] Years working with your office: [___] Division in your office: _______________________________________ Job title: _______________________________________ Principal duties: ____________________________________________________________ _______________________________________________________________
[A] Training history – current Job-specific
1. have you received specific training to help you perform these duties? [ ] Yes (specify in-house training, by whom, how long, when? External training provider – SIAP course, USP, SPC ABS, Statistics NZ … mention all course relevant to your current duties)
a. ……………………………………………………………………………….. b. ……………………………………………………………………………….. c. ………………………………………………………………………………..
Do you feel this training has been sufficient for you to do a competent job? [ ] Yes [ ] No => what other training would you require? ……………………………………………………….
[ ] No: I never received any specific training to help me do this particular job
what type of training would you require? ………………………………………………………………. ……………………………………………………………

Pacific Statistics Steering Committee Monitoring implementation of the Ten Year Pacific Statistics Strategy 2011-2020
________________________________________________________________________________________________________
PSSC Activity: Skills audit of national and territorial statistical agencies, 2011
(B) Training history – general statistical training 2. What other statistical training have you had in the past? Please be specific and mention all courses
you have attended since working at the NSO (this refers to statistical training courses, not general “workshops”). If more than 5, please feel free to extend this table.
Name of Course Organization Year Length of course a. b. c. d. e.
(C) Training history – other skills training 3. Do you have any other skills that are useful in your current position, for example knowledge of
accounting principles, data analysis and report writing, spreadsheet and database skills? If yes: please (1+2) identify the skills you have (if you have others than those listed below, please insert
them) and (3) indicate how you acquired/learned these skills, (4) how long you have had these skills; and (5) if you think you need further training in these areas to do your job more effectively. If no: please write “No” in column 2, then skip to column 5, and indicate if you think you need training in these or other areas, to become more effective/efficient in your current work.
(1) (2) (3) (4) (5) Description of Skill Yes/No
If no => 5
How obtained 1=self-taught, 2=taught by colleague/at work/ on-the-job 3= formal training/workshop (please list training provider, including SIAP, SPC, USP, UN)
How long have you had these skills? (years)
Need for (further) training in these skills, in Other skills (yes/no)
1. Accounting 2. Data analysis 3. Report writing 4. Work with spread sheets
(which software: ___________________?)
5. Work with databases (which software: _____________________?)
6. Data Processing (which software: _____________________?)
7. GIS skills (which software: _____________________?)
OTHER SKILLS 8. server/networking (IT)
9. web-publishing 10. project management 11. 12. 13. 14.

Pacific Statistics Steering Committee Monitoring implementation of the Ten Year Pacific Statistics Strategy 2011-2020
________________________________________________________________________________________________________
PSSC Activity: Skills audit of national and territorial statistical agencies, 2011
(D) General education background
4. Highest level of secondary education completed: ____________ (completed year)
5. Highest level of post-secondary education attended? [ ] Polytech (TAFE) [ ] Community College [ ] University
Field of study: _____________________________
6. Highest level of post-secondary education completed? [ ] Polytech (TAFE) [ ] Community College [ ] University
Field of study: master in statistics and data analysis_____________________________
7. Highest level of post-secondary qualifications achieved?
[ ] certificate [ ] diploma [ ] degree [ ] post-graduate degree [ ] Masters [ ] PhD
Field of study: _____________________________
Note: if more than one degrees/courses of study pursued, feel free to cut and paste and insert additional information
Thank you very much for completing this form. Please return to: Ms Sandra Gianini,
Programme Administrator, Statistics for Development Programme [email protected]