size of california’s economy - assets1b.milkeninstitute.org · 7 scripps research institute ca 7...
TRANSCRIPT
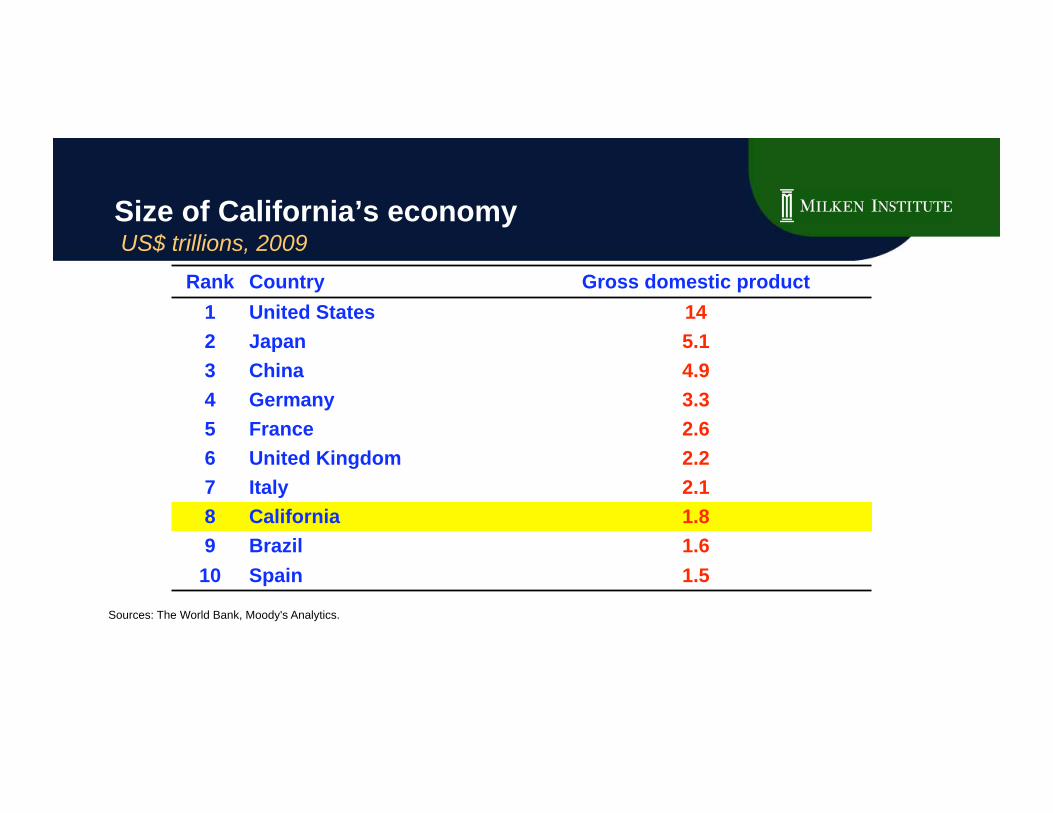
Size of California’s economy
US$ trillions, 2009
Sources: The World Bank, Moody's Analytics.
57
53
44
Rank Country Gross domestic product
1 United States 14
2 Japan 5.1
3 China 4.9
4 Germany 3.3
5 France 2.6
6 United Kingdom 2.2
7 Italy 2.1
8 California 1.8
9 Brazil 1.6
10 Spain 1.5
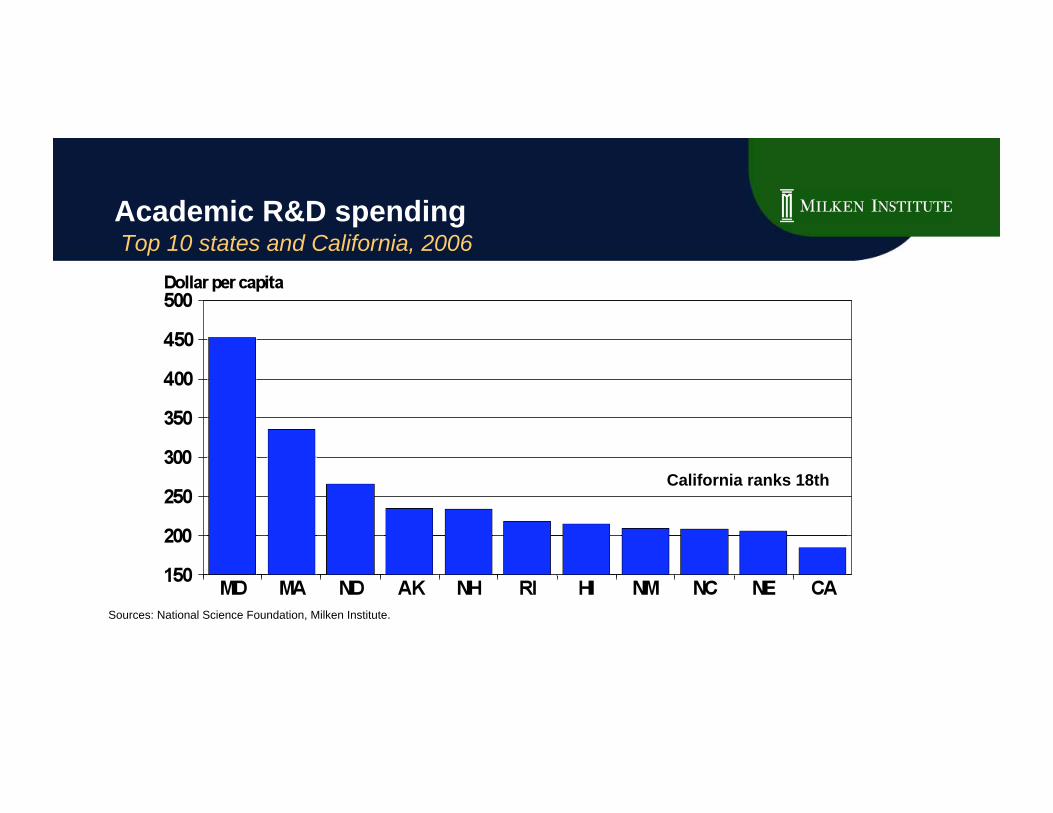
Academic R&D spending
Top 10 states and California, 2006
Sources: National Science Foundation, Milken Institute.
57
California ranks 18th

Advanced degrees
Top 10 states and California, 2008
Sources: U.S. Census Bureau, Milken Institute.
57
53
California ranks 15th

Bachelor's degrees or greater
Top 10 states and California, 2008
Sources: U.S. Census Bureau, Milken Institute.
57
53
California ranks 16th
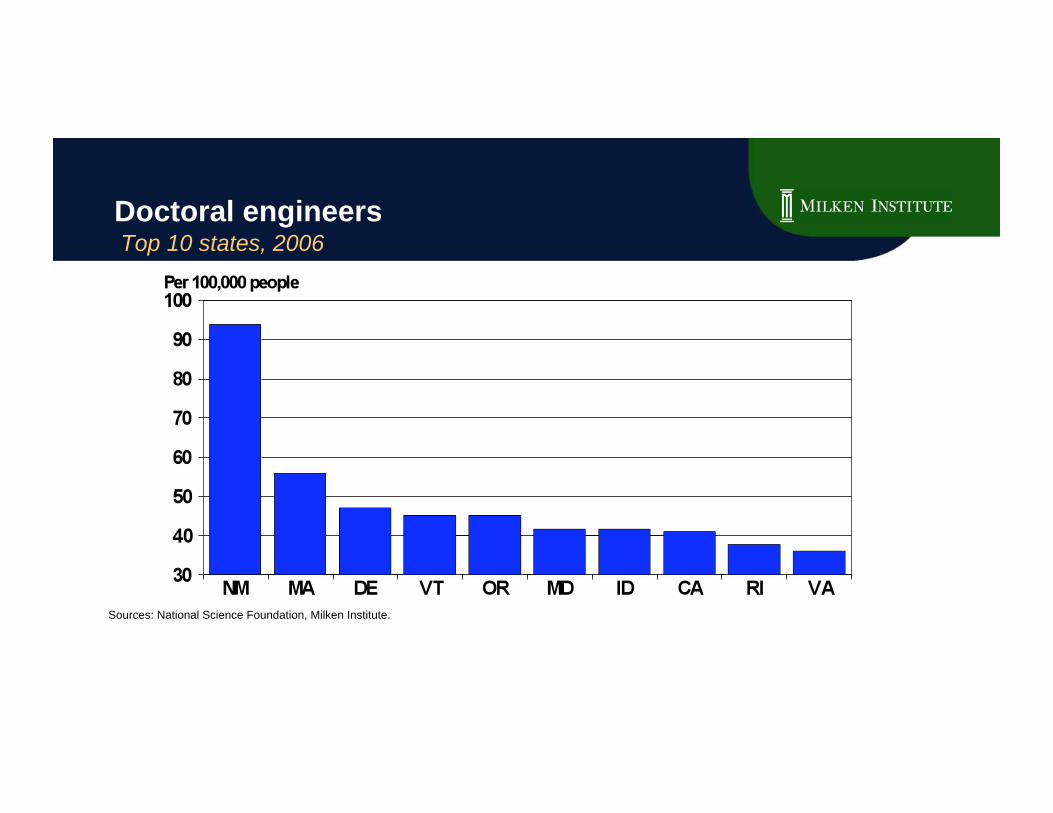
Doctoral engineers
Top 10 states, 2006
Sources: National Science Foundation, Milken Institute.
57
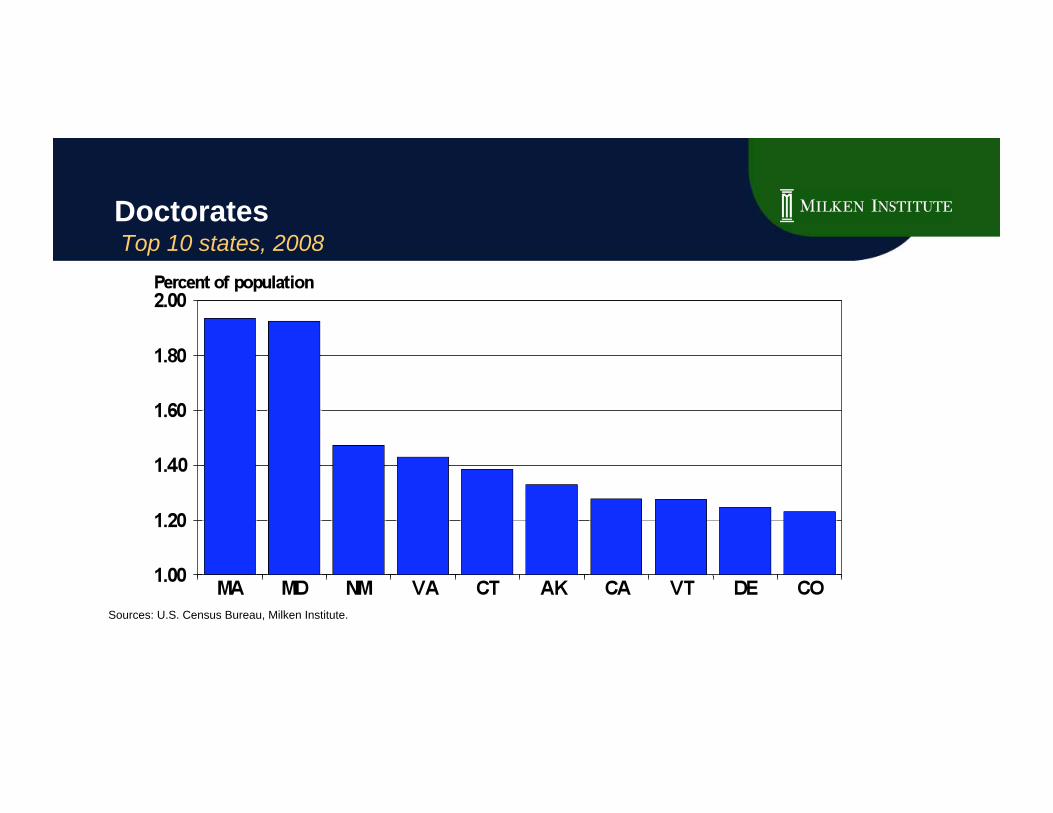
Doctorates
Top 10 states, 2008
Sources: U.S. Census Bureau, Milken Institute.
57
53

Science, engineering and health Ph.D.s Top 10 states and California, 2007
Sources: NSF, Division of Science Resources Studies, Milken Institute.
57
California ranks 18th

Number of business starts
Top 10 states, 2008
Sources: U.S. Census Bureau, Milken Institute.
57

Percent of B.A.s in science and engineering
Top 10 states, 2007
Sources: National Center for Education Statistics and Engineering, Milken Institute.
57
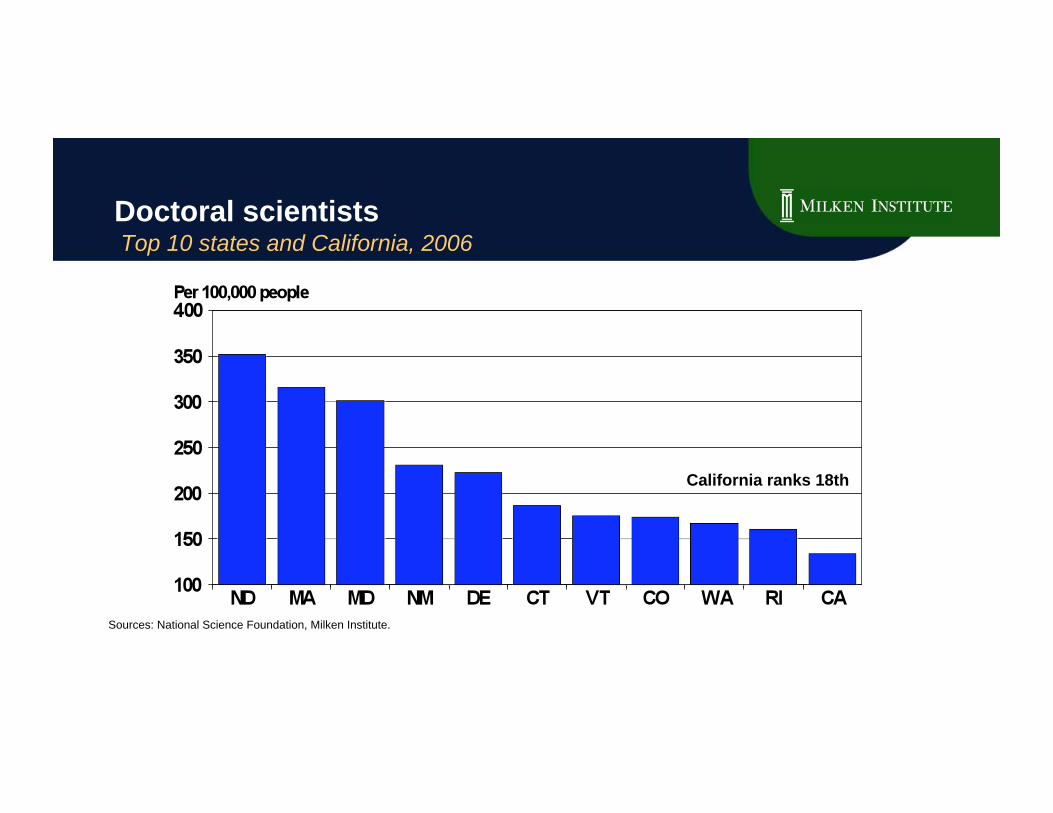
Doctoral scientists
Top 10 states and California, 2006
Sources: National Science Foundation, Milken Institute.
57
53
California ranks 18th

Concentration of computer and I.S. experts
Top 10 states and California, 2008
Sources: Bureau of Labor Statistics, Milken Institute.
57
California ranks 13th

Concentration of engineers
Top 10 states, 2008
Sources: Bureau of Labor Statistics, Milken Institute.
57
53
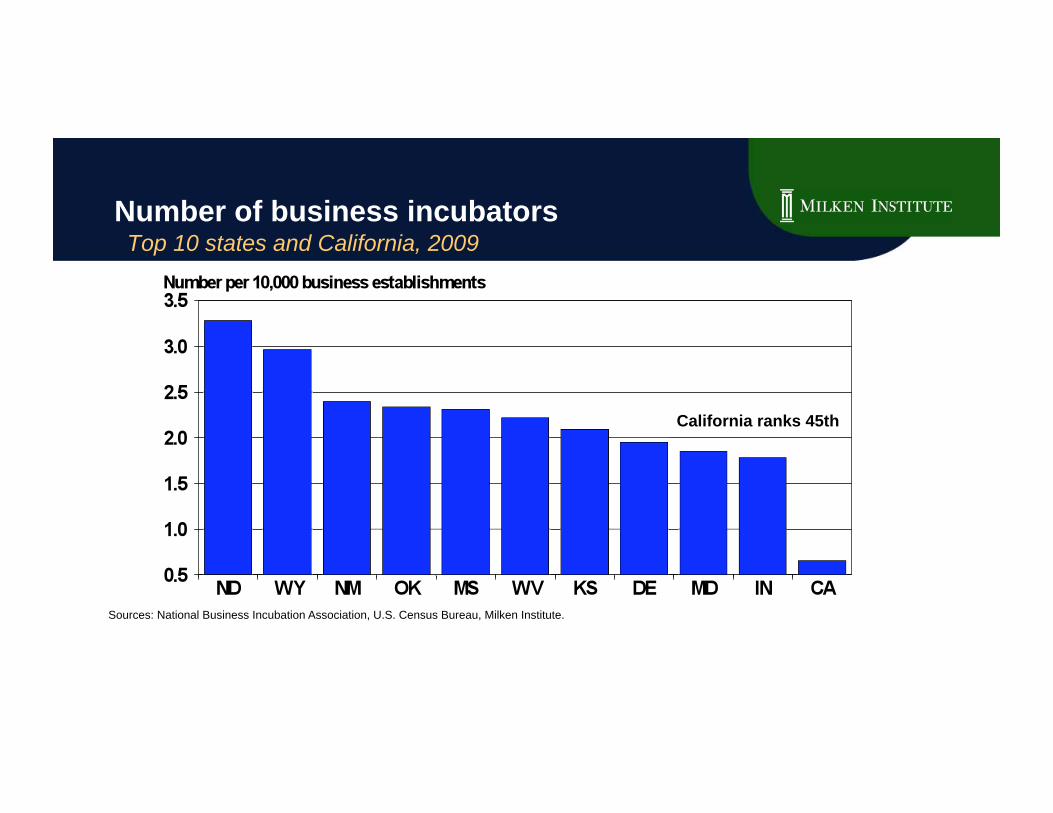
Number of business incubators
Top 10 states and California, 2009
Sources: National Business Incubation Association, U.S. Census Bureau, Milken Institute.
57
53
California ranks 45th

Federal R&D spending
Top 10 states, 2006
Sources: National Science Foundation, Milken Institute.
57
53

Industry R&D spending
Top 10 states, 2006
Sources: National Science Foundation, Milken Institute.
57
53
44

Human capital investment Top 10 states and California, 2010
Source: Milken Institute.
57
53
California ranks 13th
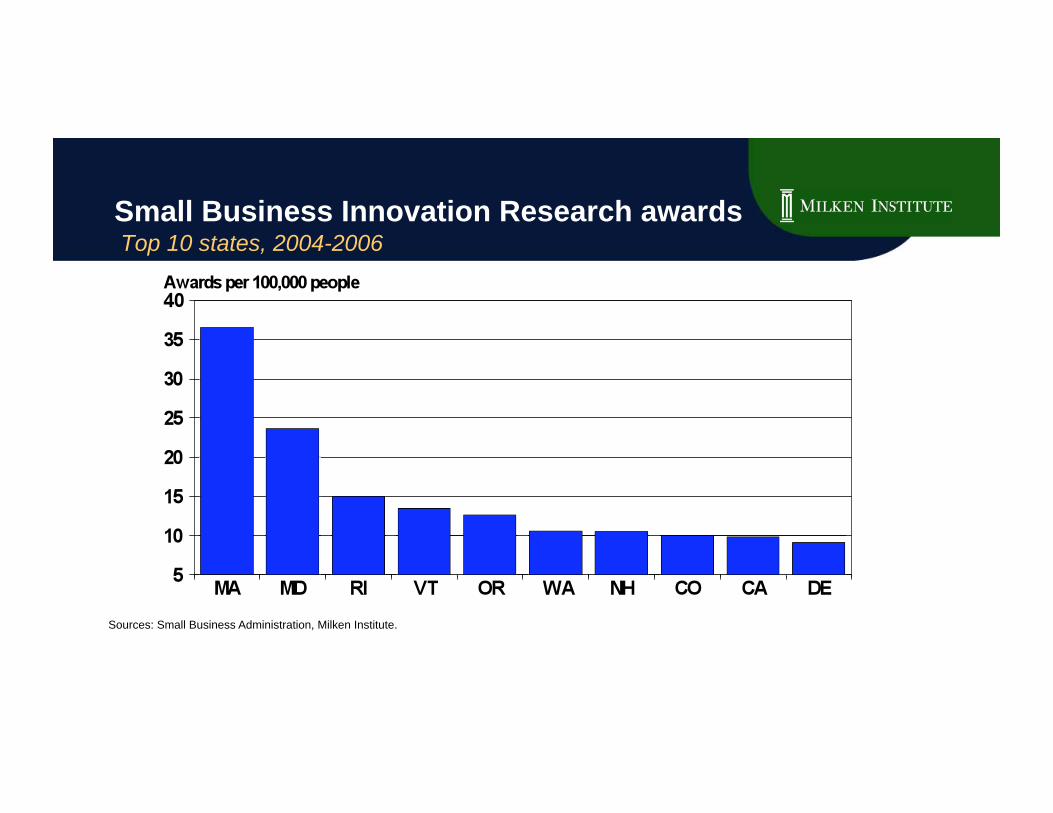
Small Business Innovation Research awards
Top 10 states, 2004-2006
Sources: Small Business Administration, Milken Institute.
57
53
44
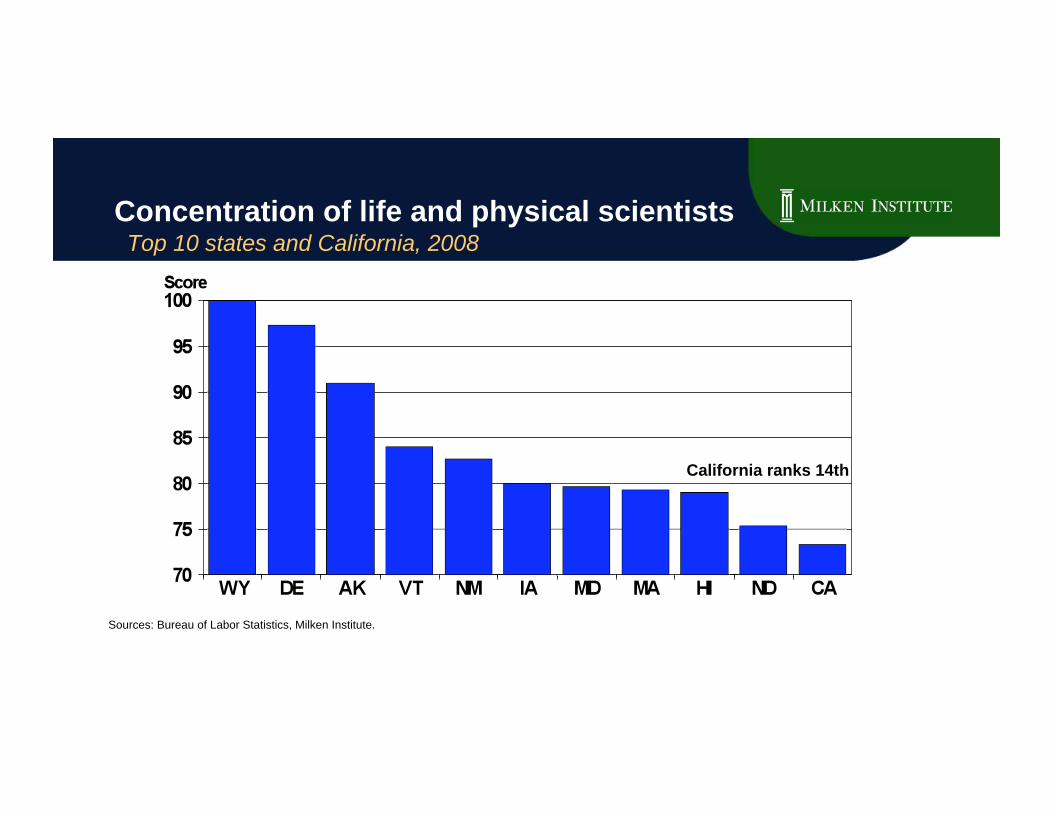
Concentration of life and physical scientists
Top 10 states and California, 2008
Sources: Bureau of Labor Statistics, Milken Institute.
57
53
California ranks 14th

USPTO patents issued
Top 10 states, 2008
Sources: U.S. Patent and Trademark Office, Milken Institute.
57
44
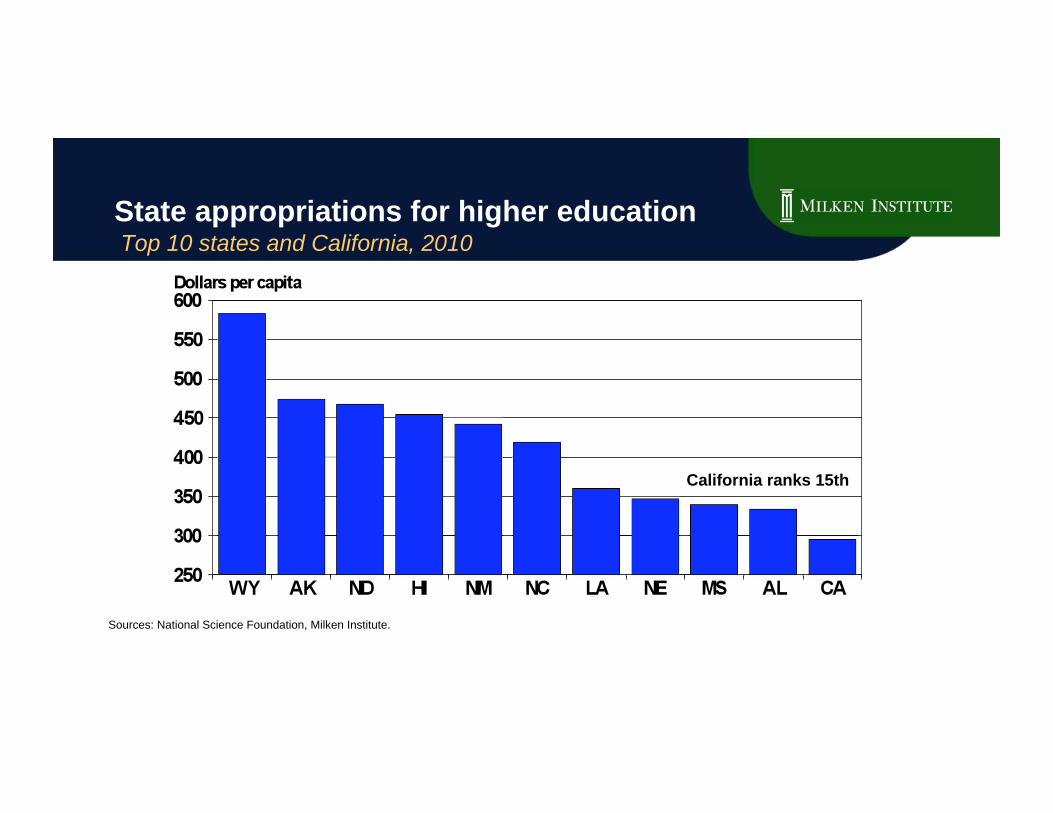
State appropriations for higher education
Top 10 states and California, 2010
Sources: National Science Foundation, Milken Institute.
57
California ranks 15th

Dollar value of SBIR awards per capita
Top 10 states, 2008
Sources: Small Business Administration, Milken Institute.
57
53
44

Small Business Technology Transfer awards
Top 10 states and California, 2004-2006
Sources: Small Business Administration, Milken Institute.
57
53
California ranks 16th

Increases in state appropriations for higher ed. Top 10 states, 2009-2010
Sources: National Science Foundation, Milken Institute.
57
53
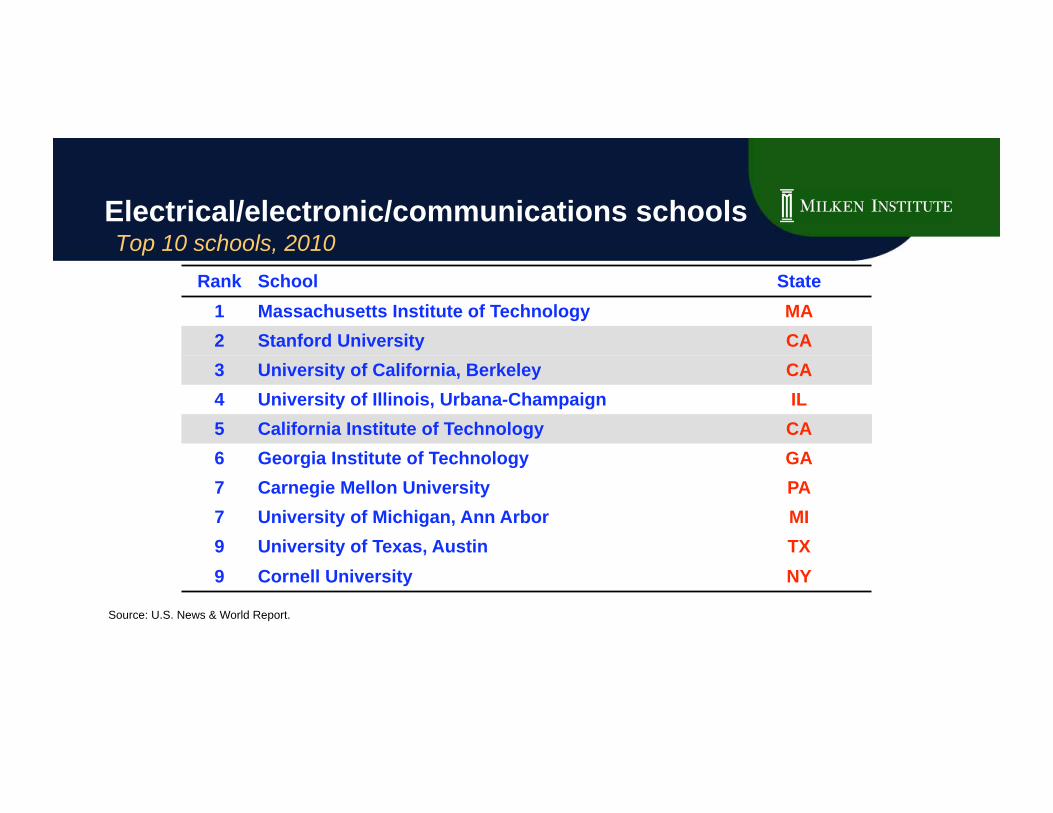
Electrical/electronic/communications schools
Top 10 schools, 2010
Source: U.S. News & World Report.
57
53
44
Rank School State
1 Massachusetts Institute of Technology MA
2 Stanford University CA
3 University of California, Berkeley CA
4 University of Illinois, Urbana-Champaign IL
5 California Institute of Technology CA
6 Georgia Institute of Technology GA
7 Carnegie Mellon University PA
7 University of Michigan, Ann Arbor MI
9 University of Texas, Austin TX
9 Cornell University NY

Top engineering schools
Top 10 schools, 2010
Source: U.S. News & World Report.
57
53
44
Rank School State
1 Massachusetts Institute of Technology MA
2 Stanford University CA
3 University of California, Berkeley CA
4 Georgia Institute of Technology GA
5 University of Illinois, Urbana-Champaign IL
6 Carnegie Mellon University PA
7 California Institute of Technology CA
8 University of Michigan, Ann Arbor MI
9 University of Texas, Austin TX
10 Cornell University NY
10 University of Southern California CA

Biological sciences schools
Top 10 schools, 2010
Sources: U.S. News & World Report.
57
53
44
Rank School State
1 Stanford University CA
2 Harvard University MA
2 Massachusetts Institute of Technology MA
2 University of California, Berkeley CA
5 University of Illinois, Urbana-Champaign IL
5 California Institute of Technology CA
7 Princeton University NJ
7 Scripps Research Institute CA
7 University of California, San Francisco CA
7 Yale University CT

Employment growth in high-tech industries
Sources: Current Employment Statistics, U.S. Bureau of Labor Statistics.
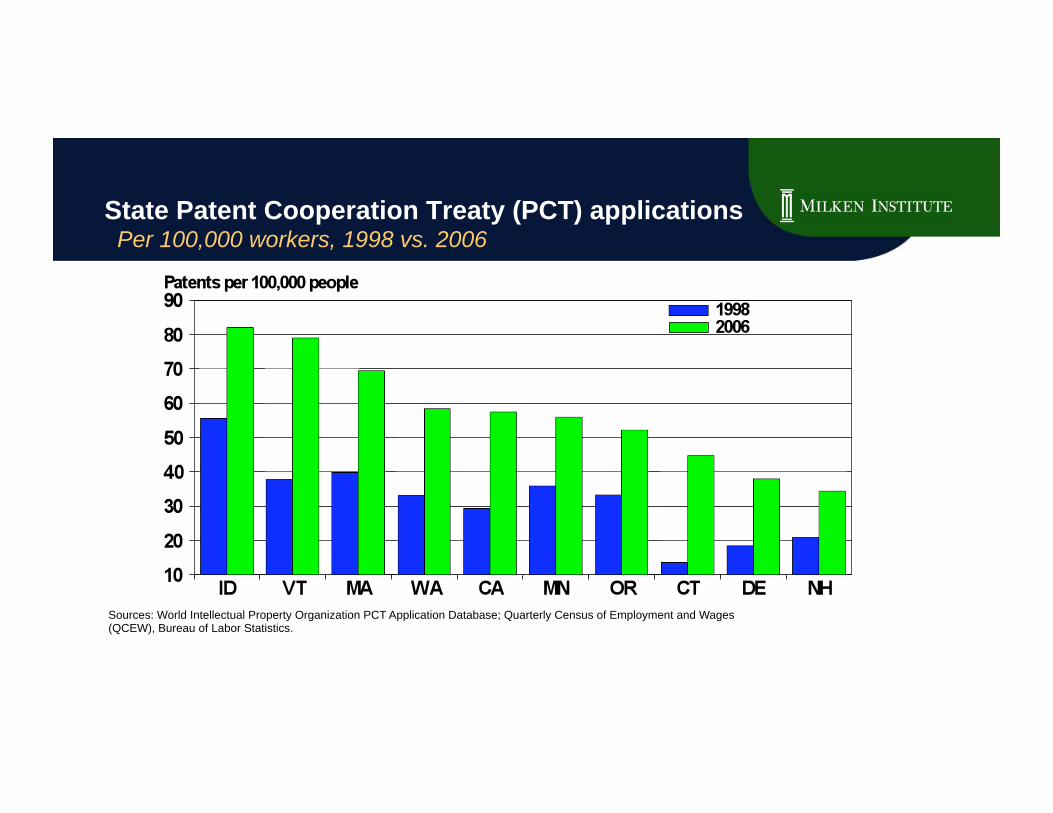
State Patent Cooperation Treaty (PCT) applications Per 100,000 workers, 1998 vs. 2006
Sources: World Intellectual Property Organization PCT Application Database; Quarterly Census of Employment and Wages (QCEW), Bureau of Labor Statistics.
53

U.S. international patent applications Top 5 corporations, 2006
Source: U.S. Patent and Trademark Office.
57
53

U.S. international patent applications By state, 2006
Source: World Intellectual Property Organization PCT Application Database.
53

PCT applications filed through U.S. receiving office Top universities/research institutions, 2006
Source: World Intellectual Property Organization PCT Application Database.
57
53
44
Rank University/Research Institution Total PCT
applications
Percentage of all
PCT applications
1 The University of California (CA) 391 10.9%
2 Massachusetts Institute of Technology (MA) 159 4.4%
3 Columbia University (NY) 95 2.7%
4 University of Florida (FL) 94 2.6%
5 Johns Hopkins University (MD) 66 1.8%
6 Stanford University (CA) 66 1.8%
7 University of Texas (TX) 60 1.7%
8 University of Michigan (MI) 57 1.6%
9 University of Illinois (IL) 52 1.5%
10 California Institute of Technology (CA) 51 1.4%
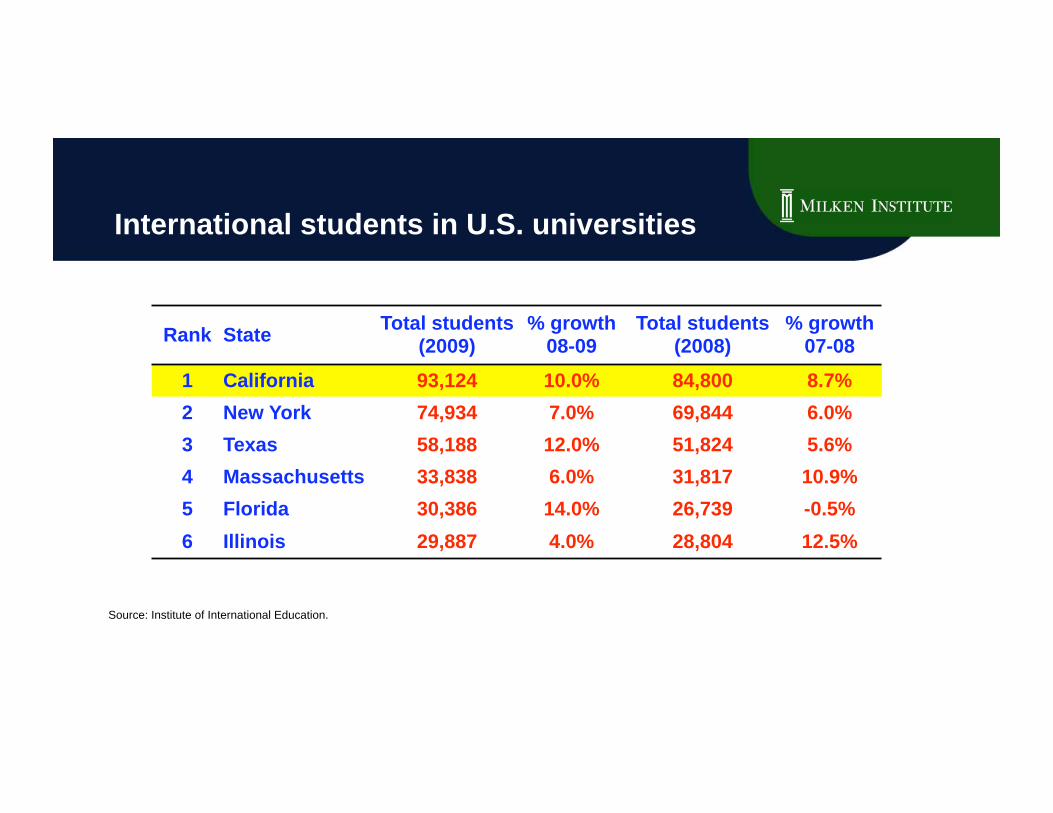
International students in U.S. universities
Source: Institute of International Education.
57
53
44
Rank State Total students
(2009) % growth
08-09 Total students
(2008) % growth
07-08
1 California 93,124 10.0% 84,800 8.7%
2 New York 74,934 7.0% 69,844 6.0%
3 Texas 58,188 12.0% 51,824 5.6%
4 Massachusetts 33,838 6.0% 31,817 10.9%
5 Florida 30,386 14.0% 26,739 -0.5%
6 Illinois 29,887 4.0% 28,804 12.5%

Percent change in LEDtronics bookings Top-performing industrial sectors
Note: Data as of October 5, 2010. Source: LEDtronics.
57
53
44
SIC SIC description 2005 vs
2006
2006 vs
2007
2007 vs
2008
2008 vs
2009
2009 vs
2010
5065 Distributors MRO 29% 9% -3% -13% 32%
5063 Distributors OEM 5% -10% -14% -28% 31%
3625 Industrial control manufacturers 42% -29% 3% -40% 23%
3999 Contract manufacturers 29% -29% 3% -40% 23%
9199 Government/govt. agencies 1% -16% 58% 13% 118%
3721 Military/aerospace 13% -28% 28% -8% 10%
3711 Automotive support industry -43% -36% -11% -33% 49%
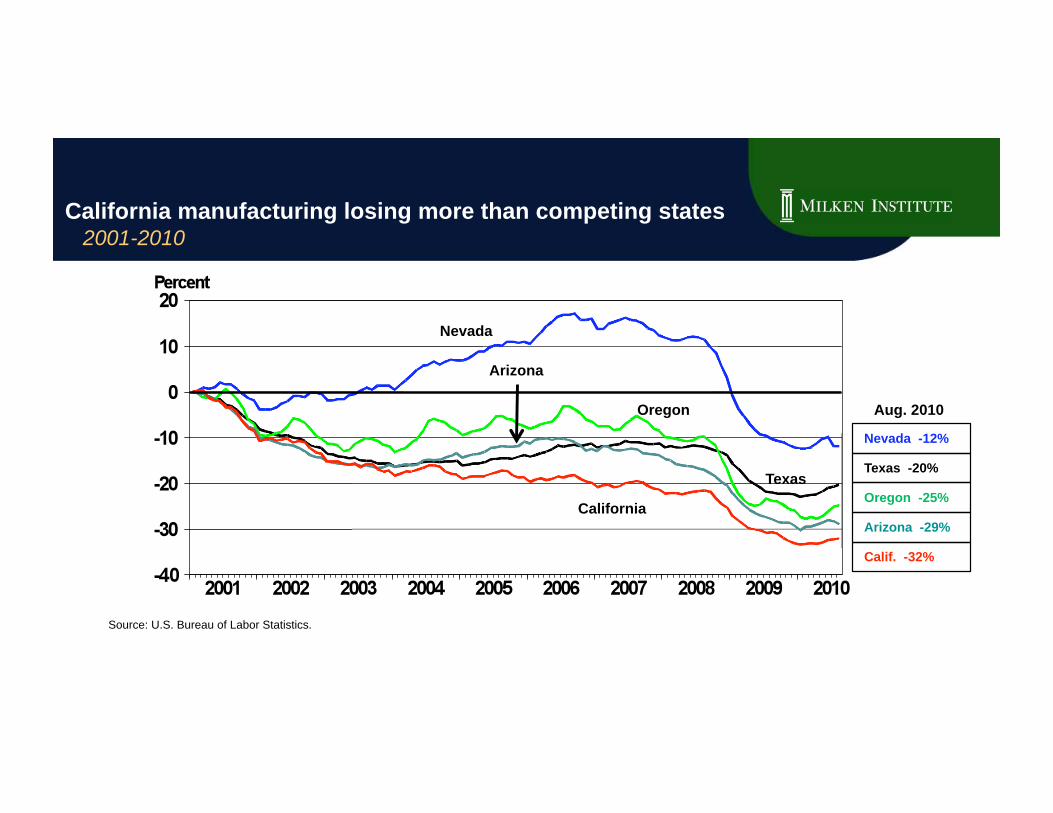
California manufacturing losing more than competing states 2001-2010
Source: U.S. Bureau of Labor Statistics.
57
53
Nevada
Oregon
Arizona
Texas
California
Nevada -12%
Oregon -25%
Arizona -29%
Calif. -32%
Texas -20%
Aug. 2010

California is not winning From 2007 to 2009, the state’s growth in manufacturing capacity ranks
last among the 25 most populous states and is far below the national average.
Source: Site Selection Magazine, Census data.
57
53
California 3.7
new or expanded facilities per
1 million people
Texas
24.5
28.7
U.S. Avg.
Bottom
25
populous states


Polling Question 1:
Which of these will keep California at the leading edge of the global innovation economy?
1. Higher education
2. High-tech business startups
3. Venture capital investment
4. R&D spending

Polling Question 2:
What is the most challenging issue California faces in enhancing commercialization and business growth?
1. Regulatory burden
2. Current tax structure
3. Access to capital
4. Rising cost of health care