size, ecology, and seasonality affect the monthly
TRANSCRIPT
ORIGINAL ARTICLE – Forest Management
Creative Commons License. All the contents of this journal, except where otherwise noted, is licensed under a Creative Commons Attribution License.
Floresta e Ambiente 2021; 28(4): e20210009https://doi.org/10.1590/2179-8087-FLORAM-2021-0009ISSN 2179-8087 (online)
Size, Ecology, and Seasonality Affect the Monthly Diametric Growth of Trees in a Secondary ForestIngrid Raphaela Cromwell Pereira1 Vitor Mateus de Carvalho Morais2 Fabiano Emmert2
Rodrigo Geroni Mendes Nascimento2
1Universidade Federal Rural da Amazônia (UFRA), Instituto de Ciências Agrárias (ICA), Engenharia Florestal, Belém, PA, Brasil.2Universidade Federal Rural da Amazônia (UFRA), Instituto de Ciências Agrárias (ICA), Programa de Pós-Graduação em Ciências Florestais, Belém, PA, Brasil.
AbstractThis work aimed to evaluate the monthly growth rate of 100 trees spread in different diametric classes and ecological groups of a secondary forest in the municipality of Igarapé-Açu, Pará, Brazil. These were selected randomly from 30 permanent plots and classified into 5 diametrical classes and separated into two ecological groups: Pioneers and Non-Pioneers. The monthly periodic increment (MPI) in diameter was measured for 11 months by means of diametric bands using digital calipers. The MPI means were evaluated by an analysis of variance (ANOVA) and Tukey’s mean comparison test. Individuals from both ecological groups had similar increments in the DBH IV diameter class and different in the others. There were mean increments in the diametric classes that did not differ within the ecological groups. The trees analyzed differed in the diametric growth rate according to the diametric classes, ecological groups and the month of analysis.
Keywords: Increment, Dendrometric bands, Amazon rainforest.
1. INTRODUCTION
The secondary forests of northeast Pará in Brazil emerge after the replacement of the original forest with new vegetation which, in large part, is the result of anthropic changes in the natural environment. These have a high capacity to regenerate and occupy 4,358 km2 in the Pará mesoregion (Cordeiro et al., 2017). In the Amazonian scenario, most of the secondary vegetation growth occurs due to the replacement of natural forest with fallow areas of the cutting and burning agricultural system, degraded pastures that have been abandoned or semi-perennial and perennial agricultural crops that favor the appearance of “capoeiras” (Pereira & Vieira, 2001). In northeastern Pará, the appearance of secondary forests is related to the historical occupation of soils that were suitable for agricultural activities, which provided a favorable environment for their regeneration (Ferreira, 2008). Before the ecological stability of a secondary forest is reached, environmental communities undergo changes in their physiological, structural, and floristic characteristics, a process called forest succession or dynamics (Odum, 1976). The forest dynamics are understood by the population balance and the increase in the size of arboreal
individuals, which is revealed by growth rates, mortality, and recruitment (Rocha, 2001). These components of forest dynamics allow the development of vegetation to be assessed and may reveal the successional stage of the forest as a function of past use history and current disturbances.
In forest dynamics, the growth of a tree can be defined as a change in the magnitude of any measurable characteristic of the individual (Encinas et al., 2005). While the primary meristem is responsible for tree height growth, the diameter growth is a consequence of secondary meristem activity or cambium (Kershaw et al., 2016). The primary and secondary growth of trees are influenced by the characteristics of the species interacting with the environment and are influenced by several limiting factors. Climatic factors such as temperature, air humidity, and luminous intensity and pedological factors such as soil fertility and structure, as well as their changes, are important elements for the growth process (Encinas et al., 2005; Kershaw et al., 2016).
Among the important measurable variables for tree growth such as height, volume, biomass, and basal area, diameter is the most accessible (Silva & Neto, 1979; Vanclay, 1994; Prodan et al., 1997). Diameter is a decisive variable for determining the
Floresta e Ambiente 2021; 28(4): e20210009
2 - 10 Pereira IRC, Morais VMC, Emmert F, Nascimento RGM
2
volume, therefore, to describe the natural forest dynamics, information about the increment in diameter is essential (Loetsch et al., 1973; Enright & Ogden, 1979 apud Filho et al., 2003). According to Scolforo (1998), growth data can be obtained by periodically collecting the diameter of the tree over a given period. The growth of an individual tree in between successive periods is called an increment (Encinas et al., 2005). Schöngart (2008) and Leoni et al. (2011) suggest that information about this variable is important to obtain the growth rate of species and to appropriately manage them.
For both planted and native forests, tree and stand growth is obtained through permanent plots measurements and remeasurements (Encinas et al., 2005). Another method of monitoring the growth of individual trees in tropical forests is through the use of dendrometric bands, both for isolated trees or forest stands (Silva et al., 2003). Some studies by Bower & Blocker (1966, apud Almeida, 2008) on the accuracy of diametric increment measurements using dendrometric bands have shown reliable results for measurements over short periods. The studies also indicated that the bands should be installed one year prior to the period in which the measurements are to be taken, as they tend to underestimate diametric growth in the first year of assessment. However, this underestimation applies mainly in regions with well-defined annual seasons (Keeland & Sharitz, 1993), as opposed to tropical regions such as the Amazon.
Dendrometric bands are easy to build low-cost instruments that are also accurate in measuring small variations in tree size and are therefore recommended for studies that require measurements over short periods. Among the advantages of using dendrometric bands are ease of installation and reading, low cost, and that they do not cause any damage to the tree stem (Keeland & Sharitz, 1993). In this context, growth monitoring is critical to understand the growth dynamics of secondary forests and the use of dendrometer bands can enable obtaining responses over short periods. This paper sought to investigate the growth rate of species in different diametric classes, ecological groups, and period of the year in a secondary forest in northeastern Pará.
2. MATERIAL AND METHODS
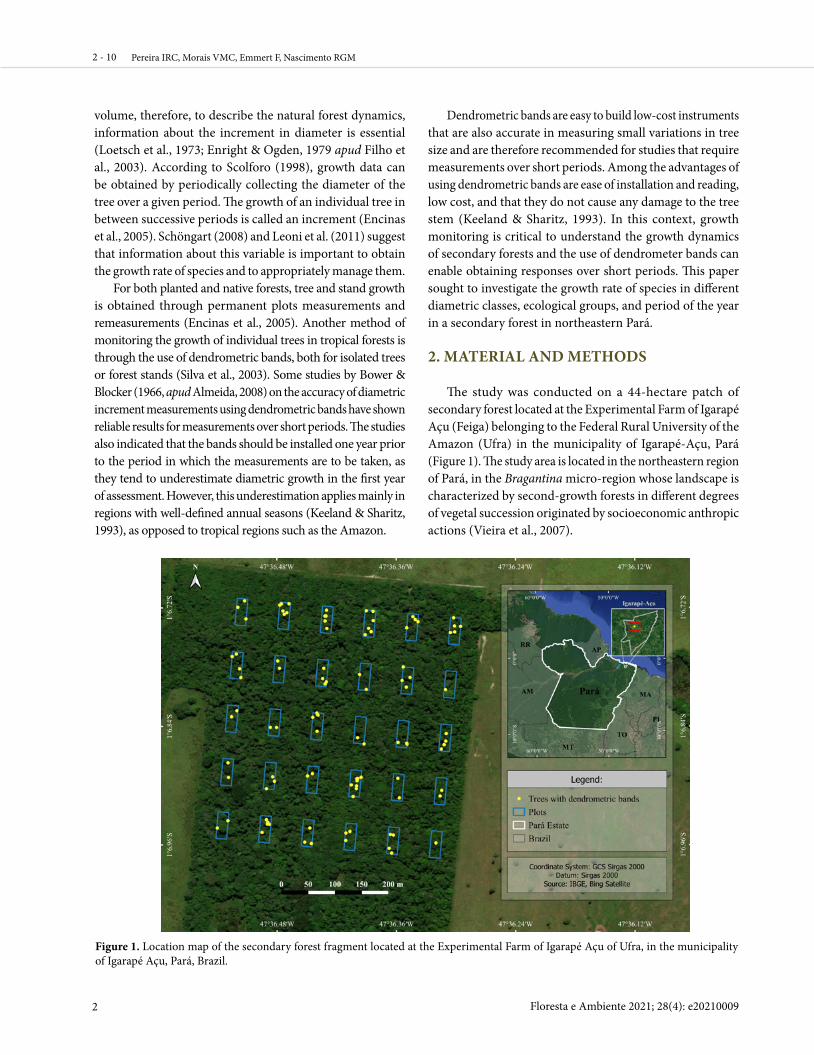
The study was conducted on a 44-hectare patch of secondary forest located at the Experimental Farm of Igarapé Açu (Feiga) belonging to the Federal Rural University of the Amazon (Ufra) in the municipality of Igarapé-Açu, Pará (Figure 1). The study area is located in the northeastern region of Pará, in the Bragantina micro-region whose landscape is characterized by second-growth forests in different degrees of vegetal succession originated by socioeconomic anthropic actions (Vieira et al., 2007).
Figure 1. Location map of the secondary forest fragment located at the Experimental Farm of Igarapé Açu of Ufra, in the municipality of Igarapé Açu, Pará, Brazil.

Size, Ecology, and Seasonality...
Floresta e Ambiente 2021; 28(4): e20210009 3
3 - 10
Average minimum and maximum temperatures in the region range from 21°C to 32°C (Pacheco et al., 2007). According to Köppen, the climate of the site is of type Am (Alvares et al., 2013). The annual rainfall varies from 1,750 mm to
2,500 mm (Andrade et al., 2017), with the highest averages from February to April and the lowest from September to November. The climate variability behaved slightly different during the period of this work as presented in the Figure 2.
Figure 2. Study area weather variability during the data mensuration period. Monthly average for relative humidity (A). Monthly averages for air temperature and precipitation (B). The weather data are available on the website of the National Institute of Weather – INMET and were obtained by an automatic weather station located at Castanhal-PA, which is the nearest station to the study area (approx. 30 km away).
Thirty permanent plots (20 m × 50 m) were systematically distributed in the forest under analysis. In these plots, all trees with diameter to breast height (DBH) ≥ 10 cm were listed, measured, identified, and georeferenced. Subsequently, 100 trees distributed across different diametric classes were randomly selected for installation of the dendrometric bands. All species were identified by a parabotanist in the field, and by exsiccates collected and subsequent visits to the herbaria of Amazon Rural Federal University (Ufra) and the Brazilian Agricultural Research Corporation – Embrapa Eastern Amazon. The species were identified according to the APG-IV classification.
To make the diametric bands, stainless steel bands and springs were used and assembled according to the instructions by Higuchi & Higuchi (2012), in which: i) the metal band must have the size of the circumference of the target tree, with 13 cm added; ii) one hole is made at the beginning and another hole is made at a distance of 27 cm along the band;
iii) to fit the spring, a 7 cm opening is made in the band at a distance of 7 cm from the first end. After following these steps, the bands were installed on the trees preferably 10 cm above the height of the DBH, when it was not possible to install them on the portion of the tree stem that had no defect or imperfections that could affect the measurement of the diametric increment. The measurements were taken between December 2018 and January 2020, because of the necessity of the dendrometric band adaptation on tree stem there were no measurements in the months of January, February and April 2019. In the following months, the variation in growth in circumference of the individuals was measured according to the variation of the band opening in millimeters using a digital caliper with an accuracy of 0.01 mm. Thus, the DBH growth of the 100 selected trees was obtained by transforming the increment in circumference into diameter (Figure 3). The trees were separated into 5 diameter classes with a range of 10 centimeters each.

Floresta e Ambiente 2021; 28(4): e20210009
4 - 10 Pereira IRC, Morais VMC, Emmert F, Nascimento RGM
4
Figure 3. Procedure for collecting data on the increment in circumference (a) by measuring the opening of a dendrometric band (b) with the use of a digital calipers at the Experimental Farm of Igarapé Açu of Ufra, in the city of Igarapé Açu, Pará, Brazil.
The trees selected and measured using dendrometric bands were identified as belonging to 49 species and were distributed in 5 diametric classes with a range of 10 centimeters of DBH each, except the last one, which had no upper limit of DBH. The monthly periodic increment (MPI) was calculated using the equation 1:
Equation 1. Equation to calculate the monthly periodic increment means
Where, is the Monthly Periodic Increment of the ith tree in month j (cm/month); is the DBH of the ith tree at time j (cm); is the DBH of the ith tree in time (cm); p is the time between the two circumference measurements (days). To transform the data into a monthly basis, the results were multiplied by 30, since there were no measurements in the months of January, February, and April of 2019, and in addition, the measurements occurred once a month with a margin of 3 days more or less between them. Their classification into ecological groups (Table 1) was based on authors who mostly followed the methodology of Swaine & Whitmore (1988), which classifies species into ecological groups of Pioneers (P) and Non-Pioneers (NP).
Table 1. Classification of the trees into ecological groups of the species and diametric distribution of all the trees selected for the installation of diametric band at the Experimental Farm of Igarapé Açu of Ufra, in the city of Igarapé Açu, Pará, Brazil.
BF SCIENTIFIC NAME EG RADIAMETRIC CLASSES
I II III IV VAnacardiaceae Tapirira guianensis Aubl. P vi 3 6 1 1 -Annonaceae Duguetia marcgraviana Mart. NP ii 4 - - - - Guatteria poeppigiana Mart. P ii 2 - - - -Araliaceae Schefflera morototoni (Aubl.) Maguire et al. P ii - 2 - - 1Bignoniaceae Jacaranda copaia (Aubl.) D. Don. P x - 1 - - -Boraginaceae Cordia bicolor A. DC. NP xi 1 - - - -Calophyllaceae Caraipa densifolia Mart. NP ii - 1 - - -Clusiaceae Symphonia globulifera L.f. NP x 1 - 2 - -Elaeocarpaceae Sloanea grandiflora Sm. NP ii 1 - - - -Euphorbiaceae Hevea brasiliensis (Willd. ex A.Juss.) Müll.Arg. NP x 2 2 1 - - Margaritaria nobilis L. F. P iii 1 1 - - -
Continues...
Size, Ecology, and Seasonality...
Floresta e Ambiente 2021; 28(4): e20210009 5
5 - 10
BF SCIENTIFIC NAME EG RADIAMETRIC CLASSES
I II III IV VFabaceae Abarema jupunba (Willd.) Britton & Killip NP ii 1 - - - 1
Amphiodon effusus Huber NP x 1 - - - -Bowdichia virgilioides Kunth P iii 1 1 - - -Enterolobium timbouva Mart. NP xii 2 - - - -Inga cinnamomea Spruce ex Benth. P ii 1 - - - -Inga edulis Mart. NP ii 1 - - - -Inga rubiginosa (Rich.) DC. NP ii 1 1 - - -Inga velutina Willd. NP v 1 - - - -Macrolobium angustifolium (Benth.) R.S.Cowan NP v 2 - - - -Parkia nitida Miq. NP ii 1 - - - -Pithecellobium acacioides Ducke P ix - - 1 - 1
Swartzia panacoco (Aubl.) R.S.Cowan NP vii 1 - - - -Lauraceae Nectandra cuspidata Nees & Mart. NP x 1 - - - - Ocotea guianensis Aubl. NP ii 4 1 - - 1Lecythidaceae Eschweilera coriacea (DC.) S.A.Mori NP v - - 1 - -
Eschweilera grandiflora (Aubl.) Sandwith NP x 1 - - - - Lecythis lurida (Miers) S.A.Mori NP iii - 1 - 1 -Malvaceae Apeiba echinata Gaertn. NP x - - - - 1Moraceae Clarisia racemosa Ruiz & Pav. NP iv 1 - - - - Maquira sclerophylla (Ducke) C.C.Berg P x 1 - - - -Myristicaceae Iryanthera juruensis Warb. NP ii - - - - 1
Virola Aubl. Ni ni 2 - - - -Virola michelii Heckel NP xi - 1 - - -
Virola surinamensis (Rol. ex Rottb.) Warb. NP x 1 2 - 1 -Myrtaceae Eugenia L. NP x 1 - - - -Nyctaginaceae Neea floribunda Poepp. & Endl. NP ii 3 - - - -Ochnaceae Ouratea castaneifolia (DC.) Engl. NP iii 1 - - - -Rubiacea Alibertia stipularis (Ducke) W.Schultze-Motel Ni ni 1 - - - - Palicourea marcgravii A.St.-Hil. NP iii 1 - - - -Salicaceae Banara arguta Briq. P i 1 - - - -
Casearia arborea (Rich.) Urb. NP viii 1 - - - - Casearia sylvestris Sw. P i 1 - - - -Sapindaceae Sapindus saponaria L. NP iii 1 - - - -Sapotaceae Pouteria caimito (Ruiz & Pav.) Radlk. NP x 1 - - - -Simaroubaceae Simarouba amara Aubl. NP x 4 - - - -Urticaceae Cecropia distachya Huber P ii 2 - - - - Pourouma guianensis Aubl. P x 3 - 1 - -Vochysiaceae Vochysia maxima Ducke NP x - - - - 1
Legend: BF = Botanical Family; EG = Ecological Group; P = Pioneers; NP = Non Pioneers; RA = Reference Author; i = Abreu (2013); ii = Amaral (2009); iii = EMBRAPA (2020); iv = Ferraz (2004); v = Gama (2002); vi = Araújo (2010); vii = Nascimento (2016); ni = Unidentified; viii = Silva (2003); ix = Silva (2018); x = Trindade (2016); xi = Prata (2007) e; xii: Bezerra (2010).
Table 1. Continued...
After classifying the species into ecological groups and into diameter classes, the means of the increments were compared using an analysis of variance (ANOVA) with a double factor model in random blocks performed, in the R Core Team 2020 program with the Rstudio compilation interface. The analysis factors were the months (MON), the diametric classes (CLA) and the ecological groups (EG), in a random block scheme with the months as blocks and the diametric classes and ecological groups as factors. For those factors for which there
was a significant difference, a Tukey’s test was applied to test the contrast between the means.
3. RESULTS AND DISCUSSION
In ANOVA results presented in the Table 2, the effect of months, diametric classes, and ecological groups on growth were verified, as well as the existence of interaction between them in the analysis of the diametric increments of the Feiga species.

Floresta e Ambiente 2021; 28(4): e20210009
6 - 10 Pereira IRC, Morais VMC, Emmert F, Nascimento RGM
6
Table 2. Analysis of variance (ANOVA) results of the monthly periodic increment (MPI) in centimeters of the diameter according to the factors: Ecological group - EG; Diameter class - CLA; Month of collection - MON and its interactions at the Experimental Farm of Igarapé Açu of Ufra, in the city of Igarapé Açu - PA
SOURCE OF VARIATION DF SQ MQ F P Value
EG 1 0,0326 0,0326 6,1478 0,0133CLA 4 0,0709 0,0177 3,3381 0,0100
MON 9 0,2944 0,0327 6,1625 0,0183EG : CLA 4 0,1363 0,0340 6,4188 0,0427
EG : MON 9 0,0328 0,0036 0,6864 0,7217CLA : MON 36 0,1842 0,0051 0,9642 0,5304
EG : CLA : MON 36 0,1045 0,0029 0,5468 0,9867Residuals 923 4,8986 0,0053
Legend: DF = degrees of freedom, SQ = sum of squares, MQ = Mean squares, F value = F statistic, P value = P value for F value. p values in bold indicate significance at 5% probability.
ANOVA results indicated that there was an interaction between the MPI averages of the ecological groups and diametric classes, but the variable months was the only one that did not show interaction with the others. To model the data analysis of the experiment more accurately, the MON variable was changed to an additive variable instead of an interaction variable. Thus, Table 3 shows the modified ANOVA for this experiment, with MON as the block — because there was certainty that there was a difference between them — and EG and CLA as the factors. With the removal of the interaction of the MON factor, it was observed that there was a significant difference between the means of MPI of the factors EG, CLA, MON (isolated) and when EG interacted with CLA. The difference was highly significant in the MON variable when isolated, and in the interaction of the EG variable, it interacted with CLA. In EG, the difference was significant to 1% and in CLA the difference was significant to less than 1%.
Table 3. Analysis of variance (ANOVA) of the monthly periodic increment (MPI) in centimeters of the diameter as a function of two factors: Ecological group - EG; Diameter class - CLA and its interactions with the MON (month of collection) factor as an additive variable in this analysis.
SOURCE OF VARIATION DF SQ MQ F P Value
EG 1 0,0326 0,0326 6,2754 0,0124CLA 4 0,0709 0,0177 3,4074 0,0088
MON 9 0,2944 0,0327 6,2904 0,0108EG:CLA 4 0,1363 0,0340 6,5520 0,0331Residuals 1004 5,2201 0,0051
Legend: DF = degrees of freedom, SQ = sum of squares, MQ = Mean square, F value = F statistic, P value = P value for F value. p value in bold is significant at 5% probability.
When carrying out this second stage of the analysis, a test of normality of Shapiro Wilk was also performed, which
detected that at the level of 5%, the residuals generated by ANOVA were not normally distributed. This was explained by the form of increment distribution, which did not resemble the normal distribution, and was not distributed in a “balanced” way within the sample for this experiment. This aspect does not generate negative effects that the results of analysis need to be discarded, since the other assumptions of variance analysis were met for the analyzed data. Table 4 shows the MPI averages of the ecological groups within each diametric class.
Table 4. Analysis of the means of monthly periodic increment (MPI) in centimeters of the ecological groups of Pioneer and Non-Pioneer species within classes I, II, III, IV, and V in diameter.
DIAMETRIC CLASSES GROUP AVERAGES (cm)
Class IA 0,0384B 0,0224
Class IIA 0,0557B 0,0352
Class IIIA 0,0654B 0,0205
Class IVA 0,0480A 0,0036
Class VA 0,0689b 0,0240
Legend: Groupings with the same letters refer to statistically identical averages at the 5% probability level.
Since there were differences between the MPI means among ecological groups and among diametric classes, Table 4 demonstrates the analysis results which indicate the groups and classes that represent these differences (or parities) among the MPI means. The monthly increment averages per ecological group were compared within the diameter class factor levels. The mean comparison test revealed that there were differences between the means of MPI within the classes I, II, III, and V of diameter. In class IV, the test showed that the MPI means of the ecological groups were statistically equal. It is possible to affirm that the means of MPI in this class were different (0.0480 cm and 0.0036 cm), however, they were statistically equal, since a greater variability within the groups suggests a greater uncertainty about their true mean. Therefore, at the resulting probability level, it was not possible to state that the means were different precisely because of the degree of uncertainty of the means. Thus, this test worked with the variance of the data around the means of each ecological group and diameter class and suggested that, in class IV, the means were equal. ANOVA indicated that the means of MPI of the MON variable interacted with each other. Figure 4 shows that the averages of the two ecological groups distributed in the five diametric classes were different for each month analyzed. As shown in table 4, class IV had statistically equal MPI means of the ecological groups.

Size, Ecology, and Seasonality...
Floresta e Ambiente 2021; 28(4): e20210009 7
7 - 10
Figure 4. Curves of the monthly periodic increment (MPI) averages in centimeters for the Pioneer and Non-Pioneer species groups for each diameter class.
Figure 4 indicates that the means of the Pioneer and Non-Pioneer species were equal in this class when compared to each other for each month. However, each month had a different MPI average. Class I showed equal ecological group averages in every month except August. Class II had averages of the same ecological groups in October and December and different averages in the other months. Class III showed a difference between the means of the two groups in all months and the same result was identified in Class V.
Some characteristics influence the difference between the MPI averages of the Pioneer and Non-Pioneer species group. According to the study by Kanieski et al. (2017) in a mixed ombrophilous forest in southern Brazil, the difference in increment between trees is related to the sociological position (canopy or undergrowth). In their research, the rates of increment of trees in the understory were lower than those in the canopy, with a significant difference. This may explain the differences found in this study. According to Brienen et al. (2006), juvenile trees tend to present significant growth autocorrelations, as they are temporally linked to the variation in light availability due to canopy dynamics, while larger trees are influenced by environmental factors, such as vine infestations, which can cause growth differences among trees. The growth inequalities in some groups reveal the need to consider a differentiated growth pattern in the production estimates of a forest, since the forest does not have a single growth pattern, thus avoiding information that is highly discrepant from reality (Vatraz, 2018).
As in Igarapé-Açu, the study by Moraes (1970) indicated that the diametric growth of species from the Mocambo reserve
in an urban forest of Belém had one of its peaks in the month of March and was influenced by rain, but for some species, light could be the limiting factor of this growth. According to the same author, in tropical forests, some characteristics such as altitude, location, disturbance, and topography can influence the availability of water and soil nutrients. In addition, climatic and ecological aspects, such as shade availability, may explain the levels of development of species (Kariuki et al., 2006). These and other factors, together with species-specific characteristics can help in understanding the growth patterns of these populations. We then analyzed the MPI averages of each diameter class within the Pioneer and Non-Pioneer species group represented in table 5.
Table 5. Analysis of MPI averages of classes I, II, III, IV, and V in diameter within the group of Non-Pioneers and Pioneers.
NON-PIONEERS PIONEERS
GROUP CLASS MEANS(cm) GROUP CLASS MEANS
(cm)a II 0,0557 A V 0,0689a IV 0,0480 A III 0,0654b V 0,0240 B I 0,0386b I 0,0224 B II 0,0352b III 0,0205 C IV 0,0036
In the Non-Pioneer species group, the averages were organized in a decreasing order and received two groupings: “a” and “b”. In this case, the diameter classes II and IV were part of group “a”, that is, their MPI averages were statistically equal. In addition, these were the classes with the highest MPI averages within the group of Non-Pioneer trees. Classes
Floresta e Ambiente 2021; 28(4): e20210009
8 - 10 Pereira IRC, Morais VMC, Emmert F, Nascimento RGM
8
V, I, and III correspond to group “b” and were statistically equal, presenting the lowest MPI averages of this analysis.
The averages of the Pioneers’ group were also organized in a decreasing order, but three groups were grouped: “a”, “b”, and “c”. The treatment “a” grouped the classes V and III which had statistically equal MPI means. This suggests that the MPI averages were equal among trees with DBH between 30 cm and 40 cm and among trees with DBH equal or greater than 50 cm. Classes I and II were grouped into “b” with statistically equal means, that is, equal means among trees with DBH between 10 cm and 20 cm and among trees with DBH between 20 cm and 30 cm. The grouping “c” corresponded only to class IV, in which the MPI was statistically different from the others and presented the lowest average of the five diameter classes.
In this experiment, the Non-Pioneer species had an average growth of 0.169 cm and the Pioneer species, 0.209 cm; the latter had the highest average. This difference can be explained by the inverse relation between wood density and tree increment. This aspect, according to Chave et al. (2006), indicates that when the increment of the tree is faster it suggests that the species invests lesser in conductive tissues and more in survival strategies. This results in a low wood density of some individuals, which is characteristic of Pioneer species.
The highest rainfall rates in the municipality of Igarapé-Açu occur between the months of February and April (Figure 1) with a peak in March (Pacheco & Bastos, 2005) and Figure 4 indicates that in that same month there was the highest diametric growth of this experiment. This indicates that there is a direct relationship between rainfall and diametric increment. Since excess rainfall influences the increase in diameter of species, the volumes of trees with low wood densities, such as those of Pioneer species, can be overestimated since there is an intense inflow of water into the tracheids. This fact does not significantly influence the volume of trees with higher wood densities (Almeida, 2008). Higuchi et al., (2011) identified a strong relationship between precipitation and diametric increment measured over 5 years through diametric bands in Central Amazonia. The same authors concluded that diametric growth is dependent on both the amount of rain and the way it is distributed throughout the year in the region.
Worbes (1999) working on tree ring analyses and dendrometer measurements of 26 tree species in a semi deciduous forest of the Reserva Forestal de Caparo Venezuela found that cambial growth was generally high during the rainy season and decreased to zero towards the end of the rainy season or soon after the beginning of the dry season. The study carried out by Silva et. al. (2003) in an experimental station of INPA,
proved that the relationship between precipitation and increment is direct. There was a tendency for higher increments to be associated with higher precipitation or, for lower increments to be associated with lower precipitation. The growth pattern in diameter is characterized by a decrease in the increment in the driest months of the year, from May to September. In addition, one of the two diametric growth peaks occurred in March, in view of the high rainfall detected, which was also found in the present study. Also in the same study, the authors showed that the largest increases were related to the largest diameters. Thus, the DBH ≥ 50 cm class had the highest value compared to the others, a result similar to that obtained in the MPI averages of Pioneer species in the Igarapé Açu experiment.
4. CONCLUSIONS
• The species class with DBH between 40 cm and 49.99 had similar MPI averages among both ecological equivalent groups, Pioneers and Non-pioneers;
• The Feiga forest shows the highest growth during the rainy season, as it had the highest MPI averages in this period of the year;
• The size classes and the characteristics of the ecological groups determined the average MPI values of the species present in the studied forest;
• There was a difference in the rate of growth of trees in the secondary forest of Feiga because there was a difference between the averages of monthly periodic increment of ecological groups and the diameter classes of species.
SUBMISSION STATUS Received: 17 Feb. 2021Accepted: 7 Oct. 2021Associate editor: Emanuel José Gomes de Araújo
CORRESPONDENCE TO Ingrid Raphaela Cromwell PereiraEstrada Principal da Ufra Curió Utinga, CEP 68515-000, Belém, PA, Brasil. e-mail: [email protected]
AUTHORS’ CONTRIBUTIONSIngrid Raphaela Cromwell Pereira: Formal analysis, Investigation, Writing – Original Draft.Vitor Mateus de Carvalho Morais: Methodology Writing – Review & Editing.Fabiano Emmert: Methodology, Resources, Writing – Revier & Editing, Supervision.Rodrigo Geroni Mendes Nascimento: Conceptualization, Writing – Review & Editing, Project administration.
Size, Ecology, and Seasonality...
Floresta e Ambiente 2021; 28(4): e20210009 9
9 - 10
REFERENCES
Abreu TSS. Estrutura de um remanescente de floresta estacional semidecidual ribeirinha da fazenda experimental da Universidade Federal da Grande Dourados, MS. Ensaios e Ciência: Ciências Biológicas, Agrárias e da Saúde 2013; 17(2): 71-83.
Almeida EC. Padrões de crescimento e predição da estrutura diamétrica com auxílio de bandas dendrométricas na floresta nacional de Caxiuanã-PA [dissertação]. Manaus: Instituto Nacional de Pesquisas da Amazônia; 2008.
Alvares CA, Stape JL, Sentelhas PC, Gonçalves JLM, Sparovek G. Köppen’s climate classification map for Brazil. Meteorogische Zeitschrift 2013; 22(6): 711-728.
Amaral DD, Vieira ICG, Almeida SS, Salomão RP, Silva ASL, Jardim MAG. Checklist da flora arbórea de remanescentes florestais da região metropolitana de Belém e valor histórico dos fragmentos, Pará, Brasil. [cited 2009 dez.]. Available from: https://repositorio.museu-goeldi.br/handle/mgoeldi/1424.
Andrade VMS, Cordeiro IMCC, Schwartz G, Rangel-Vasconcelos LGT, Oliveira FA. Considerações sobre clima e aspectos edafoclimáticos da mesorregião nordeste paraense. In: Cordeiro IMCC, Rangel-Vasconcelos LGT, Schwartz G, Oliveira FA. Nordeste Paraense: Panorama geral e uso sustentável das florestas secundárias. Belém; 2017.
Araújo EJG, David HC, Netto SP, Morais VA, Scolforo JRS. Padrão espacial de espécies arbóreas em fragmento de floresta estacional semidecidual. Revista de Ciências Agrárias 2010; 57(2): 166-171.
Bezerra LCBR. Prospecção de moléculas com potencial nutracêutico em sementes de enterolobium contortisiliquum (VELL.) morong.: purificação e caracterização parcial de três inibidores de quimotripsina [dissertação]. Fortaleza-Ceará: Universidade Federal do Ceará; 2010.
Bower DR, Blocker WW. Notes and Observations: Accuracy of bands and tape for measuring diameter increments. Journal of Forestry 1966; 64(1): 21-22.
Brienen RJW, Zuidema PA, During HJ. Autocorrelated growth of tropical forest trees: unraveling patterns and quantifying consequences. Forest Ecology and Management 2006; 273(1-3): 179-190.
Chave J, Muller-Landau HC, Baker T, Easdle TA, Steege HT, Webb C. Regional and phylogenetic variation of wood density acrocc 2.456 neotropical tree spicies. Ecological Society of America 2006; 16(6): 2356–2367.
Cordeiro, IMCC, Rangel-Vasconcelos LGT, Schwartz G, Oliveira FA. Nordeste paraense: panorama geral e uso sustentável das florestas secundárias. Belém: EDUFRA; 2017.
Embrapa. Available from: http://www.agencia.cnptia.embrapa.br/gestor/especies_arboreas_brasileiras/arvore/CONT000fyiy6r3n02wx5ok0pvo4k31ocbs2r.html.
Embrapa. Listagem das Famílias e Espécies nativas encontradas na regeneração natural de plantios de Eucalyptus do Brasil, separadas por seus respectivos nomes populares, hábito de crescimento, bioma de ocorrência, classe sucessional e síndrome de dispersão. Available from: https://www.cnpm.embrapa.br/projetos/silvicultura/download/tab3_eucalipto_brasil.pdf.
Encinas JI, Silva GE, Pinto JRR. Idade e crescimento das árvores. Brasília: Departamento de Engenharia Florestal da Universidade de Brasília; 2005
Enright N, Ogden J. Applications of transition matrix models in Forest dynamics: Araucaria in Papua New Guinea and Nothofacus in New Zealand. Australian Journal of Ecology 1979; 4(1): 3-21.
Ferraz IDK, Filho NL, Imakawa AM, Varela VP, Rodrigues FCMP. Características básicas para um agrupamento ecológico preliminar de espécies madeireiras da floresta de terra firme da Amazônia Central. Acta Amazonica, 2004; 34(4): 621-633.
Ferreira MSG. Bacurizeiro (Platonia insignis Mart.) em florestas secundárias: possibilidades para o desenvolvimento sustentável no Nordeste Paraense [tese]. Brasília: Universidade de Brasília; 2008.
Filho AF, Hubie SR, Schaaf LB, Figueiredo DJ, Sanquetta CR. Avaliação do incremento em diâmetro com o uso de cintas dendrométricas em algumas espécies de uma Floresta Ombrófila Mista localizada no Sul do Estado do Paraná. Revista Ciências Exatas e Naturais, Irati 2003. Available from: https://revistas.unicentro.br/index.php/RECEN/article/viewFile/434/589.
Gama JRV, Botelho AS, Bentes-Gama MM. Composição florística e Estrutura da regeneração natural de floresta secundária de Várzea Baixa no Estuário Amazônico. Revista Árvore 2002; 5(1).
Higuchi, N.; Santos, J.; Lima, A. J. N.; Higuchi, F. G.; Chambers, J. Q. a Floresta amazônica e a água da chuva. Revista Floresta, Curitiba, v. 41, n. 3, p. 427-434. 2011. Available from: < http://dx.doi.org/10.5380/rf.v41i3.24060>.
Higuchi MIG, Higuchi N. A floresta amazônica e suas múltiplas dimensões: uma proposta de educação ambiental. 2nd. Manaus; 2012.
Husch B, Miller CI, Beers TW. Forest Mensuration. 3 erd. New York: John Wiley & Sons; 1982.
Kanieski MR, Galvão F, Longui-Santos T, Milani JEF, Botosso PC. Parâmetros Climáticos e Incremento Diamétrico de Espécies Florestais em Floresta Aluvial no Sul do Brasil. Floresta e Ambiente 2017; 24.
Kariuki M, Rolfe M, Smith RGB, Vanclay JK, Kooyman RM. Diameter growth performance varies with species functional-group andhabitat characteristics in subtropical rainforests. Forest Ecology and Management 2006; 255(1-3): 1-14.
Keeland BD, Sharitz RR. Accuracy of tree growth measurements using dendrometer bands. Canadian Journal of Forest Research 1993; 23(11).
Kershaw Jr JA, Ducey MJ, Beers TW, Husch B. Forest mensuration. 5th. 2016; John Wiley & Sons.
Leoni JM, Fonseca SF, Schöngart J. Growth and population structure of the tree species Malouetia tamaquarina (Aubl.) (Apocynaceae) in the central Amazonian floodplain forests and their implication for management. Forest Ecology and Management 2011; 261(1): 62-67.
Loetsch F, Zöhrer F, Haller KE. Forest inventory. München: BVL Verlagsgesellschft; 1973.
Moraes VHF. Periodicidade de crescimento do tronco em árvores da floresta amazônica. Pesquisa Agropecuária Brasileira 1970; 5: 315-320.
Nascimento RGM. Modelagem e simulação do crescimento e produção de floresta tropical manejada na amazônia oriental [tese]. Curitiba: Universidade Federal do Paraná, Curitiba; 2016.
Odum EP. Ecología. 6th. Mexico: Interamericana; 1976.

Floresta e Ambiente 2021; 28(4): e20210009
10 - 10 Pereira IRC, Morais VMC, Emmert F, Nascimento RGM
10
Pacheco NA, Bastos TX. Boletim agrometeorológico 2004 Igarapé-Açu, PA. Belém: Embrapa Amazônia Oriental-Documentos (INFOTECA-E); 2005. Available from: http://www.infoteca.cnptia.embrapa.br/infoteca/handle/doc/391507.
Pacheco NA, Bastos TX. Boletim agrometeorológico 2006 Igarapé-Açu, PA. Belém: Embrapa Amazônia Oriental-Documentos (INFOTECA-E); 2007. Available from: https://www.infoteca.cnptia.embrapa.br/bitstream/doc/409613/1/Doc296.pdf.
Pereira C, Vieira ICG. A importância das florestas secundárias e os impactos de sua substituição por plantios mecanizados de grãos na amazônia. Interciencia 2001 26(8): 337-341.
Prata SS. sucessão ecológica da vegetação arbórea em florestas secundárias do nordeste do estado do Pará [dissertação]. Belém: Universidade Fed eral Rural da Amazônia e Museu Paraense Emílio Goeldi; 2007.
Prodan M, Peters R, Cox F, Real P. Mensura Forestal. Investigacion y Educacion en Desarrollo Sostenble. IICA; 1997.
R Foundation for Statistical Computing. Austria. Availabre from: https://www.R-project.org/. 2020.
Rocha RM. Taxas de Recrutamento e Mortalidade da Floresta de Terra-firme da Bacia do Rio Caieiras na região de Manaus-AM [dissertação]. Manaus: Universidade do Amazonas; 2001.
Silva JAA, Neto FP. Princípios básicos da dendrometria. Recife: Universidade Federal Rural de Pernambuco, Departamento de Ciências Florestais; 1979.
Silva RP, Nakamura S, Azevedo CP, Chambers J, Rocha RM, Pinto ACM, Santos J, Higuchi N. Uso de banda dendrométrica na definição de padrões de crescimento individual em diâmetro de árvores da bacia do rio Cuieiras. Acta Amazonica 2003; 33(1): 67-84.
Silva AF, Oliveira RV, Santos NRL, Paula A. Composição florística e grupos ecológicos das espécies de um trecho de floresta semidecídua
submontana da fazenda São Geraldo, Viçosa-MG. Revista Árvore 2003; 27(3): 311-319.
Silva JR, Ramos SJ, Neto AC, Júnior CFC, Gastauer M, Mitre S, Siqueira O. Initial growth of Fabaceae species: Combined effects of topsoil and fertilizer application for mineland revegetation. Flora - Morphology Distribution Functional Ecology of Plants 2018; 246-267: 109-117.
Schöngart, J. Growth-Oriented Logging (GOL): A new concept towards sustainable forest management in Central Amazonian várzea floodplains. Forest Ecology and Management 2008; 256(1): 46-58.
Scolforo JRS. Modelagem do crescimento e da produção de florestas plantadas e nativas. Lavras: UFLA FAEPA; 1998
Swaine MD, Whitmore TC. On the definition of ecological species groups in tropical rain forests. Vegetatio 1988 75(1): 81-86.
Trindade NGP. Manejo florestal e aspectos físico-químicos do solo afetam a composição florística de uma floresta ombrófila densa na amazônia oriental [dissertação]. Altamira: Universidade Federal do Pará, Altamira; 2016.
Vanclay JK. Modelling forest growth and yield: Applications to mixed tropical forests. Wallingford: CAB International; 1994.
Vatraz S, Alder D, Silva JNM. Autocorrelação temporal do incremento em diâmetro e as diferenças de crescimento entre grupos de espécies em uma floresta ombrófila densa. Revista Brasileira de Biometria 2018; 3(1).
Vieira ICG, Toledo PM, Almeida A. Análise das modificações da paisagem da região bragantina, no Pará, integrando diferentes escalas de tempo. Ciência e Cultura 2007; 59(3): 27-30.
Worbes, M. Annual growth rings, rainfall‐dependent growth, and long‐term growth patterns of tropical trees from the Caparo Forest Reserve in Venezuela. Journal of ecology 1999, 87(3), 391-403.