size and structure 2013 vweb2 100,000 of these recipients directly employ their own staff. the total...
TRANSCRIPT

The size and structure of the adult social care sector and workforce in England, 2013September 2013
we provide statistics on the adult social care workforce
nmds-sc™
national minimumdata set for social care

The size and structure of the adult social care sector and workforce in England, 2013
Published by Skills for Care, West Gate, 6 Grace Street, Leeds LS1 2RP www.skillsforcare.org.uk
© Skills for Care 2013
Reference no. R055
Copies of this work may be made for non-commercial distribution to aid social care workforce development. Any other copying requires the permission of Skills for Care.
Skills for Care is the employer-led strategic body for workforce development in social care for adults in England. It is part of the sector skills council, Skills for Care and Development.
Bibliographic reference data for Harvard-style author/date referencing system: Short reference: Skills for Care [or SfC] 2013 Long reference: Skills for Care, The size and structure of the adult social care sector and workforce in England, 2013, (Leeds, 2013) www.skillsforcare.org.uk
1 Introduction 1 1.1 Note on methodological improvements 2
2 Statistics on adult social care employers 3 2.1 Introduction 3 2.2 Estimated number of adult social care organisations (enterprises) 4 2.3 Estimated number of adult social care establishments (local units of employment) 6 2.4 Trend data – adult social care organisations and establishments 8 2.4.1 Organisations 8 2.4.2 Establishments 9 2.5 Individuals employing their own staff 10 2.5.1 Direct payments recipients 10 2.5.2 Direct payments recipients trends 12 2.5.3 Other individuals employing their own staff 14
3 Statistics on the adult social care workforce 15 3.1 Introduction 15 3.2 Number of adult social care jobs 16 3.2.1 Type of employer 16 3.2.2 Main service 18 3.2.3 Job role groups 20 3.2.4 Employment type 21 3.3 Number of whole time equivalent (WTE) adult social care jobs 22 3.4 Number of people working in adult social care 23 3.5 Trend data – number of adult social care jobs 25
4 Projections of the future adult social care workforce 28
5 Appendices 30 5.1 Appendix 1: Methodology 30 5.1.1 Adult social care employers 30 5.1.2 Adult social care workforce 32 5.1.3 Data quality overview 36 5.2 Appendix 2: Future workforce scenarios 39 5.3 Appendix 3: Cross tabulations and regional estimates 39 5.4 Appendix 4: Local authority level estimates 39
Contents

Acknowledgements
We are grateful to many people who have contributed to this report. Particular thanks are dueto: � Will Fenton of Skills for Care’s workforce intelligence team for researching, compiling and
analysing the data for the report and for the interpretation of the results.
� Adam Andrew of Skills for Care’s workforce intelligence team for creating the regional and CSSR level estimates provided as appendices to the report.
� Kevin Mahoney of Diagnostic Decisions for assisting in producing some of the new and improved methodologies and also for creating the workforce projections model.
� Skills for Care is also grateful to all the employers who have completed NMDS-SC data - without their hard work estimates of this detail and accuracy would not be possible.
Feedback on any aspect of the report will be very welcome and will help to improve future editions.
Please contact Skills for Care’s analysis team [email protected]
1
1. Introduction
This report has been produced by Skills for Care and provides a comprehensive overview of the size and structure of the adult social care sector and workforce in England as at 2012.
The report draws on several data sources to produce these estimates. The majority of the detail, however, comes from the National Minimum Data Set for Social Care (NMDS-SC).
The NMDS-SC is managed by Skills for Care on behalf of the Department of Health and has been collecting information about social care providers and their staff since 2006. Increased volumes and improved quality of data held by the NMDS-SC means these estimates are the most detailed and reliable to date.
Summary of key findings
Adult social care employers
� An estimated 17,0001 organisations were involved in providing or organising adult social care in England as at 2012— an increase of 2.5% from 2011.
� An estimated 39,0002 establishments were involved in providing or organising adult social care in England as at 2012— an increase of 1.5% from 2011.
� Around 193,000 adults, older people and carers were receiving direct payments from councils’ social services departments as at March 2012 — it is estimated that approximately 100,000 of these recipients directly employ their own staff.
� The total number of direct payments recipients continued to increase (by 8% between 2011 and 2012). There is evidence, however, that the growth of this part of the sector may be beginning to plateau.
Adult social care workforce
� The number of adult social care jobs in England as at 2012 was estimated at 1.63 million.
� The number of people doing these jobs was estimated at 1.50 million.
� The number of whole time equivalent jobs was estimated at 1.23 million.
� The number of adult social care jobs was estimated to have increased by around 4% between 2011 and 2012 and by 15% since 2009.
� Since 2009 the workforce has continued to shift away from local authority services (-15%) and towards independent employers (+15%), the personalisation of adult social care is also apparent with a large increase in the number of jobs for direct payments recipients since 2009 (+50%).
� The growth in the number of adult social care jobs is roughly following that projected by the ‘maximising choice’ scenario. Under this scenario the number of adult social care jobs is projected to grow to around 2.6 million by 2025.
1 The total number of PAYE - or VAT-registered whole organisations (i.e. enterprises).2 The total number of PAYE - or VAT-registered establishments (i.e. local units).
2
1.1 Note on methodological improvements
For this year’s report Skills for Care has made two significant improvements to the methodology for estimating the size of the adult social care sector and workforce. These two changes and their implications are briefly explained below, for more details please see appendix 1.
(1) Improvements to the way the number of direct payments recipients that employ staff and their workforce were estimated
In previous versions of this report, due to a lack of information, all direct payments recipients were treated as employers. This was acknowledged to be very likely to produce an overestimate of the number of direct payments recipients employing staff and their workforce. As such, for this year’s report, Skills for Care carried out some additional research to estimate the proportion of direct payments recipients that directly employ staff themselves.
This methodological improvement has resulted in a significant change to these estimates. As such estimates from this report should not be directly compared with estimates from previous reports.
This improved calculation has been applied retrospectively, within this report, to previous year’s estimates to allow for accurate ‘real’ trends to be produced, these trends are provided in section 2.5 (direct payments recipients) and section 3.4 (number of jobs).
(2) Improvements to estimates of the number of non-CQC regulated employers and their workforce
For this year’s report, Skills for Care carried out some additional research into the types of services provided by non-CQC regulated employers in SIC codes 88990 (Other social work activities without accommodation) and 87900 (Other residential care activities).
This additional research identified a relatively large number of employers that were incorrectly coded as social care and others that were not directly providing social care. Removing these employers has resulted in significant changes to the estimates of the number of organisations and establishments in the adult social care sector (and in turn to the number of jobs). As such estimates from this report should not be directly compared with estimates from previous reports.
Again, this improved calculation has been applied retrospectively, within this report, to previous year’s estimates to allow for accurate ‘real’ trends to be produced, these trends are provided in section 2.4 (for organisations and establishments) and section 3.4 (for the number of jobs).
Skills for Care have made significant methodological improvements to estimates of the size of the sector and workforce in this year’s report.
Therefore estimates from this report should not be directly compared with previous reports. All methodological changes have been applied retrospectively and are presented within this report.

3
2. Statistics on adult social care employers
This section summarises the available data about the number of employers in England involved in providing or organising social care services for adults or older people.
2.1 Introduction
The estimates in this section have been produced using the Office for National Statistics (ONS) Inter-Departmental Business Register (IDBR). The IDBR defines social care reasonably well, particularly because it provides numbers of PAYE registered operations as well as VAT-registered operations. The IDBR also splits the data by the 2007 version of the UK Standard Industrial Classification of Economic Activity (SIC2007) which classifies social care into two groupings: “residential social care activities” (group 87) and “social work activities without accommodation” (group 88). This is a very useful distinction and provides a more detailed breakdown than is available for some other sectors.
Despite these advances, some issues and uncertainties associated with making these estimates remain:
� Some social care employers are recorded under non-social care specific SIC2007 codes and are therefore not captured:
� some integrated health and social care operations are recorded under healthcare SIC2007 codes.
� some employment agencies supplying social care staff are recorded under SIC2007 7820 (temporary employment agency activities)
� some sheltered housing and supported living operations may be recorded under SIC2007 68201 (renting and operating of housing association real estate)
� some council central social services operations are included in SIC2007 84120 (regulation of the activities of providing health care, education, cultural services and other social services).
� Separating adults’ and children’s services requires some estimates and assumptions.
� Some non-social care providing employers are incorrectly coded under social care SIC2007 codes and others in social care SIC2007 codes do not directly provide social care. Some estimates and assumptions are required to remove these.
� PAYE-registered individuals employing care and support staff, for themselves or in a carer capacity, are not treated as businesses by ONS and therefore are not included in the IDBR or its statistics. These employers are therefore reported on separately in section 2.5.
� Employers that are not registered for PAYE or VAT, such as some sole traders and self-employed people will not be captured by the IDBR and therefore will not be included.
However, despite these uncertainties, the IDBR defines social care reasonably well and provides a solid statistical framework for producing reliable estimates of the number of adult social establishments, organisations and their associated workforce.
4
The definition of organisations ranges from the largest international companies, large charities and councils with social services responsibilities (CSSRs) to the smallest independent care homes. It does not, however, include individuals employing their own care and support staff (see section 2.5 for details about these employers).
Although this estimate should be an accurate reflection of the number of organisations in adult social care, it should be noted that it does not include some social care operations that are included in non-social care specific SIC2007 codes in the IDBR. It also required some assumptions to remove children’s establishments and non-social care organisations incorrectly coded under social care SIC2007 codes (see section 2.1 for more details).
Table 2.1 shows a breakdown of the number of organisations by service type and organisation size.
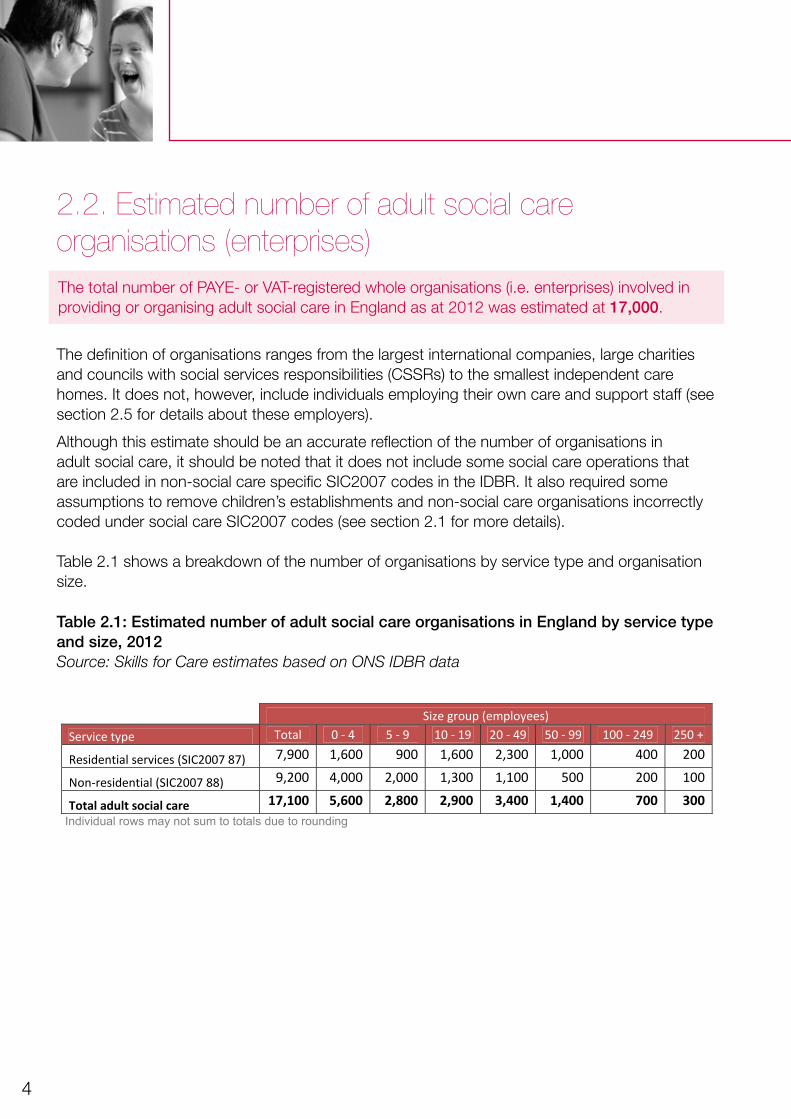
2.2. Estimated number of adult social care organisations (enterprises)The total number of PAYE- or VAT-registered whole organisations (i.e. enterprises) involved in providing or organising adult social care in England as at 2012 was estimated at 17,000.
Table 2.1: Estimated number of adult social care organisations in England by service type and size, 2012Source: Skills for Care estimates based on ONS IDBR data
- 7 -
2.2. Estimated number of adult social care organisations (enterprises)
The definition of organisations ranges from the largest international companies, large charities and councils with social services responsibilities (CSSRs) to the smallest independent care homes. It does not, however, include individuals employing their own care and support staff (see section 2.5 for details about these employers).
Although this estimate should be an accurate reflection of the number of organisations in adult social care, it should be noted that it does not include some social care operations that are included in non-social care specific SIC2007 codes in the IDBR. It also required some assumptions to remove children’s establishments and non-social care organisations incorrectly coded under social care SIC2007 codes (see section 2.1 for more details).
Table 2.1 shows a breakdown of the number of organisations by service type and organisation size.
Table 2.1: Estimated number of adult social care organisations in England by service type and size, 2012 Source: Skills for Care estimates based on ONS IDBR data
Size group (employees) Service type Total 0 ‐ 4 5 ‐ 9 10 ‐ 19 20 ‐ 49 50 ‐ 99 100 ‐ 249 250 +
Residential services (SIC2007 87) 7,900 1,600 900 1,600 2,300 1,000 400 200
Non‐residential (SIC2007 88) 9,200 4,000 2,000 1,300 1,100 500 200 100
Total adult social care 17,100 5,600 2,800 2,900 3,400 1,400 700 300 Individual rows may not sum to totals due to rounding
The total number of PAYE- or VAT-registered whole organisations (i.e. enterprises) involved in providing or organising adult social care in England as at 2012 was estimated at 17,000.
5
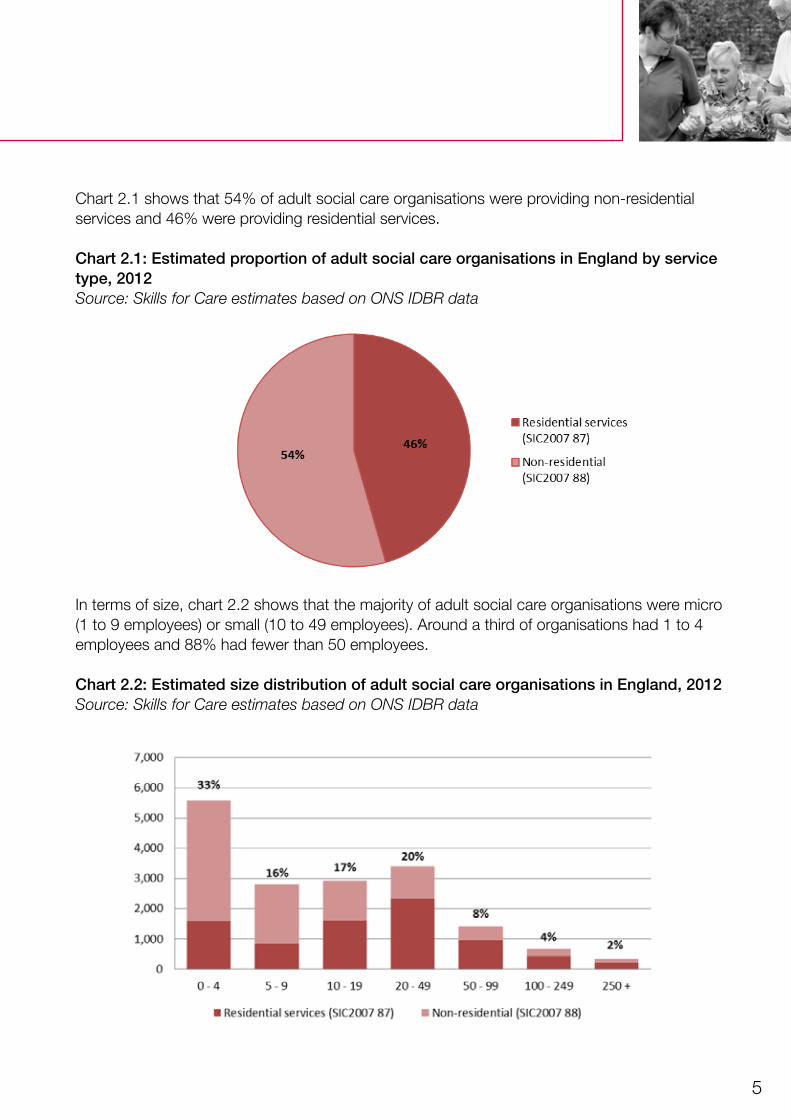
Chart 2.1 shows that 54% of adult social care organisations were providing non-residential services and 46% were providing residential services.
Chart 2.1: Estimated proportion of adult social care organisations in England by service type, 2012Source: Skills for Care estimates based on ONS IDBR data
- 8 -
Chart 2.1 shows that 54% of adult social care organisations were providing non-residential services and 46% were providing residential services.
Chart 2.1: Estimated proportion of adult social care organisations in England by service type, 2012Source: Skills for Care estimates based on ONS IDBR data
In terms of size, chart 2.2 shows that the majority of adult social care organisations were micro (1 to 9 employees) or small (10 to 49 employees). Around a third of organisations had 1 to 4 employees and 88% had fewer than 50 employees.
Chart 2.2: Estimated size distribution of adult social care organisations in England, 2012 Source: Skills for Care estimates based on ONS IDBR data
In terms of size, chart 2.2 shows that the majority of adult social care organisations were micro (1 to 9 employees) or small (10 to 49 employees). Around a third of organisations had 1 to 4 employees and 88% had fewer than 50 employees.
Chart 2.2: Estimated size distribution of adult social care organisations in England, 2012Source: Skills for Care estimates based on ONS IDBR data
- 8 -
Chart 2.1 shows that 54% of adult social care organisations were providing non-residential services and 46% were providing residential services.
Chart 2.1: Estimated proportion of adult social care organisations in England by service type, 2012Source: Skills for Care estimates based on ONS IDBR data
In terms of size, chart 2.2 shows that the majority of adult social care organisations were micro (1 to 9 employees) or small (10 to 49 employees). Around a third of organisations had 1 to 4 employees and 88% had fewer than 50 employees.
Chart 2.2: Estimated size distribution of adult social care organisations in England, 2012 Source: Skills for Care estimates based on ONS IDBR data

6
2.3 Estimated number of adult social care establishments (local units of employment)The total number of PAYE- or VAT-registered establishments (i.e. local units) involved in providing or organising adult social care in England as at 2012 was estimated at 39,000.
Table 2.2 shows a breakdown of the 39,000 adult social care establishments in England as at 2012. Almost 18,000 of these establishments were Care Quality Commission (CQC) regulated and offering residential services. The service types included in this category were care homes with nursing (4,650), care only homes (13,200), shared lives services (150) and other types of residential services (50).3
Approximately 3,000 non-CQC regulated establishments were also offering residential services. This category includes homeless shelters, women’s refuges, drug and alcohol support centres and a diverse range of other residential services.
There were around 7,500 CQC regulated non-residential establishments. The service types included in this category were domiciliary care services (7,050), supported living services (1,600), extra care housing services (550), nursing agencies (300) and other types of CQC regulated non-residential services (150).
Approximately 11,000 non-CQC regulated establishments were also offering non-residential services. This category includes day care, carers’ support and a range of community support and outreach services for vulnerable people.
Table 2.2: Estimated number of adult social care establishments in England by service type, 2012Source: Skills for Care estimates based on CQC and IDBR data
3 Locations can offer more than one type of service, therefore the total services does not sum to the total number of locations (this applies to residential and non-residential).
- 9 -
2.3 Estimated number of adult social care establishments (local units of employment)
Table 2.2 shows a breakdown of the 39,000 adult social care establishments in England as at 2012. Almost 18,000 of these establishments were Care Quality Commission (CQC) regulated and offering residential services. The service types included in this category were care homes with nursing (4,650), care only homes (13,200), shared lives services (150) and other types of residential services (50).3
Approximately 3,000 non-CQC regulated establishments were also offering residential services. This category includes homeless shelters, women’s refuges, drug and alcohol support centres and a diverse range of other residential services.
There were around 7,500 CQC regulated non-residential establishments. The service types included in this category were domiciliary care services (7,050), supported living services (1,600), extra care housing services (550), nursing agencies (300) and other types of CQC regulated non-residential services (150).
Approximately 11,000 non-CQC regulated establishments were also offering non-residential services. This category includes day care, carers’ support and a range of community support and outreach services for vulnerable people.
Table 2.2: Estimated number of adult social care establishments in England by service type, 2012Source: Skills for Care estimates based on CQC and IDBR data
Service type Count Percentage CQC regulated residential establishments 17,700 45%
Estimated non‐CQC regulated residential establishments 3,200 8%
Total estimated PAYE/VAT‐registered residential establishments 20,900 53%
CQC regulated non‐residential establishments 7,400 19%
Estimated non‐CQC regulated non‐residential establishments 10,900 28%
Total estimated PAYE/VAT‐registered non‐residential establishments 18,300 47%
Grand total – Estimated PAYE/VAT‐registered establishments 39,300
3 Locations can offer more than one type of service, therefore the total services does not sum to the total number of locations (this applies to residential and non-residential).
The total number of PAYE- or VAT-registered establishments (i.e. local units) involved in providing or organising adult social care in England as at 2012 was estimated at 39,000.

7
Chart 2.3 shows that there was roughly a 50/50 split between residential and non-residential establishments.
Chart 2.3: Estimated proportion of adult social care establishments in England by service type, 2012Source: Skills for Care estimates based on CQC and IDBR data
Chart 2.4 shows that around one-third of the adult social care establishments were non-CQC regulated. The majority of these non-regulated establishments offered non-residential services (see table 2.2).
Chart 2.4: Estimated proportion of adult social care establishments in England by regulation status, 2012Source: Skills for Care estimates based on CQC and IDBR data
53%47%
Residentialestablishments
Non-residentialestablishments
64%
36%CQC regulated
Non-CQC regulated
The preceding estimates, for organisations and establishments, do not include individuals employing their own staff (see section 2.5) or operations that are not registered for PAYE or VAT, such as some sole traders and self-employed people. Skills for Care are currently considering the feasibility of collecting data on self-employed people in the NMDS-SC, which could allow for estimates to be provided in the future.

8
2.4 Trend data – adult social care organisations and establishmentsThe total number of adult social care organisations is estimated to have increased by around 2.5 per cent between 2011 and 2012.
2.4.1 Organisations
Table 2.3 shows that the number of adult social care organisation increased steadily between 2009 and 2012 with increases of 1% between 2009 and 2010, 2% between 2010 and 2011 and 2.5% between 2011 and 2012.
Table 2.3: Estimated number of adult social care organisations, 2009–2012Source: Skills for Care estimates based on ONS IDBR data
- 11 -
2.4 Trend data – adult social care organisations and establishments
2.4.1 Organisations
Table 2.3 shows that the number of adult social care organisation increased steadily between 2009 and 2012 with increases of 1% between 2009 and 2010, 2% between 2010 and 2011 and 2.5% between 2011 and 2012.
Table 2.3: Estimated number of adult social care organisations, 2009–2012 Source: Skills for Care estimates based on ONS IDBR data
Estimated totals % change Service type 2009 2010 2011 2012 2009‐10 2010‐11 2011‐12
Residential services (SIC2007 87) 8,100 8,000 8,000 7,900 ‐0.5% ‐0.5% ‐0.5%Non‐residential (SIC2007 88) 8,200 8,400 8,700 9,200 +2.5% +4.0% +5.5%All organisations 16,200 16,400 16,700 17,100 +1.0% +2.0% +2.5%
Chart 2.5 shows that this trend was driven by non-residential organisations which increased by around 12% since 2009. The number of residential organisations decreased over the same period by around 2.5%.
Chart 2.5: Total number of adult social care organisations by service type, 2009-2102 Source: Skills for Care estimates based on ONS IDBR data
The total number of adult social care organisations is estimated to have increased by around 2.5 per cent between 2011 and 2012.
Chart 2.5 shows that this trend was driven by non-residential organisations which increased by around 12% since 2009. The number of residential organisations decreased over the same period by around 2.5%.
Chart 2.5: Total number of adult social care organisations by service type, 2009-2102Source: Skills for Care estimates based on ONS IDBR data
- 11 -
2.4 Trend data – adult social care organisations and establishments
2.4.1 Organisations
Table 2.3 shows that the number of adult social care organisation increased steadily between 2009 and 2012 with increases of 1% between 2009 and 2010, 2% between 2010 and 2011 and 2.5% between 2011 and 2012.
Table 2.3: Estimated number of adult social care organisations, 2009–2012 Source: Skills for Care estimates based on ONS IDBR data
Estimated totals % change Service type 2009 2010 2011 2012 2009‐10 2010‐11 2011‐12
Residential services (SIC2007 87) 8,100 8,000 8,000 7,900 ‐0.5% ‐0.5% ‐0.5%Non‐residential (SIC2007 88) 8,200 8,400 8,700 9,200 +2.5% +4.0% +5.5%All organisations 16,200 16,400 16,700 17,100 +1.0% +2.0% +2.5%
Chart 2.5 shows that this trend was driven by non-residential organisations which increased by around 12% since 2009. The number of residential organisations decreased over the same period by around 2.5%.
Chart 2.5: Total number of adult social care organisations by service type, 2009-2102 Source: Skills for Care estimates based on ONS IDBR data
The total number of adult social care organisations is estimated to have increased by around 2.5 per cent between 2011 and 2012.

9
2.4.2 Establishments
The number of adult social care establishments is estimated to have increased by 1.5 per cent between 2011 and 2012.
The number of adult social care establishments increased steadily between 2009 and 2012. Table 2.4 shows that the number of establishments increased by 2.5% in 2009–2010, by 1.0% in 2010–11 and by 1.5% in 2011-12. In total the number of establishments increased by around 2,000 (5%) between 2009 and 2012.
Table 2.4: Estimated number of adult social care establishments, 2009–2012Source: Skills for Care estimates based on ONS IDBR data
- 12 -
2.4.2 Establishments
The number of adult social care establishments increased steadily between 2009 and 2012. Table 2.4 shows that the number of establishments increased by 2.5% in 2009–2010, by 1.0% in 2010–11 and by 1.5% in 2011-12. In total the number of establishments increased by around 2,000 (5%) between 2009 and 2012.
Table 2.4: Estimated number of adult social care establishments, 2009–2012 Source: Skills for Care estimates based on ONS IDBR data
Estimated totals % change Service type 2009 2010 2011 2012 2009‐10 2010‐11 2011‐12
Residential services (SIC2007 87) 21,200 21,100 21,100 20,900 ‐0.5% +0.0% ‐1.0%Non‐residential (SIC2007 88) 16,100 17,200 17,600 18,300 +7.0% +2.5% +4.0%All organisations 37,300 38,300 38,700 39,300 +2.5% +1.0% +1.5%
Chart 2.6 shows the change in the number of adult social care establishments between 2009 and 2012 by service type. It shows that, as with organisations, the increase in the number of establishments over the period was driven by the increase in non-residential establishments. The number of non-residential establishments increased by around 2,000 over the period (13%), whereas the number of residential establishments remained roughly the same (decreasing slightly by 300 establishments).
Chart 2.6: Total number of adult social care establishments by service type, 2009-2012 Source: Skills for Care estimates based on ONS IDBR data
The number of adult social care establishments is estimated to have increased by 1.5 per cent between 2011 and 2012.
Chart 2.6 shows the change in the number of adult social care establishments between 2009 and 2012 by service type. It shows that, as with organisations, the increase in the number of establishments over the period was driven by the increase in non-residential establishments. The number of non-residential establishments increased by around 2,000 over the period (13%), whereas the number of residential establishments remained roughly the same (decreasing slightly by 300 establishments).
Chart 2.6: Total number of adult social care establishments by service type, 2009-2012Source: Skills for Care estimates based on ONS IDBR data
0
5,000
10,000
15,000
20,000
25,000
30,000
35,000
40,000
45,000
2009 2010 2011 2012
Residential Non-Residential All establishments

10
2.5 Individuals employing their own staff
Around 193,000 adults, older people and carers were receiving direct payments from councils’ social services departments as at March 2012.
It is estimated that approximately 100,000 (52%) of these recipients were directly employing their own staff.
2.5.1 Direct payment recipients
The direct payment recipient market is relatively new and has continued to evolve over recent years. Evidence suggests that increasingly direct payment recipients may be moving away from the model of becoming employers themselves, to a model of buying in the services they require. While the wider behaviour of this new and very sizeable market is of interest - for the purposes of this report the focus is on what proportion of those in receipt of a direct payment directly employ workers themselves. The answer to this question is used by Skills for Care to estimate the number of jobs for direct payments recipients and, in turn, to estimate the total size of the workforce.
In previous versions of this report, due to a lack of information, all direct payments recipients were treated as employers. This was acknowledged to be very likely to produce an overestimate of the number of individual employers in the adult social care sector. As such, for this year’s report, Skills for Care carried out some additional research to estimate the proportion of direct payment recipients that were employing staff.
Local authorities were asked to estimate the proportion of direct payments recipients that employ staff in their area. Overall 23 of the 152 councils in England provided estimates (many did not collect the information). These 23 councils account for over 10% of direct payments recipients between them (around 20,000 recipients in total) allowing for relatively good estimates to be produced (see Chart 2.8 for estimates of the accuracy).
Chart 2.7 shows that, as at 2012, Skills for Care estimate that approximately half of direct payments recipients were directly employing one or more member of staff.
Chart 2.7: Estimated number and percentage of direct payments recipients employing staffSource: HSCIC data and Skills for Care estimates
101,000 (52%)
92,000 (48%)
020,00040,00060,00080,000
100,000120,000140,000160,000180,000200,000
Direct payments recipients
Employing staff Not employing staff

11
Despite the additional data collected this year, there is still uncertainty regarding the proportion of direct payments recipients that were employers in 2012.
Skills for Care estimate that the true proportion of direct payments recipients employing staff is likely to be between 45% and 60% (87,000 to 116,000 employing staff in total).
Due to fact that data were not received from all councils, there is a degree of uncertainty attached to the estimate of 52% of direct payments recipients being employers. This section attempts to quantify this uncertainty and should be considered when interpreting these estimates.
Chart 2.8 shows an estimated range for the proportion of direct payments recipients that employed staff as at 2012 (see appendix 1 for the methodology). It shows that, given the data received, Skills for Care estimate that the proportion of direct payments recipients that employed staff in 2012 was likely to be between 45% and 60%. This provides a range of 87,000 to 116,000 direct payments recipients employing staff.
The estimate of 52% (and 101,000 overall) will be used throughout this report, however the uncertainty shown in this chart should be taken into account when interpreting individual employer and jobs for direct payment recipients estimates.
Chart 2.8: Estimated number and percentage of direct payments recipients employing staff, with estimated rangesSource: HSCIC data and Skills for Care estimates
As a result of the additional research carried out this year and despite the uncertainty highlighted above, the estimates of the number of direct payments recipients employing staff in this report are considerably more accurate than those provided in previous versions of this report.Skills for Care is continuing to explore ways to collect more information about direct payments recipients in order to provide more precise estimates in the future.
87,000 (45%)
29,000 (15%)
77,000 (41%)
0
20,000
40,000
60,000
80,000
100,000
120,000
140,000
160,000
180,000
200,000
Direct payments recipients
Unlikely to be employers
Potentially employers
Likely to be employers
12
2.5.2 Direct payment recipients trends
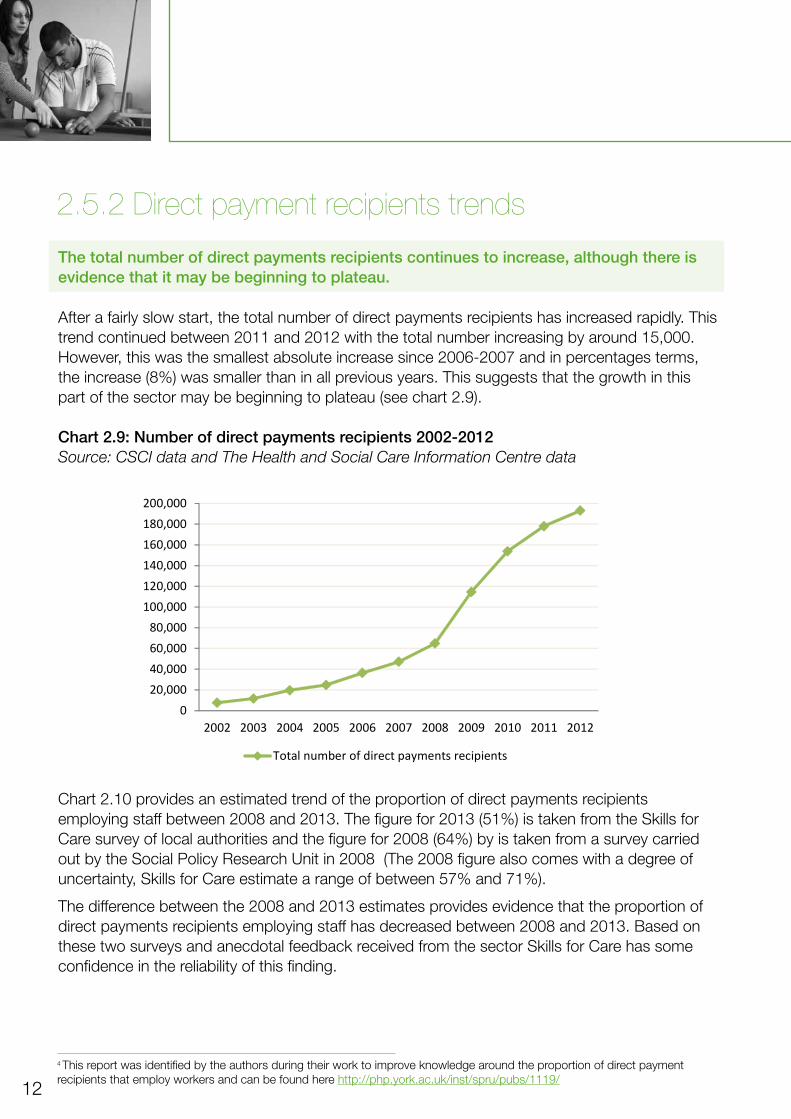
The total number of direct payments recipients continues to increase, although there is evidence that it may be beginning to plateau.
After a fairly slow start, the total number of direct payments recipients has increased rapidly. This trend continued between 2011 and 2012 with the total number increasing by around 15,000. However, this was the smallest absolute increase since 2006-2007 and in percentages terms, the increase (8%) was smaller than in all previous years. This suggests that the growth in this part of the sector may be beginning to plateau (see chart 2.9).
Chart 2.9: Number of direct payments recipients 2002-2012Source: CSCI data and The Health and Social Care Information Centre data
Chart 2.10 provides an estimated trend of the proportion of direct payments recipients employing staff between 2008 and 2013. The figure for 2013 (51%) is taken from the Skills for Care survey of local authorities and the figure for 2008 (64%) by is taken from a survey carried out by the Social Policy Research Unit in 2008 (The 2008 figure also comes with a degree of uncertainty, Skills for Care estimate a range of between 57% and 71%).
The difference between the 2008 and 2013 estimates provides evidence that the proportion of direct payments recipients employing staff has decreased between 2008 and 2013. Based on these two surveys and anecdotal feedback received from the sector Skills for Care has some confidence in the reliability of this finding.
4 This report was identified by the authors during their work to improve knowledge around the proportion of direct payment recipients that employ workers and can be found here http://php.york.ac.uk/inst/spru/pubs/1119/
020,00040,00060,00080,000
100,000120,000140,000160,000180,000200,000
2002 2003 2004 2005 2006 2007 2008 2009 2010 2011 2012
Total number of direct payments recipients

13
Proportions for years between 2008 and 2013 are not available because there was not any separate research carried out for these years that Skills for Care is aware of. Chart 2.10 provides estimates for these years by assuming the decrease occurred proportionally to the growth in the total number of direct payments recipients over the period (see appendix 1 for more details). These estimates will be used throughout the report (the 2012 figure of 52% in section 2.5.1 is estimated using this calculation).
Chart 2.10: Estimated proportion of direct payments recipients employing staff, 2008-2013Source: Skills for Care estimates and Social Policy Research Unit data
Chart 2.11 shows that the total number of direct payments recipients employing staff is estimated to have increased between 2008 and 2012. This increase has occurred at a slower rate than for the total number of direct payments recipients due to the estimated decreasing proportion that employ staff. The total number employing staff may be beginning to reach a plateau with the increase between 2011 and 2012 (6%) being smaller than in all previous years.
Chart 2.11: Total adult recipients of direct payments and estimates of those employing staff, England 2008-2012Source: HSCIC data and Skills for Care estimates
64%60%
56% 54% 52% 51%
0%
10%
20%
30%
40%
50%
60%
70%
2008 2009 2010 2011 2012 2013
41,00068,000
86,000 96,000 101,00023,000
46,000
68,00082,000
92,000
020,00040,00060,00080,000
100,000120,000140,000160,000180,000200,000
2008 2009 2010 2011 2012
Estimated employing staff Estimated not employing staff

14
2.5.3 Other individuals employing their own staff
Personal budget holders not receiving direct payments
As at 2012, there were around 605,000 people receiving a personal budget (up from around 450,000 in 2011). Of these, around 193,000 (32%) were receiving direct payments and have been covered in the previous section. The remaining 412,000 (68%) were not receiving direct payments.
Those personal budget holders who did not receive direct payments will have their care and support workers included within other parts of the workforce in this report (excluding any workers they directly employ using their own funds, who will not be covered by this report).
Self-funders and other funding streams
As with other personal budget holders, the workforce for those receiving care and support but not directly employing staff will be included within other parts of the workforce within this report.
There is very little information available about the number of individuals directly employing care and support staff via other funding streams or as self-funders, and therefore this part of the workforce is not covered by this report.
15
3. Statistics on the adult social care workforce
3.1 Introduction
This section provides estimates of the numbers employed in adult social care services in England as at 2012, derived from various sources.
Below is a brief overview of the data sources used to create these estimates. For a detailed description of the methodologies used and for a review of the data quality see appendix 1.
Independent employers (i.e. all commercial and not-for-profit employers)
Estimates of the total number of jobs with independent employers were made using the National Minimum Data Set for Social Care (NMDS-SC). NMDS-SC data were used to model the number of jobs offered by different types, sizes and locations of establishments. These models were then used to estimate the total number of jobs in all independent adult social care operations in England as estimated in the section 2.3.
Local authority
In 2011 the NMDS-SC replaced the SSDS001 as the adult workforce data return for local authorities.5 The majority of local authorities (138 out of 152) provided a NMDS-SC return in 2011 and therefore, for the first time, Skills for Care was able to use the NMDS-SC to estimate the size of this part of the workforce. In 2012 all 152 local authorities completed the NMDS-SC allowing for very accurate figures to be produced.
Direct payments recipients
Estimates of the number of workers employed by direct payments recipients were calculated using NMDS-SC data, the additional Skills for Care research described in section 2.5 and data from The Health and Social Care Information Centre (HSCIC). The NMDS-SC was used to estimate the average number of workers each recipient employed and then this average was applied to the total number of direct payments recipients as recorded by the HSCIC (adjusted for those employing staff using the Skills for Care research).
NHS
Estimates of the parts of the workforce employed within the NHS have been made using the NHS non-medical workforce census (September 2012) published by the HSCIC.
Unpaid carers
Unpaid carers play a major role in adult social care but are not usually included in employment statistics and are therefore not included in the workforce estimates in this section. As at 2011 there were an estimated 5.4 million people who were carers in England6 and this figure is expected to rise considerably in the future.7
5 A detailed report using NMDS-SC data on staff employed by adult social services departments published by the IC can be found at http://www.ic.nhs.uk/statistics-and-data-collections6 Census (2011)7 Carers UK - Valuing Carers (2011). The full report can be found at http://www.carersuk.org
16
3.2 Number of adult social care jobs
The number of adult social care jobs in England as at 2012 was estimated at 1.63 million.
3.2.1 Type of employer
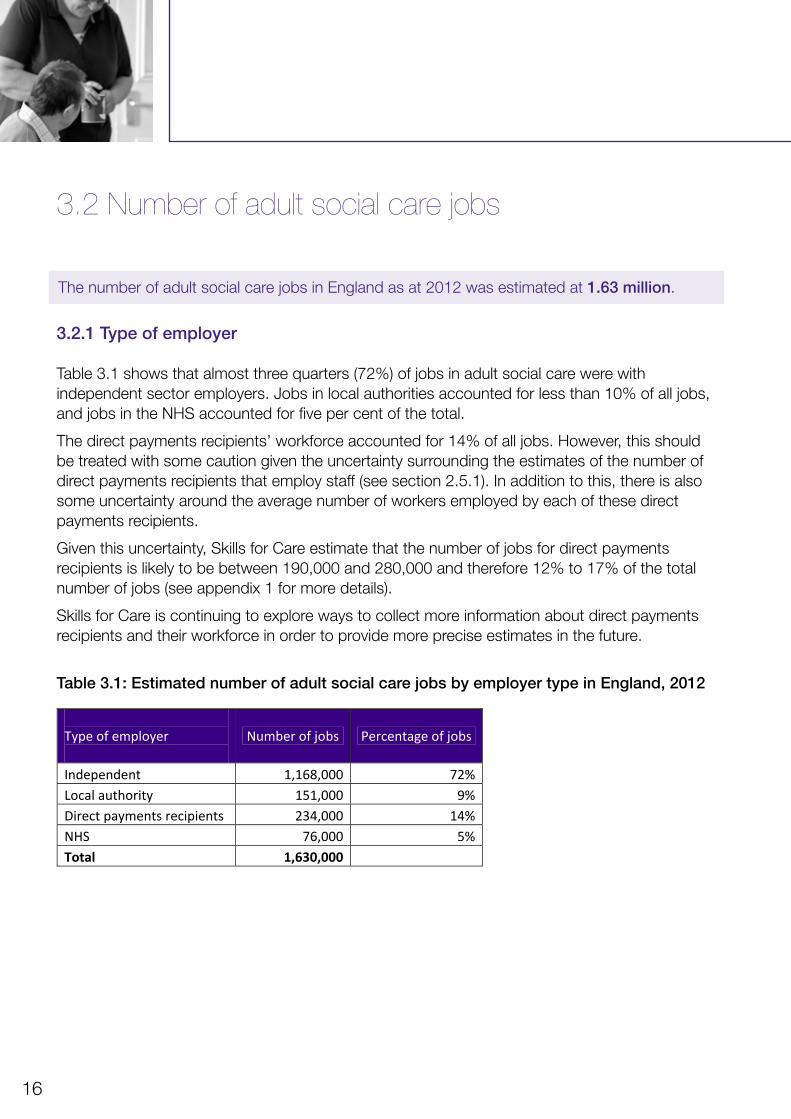
Table 3.1 shows that almost three quarters (72%) of jobs in adult social care were with independent sector employers. Jobs in local authorities accounted for less than 10% of all jobs, and jobs in the NHS accounted for five per cent of the total.
The direct payments recipients’ workforce accounted for 14% of all jobs. However, this should be treated with some caution given the uncertainty surrounding the estimates of the number of direct payments recipients that employ staff (see section 2.5.1). In addition to this, there is also some uncertainty around the average number of workers employed by each of these direct payments recipients.
Given this uncertainty, Skills for Care estimate that the number of jobs for direct payments recipients is likely to be between 190,000 and 280,000 and therefore 12% to 17% of the total number of jobs (see appendix 1 for more details).
Skills for Care is continuing to explore ways to collect more information about direct payments recipients and their workforce in order to provide more precise estimates in the future.
Table 3.1: Estimated number of adult social care jobs by employer type in England, 2012
- 19 -
3.2 Number of adult social care jobs
3.2.1 Type of employer
Table 3.1 shows that almost three quarters (72%) of jobs in adult social care were with independent sector employers. Jobs in local authorities accounted for less than 10% of all jobs, and jobs in the NHS accounted for five per cent of the total.
The direct payments recipients’ workforce accounted for 14% of all jobs. However, this should be treated with some caution given the uncertainty surrounding the estimates of the number of direct payments recipients that employ staff (see section 2.5.1). In addition to this, there is also some uncertainty around the average number of workers employed by each of these direct payments recipients.
Given this uncertainty, Skills for Care estimate that the number of jobs for direct payments recipients is likely to be between 190,000 and 280,000 and therefore 12% to 17% of the total number of jobs (see appendix 1 for more details).
Skills for Care is continuing to explore ways to collect more information about direct payments recipients and their workforce in order to provide more precise estimates in the future.
Table 3.1: Estimated number of adult social care jobs by employer type in England, 2012
Type of employer
Number of jobs Percentage of jobs
Independent 1,168,000 72%Local authority 151,000 9%Direct payments recipients 234,000 14%NHS 76,000 5%Total 1,630,000
The number of adult social care jobs in England as at 2012 was estimated at 1.63 million.

17
Jobs for independent employers could not be accurately split into ‘private’ and ‘voluntary’ as they were in previous years as this information is no longer collected by CQC. Estimates from the NMDS-SC suggest that approximately 75% (900,000) of the jobs for independent employers were in private establishments (over 50% of all jobs) and 25% (300,000) were in voluntary establishments (almost 20% of all jobs), see chart 3.1.
Chart 3.1: Percentage of adult social care jobs in England by employer type, 2012
54%
18%
9%
14%
5%
Private Voluntary Local authority Direct payments recipients NHS
18
3.2.2 Main service
Table 3.2 shows a breakdown of adult social care jobs by main service group. It shows that the majority of jobs were split between residential and domiciliary employers (40% and 42% respectively), 4% of jobs were in day care services and 14% were community based.
Table 3.2: Estimated number of adult social care jobs by main service in England, 2012
- 21 -
3.2.2 Main service
Table 3.2 shows a breakdown of adult social care jobs by main service group. It shows that the majority of jobs were split between residential and domiciliary employers (40% and 42% respectively), 4% of jobs were in day care services and 14% were community based.
Table 3.2: Estimated number of adult social care jobs by main service in England, 2012
Main service group Number of jobs
Percentage of jobs
Residential 650,000 40%Domiciliary 685,000 42%Day 66,000 4%Community 229,000 14%Total 1,630,000
Chart 3.2: Percentage of adult social care jobs in England by main service, 2012
Chart 3.3 provides a more detailed split of the 650,000 residential adult social care jobs. This category includes CQC regulated care only homes (289,000 jobs), CQC regulated care homes with nursing (276,000 jobs), shared lives services (2,000 jobs), other CQC-regulated residential services (1,000 jobs) and non-CQC regulated residential services (49,000 jobs). The remaining jobs (34,000) were in councils.
Chart 3.4 shows a breakdown of the 685,000 domiciliary adult social care jobs—410,000 of these jobs were in CQC regulated locations, including 385,000 jobs in locations offering domiciliary care, 100,000 in locations offering supported living services, 35,000 in locations offering extra care housing services and 25,000 in locations operating a nursing agency.8 Around 21,000 jobs were in non-CQC regulated services such as domestic services, home-help and meals on wheels services. About 19,000 domiciliary care jobs were in local councils and around 234,000 were jobs for direct payments recipients.
8 Note that locations can offer more than one service, therefore the sum of the individual services does not equal the total locations.
Chart 3.2: Percentage of adult social care jobs in England by main service, 2012
40%
42%
4%
14%
Residential Domiciliary Day Community
Chart 3.3 provides a more detailed split of the 650,000 residential adult social care jobs. This category includes CQC regulated care only homes (289,000 jobs), CQC regulated care homes with nursing (276,000 jobs), shared lives services (2,000 jobs), other CQC-regulated residential services (1,000 jobs) and non-CQC regulated residential services (49,000 jobs). The remaining jobs (34,000) were in councils.
Chart 3.4 shows a breakdown of the 685,000 domiciliary adult social care jobs—410,000 of these jobs were in CQC regulated locations, including 385,000 jobs in locations offering domiciliary care, 100,000 in locations offering supported living services, 35,000 in locations offering extra care housing services and 25,000 in locations operating a nursing agency.8 Around 21,000 jobs were in non-CQC regulated services such as domestic services, home-help and meals on wheels services. About 19,000 domiciliary care jobs were in local councils and around 234,000 were jobs for direct payments recipients.
8 Note that locations can offer more than one service, therefore the sum of the individual services does not equal the total locations.

19
Chart 3.3: Residential jobs Chart 3.4 Domiciliary jobs
Chart 3.5 shows that of the 66,000 adult social care jobs in day care services, approximately 51,000 (77%) were in independent employers and 15,000 (23%) were in local councils.
Chart 3.6 provides a breakdown of the 229,000 community based adult social care jobs. This category includes a wide range of services such as carers’ support services, the organisation of short breaks and respite care, community support and outreach services, disability adaptations and assistive technology services, occupational and employment related services and information and advice services. An estimated 69,000 (30%) of these jobs were in independent employers, 83,000 (36%) were in councils and 76,000 (33%) were in the NHS.
Chart 3.5: Day care jobs Chart 3.6: Community jobs
289,000
276,000
49,00034,000
3,000 Care only home
Care home withnursing
Non-CQCresidential
Local authorityresidential
Shared lives(+other)
234,000
410,000
21,000 19,000
Direct paymentsrecipients
CQC domiciliary
Non-CQCdomiciliary
Local authoritydomiciliary
51,000
15,000 Independent day
Local authorityday
69,000
83,000
76,000
Independentcommunity
Local authoritycommunity
NHS (community)

20
3.2.2 Job role groups
Table 3.3 shows that the majority of adult social care jobs were direct care-providing (76%). This group includes care workers, senior care workers, support workers, jobs for direct payments recipients and a range of other jobs involved in providing care and support directly.
Managerial and supervisory roles accounted for seven per cent of jobs. This group includes senior managers, middle managers, line managers, registered managers and other managerial roles not directly involved in providing care.
Professional roles accounted for six per cent of jobs. This group includes several rather different jobs, which have in common the requirement for a professional qualification. The jobs included in this category are social workers, occupational therapists, registered nurses, allied health professionals and teachers.
Jobs that fell in the ‘other’ category accounted for 11% of jobs. This category includes administrative jobs, ancillary jobs including catering, cleaning, transport and maintenance roles, and other jobs not directly involved in providing care.
Table 3.3: Estimated number of adult social care jobs by job role in England, 2012
- 23 -
3.2.2 Job role groups
Table 3.3 shows that the majority of adult social care jobs were direct care-providing (76%). This group includes care workers, senior care workers, support workers, jobs for direct payments recipients and a range of other jobs involved in providing care and support directly.
Managerial and supervisory roles accounted for seven per cent of jobs. This group includes senior managers, middle managers, line managers, registered managers and other managerial roles not directly involved in providing care.
Professional roles accounted for six per cent of jobs. This group includes several rather different jobs, which have in common the requirement for a professional qualification. The jobs included in this category are social workers, occupational therapists, registered nurses, allied health professionals and teachers.
Jobs that fell in the ‘other’ category accounted for 11% of jobs. This category includes administrative jobs, ancillary jobs including catering, cleaning, transport and maintenance roles, and other jobs not directly involved in providing care.
Table 3.3: Estimated number of adult social care jobs by job role in England, 2012
Job role group Total jobs Percentage of jobs
Direct Care 1,236,000 76%Managerial 121,000 7%Professional 93,000 6%Other 180,000 11%Total 1,630,000
Chart 3.7: Percentage of adult social care jobs in England by job role, 2012
Cross tabulations and geographical breakdowns of the number of adult social care jobs and people by employer type, service type and job role group are provided in appendix 3.
Chart 3.7: Percentage of adult social care jobs in England by job role, 2012
Cross tabulations and geographical breakdowns of the number of adult social care jobs and people by employer type, service type and job role group are provided in appendix 3.
76%
7%
6%
11%
Direct Care Managerial Professional Other

21
3.2.4 Employment type
Table 3.4 shows that 92% of adult social care jobs were filled by directly employed workers (permanent or temporary). Around 8% of jobs were filled by not directly employed workers—these include bank and pool workers, agency staff, volunteers and students.
Table 3.4: Estimated number of adult social care jobs by employment type in England, 2012
- 24 -
3.2.4 Employment type
Table 3.4 shows that 92% of adult social care jobs were filled by directly employed workers (permanent or temporary). Around 8% of jobs were filled by not directly employed workers—these include bank and pool workers, agency staff, volunteers and students.
Table 3.4: Estimated number of adult social care jobs by employment type in England, 2012
Employment type Number of jobs
Percentage of jobs
Directly employed 1,499,000 92%Permanent 1,426,000 88%Temporary 73,000 4%
Not directly employed 131,000 8%Total 1,630,000
Chart 3.8 shows an estimated breakdown of the not directly employed jobs. It shows that of the 131,000 jobs filled by not directly employed workers, 16% were agency staff (1% of all jobs), almost 50% were bank or pool staff and around 20% were volunteers.
In 2012 Skills for Care added apprenticeships to the NMDS-SC as an employment type and therefore will be able to report on the number of these workers in the future.
Chart 3.8: Estimated number of jobs in not directly employed roles in England, 2012
61,000
21,000
4,000
23,000 22,000
0
10,000
20,000
30,000
40,000
50,000
60,000
70,000
Pool Agency Student Volunteer Other

22
3.3 Number of whole time equivalent (WTE) adult social care jobsThe number of whole time equivalent (WTE) adult social care jobs in England as at 2012 was estimated at 1.23 million.
In this section, for the first time, Skills for Care have produced whole time equivalent (WTE) estimates of the size of the adult social care workforce. These estimates have been created by applying contracted and additional hours data collected by the NMDS-SC to estimates of the total number of jobs presented in section 3.2 (37 hours per week has been classed as ‘whole time’).
Chart 3.9 shows that the overall ratio of jobs to WTE jobs was around 0.76 (i.e. on average 100 jobs is the equivalent of 76 whole time jobs). This ratio is fairly similar across employer types with the exception of direct payments recipient jobs where the ratio was around 0.5.
Chart 3.9: Adult social care jobs: WTE jobs ratio by employer type in England, 2012
79%
54%
80%85%
76%
0.00.10.20.30.40.50.60.70.80.91.0
Independent Direct Payments Local authority NHS Total
Ratio of Jobs : WTE jobs
Table 3.5 shows the total number of jobs and the number of WTE jobs by employer type. It shows that, as at 2012, there were an estimated 1.23 million WTE adult social care jobs. This estimate is considerably fewer than the total number of jobs (1.63 million), which reflects the part time nature of many adult social care jobs. This is especially true of jobs for direct payments recipients which make up a significantly smaller percentage of WTE jobs (10%) than all jobs (14%).
Table 3.5: Estimated adult social care jobs and WTE jobs by employer type in England, 2012
- 25 -
3.3 Number of whole time equivalent (WTE) adult social care jobs
In this section, for the first time, Skills for Care have produced whole time equivalent (WTE) estimates of the size of the adult social care workforce. These estimates have been created by applying contracted and additional hours data collected by the NMDS-SC to estimates of the total number of jobs presented in section 3.2 (37 hours per week has been classed as ‘whole time’).
Chart 3.9 shows that the overall ratio of jobs to WTE jobs was around 0.76 (i.e. on average 100 jobs is the equivalent of 76 whole time jobs). This ratio is fairly similar across employer types with the exception of direct payments recipient jobs where the ratio was around 0.5.
Chart 3.9: Adult social care jobs : WTE jobs ratio by employer type in England, 2012
Table 3.5 shows the total number of jobs and the number of WTE jobs by employer type. It shows that, as at 2012, there were an estimated 1.23 million WTE adult social care jobs. This estimate is considerably fewer than the total number of jobs (1.63 million), which reflects the part time nature of many adult social care jobs. This is especially true of jobs for direct payments recipients which make up a significantly smaller percentage of WTE jobs (10%) than all jobs (14%).
Table 3.5: Estimated adult social care jobs and WTE jobs by employer type in England, 2012
Type of employer Jobs Percentage of jobs WTE jobs Percentage of WTE
jobs Independent 1,168,000 72% 921,000 75% Direct payments recipients 234,000 14% 126,000 10% Local authority 151,000 9% 120,000 10% NHS 76,000 5% 65,000 5% Total 1,630,000 1,230,000
The number of whole time equivalent (WTE) adult social care jobs in England as at 2012 was estimated at 1.23 million.

23
3.4 Number of people working in adult social care
The number of people working in adult social care in England as at 2012 was estimated at 1.50 million.
In this section Skills for Care has attempted to make the distinction between the number of jobs and the number of people doing those jobs. The purpose of this is to take into account people doing more than one job in adult social care.
The NMDS-SC was designed to allow for the distinction between the number of jobs and the number of people doing those jobs. This is achieved by creating a unique reference number for each worker, using the workers’ National Insurance Number (NINO) and their date of birth. If the same NINO and date of birth combination appears more than once in the dataset it indicates that the same person has more than one adult social care job.9
Skills for Care also carried out some additional research, in 2011, to estimate the average number of jobs held by people working for direct payments recipients and, for the first time, to try and estimate the number of people with jobs in more than one type of social care employer. Although this research allowed for more detailed estimates than in previous years, the sample sizes were relatively small (105 responses) and therefore the results should be treated with some caution.
Chart 3.10 shows the estimated number of jobs per worker by type of employer. It shows that people working for direct payments recipients were much more likely to hold more than one adult social care job than those working for other types of employer. This is not surprising given the part time nature of these roles highlighted in chart 3.9.
Chart 3.10: Estimated number of adult social care jobs per person by type of employer
1.02
1.60
1.051.09
1.00
1.10
1.20
1.30
1.40
1.50
1.60
1.70
Independentsector
Direct paymentsrecipients
Local authority All sectors
9This analysis is based on the unique reference numbers so individuals remain anonymous throughout the process and national insurance numbers are not disclosed.

24
Table 3.6 shows a breakdown by type of employer of the estimated 1.5 million people working in adult social care. It shows that the majority (77%) of people worked in the independent sector. The percentage working for direct payments recipients was around 10%10. This proportion was smaller than for the number of jobs (14%) due to the number of these workers holding more than one job.
Table 3.6: Estimated number of people working in adult social care jobs by type of employer in England, 2012
Chart 3.11 provides an illustration of the number of people working in adult social care by employer type. The size of each circle is proportional to the number of people working in each employer type and the intersections represent the people working in more than one type of employer.
Initial Skills for Care estimates show that approximately 6,000 people had both independent and local authority jobs and approximately 20,000 people were working for direct payments recipients and for independent or local authority employers.
Skills for Care will continue to refine and improve these estimates in the future.
Chart 3.11: Estimated employer type breakdown of people working in adult social care jobs in England, 2012
- 27 -
Table 3.6 shows a breakdown by type of employer of the estimated 1.5 million people working in adult social care. It shows that the majority (77%) of people worked in the independent sector. The percentage working for direct payments recipients was around 10%10. This proportion was smaller than for the number of jobs (14%) due to the number of these workers holding more than one job.
Table 3.6: Estimated number of people working in adult social care jobs by type of employer in England, 2012
Type of employer Number of people
Percentage of people
Independent 1,153,000 77%Direct payments recipients 146,000 10%Local authority 144,000 10%NHS* 76,000 5%Total** 1,500,000 * NHS data is currently available only at job level. **Employer type counts do not sum to the totals due to people with jobs in more than one type of employer.
Chart 3.11 provides an illustration of the number of people working in adult social care by employer type. The size of each circle is proportional to the number of people working in each employer type and the intersections represent the people working in more than one type of employer.
Initial Skills for Care estimates show that approximately 6,000 people had both independent and local authority jobs and approximately 20,000 people were working for direct payments recipients and for independent or local authority employers.
Skills for Care will continue to refine and improve these estimates in the future.
Chart 3.11: Estimated employer type breakdown of people working in adult social care jobs in England, 2012
No information was available regarding people working in both the NHS and other types of employer.
10 Skills for Care estimate that a likely range for this figure of 115,000 to 180,000 (or 8% to 12% of all people)
10Skills for Care estimate that a likely range for this figure of 115,000 to 180,000 (or 8% to 12% of all people)

25
3.5 Trend data – number of adult social care jobs
The number of adult social care jobs in England increased by around 4% between 2011 and 2012 from 1.56 million to 1.63 million.
The main changes in the adult social care sector since 2009 highlighted in this section are: (1) The increasing size of the workforce (up 15% between 2009 and 2012) (2) The continued shift towards the personalisation of adult social care services (3) The outsourcing of local authority services to independent sector employers.
The number of independent sector adult social care jobs increased by around 6% between 2011 and 2012 (50,000 new jobs), for direct payments recipients by around 5% (around 10,000 new jobs) and in the NHS by around 3% (2,000 new jobs).
The number of local authority jobs decreased by around 5% over the same period. Local authorities informally provided several reasons for these reductions in staff numbers, the most common reasons cited were budget cuts, restructures and the outsourcing of staff (see table 3.7 and chart 3.12).
Table 3.7: Change in adult social care jobs by employer type in England, 2011–2012
- 28 -
3.5 Trend data – number of adult social care jobs
The number of independent sector adult social care jobs increased by around 6% between 2011 and 2012 (50,000 new jobs), for direct payments recipients by around 5% (around 10,000 new jobs) and in the NHS by around 3% (2,000 new jobs).
The number of local authority jobs decreased by around 5% over the same period. Local authorities informally provided several reasons for these reductions in staff numbers, the most common reasons cited were budget cuts, restructures and the outsourcing of staff (see table 3.7 and chart 3.12).
Table 3.7: Change in adult social care jobs by employer type in England, 2011–2012 Type of employer 2011 2012 2011‐2012 change Independent 1,104,000 1,168,000 +6% Local authority 159,000 151,000 ‐5% Direct payments recipients 222,000 234,000 +5% NHS 74,000 76,000 +3% All employer types 1,560,000 1,630,000 +4%
All figures have been re-visited to match the methodologies used for 2012 so may not match previously published numbers.
Chart 3.12: Change in adult social care jobs by employer type in England, 2011–2012
The number of adult social care jobs in England increased by around 4% between 2011 and 2012 from 1.56 million to 1.63 million.
The main changes in the adult social care sector since 2009 highlighted in this section are: (1) The increasing size of the workforce (up 15% between 2009 and 2012) (2) The continued shift towards the personalisation of adult social care services (3) The outsourcing of local authority services to independent sector employers.
Chart 3.12: Change in adult social care jobs by employer type in England, 2011–2012
64,000
-9,000
12,0002,000
6%
-5%
5%
3%
-8%
-6%
-4%
-2%
0%
2%
4%
6%
8%
-80,000
-60,000
-40,000
-20,000
0
20,000
40,000
60,000
80,000
absolute change
% change

26
Chart 3.13 shows the change in the number of adult social care jobs in England since 2009. It shows the workforce has been increasing steadily since 2009 at roughly 5% per year.
The overall increase in the number of jobs between 2009 and 2012 was estimated at around 200,000 (15% increase).
Chart 3.13: Number of adult social care jobs and percentage change in the number of jobs in England, 2009–2012
Chart 3.14 shows the change in the number of jobs between 2009 and 2012 by employer type. It shows that all employer types (except for local authorities) have grown since 2009.
The majority of the total increase came from new jobs for independent sector employers which increased by around 15% (150,000 new jobs). Jobs for direct payments recipients were the fastest growing part of the sector, increasing by around 50% (75,000 new jobs). The number of local authority jobs decreased over the period by around 15% (-30,000 jobs).
Chart 3.14: Change in number of adult social care jobs by employer type in England, 2009-2012
+6%
+3%+4%
1,420,0001,510,000 1,560,000 1,630,000
0%1%2%3%4%5%6%7%8%9%
10%
2009 2010 2011 20120
200,000
400,000
600,000
800,000
1,000,000
1,200,000
1,400,000
1,600,000
1,800,000
% change from previous year (left axis) Number of jobs (right axis)
155,000
-30,000
75,000
5,000
-50,000
0
50,000
100,000
150,000
200,000
Independent Local authority Direct payments NHS

27
Chart 3.15 shows the percentage change in the workforce since 2009 split by each individual year.
It shows that jobs for independent sector employers have increased each year by approximately 5%. Jobs for direct payments recipients have also increased in all three periods, however the rate of growth of this part of the sector has slowed considerably in recent years (5.3% in 2011-2102 compared with 25% in 2009-10).
Local authority jobs have decreased year on year with the biggest decrease happening in 2010-2011 (-9%).
Chart 3.15: Percentage change in number of adult social care jobs by employer type in England, 2009-2012
4.7%
-1.8%
25.7%
1.4%4.0%
-9.3%
10.8%
0.6%
5.8%
-5.5%
5.3%3.1%
-15.0%
-10.0%
-5.0%
0.0%
5.0%
10.0%
15.0%
20.0%
25.0%
30.0%
Independent Local authority Direct payments NHS
2009-10 change 2010-2011 change 2011-2012 change

28
11 http://www.skillsforcare.org.uk/research/research reports/state of the adult social care workforce reports12 These figures have been adjusted to take account of the adjusted workforce estimates detailed in this report.
4. Projections of the future adult social care workforce
The demand for adult social care is projected to increase due to the ageing population.
The size of the adult social care workforce will have to increase significantly to meet this demand.
Skills for Care estimates of the number of adult social care workers that may be needed to meet the future social care needs of adults and older people in England can be found in the State of the Social Care Workforce report 201011. The key findings are summarised below.
These workforce projections were based on projections of demand made in 2008 by the Personal Social Services Research Unit (PSSRU) for the Department of Health. These in turn were based on government projections of the future population of England. The Base Case scenario assumed the rate of provision of services remained constant. The other scenarios were developed at a workshop involving Skills for Care staff and other social care experts (see appendix 2 for descriptions of each scenario).
Table 4.1 shows that, depending on the scenario, the number of jobs in adult social care is projected to grow by between 20% and 60% between 2012 and 2025. This means there could be between 2.0 million and 2.6 million jobs12 by 2025.
Table 4.1: Summary of four projections of adult social care workforce jobs (000’s) in England 2012–2025
- 31 -
4. Projections of the future adult social care workforce
Skills for Care estimates of the number of adult social care workers that may be needed to meet the future social care needs of adults and older people in England can be found in the State of the Social Care Workforce report 201011. The key findings are summarised below.
These workforce projections were based on projections of demand made in 2008 by the Personal Social Services Research Unit (PSSRU) for the Department of Health. These in turn were based on government projections of the future population of England. The Base Case scenario assumed the rate of provision of services remained constant. The other scenarios were developed at a workshop involving Skills for Care staff and other social care experts (see appendix 2 for descriptions of each scenario).
Table 4.1 shows that, depending on the scenario, the number of jobs in adult social care is projected to grow by between 20% and 60% between 2012 and 2025. This means there could be between 2.0 million and 2.6 million jobs12 by 2025.
Table 4.1: Summary of four projections of adult social care workforce jobs (000’s) in England 2012–2025
Scenario (000’s) 2012 2015 2020 2025 change (2012‐2025) Base Case 1,630 1,770 2,065 2,395 765
Maximising Choice 1,630 1,800 2,165 2,595 965
Contain and Community 1,630 1,735 1,905 2,070 440
Restricted Resources 1,630 1,700 1,815 1,940 310*The original figures have been re-calibrated to account for the new workforce estimates in this report
Chart 4.1: Adult social care workforce jobs projections (000’s)
11 http://www.skillsforcare.org.uk/research/research reports/state of the adult social care workforce reports12 These figures have been adjusted to take account of the adjusted workforce estimates detailed in this report.
The demand for adult social care is projected to increase due to the ageing population.
The size of the adult social care workforce will have to increase significantly to meet this demand.

29
Chart 4.2 shows the four scenarios together with a new projection based on the growth of the workforce over the past four years.
This projection line simply projects the workforce in a straight line based on the current rate of growth since 2009 and does not account for further additional increases in demand for adult social care services. It is included in the graph to allow a comparison between the current rate of growth and the original projections and should not be interpreted as a prediction.
Chart 4.2: Adult social care workforce jobs projections including current rate of growth projection (000’s)
Aspects of all four scenarios have materialised since the projections were made in 2009.
The shift towards the personalisation of adult social care has continued. Even though the take-up of direct payments has slowed in recent years, the workforce is still growing at a similar rate projected under the ‘maximising choice’ scenario.
Adult social care has also experienced significant budget cuts over the period (LGA, 2013), however the workforce has still grown significantly faster than projected under the ‘restricted resources’ scenario. Although there is some evidence that budget pressures are leading to a more stringent application of adult social care eligibility criteria (LGA, 2013)13.
Whether or not these trends continue depends largely on government policy and also on the resources available to adult social care. However, it should be noted that under all the scenarios (even the most pessimistic in terms of resources) the workforce is still projected to grow due to the ageing population.
Skills for Care hope to include updated projections in next year’s report.
13 http://www.local.gov.uk/Towards excellence in adult social care
1,000
1,200
1,400
1,600
1,800
2,000
2,200
2,400
2,600
2,800
2010 2015 2020 2025
Maximising Choice
At current rate of growth (2009-2012)
Base Case
Contain and Community
Restricted Resources

30
5. Appendices
5.1 Appendix 1: Methodology
5.1.1 Adult social care employers
(a) Number of adult social care organisations
The number of adult social organisations was estimated using ONS annual analysis of UK Business Activity, Size and Location data.
Organisations in the following SIC codes (see table 5.1) were classed as adult social care organisations (although it is acknowledged that some social care operations may fall under other categories, see section 2.1).
Table 5.1: SIC2007 codes used to estimate the number of adult social care organisations and establishments
These data are provided at UK level so organisations from Scotland, Wales and Northern Ireland were removed from the analysis.
The proportion of categories 87900 (Other residential social work activities) and 88990 (Other social work activities without accommodation) that were for adults were estimated using data from Companies House. A random 500 employers were sampled from each of these categories and, via internet searches, Skills for Care was able to categorise each employer as adults, children’s, or not providing social care.
The proportions of employers that were providing adult social care found from these samples were then applied to the whole categories to estimate how many of these employers were delivering adult services.
This is an improvement on the methodology used for previous reports. See section 5.1.3 for a review of the data quality.
- 33 -
5. Appendices
5.1 Appendix 1: Methodology
5.1.1 Adult social care employers
(a) Number of adult social care organisations
The number of adult social organisations was estimated using ONS annual analysis of UK Business Activity, Size and Location data.
Organisations in the following SIC codes (see table 5.1) were classed as adult social care organisations (although it is acknowledged that some social care operations may fall under other categories, see section 2.1).
Table 5.1: SIC2007 codes used to estimate the number of adult social care organisations and establishmentsSIC2007 Description Adult / children split87100 Residential nursing care activities Assumed 100% adults 87200 Residential care activities for mental retardation, mental health and substance abuse Assumed 100% adults 87300 Residential care activities for the elderly and disabled Assumed 100% adults 87900 Other residential social work activities Mixed adults & children 88100 Social work activities without accommodation for the elderly and disabled Assumed 100% adults 88990 Other social work activities without accommodation n.e.c Mixed adults & children
These data are provided at UK level so organisations from Scotland, Wales and Northern Ireland were removed from the analysis.
The proportion of categories 87900 (Other residential social work activities) and 88990 (Other social work activities without accommodation) that were for adults were estimated using data from Companies House. A random 500 employers were sampled from each of these categories and, via internet searches, Skills for Care was able to categorise each employer as adults, children’s, or not providing social care.
The proportions of employers that were providing adult social care found from these samples were then applied to the whole categories to estimate how many of these employers were delivering adult services.
This is an improvement on the methodology used for previous reports. See section 5.1.3 for a review of the data quality.

31
(b) Number of adult social care establishments
The estimates of the number of adult social care establishments were done at a greater degree of detail than the organisational estimates as they were used as the framework for estimating the size of the workforce.
Residential segment
The numbers of care homes with nursing, care only homes, shared lives services and other CQC regulated residential activates were taken direct from the CQC register as at September 2012. This made up the CQC regulated portion.
The number of non-CQC regulated establishments was estimated by subtracting the number of CQC regulated residential establishments from the total number of establishments (local units) reported by the IDBR under SIC2007 codes 87100, 87200, 87300 and 87900. Then children’s and non-social care providing establishments were removed using the Companies House data research described in described in section 5.1.1 (a).
Non-residential segment
The numbers of domiciliary care agencies, nursing agencies, supported living services, extra care housing services and other CQC regulated non-residential services were taken direct from the CQC register as at September 2012. This made up the CQC regulated portion.
The number of non CQC-regulated establishments was estimated by subtracting the number of CQC regulated non-residential establishments from SIC2007 category 88100. This was then added to the number of establishments in SIC2007 88900 (with children’s and non-social care establishments excluded using the method described in 5.1.1 (a)).
This is an improvement on the methodology used for previous reports. See section 5.1.3 for a review of the data quality.
(c) Direct payment recipients employing staff The total number of direct payments recipients was taken from data published by The Health and Social Care Information Centre. This figure was adjusted to only include those that were directly employing their own staff using separate research conducted by Skills for Care.
This is an improvement on the methodology used for previous reports. See section 5.1.3 for a review of the data quality.

32
5.1.2 Adult social care workforce
(a) Number of adult social care jobs
Independent employers
CQC regulated establishments
CQC’s register provides accurate and up to date information on numbers of registered adult social care establishments, by type, geography and capacity (for care homes). In addition, NMDS-SC records can be matched with the CQC data to show precisely the proportion of each segment the NMDS-SC covers.
Skills for Care was therefore able to use this combined data to produce workforce models that were in turn used to estimate the number of jobs at all CQC regulated establishments based on their capacity (for care homes), location, service types and activities.
The CQC list did not contain information on the ‘type of employer’ (e.g. private, voluntary or local authority), so Skills for Care manually removed local authority establishments via their ‘provider name’ from the CQC register.
Non-CQC regulated establishments
The estimates of the number of non-CQC regulated establishments (see section 5.1.1(b)) were split using IDBR data to remove local authority establishments.
NMDS-SC establishments offering these types of service were then grossed up to the estimated total number of non-regulated services. The data were stratified by size using the IDBR to account for any skew in the NMDS-SC.
Local authorities
Following an open National Statistics consultation it was decided that the NMDS-SC would replace the SSDS001 from September 2011 as the adult workforce data return for local authorities.
In 2012 all local authorities provided an NMDS-SC return and therefore NMDS-SC data were used for this part of the workforce with very little estimating required.
NHS
These numbers were taken from NHS census data published by The Health and Social Care Information Centre for Health and Social Care
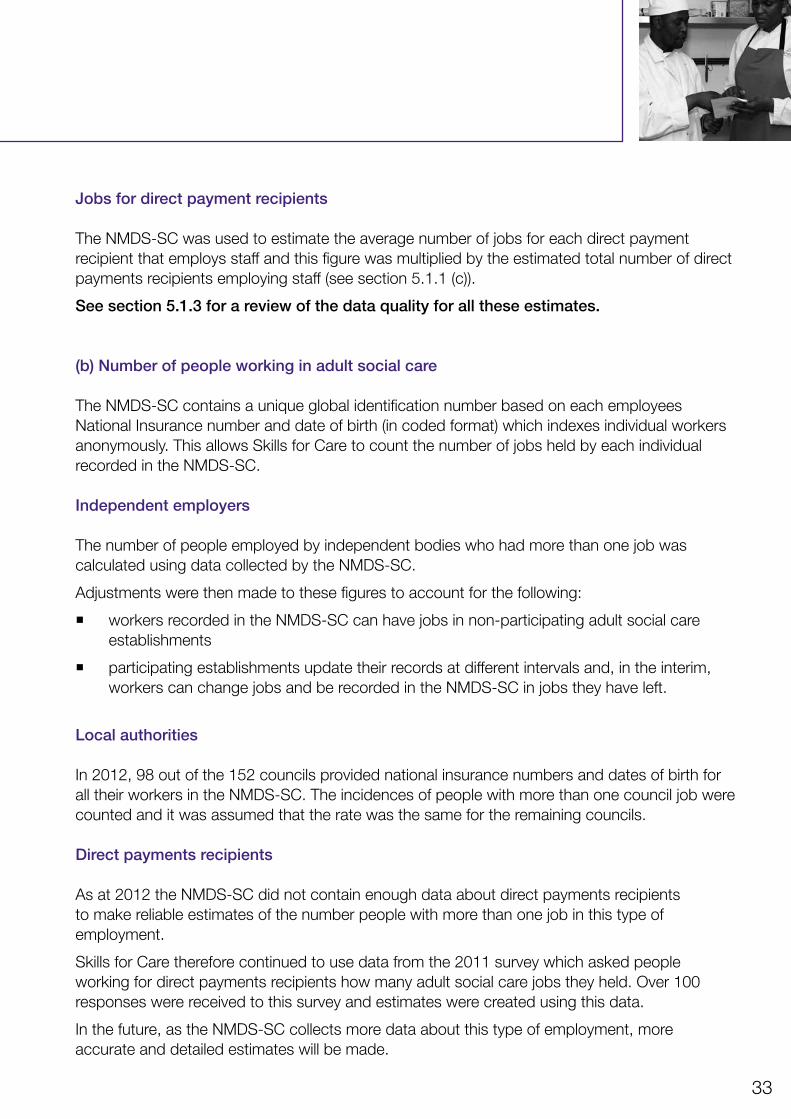
33
Jobs for direct payment recipients
The NMDS-SC was used to estimate the average number of jobs for each direct payment recipient that employs staff and this figure was multiplied by the estimated total number of direct payments recipients employing staff (see section 5.1.1 (c)).
See section 5.1.3 for a review of the data quality for all these estimates.
(b) Number of people working in adult social care
The NMDS-SC contains a unique global identification number based on each employees National Insurance number and date of birth (in coded format) which indexes individual workers anonymously. This allows Skills for Care to count the number of jobs held by each individual recorded in the NMDS-SC.
Independent employers
The number of people employed by independent bodies who had more than one job was calculated using data collected by the NMDS-SC.
Adjustments were then made to these figures to account for the following:
� workers recorded in the NMDS-SC can have jobs in non-participating adult social care establishments
� participating establishments update their records at different intervals and, in the interim, workers can change jobs and be recorded in the NMDS-SC in jobs they have left.
Local authorities
In 2012, 98 out of the 152 councils provided national insurance numbers and dates of birth for all their workers in the NMDS-SC. The incidences of people with more than one council job were counted and it was assumed that the rate was the same for the remaining councils.
Direct payments recipients
As at 2012 the NMDS-SC did not contain enough data about direct payments recipients to make reliable estimates of the number people with more than one job in this type of employment.
Skills for Care therefore continued to use data from the 2011 survey which asked people working for direct payments recipients how many adult social care jobs they held. Over 100 responses were received to this survey and estimates were created using this data.
In the future, as the NMDS-SC collects more data about this type of employment, more accurate and detailed estimates will be made.
34
Cross-over between types of employer
Estimates were also made for the number of people with adult social care jobs in more than one type of employer.
The number of people with jobs in local authorities and independent bodies was estimated using the NMDS-SC. Estimates of the number of people with jobs for direct payments recipients and in the independent or local authority employers was estimated using data from the direct payment recipient workers survey mentioned above as no new information was available for 2012.
These estimates should be treated as preliminary and Skills for Care will continue to refine and improve them in the future.
(c) Trend data
Skills for Care has ensured that, wherever possible, the trend data presented in this report are comparable across years and that consistent methods have been used. To achieve this some previously published data were re-visited for this report and therefore may not match previously published numbers.Data not in the trend sections in this report may not be directly comparable with previously published numbers and therefore should not be directly compared. Please contact Skills for Care if you are interested in additional trend data not provided in this report.
For the following areas consistent methods could not be used; however, great care was taken to ensure they were as comparable as possible.
� Local authorities – as previously mentioned the NMDS-SC replaced the SSDS001 as the adult workforce data return for local authorities in 2011. Although the two data sources are not directly comparable, steps were taken to ensure the trends produced were as reliable as possible. Due to the lack of comparability it is acknowledged that the true change in the number of jobs between 2010 and 2011 may not have been exactly -9% as quoted in this report. Skills for Care is confident, however, in the conclusion that there was a relatively large decrease in the number of these jobs between 2010 and 2011. Figures from 2011 onwards are directly comparable.
� CQC regulated non-residential establishments – in 2011 CQC changed the format of its data. Previously each establishment was given a ‘main service’ whereas now all services establishments offer are listed without an indication of the ‘main’ service. Methodological changes were therefore required for this report to account for this change; unfortunately it was not possible to replicate this new methodology for non-residential services and as such the results are not directly comparable. Skills for Care is confident, however, that the results are reliable and from 2011 onwards the trends are directly comparable.
35
Direct payment recipients
For this year’s report Skills for Care estimated a trend of the proportion of direct payments recipients that were employing staff using two estimates, one from 2008 (64%) and another from 2013 (51%).
Both these estimates came with a degree of uncertainty (see section 2.5.2) and therefore the trend produced should not be treated as exact. Skills for Care is confident that the findings of these two surveys together with anecdotal evidence from sector experts that this decrease is ‘real’, however the exact scale of this decrease is only estimated.
Also the trend line produced between these years should be treated with caution as separate data were not available for these years. Skills for Care hypothesised that the decrease was most likely to have happened in proportion with the increase in the total number of direct payments recipients (i.e. that the majority of the change was likely to have come from new direct payments recipients rather than existing recipients changing from employing staff to not employing staff) although there is no firm evidence to confirm this hypothesis.
In future Skills for Care plan to routinely collect this data in order to provide more accurate and robust trends for this part of the sector.

36
5.1.3 Data quality overview
This section provides an overview of the quality of the workforce estimates in this report. Due to the fragmented nature of adult social care and the various data sources required to produce this report, there is quite a large variation in the quality of the estimates for different parts of the sector.
These differing levels of confidence should be taken into account when interpreting the estimates throughout this report. Table 5.2 provides a summary of this section.
CQC regulated independent sector employers
CQC collect a comprehensive list of all regulated employers. Therefore the figures about the number of employers for this part of the sector are very accurate and timely.
In terms of the number of jobs estimates, CQC collect capacity for Care only homes and Care homes with nursing which allows for very robust workforce models to be created and estimate the number of jobs for these employers.
For other residential and non-residential establishments CQC does not collect a capacity measure. Without this useful predictor the estimated number of jobs is not quite as robust as those for care homes. Skills for Care have created proxy measures for the capacity of these establishments, however the estimates do still rely on the assumption that the NMDS-SC is representative in terms of establishment size.
This assumption has been tested for residential establishments (which was possible because capacity data are available for these employers) and only a very slight skew towards larger establishments was found. Given these results it seems reasonable establishments and that the estimates produced are not significantly skewed.
Skills for Care was also able to cross check these estimates against employer size proportions from the IDBR, although this comparison is not 100% like for like there was no evidence found to suggest the NMDS-SC was significantly skewed for non-residential establishments.
Non-CQC regulated independent sector employers
These estimates were created by subtracting the number of CQC regulated employers from the total number of employers in social care SIC as recorded by the IDBR. Children’s and other non-adult social care establishments were removed using proportions Skills for Care estimated via searching the internet for a sample of Companies House data.
Not all establishments could be found via these internet searches and therefore the quality of these estimates relies on the assumption that establishments that couldn’t be found were ‘missing at random’ (i.e. those not found followed similar proportions to those that were found). Skills for Care believe this to be reasonable and is exploring ways to check this assumption in future.
37
The proportions used (residential 40% and non-residential 35%) were based on random samples of 500 employers. A 95% confidence intervals for these proportions show that given the data collected, there is only a 5% chance that the true values for these proportions falls more than 5% away from the proportions observed (35-45% for residential and 30%-40% for non-residential).
Skills for Care will continue to work on improving these estimates, which will include a full review of which employers in these categories are categorised as adult social care.
In terms of the number of jobs for these employers, the NMDS-SC holds a relatively small number of these employers (400 residential and 1,000 non-residential). Therefore the number of jobs estimates were not as robust as for CQC regulated establishments where coverage is much higher. The estimates were however stratified by size using the IDBR and therefore should be of relatively good quality.
Local authority
In 2012 the NMDS-SC received a full report from all 152 local authorities. As such the estimates for this part of the sector will be very accurate and robust.
Direct Payments recipients employing staff and their workforce
The estimated range of direct payments recipients employing staff (45% to 60%) was calculated by creating a 95% confidence interval from the data received. This range should, however, only be interpreted as an ‘estimated likely range’ because the local authorities were not randomly sampled (they chose to respond) and therefore there is the potential that the data received were skewed.
Skills for Care deem it unlikely that that the data received were significantly skewed, however, it is planned to collect more robust data on this part of the workforce for next year’s report.
In terms of the number of jobs, the uncertainty above is compounded with the additional uncertainty around the average number of jobs for each direct payments recipient. The average found from the NMDS-SC was 2.32, however Skills for Care estimated a likely range of between 2.2 and 2.5 jobs per recipient (95% confidence interval). In order to account for both areas of uncertainty Skills for Care created 1,000 simulations for both figures to estimate the range of 190,000 to 280,000 jobs for direct payments recipients (again these were calculated as 95% confidence intervals but were not presented as such due to the non-random nature of the samples). The same simulation technique was used to estimate the likely range of people doing these jobs (115,000 to 180,000).
This area of report carries the most uncertainty and Skills for Care are currently exploring ways of collecting more data and increasing the confidence around these estimates in the future.
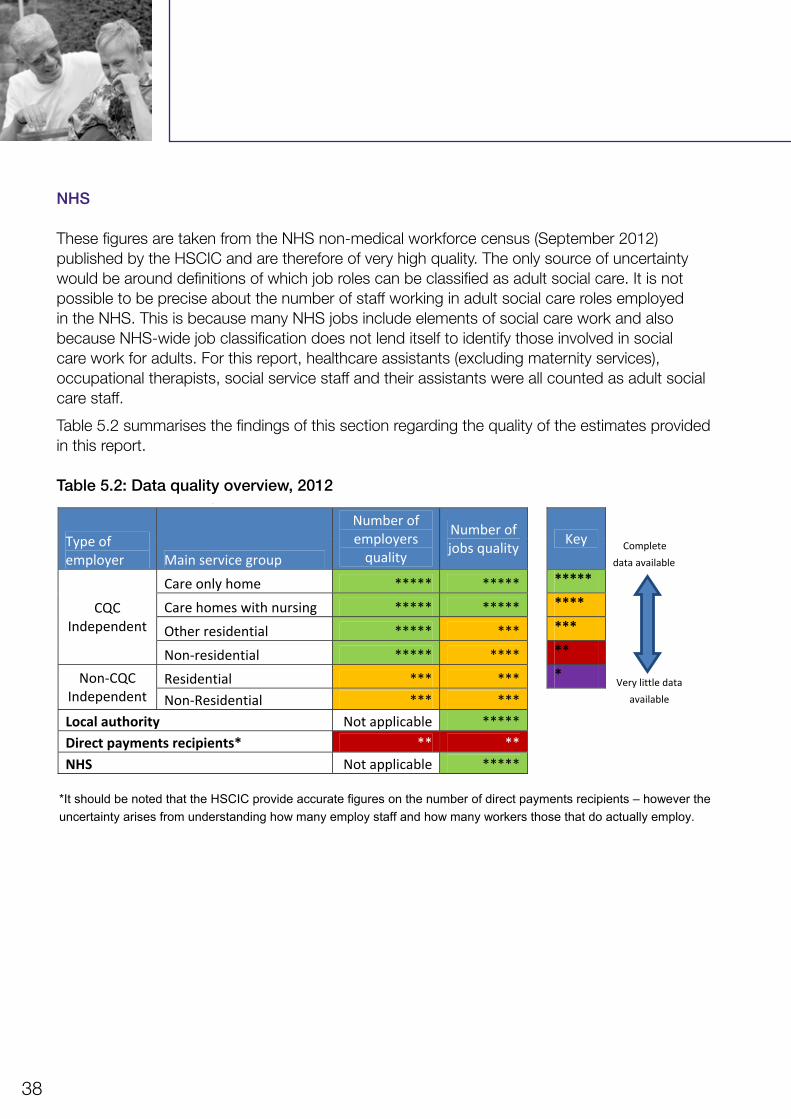
38
NHS
These figures are taken from the NHS non-medical workforce census (September 2012) published by the HSCIC and are therefore of very high quality. The only source of uncertainty would be around definitions of which job roles can be classified as adult social care. It is not possible to be precise about the number of staff working in adult social care roles employed in the NHS. This is because many NHS jobs include elements of social care work and also because NHS-wide job classification does not lend itself to identify those involved in social care work for adults. For this report, healthcare assistants (excluding maternity services), occupational therapists, social service staff and their assistants were all counted as adult social care staff.
Table 5.2 summarises the findings of this section regarding the quality of the estimates provided in this report.
Table 5.2: Data quality overview, 2012
- 40 -
healthcare assistants (excluding maternity services), occupational therapists, social service staff and their assistants were all counted as adult social care staff.
Table 5.2 summarises the findings of this section regarding the quality of the estimates provided in this report.
Table 5.2: Data quality overview, 2012
Type of employer Main service group
Number of employers quality
Number of jobs quality
Key
Complete data available
CQC Independent
Care only home ***** ***** *****
Care homes with nursing ***** ***** ****
Other residential ***** *** ***
Non‐residential ***** **** **
Non‐CQC Independent
Residential *** *** * Very little data available Non‐Residential *** ***
Local authority Not applicable ***** Direct payments recipients* ** ** NHS Not applicable *****
*It should be noted that the HSCIC provide accurate figures on the number of direct payments recipients – however the uncertainty arises from understanding how many employ staff and how many workers those that do actually employ.

39
5.2 Appendix 2: Future workforce scenarios
All of the workforce scenarios presented in this report have been re-calibrated to take into account the new workforce estimates for 2012. The future growth projected by these scenarios is in the same proportions as the originals, however due to the refinement of the estimates of the current workforce, this results in smaller absolute projections of the future workforce.
Skills for Care hope to include updated projections in next year’s report.
The Base Case
The Base Case scenario assumes the same patterns of service which existed in 2008–9 continue at a constant rate while demand for services increases as anticipated. The number of jobs could rise by around 50% to 2.4 million in 2025.
Maximising Choice
Under the Maximising Choice scenario, all who wish to have their publicly funded-social care provided in a highly personalised way in their own homes could do so. The number of jobs would increase to 2.6 million (by 60%) by 2025. Most jobs will be personal assistants.
Contain and Community
The Contain and Community scenario envisages that most care and support would be provided by a largely unpaid workforce of family carers and community volunteers. The paid workforce would focus on managing these resources and on front-line professionalised support at whole family level. Paid jobs would increase by 27% to 2.1 million in 2025.
Restricted Resources
The Restricted Resources scenario assumes that future resources for adult social care will be very limited. Consequently, it envisages fewer but more stringent assessments and reviews, greater roles for community advice and guidance services and higher client-staff ratios in publicly-funded residential care. The number of jobs would increase by 19% to just over 1.9 million.
For more detail please see ‘The state of the adult social care workforce in England, 2010’.14
5.3 Appendix 3: Cross tabulations and regional estimatesThis appendix is available as an Excel document and can be downloaded at www.skillsforcare.org.uk/research
5.4 Appendix 4: Local authority level estimatesThis appendix is available as an Excel document and can be downloaded at www.skillsforcare.org.uk/research
14 Skills for Care 2010, http://www.skillsforcare.org.uk/research/research_reports/state_of_the_adult_social_care_workforce_reports.aspx