sites.krieger.jhu.edu · 2018-02-12 · other hand, robert lucas (1988) argued that the role of the...
TRANSCRIPT

SAE./No.87/September 2017
Studies in Applied Economics
FINANCIAL DEEPENING AND ECONOMIC GROWTH IN
SELECT EMERGING MARKETS WITH CURRENCY BOARD SYSTEMS: THEORY
AND EVIDENCE
Yujuan Qiu
Johns Hopkins Institute for Applied Economics,
Global Health, and Study of Business Enterprise

1
FinancialDeepeningandEconomicGrowthinSelectEmergingMarketswithCurrencyBoardSystems:TheoryandEvidence
ByYujuanQiu
Copyright2017byYujuanQiu.Thisworkmaybereproducedoradaptedprovidedthatnofeeis
chargedandtheoriginalsourceisproperlycredited.
AbouttheSeriesThe Studies in Applied Economics series is under the general direction of Professor SteveH.Hanke, Co-Director of the Institute for Applied Economics, Global Health and the Study ofBusinessEnterprise([email protected]).Thisworkingpaperisoneinaseriesoncurrencyboards.Thecurrencyboardworkingpaperswillfillgapsinthehistory,statistics,andscholarshipofthesubject.TheauthorsaremainlystudentsatTheJohnsHopkinsUniversityinBaltimore.
AbouttheAuthorYujuan Qiu is a senior at The Johns Hopkins University in Baltimore double majoring inEconomics and Applied Math and Statistics. She wrote this paper during her time as anundergraduateresearcher forthe InstituteofAppliedEconomics,GlobalHealth,andStudyofBusinessEnterprise.ShewillgraduateinMay2018.
AbstractThis paper investigates some indicators of financial development in select countries withcurrency board systems and raises some questions about the connection between financialdevelopment and growth in currency board systems. Most of those cases are long-pastepisodesofwhatwewouldnowcallemergingmarkets.However,thepaperalsolooksatHongKong,thecurrencyboardsystemthatisoneoftheworld’slargestandmostadvancedfinancialmarkets.Theglobalfinancialcrisisof2008-09createddoubtsabouttheefficiencyoffinancialmarketsinadvancedeconomies,includinginHongKong,andunsettledthepreviousconsensusthatalargefinancialsectorwouldbemorestablethanasmallerone.
AcknowledgementsIthankProfessorSteveH.HankeandDr.KurtSchulerfortheirguidanceandadvice.Keywords:banks,currencyboard,financialdeepening,growthJELcodes:F4,N10,O42
2
IntroductionFinancialdevelopmentisintertwinedwithacountry’sresilience,productivityandgrowth.The2008-09 global financial crisis raised doubts about the merits of financial deepening andfinancialdevelopment,giventhatthecrisisoriginatedinadvancedeconomies(AEs),wherethefinancialsectorhadgrownbothverylargeandverycomplex(Sahayetal.2015:5).Debatesontherelationshipbetweeneconomicgrowthandfinancialdevelopment,particularly inrelationtoemergingmarkets(EMs),havelastedforyears.Theroleofmoneyandfinanceineconomicgrowth has been examined and discussed from diverse angles by economists, with littleconsensus. Joseph A. Schumpeter (1912) and Walter Bagehot (1873) emphasized that thedevelopment of the banking system can actively spur innovation and growth by mobilizingsavings, managing risks, facilitating transactions, and providing robust funds for productiveactivities. Raymond Goldsmith (1969) and RonaldMcKinnon (1973) also emphasized that anadvancedfinancialstructureanda liberalizedfinancialsystemallowthemarket todetermineitsreal interestrate,thusexertingapositiveeffectontheexpansionoftheeconomy.Ontheotherhand,RobertLucas(1988)arguedthattheroleofthefinancialsystemis“over-stressed”byeconomists.JoanRobinson(1952)wentfurther,contendingthatthereisareversefinance-growthnexus,thatis,financialdevelopmentsimplyfollowseconomicgrowth.Emergingmarketsaretypicallycharacterizedbyhigherfinancial instabilityand lessdevelopedfinancialsystemsthanadvancedeconomies.Akeyelement for thestabilityofaneconomy isthe soundness of its currency. A sound currency is one that is stable, credible, and fullyconvertible.Stabilitymeansthatcurrentannualinflationisrelativelylow,usuallyinsingledigits.Credibilitymeans that the issuercreatesconfidencethat itwillkeep future inflation low.Fullconvertibility indicates that a currency can buy domestic and foreign goods and services,including buying foreign currencies at market rates without restriction. Unlike advancedeconomies,emergingmarketsmostlydidnothavemodern-stylecentralbanksbeforethemid20thcentury.Manyinsteadhadnotesissuedbylocalprivatecommercialbanksorbycurrencyboards (Hanke and Schuler 2015: 1). Generally, these systems performed better than thecentralbanksthatreplacedthem.Intheworstcasesofcentralbankperformanceinemergingmarkets, countries such as Argentina, Bolivia, and Bulgaria have experienced hyperinflationssuchthattheircurrenciescollapsed,leadingtosociopoliticalupheavals,changesofgovernmentand even civil unrest.1Historical experience suggests that the establishment of a soundcurrencyinsuchcasesisimperativeforpromotingdurablegrowth.Currency boards have generally been successful in providing sound currencies. A currencyboardisamonetaryinstitutionthatissuesnotesandcoins(and,insomecases,deposits)fully
1Therehavebeen57recordedcasesofhyperinflation(HankeandBushnell2016).Almostallhaveoccurredundercentralbankingordirectgovernmentissueofcurrencybythetreasury.

3
backedbyaforeign“reserve”currencyandfullyconvertibleintothereservecurrencyatafixedrateandondemand (HankeandSchuler2015:2).The reservecurrency isonechosen for itsexpected relatively good continued performance. Because a currency board has a fixedexchangeratewithitsreservecurrency,anunstabledomesticcurrencyisbasicallyreplacedbyasoundforeigncurrencyandthusstabilizingeconomyactivitiesandspurringfuturegrowth.Much research has been done to analyze the implementation, feasibility, benefits andimprovements of currency board systems in developing economies (for a bibliography, seeGross, Heft, and Rodgers 2012/2013). However, little literature has investigated financialdevelopmentincurrencyboardsystems.Asmentionedearlier,moneyandbanksplayacrucialrole in economic growth and development. Many emerging markets first established anddevelopedadvanced financial intermediaries and instrumentsunder currencyboard systems.However,thefinance-growthnexusisstillunclear.Itisambiguouswhethertheestablishmentof a currency board system encourages financial development, resulting in fast (or at leastfaster)economicgrowth.In this paper, we study whether currency board systems have stimulated higher levels offinancialdevelopment,andwhethercurrencyboardsarepositivelyassociatedwitheconomicgrowth.We use data from three currency board systems, namely the Hong Kong ExchangeFund (later the Hong Kong Monetary Authority), the Straits Settlements Commissioners ofCurrency (later the Malayan Currency Board), and the East African Currency Board. Due tolimitedavailabilityofdata,wefocusonthesixmajorcountriesinthesecurrencyboardsystems,namelyHongKong,Singapore,Malaysia,Uganda,Tanzania,andKenya.(WeomitBruneiintheMalayan Currency Board and a number of countries in the East African Currency Board thatjoinedafterthecoremembers.)Becausethesecountriesimplementedcurrencyboardsystemsatdifferent timesandthey lasted fordifferentperiods, it isdifficult toconductcross-countryresearch by simply comparing financial indicators across common periods. Besides, theavailabilityofdatavaries,and inmostcases, financialdataarehardtofind.Thispaper is thefirst to collect extensive banking data across a number of currency board systems.We startwith case studiesof selected countries individually, and thendiscuss general implications forcountries that shared currency boards by comparing relatively similar periods and units.Ultimately,wedrawsomeconclusionsabouttrendsindifferentcurrencyboardsystems.The main approach is to use ratios of financial assets or liabilities as measures of financialdeepeningandeconomicgrowth.Suchmeasuresincludetheratioofnotestocoins,depositstocurrency,anddepositstoGDP.Becauseofdifferencesintheavailabilityofdata,theindicatorsusedvaryacrosscountries.ForHongKongandothercasesthathavesubstantial,readilyavailableeconomicandfinancialdata,weuseKingandLevine’s(1993)methodsofmeasuringeconomicgrowth,physicalcapitalaccumulation, and economic efficiency improvements. Specifically, we investigate whether

4
higherlevelsoffinancialdevelopmentarespurredbyacurrencyboardsystem,andwhetheritissignificantlyandrobustlycorrelatedwithfastercurrentandfutureratesofeconomicgrowthacrosscountries.Ifso,itsuggeststhatacurrencyboardnotonlystabilizesmonetarypolicybutalso encourages financial development, and this development has empirical connectionwithcontemporaneousandfuturelong-runeconomicgrowth(LevineandZervos,1998:538).MethodologyBasicIndicatorsandRatioComparisonOneof themostwidelyused concepts formeasuring thedevelopmentof financial activity isfinancial deepening. Financial deepening is the increased depth of financial services in aneconomy, normally measured by the ratio of money supply to GDP or one money supplycomponent to another, such as the ratio of deposits to currency. Specifically, financialdeepening indicates an expansion of the financial system, such as more access to financialservices, more diverse financial intermediates and instruments, andmore availability of riskmanagementforfirmsandindividuals.Forcurrencyboardsystemswheredataaresparse,weexaminecertainratiosofmoreadvancedformsofmoneyandcredittomoreprimitiveforms.Tomeasure thedepthof the financial systemand the growthof an economy,webegin ouranalysisbyexaminingfourmainfinancialindicators–monetarybase,moneysupply,deposits,andbankcreditsandassets–andGDPasamaineconomicgrowthindicator.Wethencompareratiosofthoseindicatorstomeasuretheextentoffinancialdeepening.Table1showsdetailsofsub-indicators. However, the analysis of those indicators and ratios of individual countriesdepends on the availability of data. If data are scarce, only certain aspects of financialdeepeningcanbeanalyzed.Individual countries implement currency boards within different historical and economicenvironments, and they adjust their monetary policies as well as financial regulationsaccordingly. Simply conducting cross-country research by comparing their indicators duringcertain periods of time will result in biased and inaccurate estimations that have differentscalesoftime,unitsofcurrency,andmeasurementsofGDP.

5
DATASERIES CALCULATIONSMonetaryBase MoneySupplyMeasures(seeRemarks)Coinsincirculation Monetarybase,M0Notesincirculation Narrowmoney,M1Totalcurrencyincirculation M1substituteDepositsatthecurrencyboard Broadmoney,M2Otherorunspecified M2substituteTotalofallcomponents Grossdomesticproduct:nominal—Ofwhich:currencyheldoutsideofbanks Notes/coins(code:NCR)Currencyheldbybanks Deposits(alldeposits)/currency(code:DCC) M0/GDPDeposits M1/GDP(code:LYY1)Commercialbanks:demanddeposits M1substitute/GDPCommercialbanks:timeandsavingsdeposits M2/GDP(code:LLY2)Commercialbanks:alldeposits Bankcredit/GDPSavingsbanks Bankassets/GDPCreditcooperatives,etc. RatioCalculationsBanking Deposits(alldeposits)/currency(code:DCC)Bankforeignassets M0/NGDPBankcredit(domesticcredit) M1/NGDP—Ofwhich:CreditgrantedtoNFPS* M1substitute/NGDPBankassets(=foreignassets+domesticcredit) M2/NGDP(code:LLY) Bankcredit/NGDPOtherindicators Bankassets/NGDPNominalgrossdomesticproduct(NGDP) RealGDPgrowthratepercapita(code:GDP) OtherCalculationsBankingoffices Populationperbankoffice(code:BPP)Population Privatecredit/domesticcredit(code:PRIVATE) CredittoNFPS*/GDP(code:PRIVY)Remarks:*NFPS=nonfinancialprivatesector.M0=notes+coins+depositsatcurrencyboard;M1=currency in circulation - currency held by banks + demand deposits; M1 substitute = currency incirculation+demanddeposits,wherecurrencyheldbybanksisunknown;M2=M1+timedepositsor,ifnodepositbreakdownisavailable,alldeposits;M2substitute=M1substitute+timedepositsor,ifnodepositbreakdownisavailable,alldeposits,wherecurrencyheldbybanksisunknown.
Table1.DataandCalculationsforFinancialRatios

6
EmpiricalEvidenceForHongKong,wheredetaileddataareavailable,weadoptandextendtheempiricalmethodsofKingandLevine(1993).Wemeasurethestrength,availabilityanddomesticassetdistributionoffinancialsystembyusingtheratioofliquidliabilitiestoGDP,theratioofthenumberofbankoffices topopulation, the ratioofcreditson thenonfinancialprivatesector to totaldomesticcredit,andtheratioofclaimsonthenonfinancialprivatesectortoGDP.Weconstructfourclassesof indicatorsofthedepthoffinancialdevelopment.ThepioneeringworkofMcKinnon (1973)andGoldsmith (1969) ledeconomists touse the sizeof the formalfinancial intermediary sector relative to economic activity to measure financial sectordevelopment,or“financialdepth”(KingandLevine,1993:720).OnemeasureoffinancialdepthistheratioofliquidliabilitiesoffinancialsystemtoGDP.WeusetheratioofM2toGDPasanestimator,whichwelabelLLY2.Liquidliabilitiesarethosethatcanbeconvertedtocashquickly.Theyconsistofcurrencythatisnotheldbybanks,demanddepositsoffinancialinstitutionsatthemonetaryauthority,savingdeposits,andtimedeposits.ParalleltotheratioofM2toGDP,two sub-indicators measure the financial liquidity and depth of currency and deposits,respectively.Thefirst istheratioofnotesincirculationtocoinsincirculation,whichwetermNCR. The second is the ratio of deposits to currency in the circulation,whichwe termDCC.Thesetwosub-indicatorsareusedtoanalyzetheeffectoffinancialdeepeningincirculationanddepositsectors.Thesecondclassofindicatorsoffinancialdevelopmentmeasurestheavailabilityandaccessoffinancial services for individuals. In our data set for selected countries, the most plausibleindicatortomeasureaccesstofinancialservicesisthenumberoflicensedbanks,branches,andoffices. Due to the different data availability across countries, we use the number of bankoffices,branches,andlicensedbanksindescendingorderofpriority.Theratioofpopulationtothenumberofbankofficesestimateshowmanyindividualseachoffice isservingonaverage,which we label BPP. If the data of the number of bank offices is not available, we use thenumber of branches as a substitute. There are problems with this measure of financialavailability: (a) banks are not the only financial intermediaries that provide financial servicessuch as riskmanagement, information acquisition, andmonitoring services (King and Levine,1993:721);(b)thequantityofbankingservicesaloneignoresotherkeyfactorssuchassizeandquality;and(c)notallhouseholdandindividualsareinvolvedinorneedfinancialmanagement.Thus, these measures overestimate the demand for financial services. Nevertheless, bymeasuringtheaveragevolumerateperbankoffices,BPPstillwillprovideandcomplementtheanalysisoffinancialavailabilityanddepththatcanbedrawnfromLLY.The third and fourth classes of financial deepening indicators measure domestic credit andassetsdistribution.Oneofthemostimportantfinancialservicesistomakeloansandadvances

7
for firms, households, individuals and government. However, a financial system that simplyfunnels credit to the government or to state-owned enterprises may not be evaluatingmanagers, selecting investment projects, pooling risk, and providing financial services to thesame degree as financial systems that allocate credit to the private sector (King and Levine,1993: 721). FollowingKing and Levine (1993),we construct two indicators tomeasure creditdevelopment.Theratioofcredittothenonfinancialprivatesectorbydomesticbankstototaldomestic credit measures the proportion of credit allocated to private enterprises by thefinancialsystem,whichwetermPRIVATE.TheratioofcredittothenonfinancialprivatesectortoGDP showshow largeprivate credit looms in theeconomy,andwe term this ratioPRIVY.Although the PRIVATE and PRIVY indicators neglect the public sector, and therefore are notcompletemeasurementsoffinancialdeepening,theystillcanillustratesomeaspectoffinancialdevelopmentandcomplementthefirsttwoindicatorsinthisresearch.Correspondingtothesefourclassesoffinancialindicators,weusethegrowthrateofrealgrossdomesticproductpercapita(realGDPpercapita)asthemeasurementofeconomicgrowth.Inthefollowingsections,westartanalyzingthetrendoffinancialindicatorsinselectedcountriesbefore and after the installation of their currency boards, and we run regressions of thosefinancial indicatorson thegrowth rateofGDPpercapita to investigatecorrelationsbetweenfinancial development and economic growth.We then perform a cross-country analysis thatestimates the general effect of currency boards on financial development by adjustingindividualfinancialindicatorstoacomparableindex.DataWe undertook substantial data collection and digitization from diverse sources. However, inthispaper,weonlyconcentrateonselectcountriesthathavefullerdata.Majorsourcesforthedata include B. R.Mitchell’s International Historical Statistics, recently available in databaseform; Global Financial Data; World Bank datasets; the International Monetary Fund’sInternational Financial Statistics database; British statistical abstracts of the colonies; localstatisticalabstracts;KrusandSchuler (2014), incorporated intheHistoricalFinancialStatisticsdataset;andreportsandwebsitesofmonetaryauthorities.Itisdifficulttoassemblecompletedatasetsformanycountries.Bankingdata,particularly,areoftenincompletebecausemanyBritishcolonieswithcurrencyboardsdidnotrequirebankstopublishstatementsoflocalassetsandliabilities.ThelargestbanksinmostBritishcolonieswereLondon-based organizations with operations in multiple countries, such as today’s StandardChartered Bank. The banks published balance sheets for their global operations, butdetermining country-level assets and liabilities would involve time-consuming work in bankarchives,mainlyinBritain,thatwasnotpossiblewithinthetimeandbudgetforthispaper.Theunderlying data used in this study, and a large amount of other data not used here, areavailable in an accompanying spreadsheet workbook. Data whose public reproduction is

8
prohibitedbytheirsourceareavailablefrommeforresearcherswhowishtohavethedataforpersonaluseinreplicationoftheresultshere.CaseStudyofHongKongInthehistoryofHongKong,afixedexchangeratesystemhasbeenthenormratherthantheexception (Chiu n.d: 2). Hong Kong has experienced three currency board periods: fromDecember 1935 to December 1941 (ended by Japanese occupation during World War II),September1945toJuly1972(endedbyadecisiontofloatthecurrencytoappreciateitduringaperiodofweaknessinthepoundsterling,thentheanchorcurrency),andfromOctober1983topresent. Longtime use of a rigid exchange rate anchor has helpedmakeHong Kong a highlyexternallyorientedeconomy.Forexample,visibleandinvisibletotaltradeaccountedforabout300 percent of GDP in 2000. Unlike other countries that adopted currency boards in recentdecades as a way to stop hyperinflation, Hong Kong has long historical experiencewith thesystem,underwhich itsawimprovement in itssocialeconomyandrefinement in itsfinancialsystem.WewillfocusonHongKong’slatestcurrencyboardperiodfrom1983to2002.Westopat2002mainlybecausefinancialindicatorsdatalikecoinsandnotesincirculationonlyupdateto2002andthisperiodhasthebestdataavailability.
Hong Kong, one of the most significant financial centers in the world, has had a successfulmonetary and financial system compared to other emergingmarkets. The systemdevelopedmuchdifferentlyfromthemonetarysystemsofotherleadingfinancialcenters:HongKonghasneverhadacentralbank.BeforeHongKongwastiedtotheU.S.dollar, itadoptedaclassicalBritishcolonialcurrencyboard,whichitselfreplacedfreebanking(fullycompetitivenoteissueby banks). The establishment of the Exchange Fund in 1935 represents the beginning of the“sterlingexchangeera”inHongKong, inwhichHongKongandGreatBritainsharedthesamecurrency.However, thepound sterlingwasalmost continuouslyweakagainst theU.S.dollar.Thepoundwasdevaluedby30.5percentonSeptember19,1949.OnNovember18,1967,thepound was devalued again, by 14.3 percent, which had a critical effect on Hong Kong’seconomy. Because the value of currencies of othermajor trade partners such as China andJapan remained stable,HongKong’s costof imports rosedramatically.Althoughnegotiationsregarding the “Hong Kong Dollar Bond Rate” and the Basel Agreement offered someprotection,2BritishmonetaryinstabilitystillhadaharmfulinfluenceonHongKong’seconomy.WhentheBritishgovernmentuntiedthepoundfromitsgoldparityandletitfloatonJune23,1972, it ended the sterling area— a set of arrangements under which countries that usedsterlingastheiranchorcurrencyallowedcapitalmovementsfreelyamongthemselves,thoughnotwithothercountries(HankeandCulp2013:22).
2AsanincentiveforHongKongtocontinuetoholdsterlingreserves,theBritishgovernmentpromisedtoprotectthereservesagainstafurtherdevaluationofthepoundsterlingwithrespecttotheU.S.dollar.

9
Britain’sfloatingofthesterlingwaspartofthecollapseoftheinternationalsystemofpeggedexchangerates thathadbeenagreedat the1944BrettonWoods financial conference.Manycountries respondedwithnovel policies.HongKongat first switched to theU.S. dollar as itsanchor currency, then in 1974,when the dollarwas suffering fromweakness reminiscent ofsterlingafewyearsearlier,HongKongfloated.Hong Kong at the time had an unusualmonetary system that lacked an effectivemonetaryanchor.Therewasnocentralmonetaryauthority,sothegovernmentdidnothavecontroloverthesupplyofinterbankliquidityandinterestratestoregulatetheeconomyasawhole.NordidHongKonghaveacurrencyboardsystem,becausenocurrencyorcommoditywasbeingusedas an exchange rate anchor. The floating exchange rate period was characterized by largeswings in the money supply, but compared to many other monetary systems of the era itappearedtoworkreasonablywelluntil1983.TheUnitedKingdomandChinawerenegotiatingthestatusofHongKongafter1997,whenthe99-yearBritishleaseonmostoftheterritoryofHong Kong would expire. A senior Chinese official started a panic in Hong Kong when hebelligerentlystatedthatChinamighttakeHongKongbackbefore1997.TheHongKongtoU.S.dollarexchangeratefellfrom7.31inSeptemberto9.55inOctober.Toendthepanic,theHongKongdollarstabilizedtheexchangerateat7.8HongKongdollarsperU.S.dollar,andreturnedtoacurrencyboardsystem(HankeandCulp2013:23-25).
Chart1

10
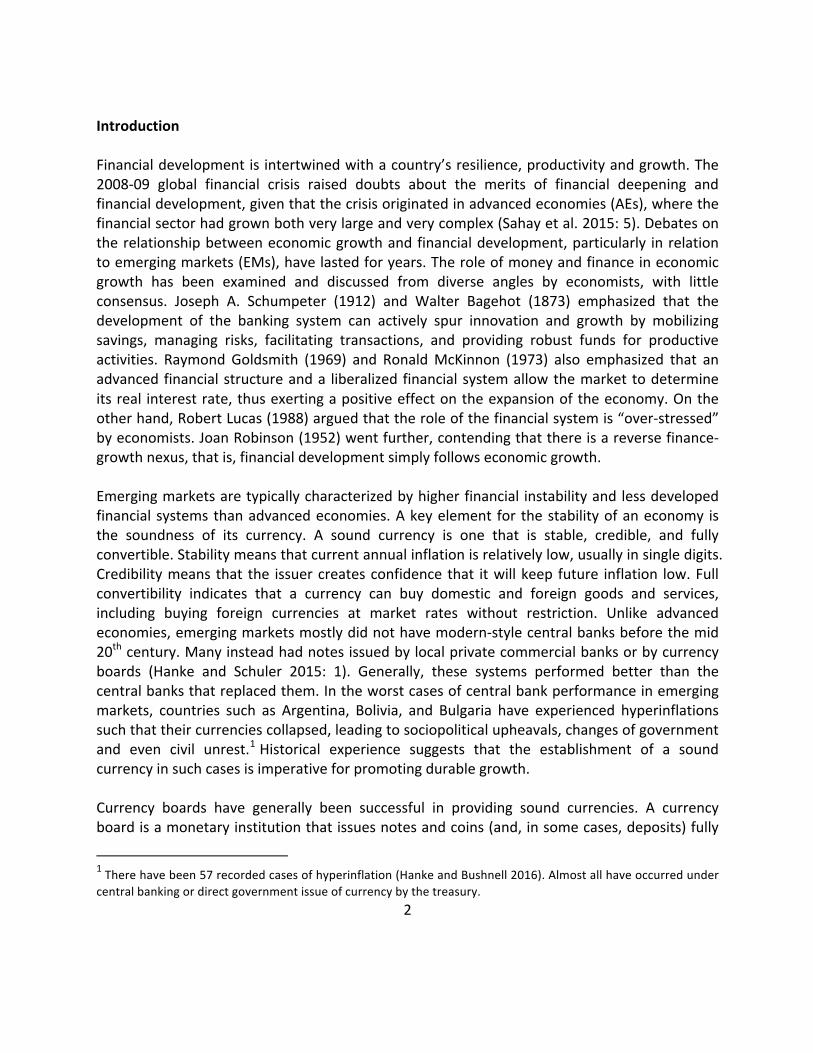
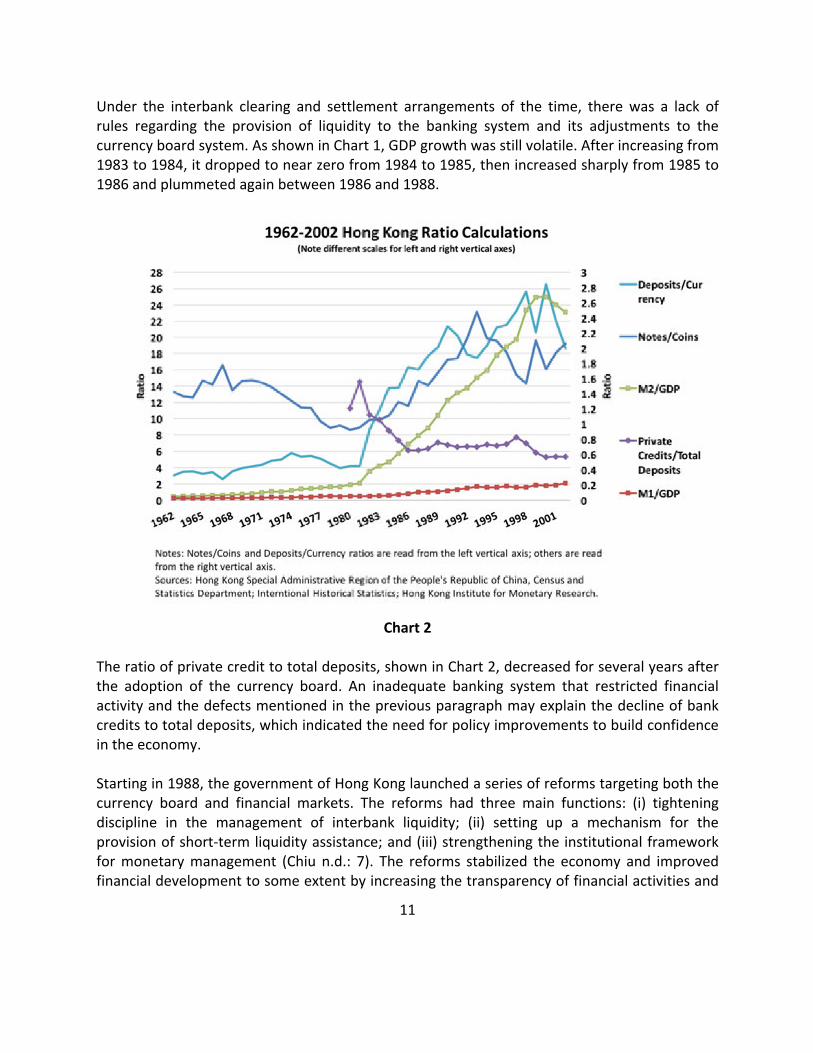
As shown in Chart 1, thoughHongKong seemed to recover quickly from the 1973 global oilcrisis,achievingrealGDPgrowthof8-20percentwitharound5percentinflationfrom1976to1978, thegrowthratekeptdecreasing.Starting in1978, realGDPgrowthdropped from11.6percentto2.9percentandinflationsurgedtoover15percentuntil1983.Thefloatingexchangerateregime,publicconstructionprojects,andaboomingpropertymarketcreatedaneconomicbubble, which burst as the world economy slowed under the influence of recessions in theUnitedStatesandsomeothercountries.Aftertheimplementationofthecurrencyboardsystemin1983,therewasanimmediateriseinrealGDPgrowth,and inflation fell from15percent to4-6percentwithin thenext fiveyears.Nevertheless, some peculiarities of Hong Kong’s currency board system generatedcomplicationsuntilreformedin1988.Until1988,theHongKongbankingsystemwascompletelyseparatefromtheExchangeFund,themonetary authority. All payments in the banking systemwere settled through theHongKongAssociationofBanks(HKAB)clearinghouseratherthanthroughthecurrencyboard.Theclearinghouse was managed by the Hong Kong and Shanghai Banking Corporation (HSBC)(HankeandCulp2013:25).Inotherwords,theclearingbalancesandfinancialtransactionsofbankingsystemwerenotshowninthecurrencyboard’sbalancesheet.Furthermore,banksatthattimecouldnotdirectlyconverttheirdepositsintobanknotes,orviceversa;conversionwasindirectandusuallyworkedadequatelybutwassubjecttoproblemsunderstress(Chiun.d:10).Under the interbank clearing and settlement arrangements of the time, therewas a lack ofrules regarding the provision of liquidity to the banking system and its adjustments to thecurrencyboardsystem.AsshowninChart1,GDPgrowthwasstillvolatile.Afterincreasingfrom1983to1984,itdroppedtonearzerofrom1984to1985,thenincreasedsharplyfrom1985to1986andplummetedagainbetween1986and1988.Theratioofprivatecredittototaldeposits,showninChart2onthefollowingpage,decreasedforseveralyearsaftertheadoptionofthecurrencyboard.Aninadequatebankingsystemthatrestricted financialactivityandthedefectsmentioned in thepreviousparagraphmayexplainthedeclineofbankcreditstototaldeposits,whichindicatedtheneedforpolicyimprovementstobuildconfidenceintheeconomy.Until1988,theHongKongbankingsystemwascompletelyseparatefromtheExchangeFund,themonetary authority. All payments in the banking systemwere settled through theHongKongAssociationofBanks(HKAB)clearinghouseratherthanthroughthecurrencyboard.Theclearinghouse was managed by the Hong Kong and Shanghai Banking Corporation (HSBC)(HankeandCulp2013:25).Inotherwords,theclearingbalancesandfinancialtransactionsofbankingsystemwerenotshowninthecurrencyboard’sbalancesheet.Furthermore,banksatthattimecouldnotdirectlyconverttheirdepositsintobanknotes,orviceversa;conversionwasindirectandusuallyworkedadequatelybutwassubjecttoproblemsunderstress(Chiun.d:10).
11
Under the interbank clearing and settlement arrangements of the time, therewas a lack ofrules regarding the provision of liquidity to the banking system and its adjustments to thecurrencyboardsystem.AsshowninChart1,GDPgrowthwasstillvolatile.Afterincreasingfrom1983to1984,itdroppedtonearzerofrom1984to1985,thenincreasedsharplyfrom1985to1986andplummetedagainbetween1986and1988.
Chart2
Theratioofprivatecredittototaldeposits,showninChart2,decreasedforseveralyearsafterthe adoption of the currency board. An inadequate banking system that restricted financialactivityandthedefectsmentionedinthepreviousparagraphmayexplainthedeclineofbankcreditstototaldeposits,whichindicatedtheneedforpolicyimprovementstobuildconfidenceintheeconomy.Startingin1988,thegovernmentofHongKonglaunchedaseriesofreformstargetingboththecurrency board and financial markets. The reforms had three main functions: (i) tighteningdiscipline in the management of interbank liquidity; (ii) setting up a mechanism for theprovisionofshort-termliquidityassistance;and(iii)strengtheningtheinstitutionalframeworkformonetarymanagement (Chiu n.d.: 7). The reforms stabilized the economy and improvedfinancialdevelopmenttosomeextentbyincreasingthetransparencyoffinancialactivitiesand

12
providing liquidityassistance.From1988 to1997, the ratioofprivatecredit to totaldepositsstayed relatively stable at around 0.7, and other ratio indicators showed steadily increasingtrends.Specifically,M2/GDPratioincreasedfrom0.95to2.11inthesenineyears.AsM2/GDPrepresentstheratiooftheliquidliabilitiesofthefinancialsystemtoGDP,itsconsistentgrowthimpliesfinancialdeepeningwiththeimplementationofthecurrencyboard.Similartrendscanbe found in the ratio of notes to coins in circulation and the ratio of deposits to currency.Despite a small decrease from 1990 to 1993, the ratio of deposits to currency consistentlyincreased over years. In fact, right after the adoption of the currency board, this ratio grewfromaround4to10between1982and1983,andcontinuedrisingto20.Theratioofnotestocoins also jumped from10 to 23 from1983 to 1993. In 1993 the Exchange Fund and someother government financial functions weremerged into the Hong KongMonetary Authority(HKMA).
HongKong’scurrencyboardexperiencedaseveretestduringtheEastAsianfinancialcrisisof1997.Asshown inChart1,bothrealGDPgrowthand inflationturnednegative from1997to1999, the first negative growth since 1962. The crisis weakened the Hong Kong dollardramatically. Collectively selling to theHKMAmoreHongKongdollars than their balances intheir clearing accounts, banks faced a liquidity shortage when the foreign exchangetransactionshadtobesettled(Chiun.d.:9).Eachratio,thoughshowingthedeclinefromthisfinancialcrisis,respondedtoadifferentextent,andthetrendsstartedatdifferenttimes.Theratioofnotestocoinsexperiencedamajordeclinethreeyearsbeforethecrisisandrecoveredin1999aftersomeamendmentstomonetarypolicieswerelaunched.Theratioofdepositstocurrency,however,wassynchronizedwithfinancialfluctuations,dropping5percentagepointsbetween1997and1998.Theratioofprivatecredittototaldepositsalsodecreasedaround50percent during the crisis. Interestingly, the M2/GDP ratio continued rising, jumping 24percentagepointsbetween1996to1998.Thiscontinuousincreasemayindicatethatfinancialactivity as a whole played an important role in Hong Kong’s economy and steadily boostedgrowthdespiteexistingfinancialinstabilities.
Besidesanalyzingtheeconomicactivityandfinancialdeepeningfromratio indicators,wecanalsolookatamoredirectmeasurementforfinancialaccess:theavailabilityoffinancialservicescalculatedbytheratioofHongKongpopulationtototalbankoffices.AsshowninChart3onthe followingpage,after the implementationof thecurrencyboardsystem, financialservicesdevelopedsignificantlyandstayedatastablerate intermsofofferingservicestopeopleperoffice. From 1962 to 1983, the ratio of population to bank offices plummeted from 16,000peopleperofficeto3,600peopleperoffice,showinga4.5timesincreaseintheavailabilityoffinancialservices.Byservingfewerpeopleperoffice,financialinstitutionscouldprovideamoresystematic,refinedandpersonalservicestodeepenfinancialdevelopmentinHongKong.Notethatpeopleperbankingofficewas fallingbefore1983and then immediately increased from3,400 to 4,000 people per office at 1983 and continued rising, albeit slowly. This indicatessomethingofa shake-outafter the re-introductionofacurrencyboard,perhapsbecause the

13
fixedexchangerateofacurrencyboardfosteredmoreexternallyorientedtradeandbusinessthatrequiredfinancialservicessuchastransaction,riskmanagementandcapitalaccumulation,or perhaps because of technological changes in the banking industry such as the spread ofautomatictellers.
Chart3
According to theanalysisof financial ratiocalculationsandeconomicdevelopment indicatorsabove, financial development was improved by the readoption of a currency board system.However,eachfinancialratioshowsadifferentdegreeofeffectoneconomicactivities.Asthelink between financial deepening and economic development becomes clear, it would behelpfulifweusefinancialratiostoanalyzeandforecasteconomicactivities.Empiricalevidenceforfinancialdeepeningandeconomicgrowthareprovidedasfollows.Theregressionmodelis:GDP = β& + β( ∗ 𝐿𝑌𝑌1 + β- ∗ 𝐿𝑌𝑌2 + β/ ∗ 𝐵𝑃𝑃 + β2 ∗ 𝑃𝑅𝐼𝑉𝐴𝑇𝐸 + β9 ∗ 𝑃𝑅𝐼𝑉𝑌 + β: ∗ 𝑁𝐶𝑅
+ β= ∗ 𝐷𝐶𝑅 + U∗Where GDP=growthrateofrealGDPLYY1=theratioofM1tonominalGDPLYY2=theratioofM2tonominalGDPBPP=theratioofpopulationtothenumberofbankofficesPRIVATE=theproportionofcreditallocatedtoprivateenterprisesbythefinancialsystem

14
PRIVY=theratioofcreditstononfinancialprivatesectortoGDPNCR=theratioofnotesincirculationtocoinsincirculationDCR=theratioofdepositstocurrencyinthecirculation.U*=errortermAsPRIVATEandPRIVYdataareonlyavailablefrom1979to2002forallvariables,weperformregressiontestsfortwoperiods.(SeetheaccompanyingExcelworkbookfordetails.)RegressionA includesall available indicatorswith23observations from1979 to2002, andRegressionCexcludesPRIVATEandPRIVYbuthas41observations.AsshowninTable2,RegressionAshowsthat all indicators except PRIVY are statistically significant at the 70 percent level, as their pvaluesareallsmallerthan0.3.LYY1,LYY2andPRIVATEhavelowerp-valuessuchthatwecanreject the null hypothesis at the 85 percent significance level. We dropped the statisticallyinsignificantvariable,PRIVY,andperformedregressionBtoprovidemoreaccurateestimates.TheresultsuggestsalinearrelationshipbetweenfinancialindicatorsandGDPgrowthrate:
GDP = 56.23819 + 219.8881 ∗ 𝐿𝑌𝑌1 − 9.829089 ∗ 𝐿𝑌𝑌2 − 0.0066327 ∗ 𝐵𝑃𝑃
− 0.2068211 ∗ 𝑃𝑅𝐼𝑉𝐴𝑇𝐸 − 0.9642619 ∗ 𝑁𝐶𝑅 + 0.397473 ∗ 𝐷𝐶𝑅 + U∗Note that four out of six financial indicators in fact have negative coefficientswith theGDPgrowthrate.OnlyLYY1andDCRhavepositivecoefficientsthatareconsistentwiththefinance-growthnexustheory.However,therearetwomainconcernswiththeregressionmodels.First,thelackofobservationscouldcauseinaccurateestimates.The23observationsinregressionBfrom 1979 to 2002 years can only provide partial information in that particular period. Asmentioned above, the establishment of the currency board in Hong Kong also experiencedmany complications and economic shocks, and these fluctuations are likely to cause biases.Second,financialindicatorsarecorrelatedandtheircorrelationcanresultinmulticollinearityintheregressionmodel.Specifically,multicollinearityexistswhentwoormoreofthepredictorsina regressionmodel aremoderatelyorhighly correlated.When it exists, unfortunately, it canwreak havoc on our analysis and weakens the estimated regression coefficient of any onevariable. Therefore, regressionmodels thatweareusingheremay involve somebiasdue todataavailabilityandcorrelationbetweenfinancialindicators.Interestingly,afterdroppingPRIVATEandaddingmoreobservations,thecoefficientsofsomefinancialindicatorsshowsignificantchange.AsshowninTable2,thenewregression,C,showsalinearrelationshipbetweenGDPandfinancialindicators:
GDP = 2.301505 + 213.0505 ∗ 𝐿𝑌𝑌1 − 15.34502 ∗ 𝐿𝑌𝑌2 + 0.001099 ∗ 𝐵𝑃𝑃− 0.8939523 ∗ 𝑁𝐶𝑅 + 0.3112364 ∗ 𝐷𝐶𝑅 + U∗
The coefficient of BPP changes from−0.0066327to0.001099, indicating a switch from anegativetoapositivecorrelationwithGDPgrowthrate.Whilethesignsofcoefficientsremain

15
unchanged,themagnitudeoftheireffectsisdifferentbetweenregressionBandC.Unliketheimplicationoffinancegrowthnexusandourearlieranalysisofratiocalculations, indicatorsoffinancial deepening are in fact negative. Regardless of potential bias, we can interpret theempiricalevidence.RegressionBsuggeststhata1unit increaseofLLY1andDCRwill improvetheGDPgrowthrateby219.8881and0.397473units,respectively.OneunitofincreaseofLYY2,BPP, PRIVATE andNCR decreases economic growth by 9.829089, 0.0066327, 0.2068211 and0.9642619, respectively. The R-square is 0.3321, meaning that this model illustrates 33.21percentofthevariationofdata.RegressionCindicatesthata1unitincreaseofLLY1andDCRimproves theGDPgrowth rateby213.0505and0.3112364units, respectively,whilea1unitincrease of LYY2 and NCR decreases economic growth by -15.34502 and -0.8939523,respectively.NotethatthecoefficientsofLYY1andLYY2havedifferentsigns.AlthoughLYY1isacomponent of LYY2, LYY2 provides more information and includes time deposits, whichincreasedramaticallyaftertheimplementationofthecurrencyboard.Weseeamixedresultfromtheregression.Contrarytowhatthefinancegrowthnexustheorysuggests, financial indicators do not have strictly positive relationships with the economicgrowth rate. Considering the possible biases caused by the lack data availability andmulticollinearity,wecannotdrawaclearempiricalconclusionbetweenfinancialdeepeningandeconomicdevelopment.However,theempiricalanalysisabovedoesprovidesomenewanglesand a framework for further studies. If other countries’ data are available and allows us toperform more regression tests, we can get more insights for underlying explanations ofnegativecoefficientsforthesefinancial indicators.Nevertheless,accordingtooursimpleratiocalculationanalysis, it isevident thatgeneraleconomicdevelopmentand financialdeepeningare synchronized and the implementation of the currency board spurred significant financialprogress.

16
Table2

17
MalaysiaandSingapore’sCurrencyBoardsTheStraitsSettlements,Malaya,andMalaysiaThe Strait Settlements were British territories on the Malayan Peninsula consisting of fourindividual settlements: Malacca, Dinding, Penang, and Singapore. Singapore established acurrencyboardin1899.SingaporeancurrencycirculatedinthenearbyBritishprotectoratesonthe Malayan Peninsula and to some extent also on the island of Borneo. In 1938 thoseterritories joinedwithSingaporetocreatetheMalayanCurrencyBoard.AllwereoccupiedbyJapan during World War II. After the war, the British government broke up the StraitsSettlementscolonyin1946.TheMalayanUnionandtheFederationofMalaya,whichreplacedtheMalayanUnion in1948,gatheredallBritish territorieson theMalayanPeninsulaunderasinglegovernment.WithintheFederation,theMalayanstateswereprotectoratesoftheBritishCrown, until they achieved independence within the Commonwealth of Nations in 1957. In1959,Singaporewasgranted full internal self-government.TheCentralBankofMalaysiawasestablished, but it did not undertake activist monetary policy until 1967, when Malaysia,Singapore,andBruneisplittheirformerlyunifiedcurrency.In1963,Singapore,theFederationofMalaya,NorthBorneo, and Sarawakunited to form the independent countryofMalaysia.Malaysia’s previously inconspicuous central bank began tomanagemonetary policy inmoreactivistfashion,whileSingaporeandBruneieachestablishedtheirowncurrencyboards.Becauseoflimitsofdataavailability,weonlyfocuson1949-1967dataforMalaysia,1963-1973data for Singapore and 1963-1971 data for both combined. First, concerning nominal GDPgrowth,wecanseefromChart4thattheearlyyearsfrom1950to1955performancewaspoor.Nominal GDP dropped from around 8 billion to 5 billionMalayan dollars asMalaysia’smaincommodity exports, rubber and tin, experienced a slumpafter theKoreanWar. Besides, thegapbetweenrealandnominalGDPincreasedduring1952-1955,indicatingthelargechangeofinflation inMalaysian. However, GDP started to increase from 1955 onwards. From 1955 to1967, nominal GDP increased by around 54 percent. At the same time, financial indicatorsseemedtoreflectthiseconomicgrowthforsomeyears.AsshowninChart5,theratiosofbankassetstoGDP,M1toGDP,andM2toGDPallincreasesignificantlyfrom1953to1955.(Recallthat these ratios all concern nominal GDP, not real GDP.) Considering the time lag of thefinancialeffectonthewholeeconomy,thisincreaseoffinancialindicatorscouldbetheeffectoftheriseofnominalGDPfrom1955onwards.

18
Chart4
Chart5

19
Unlike the trends of financial indicators in Hong Kong, Malaysia’s financial indicators movetogether.TheratiosofbankcredittoGDPandalldeposittocurrencyhadsimilarmovementsfrom1949to1964,indicatinganinternaldevelopmentofthebankingsystem.TheratiosofM2toGDP,M1toGDP,andbankassetsmovedtogether,reachingarelativelystablegrowthrateafter 1958. These two groups of financial indicators, in fact, could represent two aspects offinancialdeepening.Ontheonehand,theratiosofdeposittocurrencyandbankcredittoGDPreflecttheamountofmoneythatpeopleandinvestorsarewillingtoput inthebankandtheamountofcreditsthatbanksmanagedtolendout,whichrepresentspeople’sconfidenceinthewholeeconomy.Otherratios,ontheotherhand,emphasizetheliquidityofmoney.Ingeneral,corresponding to the steady growthofnominalGDP, financial indicators also increased from1959onwards.Furthermore,asignificantincreasefrom1964to1967fortheratioofdepositsto currencymay be attributable to the formation ofMalaysia in 1963, which by deepeningpoliticalintegrationdeepenedmonetaryintegration.SingaporeSingapore, themost important city in the region, used the Straits dollar between 1845 and1938.ThestatesoftheMalayanpeninsuladidnotissuetheirowncurrencies,butratherusedSingaporean currency. In 1938 the Malayan states established a joint currency board withSingapore to be able to share in Singapore’s profits from currency issue. Singapore joinedMalaysia politically in 1963, complementing its existing monetary integration. However, thepolitical union between Malaysia and Singapore broke down soon, and on August 1965,Singapore became independent. In 1967, Singapore and Brunei split fromMalaysia in theircurrencies also, although the Singapore dollar remained equal to theMalaysian ringgit until1973,whenbothcountriesfloatedtheirexchangerates.(BruneikeptitscurrencyequaltotheSingapore dollar, where it remains today.) Singapore established its own currency board tosucceedtheMalayancurrencyboard.Thecurrencyboardsystemlastedthrough1970.Atthestartof1971,theMonetaryAuthorityofSingapore,abodywithcentralbankingpowers,beganoperations.TheBoardofCommissionersofCurrencySingaporecontinuedtoexistastheissuerof notes and coins, and continued to maintain 100% foreign reserve backing for them, butbecause its liabilities were no longer the sole component of the local monetary base, theSingaporeanmonetary systemas awhole ceased to be a currencyboard system.WepickedyearsbeforeandaftertheindependenceofSingapore,between1963and1973,toanalyzetheinfluenceofthecurrencyboardonSingapore’sfinancialdeepeningandeconomicgrowth.

20
Chart6
AsshowninChart6,nominalGDPgrewsteadilybutslowlyfrom1963to1966,anditstartedtoincrease significantly right after the independence of Singapore. Note that the ratio of alldepositstocurrencyinChart7increasedbyaround47percentatthesametimethatnominalGDP started rising. Besides, the ratios ofM2 to GDP and bank assets to GDP experienced asteeperandalmoststrictlyincreasingslopefrom1966to1969.Aftertheannouncementofitsindependence, Singapore, in fact, suffered from high illiteracy rates as well as a highunemployment rate of around 14 percent. Singapore started to expand and stabilize itseconomymainlythroughindustrialization.Forinstance,bytheendof1969,JurongIndustrialPark,oneoftheearliestindustrialareasinSingapore,costSingapore$45.7milliontosetupfor153 fully-functioning factories with a total of 14.78 square kilometers. With effectivegovernmentpoliciestotackleeconomicproblemsandstimulatefinancialactivities,Singapore’seconomycontinuedtogrowandattractforeigninvestments.AsshowninChart7,theratioofbankcredittoGDPincreasedbyaround30percentfrom1971to1973,aswellastheratioofM2toGDPandM1toGDP.Thesecontinuouslyincreasingtrendsforfinancialindicatorsshowthatfinancialdevelopmentplayedacrucialroleineconomicgrowth.

21
Chart7
SummaryofRatiosundertheCurrencyBoardinSingaporeandMalaysiaWehaveseenthatfinancialindicatorsreflecteconomicdevelopmentandinstitutionalchangesinbothSingaporeandMalaysiaduringtheirperiodofacommoncurrencyboard.Charts8and9showthedevelopmentofvariousfinancialratios.

22
Chart8
Chart9

23
NoticethattheindependenceofSingaporein1966causesasignificantincreaseoftheratioofnotes and coins. Asmentioned above, Singapore started to issue its own coins and notes in1967.Ingeneral,allofthesefinancialratiosraisedsignificantlywitheconomicandthegrowthcontinuedduringtheimplementationofcurrencyboard.
EastAfricanCurrencyBoardTheEastAfricanCurrencyBoard(EACB)wasestablishedinDecember1919asasuccessortothecurrency board of Kenya. The EACB was a joint currency board for Kenya, Uganda andTanganyika (the mainland of present-day Tanzania). Tanzania was originally part of GermanEast Africa, butwas reallocated to British administration by the League of Nations after theGermandefeatinWorldWarI.WhereastheprofitsoftheKenyancurrencyboardbelongedtotheKenyangovernmentalone,theEACBsplititsprofitsamongitsmembers.Zanzibarjoinedin1936, relinquishing its own currency board. During World War II the EACB expanded itsoperationstoSomalia,Ethiopia,andEritreaafterBritishforcesdefeatedItalianforces in1942and1943(EthiopialefttheEACBandstartedissuingitsowncurrencyin1945).TheEACBevenextended across the water to the British colony of Aden (now southern Yemen) for severalyears.However,Kenya,Tanzania,andUgandaremainedthecoremembersoftheboard.TheEACB,likeotherBritishcurrencyboards,operatedasasortofautomaticmoneychanger.ItissuedlegaltenderlocallyondemandagainstpaymentofsterlinginLondonandredeemedthelocalcurrencyondemandbypayingoutsterling(Kratz1966).Itdidnotcontrolthequantityofcurrency in circulation through independent monetary policies, but it was responsible forprintingnotes,mintingcoinsandfixingthedenominationofcoinsandnotes.TheEastAfricancurrencyunit,theshilling,wasequaltotheBritishshilling,whichistosaythatitwas1/20ofapoundsterling.TheEastAfricanpound,awidelyused informalunitofaccount,wasequal tothepoundsterling.TheEACB, likemany20thcenturycurrencyboards inBritishcolonies,wasmodeledontheWestAfricanCurrencyBoard(WACB),whichhadbeenestablishedin1912bythe British. The main purpose of establishing currency boards in colonies was to fix theexchangerateofthecoloniestothemetropoletoeliminateforeignexchangerisk intrade, inadditiontogainingfullcontroloverthemonetarypolicyofthecolonies.Before the implementation of the EACB, the Indian rupeewas themain currency or anchorcurrency of British protectorates and colonies in East Africa. At the outset, the EACB facedmanydifficultiesinitsattempttoreplacetheIndianrupeeand,later,coinsofIndianstandardissuedby theGerman government (Kratz 1966). The former circulated in Kenya andUgandaand the latter in Tanganyika. These coins were replaced because themembers of the EACBwanted to capture the profits from issuing coins. But whereas theWACB had been able torepatriate the British silver coins formerly circulating inWest Africa at their face value, theEACB was not successful in making similar arrangements with the Indian and Germangovernments.ThepriceofsilverwashighduringtheperiodwhentheEACBboughtoldsilver

24
coinsbutthenplunged.TheEACBhadnochoicebuttoselltheretiredcoinsforsterlingattheirbullion value,which resulted in a loss ofmore than 1.75million East African shillings (Kratz1966).Despite initial difficulties in its implementation, the available data suggest that the EACBdidimprovefinancialdevelopmentinEastAfricancolonies.Significantdifferencesintheavailabilityof data across EACB countries make it difficult to compare financial indicators of the threecountriesindividually,thoughforsomeindicatorsaggregatestatisticsexist.Therefore,wewillanalyzeEACBfinancialindicatorsacrossdifferentperiodsofyearsthathavegreatestavailability.We gathered data for coins and notes in circulation for the EACB from 1921 to 1971 andcalculatedtheratioofnotestocoinsasshowninChart10.Althoughourdatacontinueto1971,EACB in fact ended in 1966. After the creation of the currency board system, the ratiowasaround 0.7 and never exceeded 1, indicating that noteswere slightly fewer than coins until1939, when World War II began. Wartime inflation stimulated the demand for notes, thusleadingnotestoincreasetotwotimesmorethancoins.Theamountofnotesincirculationroseaboutfive-foldfrom1943to1947,asChart11shows.AnotherreasonforthedramaticincreaseofnoteswasthetemporaryspreadoftheEACB’sterritorytoformerItaliancolonies.After1947,there was then a postwar pause as Ethiopia, Eritrea, and Italian Somaliland (now southernSomalia)replacedEACBcurrencywithlocalcurrency,reducingthequantityofnotesbyaround18percent.
Chart10

25
However,intheearly1950snotecirculationagainrosesharplyasEastAfricagrewandfinancialdevelopment increased. Also in this period, the EACB gained some discretionary powers. InDecember 1954, the British Secretary of State for the Colonies announced that EACB couldextendcredits toGovernmentof theconstituent territoriesbyholdinggovernmentsecuritieswiththelimitsto£10million.In1957,theregulationwasamendedtoincreasetolimitto£20million, followingwith theauthorizationofacquiringEastAfricanTreasurybills in1959.Notethatthecirculationdroppeddramaticallyin1967whenKenya,Uganda,andTanzaniareplacedtheEACBwithnationalcentralbanksissuingseparatenationalcurrencies.
Chart11
Notonlydid the implementationof the currencyboardenhance the circulationof coins andnotes,but it stimulatedorat leastallowed thegrowthof savingsdeposits.Charts12and13showthatsavingsbankdepositsinallthreecountriesshowasimilarupwardtrendduringthecurrency board period. Chart 12 shows that all rose in the late 1920s, slowed or stagnatedduring the Great Depression, then resumed growth. In Chart 13, savings deposit grew until1955.Thisemergingdiversityofassetformsmayhaveencouragedinvestorsandsaverstoputmoneyinotherinvestmentswithrelativelyhighreturns,thusslightlydecreasingthevolumeofsavingdepositsafter1955.

26
Chart12
Chart13

27
ConclusionThispaperhasinvestigatedfinancialdeepeningandeconomicgrowthinthreecurrencyboardsystems: Hong Kong, Singapore /Malaysia, and East African. The novelty of this paper is itscollectionofthecurrencyboards’financialdataaswellastheircorrespondingratiocalculations,whichweredigitizedandanalyzedsystematicallyforthefirsttime.Weconcludethatthereisanincrease in financial deepening along with the economic growth during the years of theadoption of each currency board system analyzed. Financial deepening can bring importantbenefits to emergingmarket economies. Currency board systems seem to help stabilize theeconomyandspurimprovementofbothmonetaryandfinancialsystems.Atleast,uptoapointthey do: our empirical analysis of Hong Kong,which had by far themost advanced financialsystem of those studied here, shows an ambiguous causal relationship between financialdevelopment and economic growth. Further studies could be carried out by controlling theeffects of a currencyboard to compare their financial growth to countries that didnothavecurrencyboardsystems.

28
ReferencesBankofUganda.(2017).“TheEastAfricanCurrencyBoard.”BankofUgandaWebsite.https://www.bou.or.ug/opencms/bou/services/museum/East_african_currency_board.htmlBagehot,Walter.(1873).LombardStreet:ADescriptionoftheMoneyMarket.http://www.econlib.org/library/Bagehot/bagLom.htmlChiu,Priscilla.(n.d).“HongKong’sExperienceinOperatingtheCurrencyBoardSystem.”https://www.imf.org/external/pubs/ft/seminar/2001/err/eng/chiu.pdfGeorge,Josephine.(2016).“TheMalayanCurrencyBoard.”JohnsHopkinsUniversity,InstituteforAppliedEconomics,GlobalHealth,andtheStudyofBusinessEnterprise,StudiesinAppliedEconomicsWorkingPaperNo.53,March.http://krieger.jhu.edu/iae/economics/Malayan_Currency_Board_George_paper.pdfGlobalFinancialData.Athttps://www.globalfinancialdata.com/,accessedMay3,2017.GreatBritain.BoardofTrade.1865-1967.StatisticalAbstractoftheBritishEmpire(titlevaries).London:H.M.StationeryOffice.Gross, Thomas, Joshua Heft, and Douglas A. Rodgers. (2012/2013) “On Currency Boards: AnUpdated Bibliography of Scholarly Writings.” Johns Hopkins University Institute for AppliedEconomics,GlobalHealth,andtheStudyofBusinessEnterprise,Studies inAppliedEconomicsno. 1. http://sites.krieger.jhu.edu/iae/files/2017/04/Rodgers-et-al-bibliography-June-2013-Final.pdfHanke,SteveH.andChristopherL.CulpwithaPrefacebyJohnGreenwood.(2013).“TheHongKongLinkedRateMechanism:MonetaryLessonsforEconomicDevelopment.”JohnsHopkinsUniversity,InstituteforAppliedEconomics,GlobalHealth,andtheStudyofBusinessEnterprise,StudiesinAppliedEconomicsWorkingPaperNo.6,June.http://krieger.jhu.edu/iae/economics/The%20Hong%20Kong%20Working%20Paper%20Final.pdfHanke,SteveH.andCharlesBushnell.(2016).“VenezuelaEnterstheRecordBook:The57thEntryintheHanke-KrusWorldHyperinflationTable.”JohnsHopkinsUniversity,InstituteforAppliedEconomics,GlobalHealth,andtheStudyofBusinessEnterprise,StudiesinAppliedEconomicsWorkingPaperNo.69,December.http://krieger.jhu.edu/iae/economics/Venezuela_Enters_the_Record_Book.pdf

29
Hanke,SteveH.andKurtSchuler.(2015[1994]).CurrencyBoardsforDevelopingCountries:AHandbook.OriginaleditionSanFrancisco:ICSPress.http://krieger.jhu.edu/iae/books/Currency_Boards_for_Developing_Countries.pdfHistoricalFinancialStatistics.(Dataset,CenterforFinancialStability,NewYork).http://www.centerforfinancialstability.org/hfs.phpInternationalMonetaryFund.InternationalFinancialStatisticsdatabase.Athttps://www.imf.org/en/Data,accessedApril1,2017.InternationalHistoricalStatisticsdatabase.DigitizedversionofpapervolumesbyBrianR.Mitchell.NewYork:PalgraveMacmillan.King,RobertG.andRossLevine.(1993).“FinanceandGrowth:SchumpeterMightbeRight,”pp.720,721.Kratz,JoachimW.(1966).“TheEastAfricanCurrencyBoard.”InternationalMonetaryFundStaffPapers,Vol.13,No.2(July),pp.229-255.http://www.jstor.org/stable/3866425.Krus,NicholasandKurtSchuler.(2014).“CurrencyBoardFinancialStatements.”JohnsHopkinsUniversity,InstituteforAppliedEconomics,GlobalHealth,andtheStudyofBusinessEnterprise,StudiesinAppliedEconomicsWorkingPaperNo.22,December.http://krieger.jhu.edu/iae/economics/KrusSchuler_Currency_Board_Financial_Statements_2014.12.21.pdfLucas,RobertE.Jr.(1988).“OntheMechanicsofEconomicDevelopment.”JournalofMonetaryEconomics,Vol.22,pp.3-42.https://www.parisschoolofeconomics.eu/docs/darcillon-thibault/lucasmechanicseconomicgrowth.pdfLevine,RossandSaraZervos.(1998).“StockMarkets,Banks,andEconomicGrowth,”pp.538-539.http://faculty.chicagobooth.edu/luigi.zingales/papers/research/findepgrow.pdfMaddison,Angus.(2009).“HistoricalStatisticsoftheWorldEconomy:1-2008AD,”Excelfile.Athttp://www.ggdc.net/maddison/oriindex.htmMcKinnon,RonaldI.(1974).“MoneyandCapitalinEconomicDevelopment.”AmericanPoliticalScienceReview,Vol.68,No.4,pp.1822-1824.https://repositories.lib.utexas.edu/bitstream/handle/2152/24155/Rostow_WW_1974.pdf?sequence=1

30
Sahay,Ratna,MartinČihák,PapaN’Diaye,AdolfoBarajas,RanBi,DianaAyala,YuanGao,AnnetteKyobe,LamNguyen,ChristianSaborowski,KatsiarynaSvirydzenka,andSeyedRezaYousefi.(2015).“RethinkingFinancialDeeping:StabilityandGrowthinEmergingMarket.”IMFStaffDiscussionNote.https://www.imf.org/external/pubs/ft/sdn/2015/sdn1508.pdfSchumpeter,JosephA.(1912).TheTheoryofEconomicDevelopment:AnInquiryintoProfits,Capital,Credit,Interest,andtheBusinessCycle.Cambridge:HarvardEconomicStudies.http://www.hup.harvard.edu/catalog.php?isbn=9780674879904WorldBank.Dataportal.http://data.worldbank.org/,accessedApril1,2017.