site survey cores - deep sea drilling
TRANSCRIPT

9. SEDIMENTATION IN THE VICINITY OF LEG 92 DRILL SITES: STUDIES OFSITE SURVEY CORES1
Margaret Leinen and Amy Graybeal, Graduate School of Oceanography,The University of Rhode Island, Narragansett2
ABSTRACT
Surveys of the areas surrounding the sites drilled on the Leg 92 19°S transect showed that sedimentation at all exceptthe oldest site is dominated by calcium carbonate deposition. The sediments in the area of the oldest site, west of theAustral Fracture Zone, are being deposited beneath the calcium carbonate compensation depth and are dominated byterrigenous and metal-rich hydrogenous and hydrothermal sediments. The noncarbonate sediments in all of the areaseast of the Austral Fracture Zone are dominated by hydrothermal sediment similar in composition to that presently be-ing deposited at the East Pacific Rise. Although no biogenic microfossils were present in smear slides of the sediment,geochemical partitioning suggests that a remnant signal of siliceous biogenic deposition may be preserved, especially ingravity core (GC) 8, which was collected from a high heat flow zone near Site 600. The siliceous sediment may also re-sult from the deposition of amorphous hydrothermal silica from the higher concentrations of pore water SiO2 charac-teristic of the upwelling waters. Sedimentation on the broad plateaus that characterize each area is quite uniform andsuggests that sites on these plateaus will be broadly representative of pelagic sedimentation in the area.
INTRODUCTION
Four areas forming a transect to the west of the EastPacific Rise (EPR) at 19°S (Fig. 1) were surveyed beforeLeg 92 to determine whether ridge flank hydrothermalprocesses are presently active at the sites and whetherthese processes have influenced the sites in the past. Inaddition, the surveys provided information for a geo-physical, geochemical, and sedimentological frameworkfor the Leg 92 drill sites. Sediment cores were collectedat each of the four surveyed sites (Table 1) to look forchemical precipitates from present or past hydrothermalactivity, to determine whether there have been changesin the rates at which such phases accumulated, and toevaluate the uniformity of regional patterns of sedimen-tation.
The criteria used to choose the areas to be surveyedwere relatively smooth topography and uniform sedimentcover with little rock outcrop, characteristics thought nec-essary for ridge flank hydrothermal advection throughsediments instead of at outcrops. The transect was placedat 19°S because the region is one of low biological pro-ductivity, where hydrothermal material in the sedimentsis not reduced or remobilized by organic diagenesis (Ben-der et al., in press). In addition, areas were chosen thatshowed minimal evidence of redeposition. The sites onthe 19°S transect formed at one of the fastest-spreadingportions of the EPR. It has been proposed that the in-tensity of hydrothermal activity and the accumulationof hydrothermal phases is directly related to spreadingrate (Boström et al., 1973; Boström, 1974). If so, thesites should have been subjected to intense ridge crest
Leinen, M., Rea, D. K., et al., Init. Repts. DSDP, 92: Washington (U.S. Govt. Print-ing Office),.
2 Address: Graduate School of Oceanography, The University of Rhode Island, Narra-gansett, RI 02882-1197.
hydrothermal activity and should have high accumula-tion rates of hydrothermal sediment.
Specific coring targets within each area were chosenafter Seabeam swath mapping (Lonsdale, this volume)and multipenetration heat flow surveys (Hobart et al.,1982). The cores represent most depositional environ-ments in each surveyed area and span the range of heatflow indicated by the surveys. Because the main dredgewinch failed during the survey, all cores were gravity coresrather than piston cores.
METHODSThe calcium carbonate content of freeze-dried samples was deter-
mined by using a carbonate pressure bomb method similar to thatused routinely for analysis on the Glomar Challenger. The results list-ed (Table 2) are the average of two determinations. The precision ofthe pressure bomb analyses is roughly ± 2 wt.% CaCO3 (Dunn, 1980).The carbonate contents measured by the bomb are diluted by sea saltfrom interstitial waters. Therefore, all carbonate contents listed in Ta-ble 2 were corrected and are reported on a salt-free basis.
Salt contents of samples (Table 3) were determined to correct geo-chemical data for dilution by sea salt. Freeze-dried samples wereweighed and resuspended in 5 ml of deionized water to dissolve saltfrom interstitial waters. After the suspension was centrifuged to re-move the sediment, the chloride content of the salt solution was deter-mined by AgCl titration using an automated chloridometer. Sea saltcontents were calculated from the chlorinity of the solution by assum-ing that salinity = 1.80655 × chlorinity. Duplicate determinations in-dicated a precision of ±5% of measured value or generally about±0.4 wt.% salt. Water contents for the sediments (Table 3) were cal-culated from the dry and wet weight of sediment samples in fixed-vol-ume plastic sampling tubes.
Sediments chosen for chemical analysis were prepared by a proce-dure modified from Bernas (1968). Samples were freeze dried (in orderto obtain a fine powder without grinding dried sample), dissolved inHF and aqua regia in Teflon-lined pressure bombs, and neutralizedwith boric acid. The samples were analyzed for Mg, Al, Si, Ca, Mn,Fe, Cu, Zn, and Ba by flame atomic absorption spectroscopy (AAS)and for Co and Ni by flameless AAS. The precision of duplicate deter-minations averaged ±2 to ±5% of measured values for major ele-ments and ± 5 to ± 10% of measured values for trace elements. Com-parison of our analyses with U.S. Geological Survey rock standardsAGV-1 and GSP-1 indicates that systematic errors are not present.
237

M. LEINEN, A. GRAYBEAL
15°N
15C
30°S
o
150° 135° 120° 105° 90° 75°W
Figure 1. Location of areas surveyed by Ariadne II (squares), Site 598 (circle), and Hole 504B (triangle).
Table 1. Ariadne II core locations.
Core
Area I
Latitude(S)
Longitude(W)
Waterdepth(m)
Length(cm)
GC 1
Area II
GC2GC 3GC4GC5GC6
Area III
GC7GC8GC9GC 10GC 11
Area IV
GC 12GC 13GC 14GC 15GC 16
18°48.60'
19°25.23'19°26.07'
19°25.02'
19°24.29'19°23.54'
18°55.68'18°55.64'
18°55.73'18°58.65'
18°55.71'
19°29.65'
19°29.77'
19°29.85'
19°29.68'
19°29.73'
129°
119C
119°
119°
119°
119°
116°
116°
116°
116°
116°
114°
114°
114°
114°
114°
44.86'
49.58'51.65'
48.18'
52.65'
48.33'
50.56'
50.45'
51.74'
51.36'
50.47'
57.22'
57.64'
56.62'
58.91'
58.19'
4130
36543670
3570
3680
3600
3450
3350
34303310
3370
3280
3435
3390
3300
3300
181
116
12374165
303228312323311
91124281324374
GEOLOGIC SETTING OF SEDIMENTS FROMSITE SURVEY AREAS
Area I (Site 597)
Area I (Fig. 2), on 28.6-Ma crust (Rea, this volume),was the oldest area surveyed, and Site 597 was drilledwithin it. The crust was generated at the fossil MendozaRise and is in a region of moderate heat flow. Air gunand Seabeam surveys of the area showed sediment-drapedabyssal hills with less than 100 m of bathymetric relief.The area chosen for detailed heat flow and pore water
surveys had so little relief (20 to 40 m) that it was notsurveyed completely using Seabeam. The first core fromthe area, Ariadne II gravity core (GC) 1, consisted en-tirely of unfossiliferous brown clay. No further cores weretaken in the area because (1) the heat flow was very uni-form, (2) none of the heat flow or pore water data fromthe site survey showed any evidence of fluid advection(Hobart et al., 1982), and (3) the air gun lines showedacoustically transparent sediment of nearly uniform thick-ness over the 5-by-7-km area surveyed (Lonsdale, thisvolume).
Area II (Site 599)
Area II was surveyed with Seabeam (Fig. 3). The 7.8-Ma area (Rea, this volume) is bounded on the east by asouthward-plunging abyssal-hill ridge with about 150 mof relief and on the west by a basin with a NE-SW trend.Between the ridge and the basin is a broad (8-km) flatarea with < 40 m of relief. Multipenetration heat flowsurveys showed that the area has moderate heat flow withno evidence of the vertical advection of pore fluids orpresent-day hydrothermal activity. Four cores were re-covered, Ariadne II GC 2 and GC 4 to 6 (Fig. 3). Allcores were mixtures of nannofossil ooze and brown clay.The pore water data (Bender et al., in press) show no ev-idence of reducing conditions due to organic diagenesis.
Area III (Sites 600 to 602)
Area III, which is located on 4.6-Ma crust (Fig. 4),also consists of a relatively flat, sediment-covered pla-teau with < 40 m of relief. The area is bounded on theeast by a plunging abyssal-hill ridge and on the west by avalley. The plateau is roughly 6 km wide and has fairlyuniform heat flow and sediment cover. The site surveyfound no evidence of fluid advection on the plateau.There was, however, heat flow and pore water evidencefor hydrothermal fluid advection in the thin sediment(< 10 m) at the north end of the abyssal-hill ridge, where
238
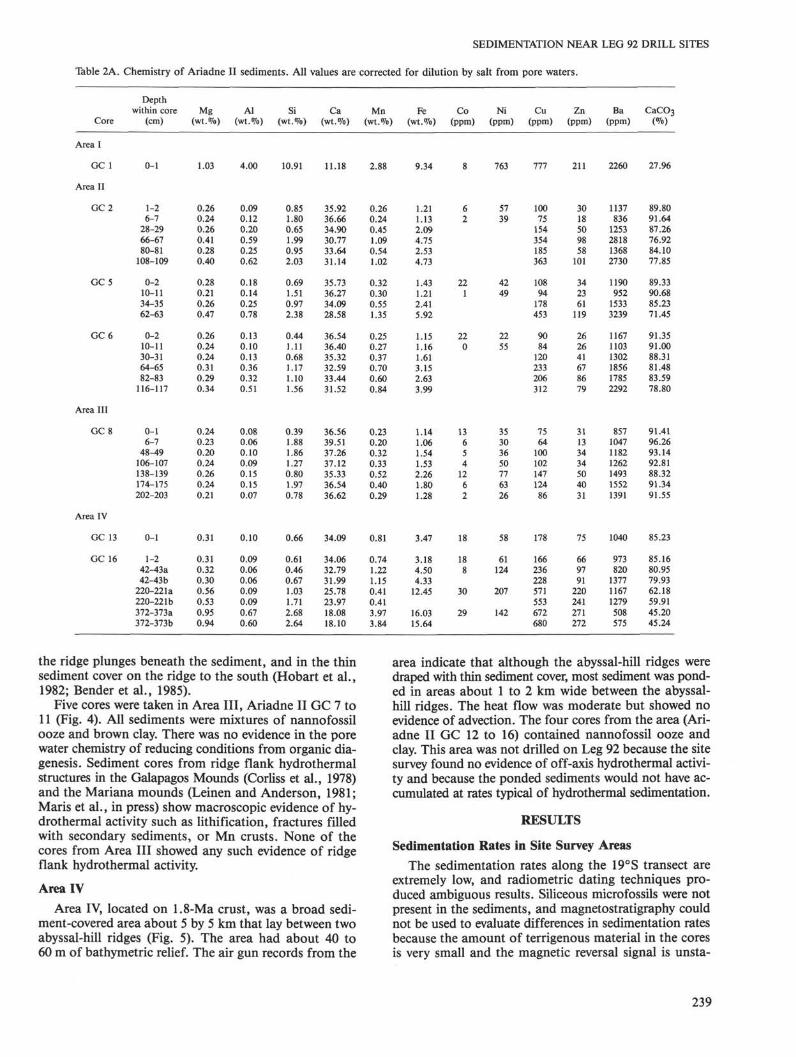
SEDIMENTATION NEAR LEG 92 DRILL SITES
Table 2A. Chemistry of Ariadne II sediments. All values are corrected for dilution by salt from pore waters.
Core
Area I
GC 1
Area II
G C 2
G C 5
G C 6
Area III
G C 8
Area IV
GC 13
GC 16
Depthwithin core
(cm)
0-1
1-26-7
28-2966-6780-81
108-109
0-210-1134-3562-63
0-210-1130-3164-6582-83
116-117
0-16-7
48-49106-107138-139174-175202-203
0-1
1-242-43a42-43b
220-221a220-221b372-373a372-373b
Mg(wt.<yo)
1.03
0.260.240.260.410.280.40
0.280.210.260.47
0.260.240.240.310.290.34
0.240.230.200.240.260.240.21
0.31
0.310.320.300.560.530.950.94
Al(wt.%)
4.00
0.090.120.200.590.250.62
0.180.140.250.78
0.130.100.130.360.320.51
0.080.060.100.090.150.150.07
0.10
0.090.060.060.090.090.670.60
Si(wt.%)
10.91
0.851.800.651.990.952.03
0.691.510.972.38
0.441.110.681.171.101.56
0.391.881.861.270.801.970.78
0.66
0.610.460.671.031.712.682.64
Ca(wt.%)
11.18
35.9236.6634.9030.7733.6431.14
35.7336.2734.0928.58
36.5436.4035.3232.5933.4431.52
36.5639.5137.2637.1235.3336.5436.62
34.09
34.0632.7931.9925.7823.9718.0818.10
Mn(wt.<‰)
2.88
0.260.240.451.090.541.02
0.320.300.551.35
0.250.270.370.700.600.84
0.230.200.320.330.520.400.29
0.81
0.741.221.150.410.413.973.84
Fe(wt.%)
9.34
1.211.132.094.752.534.73
1.431.212.415.92
1.151.161.613.152.633.99
1.141.061.541.532.261.801.28
3.47
3.184.504.33
12.45
16.0315.64
Co(ppm)
8
62
221
220
13654
1262
18
188
30
29
Ni(ppm)
763
5739
4249
2255
35303650776326
58
61124
207
142
Cu(ppm)
111
10075
154354185363
10894
178453
9084
120233206312
7564
10010214712486
178
166236228571553672680
Zn(ppm)
211
3018509858
101
342361
119
262641678679
31133434504031
75
669791
220241271272
Ba(ppm)
2260
1137836
1253281813682730
1190952
15333239
116711031302185617852292
857104711821262149315521391
1040
973820
137711671279508575
CaCO3
(%)
27.96
89.8091.6487.2676.9284.1077.85
89.3390.6885.2371.45
91.3591.0088.3181.4883.5978.80
91.4196.2693.1492.8188.3291.3491.55
85.23
85.1680.9579.9362.1859.9145.2045.24
the ridge plunges beneath the sediment, and in the thinsediment cover on the ridge to the south (Hobart et al.,1982; Bender et al., 1985).
Five cores were taken in Area III, Ariadne II GC 7 to11 (Fig. 4). All sediments were mixtures of nannofossilooze and brown clay. There was no evidence in the porewater chemistry of reducing conditions from organic dia-genesis. Sediment cores from ridge flank hydrothermalstructures in the Galapagos Mounds (Corliss et al., 1978)and the Mariana mounds (Leinen and Anderson, 1981;Maris et al., in press) show macroscopic evidence of hy-drothermal activity such as lithification, fractures filledwith secondary sediments, or Mn crusts. None of thecores from Area III showed any such evidence of ridgeflank hydrothermal activity.
Area IV
Area IV, located on 1.8-Ma crust, was a broad sedi-ment-covered area about 5 by 5 km that lay between twoabyssal-hill ridges (Fig. 5). The area had about 40 to60 m of bathymetric relief. The air gun records from the
area indicate that although the abyssal-hill ridges weredraped with thin sediment cover, most sediment was pond-ed in areas about 1 to 2 km wide between the abyssal-hill ridges. The heat flow was moderate but showed noevidence of advection. The four cores from the area (Ari-adne II GC 12 to 16) contained nannofossil ooze andclay. This area was not drilled on Leg 92 because the sitesurvey found no evidence of off-axis hydrothermal activi-ty and because the ponded sediments would not have ac-cumulated at rates typical of hydrothermal sedimentation.
RESULTS
Sedimentation Rates in Site Survey Areas
The sedimentation rates along the 19°S transect areextremely low, and radiometric dating techniques pro-duced ambiguous results. Siliceous microfossils were notpresent in the sediments, and magnetostratigraphy couldnot be used to evaluate differences in sedimentation ratesbecause the amount of terrigenous material in the coresis very small and the magnetic reversal signal is unsta-
239

M. LEINEN, A. GRAYBEAL
Table 2B. Chemistry of Ariadne II sediments. All values are corrected for dilution by salt from pore waters andare carbonate free.
Core
Area I
GC 1
Area II
GC2
GC5
GC6
Area III
GC8
Area IV
GC 13
GC 16
Depthwithin core
(cm)
0-1
1-26-7
28-2966-6780-81
108-109
0-210-1134-3562-63
0-210-1130-3164-6582-83
116-117
0-16-7
48-49106-107138-139174-175202-203
0-1
1-242-43a42-43b
220-221220-221372-373372-373
Mg(wt.%)
1.42
2.552.872.041.781.761.81
2.622.251.761.65
3.012.672.051.671.771.60
2.796.152.923.342.232.772.49
2.10
2.091.681.491.481.321.731.72
Al(wt.%)
5.56
0.881.441.572.561.572.80
1.691.501.692.73
1.501.111.111.941.952.41
0.931.601.461.251.281.730.83
0.68
0.610.310.300.240.221.221.10
Si(wt.%)
15.14
8.3321.53
5.108.625.979.16
6.4716.206.578.34
5.0912.335.826.326.707.36
4.5450.2727.1117.666.85
22.759.23
4.47
4.112.413.342.724.274.894.82
Mn(wt.%)
3.99
2.552.873.534.723.404.60
3.003.223.724.73
2.893.003.173.783.663.96
2.685.354.664.594.454.623.43
5.48
4.996.405.731.081.027.247.01
Fe(wt.%)
12.97
11.8613.5216.4120.5815.9121.35
13.4012.9816.3220.74
13.2912.8913.7717.0116.0318.82
13.2728.3422.4521.2819.3520.7915.15
23.49
21.4323.6221.5732.92
29.2528.56
Co(ppm)
11
5924
20611
1511607356
1036924
122
12142
79
53
Ni(ppm)
1059
559467
394526
254611
407802525695659111308
393
411651
547
259
Cu(ppm)
1079
980897
1209153411641639
1012100912051587
1040933
1027125812551472
873171114581419125914321018
1205
1119123911361510137912261242
Zn(ppm)
293
294215392425365456
319247413417
301289351362524373
361348496473428462367
508
445509453582601495497
Ba(wt.%)
0.31
1.111.000.981.220.861.23
1.121.021.041.13
1.351.231.111.001.091.08
1.002.801.721.761.281.791.65
0.70
0.660.430.690.310.320.090.11
ble. Nannofossils were present, and the nannofossil bio-stratigraphy (Table 4), combined with calcium carbonatecorrelations (Leinen, this volume), provides the only agecontrol for the gravity cores. This stratigraphy indicatesthat the Pleistocene/Pliocene boundary lies between 1.0m and 1.5 m in the Area II cores, between 1.5 m and2.0 m in the Area III cores, and between 2.5 m and3.0 m in the Area IV cores. These boundaries are con-sistent with the positions of the Pleistocene/Plioceneboundaries at the drilled sites. The biostratigraphy sug-gests a Pleistocene sedimentation rate of 0.7 cm/103 yr.in Area II, 1.0 cm/103 yr. in Area III, and 1.5 cm/103 yr.in Area IV.
A primary concern in any survey for drilling sites inpelagic sediments is the degree to which the sedimentsand sedimentation rates from a single drill site are repre-sentative of the area surrounding the drill site. Becausethe site survey cores were short and the sedimentationrates in the area were very low, our studies could notprovide long, detailed records of sedimentation in the
areas. Instead, we focused on the degree to which thefine-scale variations in sedimentation (i.e., 0.1 to 1 m)could be correlated across the areas. Systematic varia-tions in the concentration of calcium carbonate in Pleis-tocene and Pliocene sediments in the equatorial and sub-tropical Pacific result from basin-wide changes in theamount of dissolution of carbonate (e.g., Berger, 1973;Broecker and Broecker, 1974). The sedimentation in AreasII to IV is dominated by calcium carbonate, and in spiteof the low sedimentation rates the calcium carbonate rec-ord can be correlated with equatorial Pacific records ofcarbonate variation (Leinen, this volume). Therefore, cor-relation of the variations in percent calcium carbonatein cores from each area provides a useful index of theuniformity of sedimentation.
Figure 6 shows the calcium carbonate contents of threecores from Area II plotted on a common depth scale.The carbonate contents of the sediments were analyzedat 2-cm intervals and show considerable fine-scale vari-ation. Cores GC 5 and GC 6 were analyzed at sea and
240

SEDIMENTATION NEAR LEG 92 DRILL SITES
Table 3. Salt and water contents of site surveycore samples used for geochemical analysis.
Core
Area I
GC 1
Area II
G C 2
G C 5
G C 6
Area III
G C 8
Area IV
GC 13
GC 16
Depthwithin core
(cm)
0-1
1-26-7
28-2966-6780-81
108-109
0-210-1134-3562-63
0-210-1130-3164-6582-83
116-117
0-16-7
48-49106-107138-139174-175202-203
0-1
1-2142-143220-221372-373
Water(%)
52.5649.6246.6450.6746.3247.59
55.950.947.852.7
54.249.348.144.746.242.2
52.652.848.646.448.648.543.9
50.7
48.546.664.2
Dry-bulkdensity(g/cm3)
0.7520.8220.8100.6860.8380.692
0.6600.7470.7600.736
0.6260.8000.8760.8751.0090.790
0.6320.7490.8130.7890.7390.7210.873
0.837
0.4090.7560.8650.452
Salt(%)
5.95
3.813.593.213.693.133.20
4.213.322.753.55
4.363.272.973.003.262.94
3.683.312.852.902.813.002.64
3.113.455.43
have considerably higher variance, which is probably dueto larger errors in weight determination at sea than inour shore laboratory. It is clear, however, that the pri-mary feature of the carbonate curves (the drop in Ca-CO3 concentration from roughly 90 to 70 wt.%) occursat the same depth in all of the cores (± 2 cm). The coresspan the water depth range of the broad plateau in AreaII and include a core close to the abyssal-hill ridge at theeastern margin of the area. In spite of the 80-m waterdepth difference between the shallowest and deepest core,and the proximity to potential sources of redepositedsediments, the main features of the CaCO3 profiles arevery similar. Although this similarity obviously cannotbe extrapolated to the entire sediment column, it doesindicate that pelagic sediment deposition on the plateauhas been very uniform during the Pleistocene and Plio-cene. Combined with the rather uniform sediment thick-ness and continuity of air gun reflectors, the data sug-gest that any site on the plateau in Area II would be rep-resentative of pelagic sedimentation in the area.
Although sedimentation on the plateaus between abys-sal-hill ridges on the transect may be uniform, a com-
parison of the nannofossil biostratigraphy for Sites 600,601, and 602 in Area III indicates that there are largedifferences in sedimentation rate between sites in differ-ent settings: sedimentation rates on the abyssal-hill ridgein Area III (Site 600) were roughly half those on the pla-teau (Site 601).
Physical Properties of Ariadne II Sediments
The water contents and dry-bulk densities of the sitesurvey cores were analyzed in detail to determine wheth-er they were related to or affected by fluid advectionthrough the sediments. The dry-bulk densities of unlith-ified deep-sea sediments are often a function of the cal-cium carbonate content (Mayer, 1970; Dymond and Veeh,1975; Lyle and Dymond, 1976). This relationship existsbecause the density of calcium carbonate (p = 2.72 g/cm3) is much greater than that of clay (about 2.5 g/cm3)and amorphous silica (about 2.2 g/cm3). High water con-tent in calcareous deep-sea sediments has also been re-lated to high carbonate content (Mayer, 1980). In theAriadne II cores, however, we found that the bulk densi-ties and water contents were directly related to carbon-ate content only when the range of carbonate variationwas very large (e.g., Fig. 7A). Cores with lower rangesshowed a substantially weaker correlation between bulkdensity and carbonate content and between water con-tent and carbonate content (e.g., Fig. 7B). The correla-tion is probably weak because the noncarbonate frac-tion is dominated by detrital and hydrothermal phasesthat have densities close to the density of the calciumcarbonate.
Previous studies have related anomalous sediment phys-ical properties to alteration by hydrothermal circulation.For example, sediments from high heat flow areas in theGalapagos Mounds hydrothermal field showed anoma-lously high porosity and density gradients (Karato andBecker, 1983), and sediments from high heat flow zonesin the Mariana Mounds hydrothermal field had very lowwater contents and showed evidence of cementation (Lei-nen and Anderson, 1981; Maris et al., 1985). Core GC 8in Area III was taken at the location of a heat flow mea-surement of 753 mW/m2. Both the corer and the heatflow probe were deployed with a relay transponder, andtheir locations within the transponder navigation net forArea III are identical within the accuracy of navigation(±10 m). The core showed no consistent relationshipbetween water content, density, and sedimentologicalproperties like calcium carbonate content (Fig. 7B), butother cores from normal heat flow regions in the samearea also showed no consistent relationship betweenphysical and sedimentological properties. Thus, thephysical properties of the sediments provide no corrobo-rative evidence for hydrothermal circulation through thesediments in Area III.
Chemistry of Ariadne II Sediments
Previous studies have shown that central South Pacif-ic surface sediments are an intimate mixture of detrital,biogenic, hydrogenous, and hydrothermal phases (e.g.,Boström et al., 1973; Heath and Dymond, 1977; Dy-mond, 1981; Heath and Dymond, 1981). Leinen and Pi-
241

M. LEINEN, A. GRAYBEAL
CΛΛΛ
DUUU
4000
2000
0
1000
129°47'
-
-
-
A
_
LHF 1
1 29°46'1 1
59
OHARP 1
Site 597
HF4/2A82
HF4/1A118
• Red
I
HF4/4A A H F
HF4/377
1 29°45'W
#
DHYD 1
HF 4/6 A
714/5
A HF 3/4
A H F 3/3A HF 3/2
A HF 3/1
1
-
Green
Heat flow
(mW/m2)49 ~
HF 4/9AH F 4 / 8 A 5 7
AHF 4/752
-
DGC 1
_
18°46'S
18°47'
1 8°48'
1 8°49'
-1000 1000 2000X transponder coordinate
3000
Figure 2. Location of heat flow (HF) and coring stations in Area I surveyed by Ariadne II. Triangles aremultipenetration heat flow stations (designations are the heat flow run followed by the measurementnumber; e.g., 3/4). GC = gravity core location, HARP = pore water harpoon, HYD = hydrocast.Transponder locations are designated by color. Numbers next to stations are heat flow values in mW/m2. Values along transponder coordinate axes are in meters.
sias (1984) and Leinen (in press) have demonstrated thatmultivariate factor analysis can be used to determine thenumber and chemical composition of the sediment end-members in such sediments. Dymond (1981) and Leinenand Pisias (1984) have also demonstrated that linear pro-gramming can be used to optimize the partitioning ofthe sediment into the end-members indicated by the fac-tor analysis. To analyze the bulk-sediment chemistry, asuite of samples from the Ariadne II cores were subject-ed to a modified Q-mode factor analysis (Leinen andPisias, 1984). This analysis indicated that four factors
accounted for 97% of the sums of squares in the data.The factor scores (Table 5) show the relative importanceof the variance of each variable in each end-member,and the rotated composition vectors (Table 5) for eachof the end-members show the chemical compositions ofthe end-members.
Both the factor scores and rotated composition vec-tors suggest that factor 1 is dominated by Fe- and Mn-oxides. Both Zn and (to a lesser extent) Cu are also im-portant in explaining the variance associated with thisvector, although the concentrations of these substances
242

11 9°54' 11 9°52
SEDIMENTATION NEAR LEG 92 DRILL SITES
119°50' 119°48'W
6000 -
23'S
4000 -1
aj 2000 i
-2000 19°27•
-8000 - 6000 -4000 -2000 0X transponder coordinate
2000 4000 6000
Figure 3. Location of heat flow and coring stations in Area II surveyed by Ariadne II. Contours are based on the Seabeam swath mapping. Coveragewas incomplete, and areas between Seabeam swaths are indicated with dashed contours. Contour interval is 20 m. Other details as for Fig. 1.
are lower than those of Fe and Mn. The compositionvector contains no SiO2 and little A12O3, and the vari-ance vector shows an inverse relationship between thetransition elements and SiO2 in the factor. Although SiO2is common in hydrothermal vent fluids (Edmond et al.,1979; von Damm and Edmond, 1982), previous studiesshow that little of this silica is present in the metallifer-ous hydrothermal sediments deposited near the East Pa-cific Rise or in metalliferous hydrothermal sediment trans-ported through the water column and deposited at greaterdistances from the ridge axis (Heath and Dymond, 1977;Dymond, 1981; Leinen and Pisias, 1984). Thus, thesecomposition and variance associations suggest that thefactor represents transported hydrothermal sediment. Theconcentration of the factor is highest in sediments fromArea IV (Table 6), close to the East Pacific Rise. TheFe/Mn ratio of the factor composition is 3.8, however,somewhat larger than that of typical hydrothermal sedi-ment from the East Pacific Rise (Boström et al., 1973;Heath and Dymond, 1977; Dymond, 1981; McMurtryet al., 1981).
Factor 2 is dominated by the variances of SiO2, BaO,and MgO. In other samples from the southeastern Pa-cific, Dymond (1981) and Leinen and Pisias (1984) foundthat this element association was characteristic of sili-ceous biogenic sediment and dissolving siliceous debris.No siliceous microfossils were found in the Ariadne II
sediments, however, so if the silica in this factor is bio-genic it must have been incorporated into other phasesby postdepositional processes. This supposition is rea-sonable, since previous studies of the diagenesis of hy-drothermal sediments in regions of low sedimentationrate (Dymond and Eklund, 1978; Heath and Dymond,1977) suggest that the dissolving biogenic silica in suchsediments contributes silica for the formation of iron-rich authigenic smectites. The composition vectors indi-cate relatively high concentrations of Fe2O3 (24%) andMnO2 (5%) in this factor, and the overall composition issimilar to authigenic smectites from the North Pacific(Hein et al., 1979). This factor is most important in sam-ples from the upper few centimeters in cores from AreasII and III, and it dominates sediments from Core GC 8,which was taken in the high heat flow zone of Area III.The silica represented by this factor, because of its lackof association with the hydrothermal component in thefirst factor, is not likely to represent transported hydro-thermal material. It may represent Si-rich hydrothermalcontributions from ridge flank hydrothermal advection.
Factor 3 is dominated by the variances of CoO andA12O3. In composition it is rich in Fe2O3, A12O3, MgO,and BaO. It is generally abundant in the surface sam-ples from all of the areas and depleted in the sedimentsimmediately below the surface. Its highest concentrationsare from Area II (Cores GC 2, GC 5, and GC 6). The
243

M. LEINEN, A. GRAYBEAL
116°54 16°52' 1 16°50'W
6000
4000
I 2000
-2000
-4000
-6000
e>HARP 16
.HF 21/1: 21/2A O Site 602
5 / M iA 2 1 / 3 A 2 1 / 4 O 1 / ß
O*3^ ' J | \ 2 1 / 5 5 4
:wm 20/5 A1 5 9
20/7 A1 7 6
Green 20/8 AA ×^-219 20/9
OHARP 10 Λ ' 117
Site 6 0 0 ^HARP
18°54'S
18°56'
18°58
-6000 - 4000 -2000 0X transponder coordinate
2000
Figure 4. Location of heat flow and coring stations in Area III surveyed by Ariadne II. Details as in Figs. 1 and 2.
high concentration of BaO suggests that the factor maybe related to the dissolution of biogenic test debris (Dy-mond, 1981; Leinen and Pisias, 1984), although the highconcentrations of CoO are more commonly associatedwith Mn-rich hydrogenous phases. Lyle (1981, 1983) hasshown that Mn and Fe are concentrated by oxic diagene-sis into the surface sediment. Lyle (1981) and Heggie(D. Heggie, pers. comm., 1984) have also shown thatCo is concentrated in such phases. The factor may rep-resent a mixture of dissolution and oxic diagenesis phas-
es, the variances of which are associated because the phas-es are most enriched in the same sediments.
Factor 4 explains 4% of the variance in the total dataset and is dominated by the variance of A12O3. Al is al-ways very strongly associated with the detrital phases indeep-sea sediments (Heath and Dymond, 1977; McMur-try et al., 1981; Dymond, 1981; Leinen and Pisias, 1984).The Si/Al ratio of the factor is 2.8, close to that of de-tritus on the Nazca Plate (Dymond, 1981). Although thevector might represent detritus, the composition vector
244

114°59 114° 58'
SEDIMENTATION NEAR LEG 92 DRILL SITES
114° 57' 114°56'W
2000 "
1000 -
-1000
-2000
-3000
303 H A R o P \ 8 13 4
108 HF 26/4^^26/6
HF32/i3H2/2 4 7 HF2β/5°GC12, 3 Z / A ! A AHF32/3 1 4 0 / - vHF 28/6 <S>GC 13 HARP 17 - / *
/ 340HARP22IGC16
i »π .LJ
HF *HF 34/3A 34/2 2 0 3
AHF 34/1 6 9117
623/1 A
HF 29/2A1 0 7 HF29/3
62o
HF 29/4Hh A 7 / ^ A H F 31/111fc A V/^ 135
19°29'S
19° 30'
19° 31'
-3000 -2000 -1000 1000 2000
X transponder coordinate
Figure 5. Location of heat flow and coring stations in Area IV surveyed by Ariadne II. Details as in Figs. 1 and 2.
also has high concentrations of Fe and Mn. Further, theFe/Mn ratio in the composition vector is 3.5, close tothat of hydrothermal sediments from the EPR and simi-lar to that of factor 1, which we have inferred to be ofhydrothermal origin. Factor 4 may therefore include hy-drothermal or hydrogenous oxides in addition to detri-tus. This factor is abundant only in the sediments fromArea I, which are farthest from the ridge crest and whichare accumulating at the lowest rate (cf. Site 597 summa-ry). Studies of the non-authigenic, crystalline fractionof surface sediments from Site 597 (Bloomstine and Rea,this volume) and chemical leaching experiments (Kast-ner, this volume) suggest that the surface sediments fromArea I have the highest detrital content of any of thesites.
Leinen (in press) has demonstrated that a statisticallydetermined end-member composition can be contami-nated by another end-member composition when the var-iation in the data set is insufficient to separate the twoend-members. In order to determine whether the com-positions of factors 2 and 4 were not well characterizedbecause all sediments contained abundant hydrothermalmaterial, we partitioned the sediments by using the lin-ear programming technique of Dymond (1981), who stud-ied the surface sediments of the southeastern Pacific indetail. The compositions of the Dymond end-membersare presented in Table 7. (Several samples could not beincluded in this analysis because their Co and Ni con-centrations were not available.) The fit of Dymond'sfive-end-member compositional model to the Ariadne II
245

M. LEINEN, A. GRAYBEAL
Table 4. Biostratigraphy of selected site survey cores. Zonation is thatused in Knüttel (this volume).
Core
Area I
GC 1
Area II
G C 2
G C 5
G C 6
Area III
GC7
G C 8
Area IV
GC 13
GC 16
Depthwithin core
(cm)
6-750-51
101-102150-151180-181
2-350-51
100-101
2-350-5172-73
2-350-51
100-101150-151
6-8299-300
2-3150-151200-201
2-350-51
100-101
2-350-51
100-101150-151200-201250-251300-301350-351
Preservation
G
GGG
GGG
GGMM
GG
GGG
GGG
O2
22
OO
OO
Abundancea
ABBBB
VVV
VVV
VVVV
VV
VVV
VVV
VVVVAVAV
Zone
CN14/1577
CN14(?15)CN14CN14
CN14/15CN14(?15)CN14(?13)
CN14/15CN14(?15)CN14(?13)CN13
CN14(?15)CN14
CN14(?15)CN14(?15)CN13
CN14/15CN14/15CN14(?15)
CN14(?15)CN14(?15)CN14(?15)CN14CN14CN13CN13CN13
Age
Pleistocene
PleistocenePleistocenePleistocene
PleistocenePleistocenePleistocene
PleistocenePleistocenePleistocenePliocene
PleistocenePleistocene
PleistocenePleistocenePliocene
PleistocenePleistocenePleistocene
PleistocenePleistocenePleistocenePleistocenePleistocenePleistocenePliocenePliocene
A = abundant; B = barren; V = very abundant.
sediments was very good (coefficient of determination>98% for all elements except Mn; Table 8). This parti-tioning suggests that the noncarbonate sediments in AreaI are dominated by detritus and hydrothermal phases,whereas those in Areas II to IV are dominated by hydro-thermal phases and phases related to dissolved siliceousbiogenic material. Figure 8 shows the accumulation rateof hydrothermal sediment in Core GC 8 estimated bythe factor analysis and linear programming techniques.The figure also compares the concentration of hydro-thermal sediment estimated by the two techniques. Thelinear programming technique estimates nearly twice asmuch hydrothermal material as the factor analysis, butthe relationship between the two estimates is linear. Weinterpret the discrepancy between the estimates as beingthe result of the incorporation of some of the hydrother-mal material into the other factors as discussed above.The linear relationship between the two estimates sug-gests that either would give a good estimate of the rel-ative importance of hydrothermal material in differentsamples, however. The hydrothermal end-member in Dy-mond's model does contain SiO2. It is interesting thatthe linear programming technique also suggested a sig-nificant chemical contribution to the sediments from bi-ogenic silica in addition to the silica associated with hy-drothermal sediments, even though no siliceous micro-fossils were preserved in the sediments.
Accumulation Rates of Elements and SedimentComponents
Bulk-sediment accumulation rates, r, were calculatedfrom r = sp, where s is the linear sedimentation rate(Table 9) and p is the sediment dry-bulk density. The ac-cumulation rates of individual elements and sedimentcomponents (Table 9) are the product of the weight frac-tion of the element or component and the bulk-sedi-ment accumulation rates.
70 80 90
50
£ 100
150
GC 2
100
50
100
150
Calcium carbonate concentration (wt.%)
70 80 90 100 70 100
100 -
150 -
Figure 6. Calcium carbonate contents of gravity cores from Area II. Core locations are shown in Fig. 3.
246

SEDIMENTATION NEAR LEG 92 DRILL SITES
100
90
80
Sè 70
I"S
-2 50o| 40]3αiO 30
20
10
0
Wi .
- Φ
-
i
Φ
Φ
GC 16
ΦΦ
1 1
Table 5. Factor scores and rotated composition vec-tors for Ariadne II sediments (see text).
40
95 r
90
•e 85
80
75
50 60Water content (wt.%)
Φ
Φ Φ
70
Variable
Factor scores
MgOA1 2O 3
SiO 2
Mnθ2F e 2 O 3
CoONiOCuOZnOBaO
Factor 1
0.419-0.143-0.701
1.4181.1860.4460.5230.8812.1550.028
Factor 2
1.1830.0842.4620.1530.287
-0.7400.3070.3030.2561.274
Factor 3
0.4241.330
-0.012-0.102
0.1362.4460.5820.466
-0.8560.865
Factor 4
-0.9572.1820.4720.4920.186
-0.9691.2100.204
-0.102-1.151
End-member compositions (rotated factor vectors)
MgOA1 2O 3
SiO 2
M n O 2
Fe 2 θ3CoONiOCuOZnOBaO
6.032.390.00
20.1069.52
0.030.130.350.191.27
6.772.24
58.985.34
24.120.000.070.150.042.29
7.9310.8027.17
8.1341.90
0.100.180.340.003.46
0.8811.2736.0112.2739.03
0.000.200.240.060.04
Table 6. Concentration (wt.%) of factor analysis end-members in se-lected site survey core samples.
Φ*
G C 8
35 40 45Water content (wt.%)
50 55
Figure 7. Calcium carbonate concentration versus water content forCores GC 16 and GC 8.
The individual element and component accumulationrates are highly dependent on the stratigraphy, which isvery coarse, and therefore these accumulation rates can-not be determined with great precision. The accumula-tion rates do, however, convey an accurate picture of over-all variations in space and time. For example, the accu-mulation rates confirm the decrease in Fe concentrationand accumulation rate that was observed as part of atrend with age and distance from the EPR at each of theLeg 92 drill sites by Lyle et al. (this volume). The de-crease in the accumulation rates of elements associatedwith hydrothermal phases (e.g., Fe, Mn, Cu, Zn) withincreasing distance from the ridge crest also corrobo-rates the decrease in the amount of the hydrothermalphase suggested by factor analysis. Figure 9 shows therate of accumulation of the factor analysis hydrother-
Core
Area I
GC 1
Area II
G C 2
GC5
G C 6
Area III
GC8
Area IV
GC 13
GC 16
Depthwithin core
(cm)
0-1
1-26-7
28-2966-6780-81
108-109
0-210-1134-3562-63
0-210-1130-3164-6582-83
116-117
0-16-7
48-49106-107138-139174-175202-203
0-1
1-2142-143220-221372-373
Factor 1(hydrothermal)
0
250
40303630
283
4127
241337
04230
380
1020391127
66
63717864
Factor 2(biogenic?)
15
63862610145
31781315
227641
01810
35938474407570
26
26211512
Factor 3(dissolution)
6
122
23423647
410
4627
380
22613443
26723
1454
9
11000
Factor 4(detritus)
80
01211181418
0190
30
17110
396
17
0043690
0
077
25
247
M. LEINEN, A. GRAYBEAL
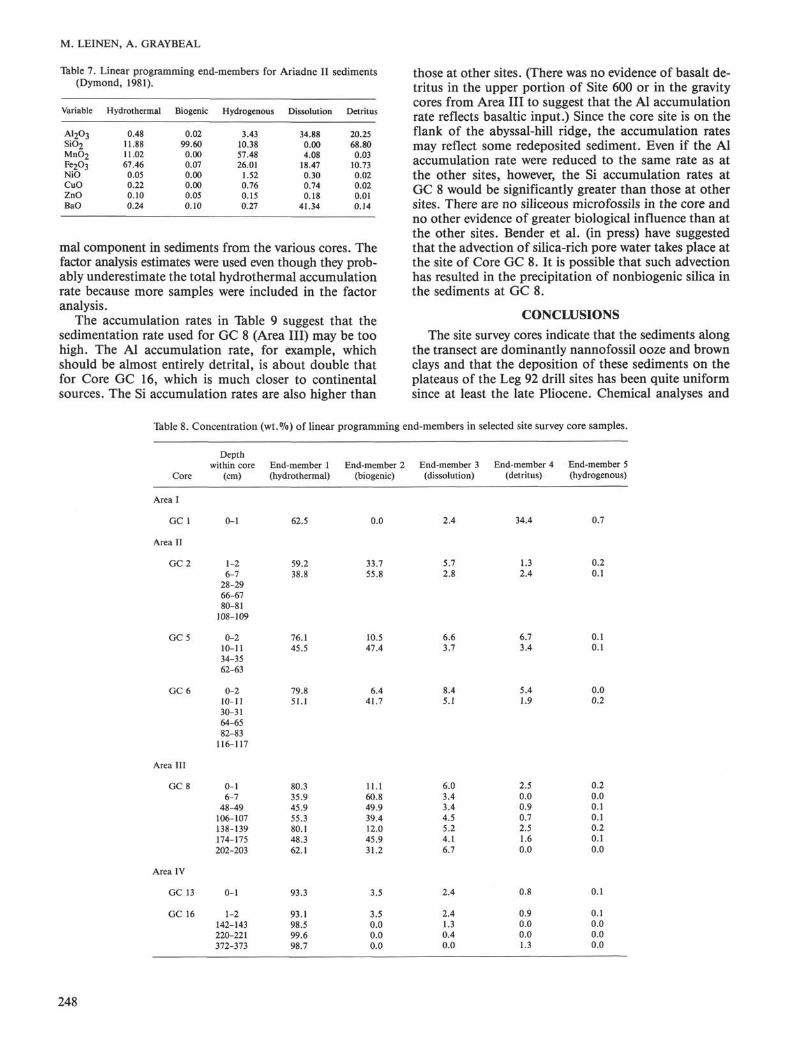
Table 7. Linear programming end-members for Ariadne II sediments(Dymond, 1981).
Variable Hydrothermal Biogenic Hydrogenous Dissolution Detritus
A12O3SiO2
MnC>2Fe2O3
NiOCuOZnOBaO
0.4811.8811.0267.460.050.220.100.24
0.0299.600.000.070.000.000.050.10
3.4310.3857.4826.01
1.520.760.150.27
34.880.004.08
18.470.300.740.18
41.34
20.2568.800.03
10.730.020.020.010.14
mal component in sediments from the various cores. Thefactor analysis estimates were used even though they prob-ably underestimate the total hydrothermal accumulationrate because more samples were included in the factoranalysis.
The accumulation rates in Table 9 suggest that thesedimentation rate used for GC 8 (Area III) may be toohigh. The Al accumulation rate, for example, whichshould be almost entirely detrital, is about double thatfor Core GC 16, which is much closer to continentalsources. The Si accumulation rates are also higher than
those at other sites. (There was no evidence of basalt de-tritus in the upper portion of Site 600 or in the gravitycores from Area III to suggest that the Al accumulationrate reflects basaltic input.) Since the core site is on theflank of the abyssal-hill ridge, the accumulation ratesmay reflect some redeposited sediment. Even if the Alaccumulation rate were reduced to the same rate as atthe other sites, however, the Si accumulation rates atGC 8 would be significantly greater than those at othersites. There are no siliceous microfossils in the core andno other evidence of greater biological influence than atthe other sites. Bender et al. (in press) have suggestedthat the advection of silica-rich pore water takes place atthe site of Core GC 8. It is possible that such advectionhas resulted in the precipitation of nonbiogenic silica inthe sediments at GC 8.
CONCLUSIONS
The site survey cores indicate that the sediments alongthe transect are dominantly nannofossil ooze and brownclays and that the deposition of these sediments on theplateaus of the Leg 92 drill sites has been quite uniformsince at least the late Pliocene. Chemical analyses and
Table 8. Concentration (wt.%) of linear programming end-members in selected site survey core samples.
Core
Area I
GC 1
Area II
G C 2
G C 5
G C 6
Area III
G C 8
Area IV
GC 13
GC 16
Depthwithin core
(cm)
0-1
1-26-7
28-2966-6780-81
108-109
0-210-1134-3562-63
0-210-1130-3164-6582-83
116-117
0-16-7
48-49106-107138-139174-175202-203
0-1
1-2142-143220-221372-373
End-member 1(hydrothermal)
62.5
59.238.8
76.145.5
79.851.1
80.335.945.955.380.148.362.1
93.3
93.198.599.698.7
End-member 2(biogenic)
0.0
33.755.8
10.547.4
6.441.7
11.160.849.939.412.045.931.2
3.5
3.50.00.00.0
End-member 3(dissolution)
2.4
5.72.8
6.63.7
8.45.1
6.03.43.44.55.24.16.7
2.4
2.41.30.40.0
End-member 4(detritus)
34.4
1.32.4
6.73.4
5.41.9
2.50.00.90.72.51.60.0
0.8
0.90.00.01.3
End-member 5(hydrogenous)
0.7
0.20.1
0.10.1
0.00.2
0.20.00.10.10.20.10.0
0.1
0.10.00.00.0
248

SEDIMENTATION NEAR LEG 92 DRILL SITES
Hydrothermal accumulation rate (mg/[cm2 x 103 yr.])
10 20 . 10 20
50
£ 100
150
200
250
100 -
100r
150 -
200 -
| |
II— O)CO O
iü >-
f s
50
250 L
0 50
Hydrothermal component (wt.%)
factor analysis model
100
B
Figure 8. Comparison of the rate of accumulation of hydrothermal sediment in Core GC 8 estimated bylinear programming (A) and factor analysis (B); and comparison of the concentration of hydrothermalsediment estimated by the two techniques (C).
Table 9. Element accumulation rates for selected site survey cores.
Core
Area I
GC 1
Area II
GC2
GC5
GC6
Area III
GC8
Area IV
GC 13
GC 16
Depthwithin core
(cm)
0-1
1-26-7
28-2966-6780-81
108-109
0-210-1134-3562-63
0-210-1130-3164-6582-83
116-117
0-16-7
48-49106-107138-139174-175202-203
0-1
1-2142-143220-221372-373
Age(× 103 yr.)
38163713
166317701986
25263863
1563
25263763
161317512013
228
211463602759880
3
10950
14702483
Bulksediment
30333227
10990
26303029
25323535
131103
145172187181170166201
126
6111313068
Accumulation rate (mg/fcm^ x 103 yr.])
CaCO3
273028219270
24272621
23293129
11081
133166174168150151184
107
5292
10442
Mg
0.080.080.080.110.310.36
0.070.060.080.14
0.070.080.080.110.380.35
0.350.400.370.440.440.400.42
0.39
0.190.360.390.38
Al
0.030.040.060.160.270.56
0.050.040.080.23
0.030.030.050.130.420.52
0.120.100.190.160.250.250.14
0.13
0.060.070.080.06
Si
0.260.590.210.551.031.83
0.180.450.290.70
0.110.360.240.411.441.60
0.573.243.482.301.363.271.57
0.83
0.370.520.870.70
Mn
0.080.080.150.300.590.92
0.080.090.170.40
0.060.090.130.250.790.86
0.330.340.600.600.880.660.58
1.02
0.451.381.490.28
Fe
0.360.370.681.302.764.26
0.380.360.731.74
0.290.370.561.103.454.10
1.661.832.882.783.842.982.57
4.36
1.955.105.628.44
Accumulation rate([mg/{cm2
Co
21
60
60
191097
20104
23
1190
20
Ni
1713
1115
618
51526791
13110452
73
37141
0140
× 103 yr.}] ×
Cu
30255097
202327
292854
133
23274282
270320
109110187185250206173
223
102268296387
Zn
96
16276391
97
1935
78
1423
11381
45226462856662
94
40110118149
1000)
Ba
342275406773
14902456
314284466954
292353456650
23412354
1246180422102290253825742793
1306
597930
1787791
249

M. LEINEN, A. GRAYBEAL
Hydrothermal accumulation rate (mg/[cm × 10 yr.])
10 20 30 _ 10 20 30 10 20 30 40 50
100
150
200
250
Area III
100 -
150 -
200 -
250 -
300 -
350 -
Figure 9. Accumulation rate of hydrothermal sediment in cores from Areas II to IV estimated by factoranalysis partitioning. Dotted line shows estimated depth of Pleistocene/Pliocene boundary from nan-nofossil biostratigraphy.
partitioning studies show that the carbonate-free sedi-ment fraction has at least four end-members: ridge cresthydrothermal sediment transported to the sites throughthe water column, authigenic and diagenetic sedimentphases, biogenic debris, and terrigenous detritus. Thepartitioning models indicate that the hydrothermal sedi-ment fraction is similar in composition to ridge crest hy-drothermal sediment but that it contains far less silicathan vent fluids and near-axis precipitates. The authi-genic and diagenetic phases are dominated by iron- andmanganese-oxide phases (primarily micronodules) andby refractory components left after the dissolution anddecomposition of biogenic material. Although none ofthe cores contained siliceous microfossils, all of the coreshad a silica-rich component, which we have interpretedas a geochemical signal from dissolved siliceous biogen-ic debris because of its lack of association with the iron-and manganese-rich amorphous hydrothermal materialin the sediments. The terrigenous sediment is similar incomposition to the andesitic detritus accumulating in thesoutheastern Pacific. The noncarbonate fraction showsincreasing influence of terrigenous sedimentation and de-creasing influence of transported hydrothermal phaseswith increasing distance from the ridge crest.
Although there was pore water and heat flow evidenceof off-axis hydrothermal activity at one of the core sites,the sediments from that site are not unusual in lithologyor physical properties. The bulk-sediment chemistry andthe chemistry of the hydrothermal component are notanomalous by comparison with the other cores from thearea. The sediment does, however, show the slight en-richment in Si and Fe characteristic of sediments affect-ed by low-temperature off-axis hydrothermal activity.
ACKNOWLEDGMENTSWe would like to thank the captain and crew of the Thomas Wash-
ington and Mr. Robert Wilson for their assistance in coring and their
continued efforts to make coring possible in spite of winch, wire, andcorer failures. We would also like to thank Tammy Walsh for her as-sistance at sea and in sampling. Steve Knüttel graciously added severalof our samples to his workload for Leg 92 nannofossil biostratigraphy.This work was supported by JOI, Inc. Contract #47-81.
REFERENCESBender, M. L., Hudson, A., Graham, D. W., Barnes, R. O., Leinen,
M., and Kahn, D., in press. Diagenesis and convection reflected inpore water chemistry on the western flank of the East Pacific Rise,20 degrees South. Earth Planet. Sci. Lett.
Berger, W. H., 1973. Deep-sea carbonates: Pleistocene dissolution cy-cles. J. Foraminiferal Res., 3:187-195.
Bernas, B., 1968. A new method for decomposition and comprehen-sive analysis of silicates by atomic absorption spectrometry. Anal.Chem., 40:1682-1686.
Boström, K., 1974. The origin and fate of ferromanganoan active ridgesediments. Stockholm Contrib. Geol., 27:149-243.
Boström, K., Kraemer, T, and Gartner, S., 1973. Provenance and ac-cumulation rates of opaline silica, Al, Ti, Fe, Mn, Cu, Ni and Coin Pacific pelagic sediments. Chem. Geol., 11:123-148.
Broecker, W. S., and Broecker, S., 1974. Carbonate dissolution on thewestern flank of the East Pacific Rise. In Hay, W. W. (Ed.), Stud-ies in Paleoceanography. Spec. Publ. Soc. Econ. Paleontol. Miner-al., 20:44-57.
Corliss, J. B., Lyle, M., Dymond, J., and Crane, K., 1978. The chem-istry of hydrothermal sediment mound deposits near the Galapa-gos Rift. Earth Planet. Sci. Lett., 40:1-12.
Dunn, D. A., 1980. Revised techniques for quantitative calcium car-bonate analysis using the "Karbonat-Bombe" and comparisons toother quantitative carbonate analysis methods. J. Sediment. Pet-rol., 50:631-637.
Dymond, J., 1981. Geochemistry of Nazca Plate surface sediments:an evaluation of hydrothermal, biogenic, detrital, and hydroge-nous sources. In Kulm, L. D., Dymond, J., Dasch, J., and Hus-song, D. (Eds.), Nazca Plate: Crustal Formation and Andean Con-vergence. Mem. Geol. Soc. Am., 154:133-174.
Dymond, J., and Eklund, W., 1978. A microprobe study of metallifer-ous sediment components. Earth Planet. Sci. Lett., 40:243-251.
Dymond, J., and Veeh, H. H., 1975. Metal accumulation rates in thesoutheast Pacific and the origin of metalliferous sediments. EarthPlanet. Sci. Lett., 28:13-22.
Edmond, J. M., Measures, C , McDuff, R. E., Chan, L. H., Collier,R., Grant, B., Gordon, L. I., and Corliss, J. B., 1979. Ridge cresthydrothermal activity and the balances of the major and minor el-
250

SEDIMENTATION NEAR LEG 92 DRILL SITES
ements in the ocean: the Galapagos data. Earth Planet. Sci. Lett.,46:1-18.
Heath, G. R., and Dymond, J., 1977. Genesis and transformation ofmetalliferous sediments from the East Pacific Rise, Bauer Deepand Central Basin, Northwest Nazca Plate. Geol. Soc. Am. Bull.,88:723-733.
, 1981. Metalliferous sediment deposition in time and space:East Pacific Rise and Bauer Basin, northern Nazca Plate. In Kulm,L. D., Dymond, J., Dasch, J., and Hussong, D. (Eds.), NazcaPlate: Crustal Formation and Andean Convergence. Mem. Geol.Soc. Am., 154:175-198.
Hein, J., Yeh, H., and Alexander, E., 1979. Origin of iron-rich mont-morillonite from the manganese nodule belt of the North equatori-al Pacific. Clays Clay Miner., 27:185-194.
Hobart, M., Abbott, D. H., Anderson, R. N., and Lonsdale, P. R,1982. Detailed geothermal surveys on the East Pacific Rise at 19°S.EOS, Trans. Am. Geophys. Union, 63:1103.
Karato, S., and Becker, K., 1983. Porosity and hydraulic properties ofsediments from the Galapagos Spreading Center and their relationto hydrothermal circulation in the oceanic crust. J. Geophys. Res.,88:1009-1017.
Leinen, M., in press. The origin of paleochemical signatures in northPacific pelagic clays: partitioning experiments. Geochim. Cosmo-chim. Ada.
Leinen, M., and Anderson, R. N., 1981. Hydrothermal sediment fromthe Mariana Trough. EOS, Trans. Am. Geophys. Union, 62:914.
Leinen, M., and Pisias, N. G., 1984. An objective technique for deter-mining end-member compositions and for partitioning sedimentsaccording to their sources. Geochim. Cosmochim. Acta, 48:47-62.
Lyle, M., 1981. Formation and growth of ferromanganese oxides onthe Nazca Plate. In Kulm, L. D., Dymond, J., Dasch, E. J., andHussong, D. (Eds.), Nazca Plate: Crustal Formation and AndeanConvergence. Mem. Geol. Soc. Am., 154:269-294.
, 1983. The significance of the brown-green color change insurface sediments from the Pacific Ocean. Limnol. Oceanogr., 28:1026-1033.
Lyle, M. W., and Dymond, J., 1976. Metal accumulation rates in south-east Pacific—errors introduced from assumed bulk densities. EarthPlanet. Sci. Lett., 30:164-168.
McMurtry, G. M., Veeh, H. H., and Moser, C , 1981. Sediment accu-mulation rate patterns on the northwest Nazca Plate. In Kulm, L.D., Dymond, J., Dasch, E. J., and Hussong, D. (Eds.), NazcaPlate: Crustal Formation and Andean Convergence. Mem. Geol.Soc. Am., 154:211-250.
Maris, C. R. P., Bender, M. L., Leinen, M., and Froehlich, P. N.,in press. Chemical evidence for pore water advection in MarianaTrough sediments. J. Geophys. Res.
Mayer, L. A., 1980. Deep-sea carbonates: physical property relation-ships and the origin of high-frequency acoustic reflectors. Mar.Geol., 38:165-183.
von Damm, K. L., and Edmond, J. M., 1982. Chemistry of 21 °N EastPacific Rise hydrothermal solutions. EOS, Trans. Am. Geophys.Union, 63:1015.
Date of Initial Receipt: 29 October 1984Date of Acceptance: 22 November 1985
251