site management and productivity in tropical plantation forests
TRANSCRIPT

Site Management and Productivity
in Tropical Plantation Forests:
A Progress Report
WORKSHOP PROCEEDINGS
7-11 DECEMBER 1999KERALA, INDIA
EditorsE.K.S. Nambiar
A. TiarksC. Cossalter
J. Ranger
CENTER FOR INTERNATIONAL FORESTRY RESEARCH
CIFOR
StManagment-gs Final.pdf 1/31/01 8:29 PM Page a (Black plate)

© 2000 by Center for International Forestry ResearchAll rights reserved. Published in December 2000
Printed by SMT Grafika Desa Putera, IndonesiaDesigned by Gideon SuharyantoCopy editors: J.W. and J.M. Turnbull
Cover photos: C. CossalterRe-planting of Acacia mangium beyond the first rotation at Subanjeriji, South Sumatra, Indonesia.ECO S.A. Eucalypts pulpwood plantations, Pointe-Noire, Congo.Smelting works using Eucalypts as energy source, Guangdong, China
ISBN 979-8764-52-8
Nambiar, E.K.S., Tiarks, A., Cossalter, C. and Ranger, J. (eds.) 2000. Site management and productivity in tropical plantation forests: a progressreport. Center for International Forestry Research, Bogor, Indonesia. 112 p.
Published byCenter for International Forestry ResearchBogor, IndonesiaMailing address: P.O. Box 6596 JKPWB, Jakarta 10065, IndonesiaTel.: +62 (251) 622622; Fax: +62 (251) 622100E-mail: [email protected] Website: http://www.cifor.cgiar.org
StManagment-gs Final.pdf 1/31/01 8:29 PM Page i (Black plate)

1. Introduction to Third Workshop in Kerala, India 1E.K.S. Nambiar
2. Effects of Site Management in a Eucalyptus grandisPlantation in the Humid Tropics: S�o Paulo, Brazil 3J.L.M. Gon�alves, M.I.P. Serrano, K.C.F.S. Mendes and J.L. Gava
3. Effects of Site Management on Eucalyptus Plantations in the Equatorial Zone, on the Coastal Plains of the Congo 11J.P. Bouillet, J.D. Nzila, J.P. Laclau and J. Ranger
4. Effects of Site Management in Eucalyptus grandisPlantations in South Africa 21B. du Toit, L.J. Esprey, R.A. Job, G.F. Fuller and S.D. Dovey
5. Effects of Site Management in Eucalyptus urophyllaPlantations in Guangdong Province, China 31D.P. Xu, Z.J. Yang, B. Dell and M. Gong
6. Effects of Site Management in Acacia mangiumPlantations at PT. Musi Hutan Persada, South Sumatra, Indonesia 41E.B. Hardiyanto, A. Ryantoko and S. Anshori
7. Effects of Site Management on Eucalyptus Plantations in the Monsoonal Tropics - Kerala, India 51K.V. Sankaran, K.C. Chacko, R.C. Pandalai, J. Kallarackal, C.K. Somen, J.K. Sharma, M. Balagopalan, M. Balasundaran, S. Kumaraswamy, S. Sankar, R.J. Gilkes, T.S. Grove, D. Mendham and A.M. OÕConnell
8. Effects of Site Management in Eucalypt Plantations in Southwestern Australia 61A.M. OÕConnell, T.S. Grove, D. Mendham and S.J. Rance
9. Effects of Site Management in Pine Plantations on the Coastal Lowlands of Subtropical Queensland, Australia 73J.A. Simpson, Z.H. Xu, T. Smith, P. Keay, D.O. Osborneand M. Podberscek
Contents
StManagment-gs Final.pdf 1/31/01 8:29 PM Page ii (Black plate)

iii
10 Effects of Site Management in Chinese Fir (Cunninghamia lanceolata) Plantations in Fujian Province, China 83Fan Shaohui, Yang Chendong, He Zongming, He Zhiying, Lin Sizu, Lu Shantu, Ying Jinhua and Yang Xujing
11 Site Management and Productivity of Acacia mangiumin Humid Tropical Sumatra, Indonesia 87C.K. Mok, L.C. Cheah and Y.K. Chan
12. Nutrient Cycling in a Short Rotation EucalyptusPlantation and an Adjacent Savanna in Congo 95J.P. Laclau, J. Ranger, J. de D. Nzila and J.P. Bouillet
13. Loblolly Pine (Pinus taeda) Plantations in the Semitropical Southeastern United States 101A. Tiarks, M. Elliott-Smith and R. Stagg
14. Summary of the Third Workshop in Kerala, India 105A. Tiarks and E.K.S. Nambiar
StManagment-gs Final.pdf 1/31/01 8:29 PM Page iii (Black plate)

It has been widely recognised that an increasingproportion of the demand for wood supply should bemet by timber harvest from planted forests rather thannative forests. This is particularly so in many tropicaland subtropical countries which have either establishedlarge areas of plantation forests (e.g., Brazil, India) orhave embarked upon plantation forestry at a significantscale (e.g., Vietnam, Uruguay). Investors in theseplantations seek to benefit from their short rotationresources, largely facilitated by industrial scaleoperations.
The strong need for growing plantation forests isevident in Kerala, where this workshop took place.Booth and Nambiar (2000) discussed the scenario inKerala, which was once endowed with rich forests andabundant supply of tropical timber, and supported amajor inter-state timber trade. Deforestation has broughtthis to a halt. Despite the diminishing use of timber forhouse construction (because of prohibitive price andscarcity) the current consumption is estimated to bebetween 2.6 and 3.0 million m3 for a population of morethan 29 million. More than half of this volume is takenfrom trees felled from homestead plantings, anunsustainable practice. India has an estimated area ofabout 4.8 million ha of eucalypt plantations, one of thelargest areas under this genus in any one country.However, productivity of these plantations is low, lessthan 10 m3 ha-1 yr-1 and frequently too low to becommercially viable. However, as the workshop fieldvisit to experimental sites showed, the potential forincreasing productivity by improved management ishigh. Acute shortage in wood supply (industrial, pole,structural and fuel wood) is endemic in India whereharvesting of timber from native forests is illegal. Indianpulp and paper industries have pointed out that the
establishment of well-managed plantation forests in 1%of the estimated 130 million hectares of ‘degraded forestland’ would alleviate the current resource constraint ontheir development.
Large areas of planted forests are reachingharvestable age and will go into second rotation inecosystems where there are risks to sustainability. Anexample of this is the Acacia mangium plantations inSumatra and Kalimantan in Indonesia which aremanaged on a 8-10-year rotation. Information fordeveloping management options for maintaining andenhancing the productivity of successive crops isurgently needed, a point strongly made by severalpapers in this proceedings.
Since we began this network project the potentialrole of planted forests for providing ecosystem servicesincluding carbon sequestration for partly offsetting netgreenhouse gas emissions, biodiversity enhancementsin the landscape and mitigation of land and waterdegradation have been receiving renewed interest inseveral countries (Booth and Nambiar 2000).Soekartiko et al. (2000) have estimated that in SouthEast Asia over two million hectares of land could beplanted to eucalypt plantations through carboninvestments within the next decade, sequestering about10 million tonnes of carbon dioxide per year. Suchdevelopment indeed requires major considerations onmany complex issues including investments,community participation, balanced land use policiesand capacity to generate and apply knowledge.
Introduction to Third Workshop in Kerala, India
E.K.S. Nambiar1
1 CSIRO Forestry and Forestry Products, PO Box E4008, Kingston,Canberra, ACT 2604, Australia
1
StManagment-gs Final.pdf 1/31/01 8:29 PM Page 1 (Black plate)

Introduction2
others are at an early stage. The strength of the networklies in its unique opportunity to share knowledge(empirical and mechanistic) and managementexperience among scientists and managers working at15 sites in seven countries. Partners in the networkinclude researchers from research organisationsoperating at local, state or national levels, privatecompanies, universities, forest managers and staff ofinternational agencies supporting research. The paperspresented in the new proceedings highlight the scientificprogress achieved so far. Information in them,discussions and field visits are the conduits forachieving the project’s goals.
References Booth, T.H. and Nambiar, E.K.S. 2000. Sustainable
plantation forestry in the tropics: newopportunities and collaborative research. Paper toInternational Symposium on Tropical ForestryResearch: challenges in the new millennium,Kerala Forest Research Institute (KFRI), Kerala,India, August 2000.
Nambiar, E.K.S. and Brown, A.G. (eds). 1997.Management of soil, water and nutrients in tropicalplantation forests. ACIAR Monograph No. 43.ACIAR, Canberra. 571p.
Nambiar, E.K.S., Cossalter C. and Tiarks A. (eds.) 1999.Site management and productivity in tropicalplantation forests: workshop proceedings, 16-20February 1998, Pietermaritzburg, South Africa.CIFOR, Bogor. 76p.
Soekartiko, B., Wright, J.A., Dinicola, A. and Gaitin, E.2000. Multiple benefits from carbon sequestration inSouth East Asia using forest plantations. Proceedings54th Appita 2000 Conference, Vol. 1, 7-11.
Tiarks, A., Nambiar, E.K.S. and Cossalter, C. 1998. Sitemanagement and productivity in tropical plantations.CIFOR Occasional Paper No. 16. CIFOR, Bogor.
Sustained productivity of plantation forests is thefoundation of successful forestry which can providediverse benefits. Sustained productivity is not a result ofany single management practice but a single adversepractice such as poor harvesting practice can degradesoil to the detriment of long-term productivity.Sustainability is achieved incrementally, through allmanagement practices applied throughout the rotationand between rotations (Nambiar and Brown 1997). Thephase between the harvesting of one crop and theestablishment of the next is a window of considerablerisk as well as opportunity to set the course of successfulforestry with little or no risk to environmental values.Managers have great flexibility for judicious applicationof technology for achieving their goals at this phase.Therefore the focus of the project is on the inter-rotationmanagement phase.
Tiarks et al. (1998) have described the rationale ofthe project, including the concept of treatments, networkarrangements and mutual obligations for partners. Thekey principles are:• Evaluate the impact of soil and site management
practices on the productivity of successive rotationsof plantations;
• Develop management options for maintaining orincreasing productivity;
• Strengthen local institutional capacity to respond tonew problems and opportunities; and
• Establish close participation with local managersand foster appropriate mechanisms for technologytransfer.
We reported on locations of sites, progress ininstallations, methods and of experimental results froma number of sites in the previous proceedings (Nambiaret al. 1999). The contents of the proceedings of theKerala workshop build on that information. There hasbeen further progress on new sites and more detailedresults from sites where the study has been in progressfor more than four years are available. Some sites arealready providing highly relevant information, while
StManagment-gs Final.pdf 1/31/01 8:29 PM Page 2 (Black plate)

IntroductionBrazilian eucalypt plantations have been established inareas originally covered by climax vegetation known as‘Cerrado’ (savanna) and Atlantic forest. In the long termthere are serious risks to sustainability, because of thelow fertility and low reserves of primary minerals in thesoils, commonly, medium textured latosols andquartzipsamments. Little is known about potentialimpacts caused by different site management practiceson yield sustainability over successive rotations ofeucalypt stands, particularly the relationship to nitrogendynamics in these ecosystems.
Extensive eucalypt plantations rarely respond to Nfertilisation under tropical and subtropical conditions(Barros et al. 1990, Herbert and Schönau 1990,Gonçalves et al. 1997). This is because the severalnatural sources of N, mainly the organic Nmineralisation during the rotation, are enough to meettree demands (Gonçalves and Barros 1999). However,due to the high outputs of N (Bellote et al. 1980,Poggiani 1985, Reis et al. 1987, Gonçalves 1995) and
due to the possible exhaustion of mineralisable organicN reserves, intensively managed forests may respond toN fertilisation after successive rotations. The deficiencyof N is closely related to exhaustion of mineralisable Csources, since the N dynamics are closely related to C(McGill and Christie 1983). There has been littleresearch on this topic in Brazil.
This study aims to evaluate and compare thepotential of N mineralisation in eucalypt standsestablished under different systems of soil preparationand forest residues management. Results presented herebuild on those reported by Gonçalves et al. (1999).
Effects of Site Management in a Eucalyptus grandis Plantation
in the Humid Tropics: S�o Paulo, Brazil
J.L.M. Gon�alves1, M.I.P. Serrano2, K.C.F.S. Mendes3 and J.L. Gava3
1 Associate Professor of the Forest Science Department, ESALQ/University of São Paulo, Brazil, Cx Postal 9, 13418-900 - Piracicaba -SP - Brazil. Tel: +55 19 4294264, Fax: +55 19 433608, E-mail:[email protected] Post-graduate Student, Forest Science Department, ESALQ/USP SãoPaulo, Brazil3 Forest Engineer, Cia. Suzano de Papel e Celulose, Av. Dr. JoséLembo/Rodovia Raposo Tavares, km 169, Cx Postal 228, CEP 18.200-000, Itapetininga - SP, Brazil. E-mail: [email protected]
AbstractThis paper reports the effect of site management practices of minimum and intensive cultivation ofthe soil on the growth of a stand of Eucalyptus grandis and on N mineralisation. The study site is acommercial plantation of E. grandis in Itatinga district, São Paulo State, Brazil. At 39 months of age,the height growth among the treatments where the residues were retained, incorporated or burnt didnot differ from each other. The height differences among these treatments decreased with time.These results highlight the temporary effect on initial growth promoted by the large availability ofnutrients released by burning and from mineralisation of incorporated residues. The largest N-mineralisation rates were in the standing crop treatment, 44 kg ha-1 yr-1 of N, followed by thetreatments where the residues were incorporated, 35 kg ha-1 yr-1 of N, and where slash and litter wereretained with minimum site disturbance, 33 kg ha-1 yr-1 of N. Removal or burning of the residuesinhibited N-mineralisation with only 26 and 16 kg ha-1 yr-1 of N, respectively in these treatments. Thehigh rates of N-mineralisation in some treatments show why most of Brazilian eucalypt plantationshave little or no response to N fertilisation.
2
StManagment-gs Final.pdf 1/31/01 8:29 PM Page 3 (Black plate)

Effects of Site Management in a Eucalyptus grandis Plantation in the Humid Tropics: S�o Paulo, Brazil4
Table 1. Some physical characteristics of the soil
Depth Sand Silt Clay Bulk density Particle density
(cm) % (g cm-3)
0-20 77 3 20 1.25 2.2220-50 76 2 22 1.30 2.25
Material and Methods
Description of the Experimental AreaThe study is located in a commercial plantation ofEucalyptus grandis Hill ex Maiden, Itatinga district, SãoPaulo state, Brazil. It is located at 23000'S and 48052'Wat an altitude of 750 m. The site is representative ofextensive areas planted with eucalypts on the São Pauloplateau. Before plantation establishment the site wasoccupied by ‘Cerrado’, the native vegetation typical ofthe area. At the beginning of the study the stand was 7-year-old E. grandis. The climate of the area is Köeppentype Cwa, characterised by a dry winter with meantemperature for the coldest month (July) less than 180C,and a wet summer with the hottest month (January)above 220C. The annual mean precipitation is about1580 mm, 57% of which falls during December toMarch. There is no pronounced water deficit. The soiltype is characterised as a red-yellow latosol (oxisol),medium texture, dystrophic, and the topography flat togentle relief. The physical and chemical characteristicsof the soil are presented in the Tables 1 and 2.
Site PreparationThe experimental treatments are operational practicesdesigned to provide a range of disturbances of differentintensities for the soil and harvest residues. The firstset of four treatments parallel the core treatments of theCIFOR Network trials (Tiarks et al. 1998; Gonçalveset al. 1999).
BL0 All aboveground biomass, including the croptrees, understorey, slash and litter, removed.
BL1 All stemwood harvested. All bark, understorey,slash and litter were retained with minimumdisturbance to site (Note that in BL1 treatment ofthe CIFOR Protocol aboveground parts,including bark of the commercial-sized cropstems, are removed).
BL2 Stemwood with bark harvested. All slash,understorey and litter retained with minimumdisturbance.
SC Standing crop left intact.SLp Harvest all stemwood. All residue (bark, slash,
litter and understorey) incorporated in the soilwith a heavy harrow.
SLb Harvest stemwood. All residue distributed on thesoil and burnt.
CP Clear-cut the stand and harvest stemwood. Allresidue retained on the soil. Cut stumps allowedto coppice.
The stand was clear-cut in July 1995 andtreatments were applied by August 1995. TreatmentsBL0, BL1, BL2, SLp and SLb were completed after theclearcutting and seedlings for the new plantationwere planted in September 1995 at a spacing of 3 x 2m. Eucalyptus grandis of Coffs Harbour provenancewas used. Seedlings were planted in furrows andfertilised at planting with 15, 13 and 12 kg ha-1 of N,P and K, respectively, and a basal dressing of 250 kgha-1 of KCl was applied in May 1996. Weeds werecontrolled manually.
Experimental DesignThe plots were established in a randomised completeblock design, with seven treatments and four replicates.Each plot consisted of 121 trees (11 x 11) and the totaltrial occupied 1.75 ha.
Table 2. Some chemical characteristics of the soil
Depth pH C N C:N P K Ca Mg H Al BS1 CEC2
(cm) CaCl2 (g dm-3) (mg dm-3) (cmolc dm-3)
0-10 3.7 14.5 1.2 12 4.0 0.04 0.4 0.1 6.0 1.7 0.5 2.210-20 3.8 9.9 0.9 11 4.3 0.03 0.5 0.1 5.5 1.5 0.6 2.120-30 3.8 9.3 0.9 10 3.0 0.03 0.2 0.1 3.8 1.5 0.3 1.830-50 3.9 4.7 0.5 9 3.0 0.02 0.1 0.1 3.0 1.3 0.2 1.5
1Sum of bases (K + Ca + Mg); 2CEC at pH 7.0.
StManagment-gs Final.pdf 1/31/01 8:29 PM Page 4 (Black plate)

J.L.M. Gon�alves, M.I.P. Serrano, K.C.F.S. Mendes and J.L. Gava 5
N MineralisationRates of N mineralisation were measured in treatmentsSC, BL0, BL1, SLp and SLb, using methodology ofRaison et al. (1987). Soil cores were contained in situ insix PVC tubes (40 cm long and 5 cm diameter). Soil wasincubated (ca 50 days), sequentially sampled andmineral N measured. The soil cores were divided at thefollowing depths: 0-5, 5-15 and 15-30 cm.
To obtain the extracts, 10 g of fresh soil and litterwas shaken with 50 ml of KCl (2M) for one hour(Bremner 1965). The extracts were centrifuged to 2000rpm for 15 minutes; and 20 ml of aliquots collected, andtreated with 1 ml of the microbial inhibitor.Concentration of NH4
+-N and NO3--N was measured in
the aliquot. Soil and litter subsamples were dried at105ºC for 24 hours to determine moisture content.
Results and Discussion
Tree Growth under Different Systems ofSite ManagementTree growth data at 6, 15 and 39 months are shown inthe Fig. 1. At 6 months, the coppiced trees (CP) werethe tallest (4.4 m; p <0.05). This high initial growth ofthe eucalypt coppice compared to planted seedlings isobserved frequently in plantations, partly due to theeffect of nutrient reserves in the stumps and rootsystem, and the ability of an established root system touptake water and nutrients. The trees in SLb, where theresidues (litter and slash) were burned, had the secondlargest height growth in this age, which wassignificantly larger than the other treatments. The BL1,BL2 and SLp treatments (minimum site disturbance, allresidues retained and residues incorporatedrespectively) were not significantly different fromeach other at 6 months, neither were BL2 and BL0
treatments (litter retained and all the residuesremoved, respectively). It is clear that BL0 treatmentresulted in the smallest trees. This highlights the effectof forest residues management and nutrient removalon initial growth.
At 15 months, tree height in SLb differedsignificantly (p<0.05) from BL1, BL2 and SLp
treatments (Fig. 1). At this age, the height growth inBL1 and SLp was the same as in the coppice (CP).Treatment BL0 had the smallest average height. At 39months, the height growth among BL1, SLp and SLb
was the same. Height differences among these
treatments have diminished with time (Fig. 1). Thebasal area growth of BL1 was not significantlydifferent from SLb, but was higher for SLp (Table 3).These results emphasise the temporary effect on earlytree growth of the high amounts of nutrients releasedby burning and mineralisation. However, thesetreatments probably have undesirable effects such asloss of nutrients by volatilisation, leaching and erosionin the long term. The poorest growth was found in CPand BL0 treatments (Fig. 1 and Table 3). Overall, thegrowth of the coppice was poorer than in replantedplots (except BL0). This may be partly due to the bettergenetic quality of the seedlings.
Table 3. Diameter and basal area at age 39 months
Treatment dbh(1)
Basal area(1)
(cm) (m2 ha-1)
CP 9.4 c 9.4 cBL(0) 8.5 d 9.2 cBL(1) 10.6 b 14.7 aBL(2) 9.8 c 12.4 bSL(p) 11.2 a 12.0 bSL(b) 11.2 a 15.7 a
(1) Mean followed by different letters are significantly different by Tukeytest (p = 0.05).
Age (year)
Hei
ght (
year
)
0 1 2 3 40
3
6
9
12
15
18
CP (all residues retained, coppice)
BL (1) (all residues retained)BL (2) (only understory and litter retained)BL (0) (all residues removed)SL(p) (all residues incorporated) SL(b) (all residues burned)
Figure 1. Height growth of E. grandis at 6, 15 and 39months of age in relation to treatments
StManagment-gs Final.pdf 1/31/01 8:29 PM Page 5 (Black plate)

Effects of Site Management in a Eucalyptus grandis Plantation in the Humid Tropics: S�o Paulo, Brazil6 Effects of Site Management in a Eucalyptus grandis Plantation in the Humid Tropics: S�o Paulo, Brazil
Nitrogen MineralisationOver a 21 month period, the highest rates of Nmineralisation (ammonification and nitrification) werefound in SC (77 kg ha-1), followed by SLp (61 kg ha-1)and BL1 treatments (58 kg ha-1). In BL0 45 kg ha-1 of Nwas mineralised, and in SLb only 28 kg ha-1. Thecontribution of litter was very small, less than 5% ofthe total N mineralised (Table 4 and Fig. 2). Thelargest amount of mineralised N was in the treatmentswhere the soil microorganisms had more access tosubstrate. The removal or burning of forest residuesconsiderably inhibited the N mineralisation rates. Inthe first case, the soil was exposed to the sterilisingand drying effects of the sun, and so experienced hightemperature and humidity fluctuations (Gonçalves etal. 1999), besides the reduction of substrate quality forthe soil microorganisms. In the second case, thegreater surface soil temperatures would have causedconsiderable reduction of microbial biomass. Theresidue incorporation (SLp) increased N mineralisationby accelerating residue decomposition. So in thistreatment, unlike BL1, a large part of the mineralisedN may have come from residue decomposition andsoil organic matter.
Table 4. Total-N mineralised (NH4
+ + NO3
-) over thefirst 21 months after planting. The values in bracketsare the percentages in relation to the total N
Treatment Total-N mineralised
Litter 0-5 cm 5-15 cm 15-30 cm Total
(kg ha-1)
SC 3 (4) 49 (64) 17 (22) 8 (10) 77
BL1 3 (5) 20 (35) 18 (31) 17 (29) 58
BL0 - 20 (44) 9 (20) 16 (36) 45
SLp - 26 (43) 23 (38) 12 (19) 61
SLb - 16 (57) 3 (11) 9 (32) 28
The high N mineralisation, 32 to 44 kg ha-1 yr-1,in some treatments, explains the small or no responseto N fertilisation in Brazilian eucalypt plantations(Barros et al. 1990 and Gonçalves and Barros 1999).The annual demand of N measured in young eucalyptstands is in the range of 20 to 50 kg ha-1 yr-1 asobserved at this site (Gonçalves et al. 1999) andreported by Bellote et al. (1980), Poggiani (1985),Reis et al. (1987) and Gonçalves (1995).
Figure 2. Total-N mineralised (NH4+-N - NO3
--N) indifferent soil layers, (a) 0-5 cm, (b) 5-15 cm, (c) 15-30 cm
The treatments where all (BL0) or part of theresidues (BL2) were removed had smaller growth rates(Fig. 1 and Table 3). The removal of residues verymuch reduced the rates of N mineralisation in BL0
(Table 5). However, this was not the main cause of thegrowth reduction, otherwise, growth would also havebeen low in SLb, where all residues were burned andthe rates of N mineralisation were very low (Table 5).The ashes of the residues produced in this treatmentalso did not constitute a good source of N for the trees,because most N is volatilised to the atmosphere duringburning. Similarly, in the Brazilian savannas, Maluf(1991) reported losses of 88% of N from the residues
a
0
2
4
6
8
10
tempo vs A 0-5 tempo vs C 0-5 tempo vs E 0-5 tempo vs F 0-5 tempo vs G 0-5 X X
b
Tota
l-N
min
era
lized
(kg
Nha
-1m
onth
-1)
0
2
4
6
8
10
tempo vs A 5-15 tempo vs C 5-15 tempo vs E 5-15 tempo vs F 5-15 tempo vs G 5-15 X X
c
Months after clear cut
Oct Dec/95 Jan/96 Mar Apr Jun Aug Oct Dec/96 Feb Apr/97
-2
0
2
4
6
8
10
SCBL (1)
BL (0)
SL(p)
SL(b)
LSD = 1.2 (p=0.10)
LSD = 1.0 (p=0.10)
LSD = 1.1 (p=0.10)
StManagment-gs Final.pdf 1/31/01 8:29 PM Page 6 (Black plate)

J.L.M. Gon�alves, M.I.P. Serrano, K.C.F.S. Mendes and J.L. Gava 7
of a eucalypt stand after harvesting. Comparingtreatments BL0 and SLb, it appears that the morelimiting nutrients were present in abundance in theresidue ashes, and that it was probably P and K thatstimulated much of the growth increase. Gava (1997)observed a strong response to K fertilisation ineucalypt plantations in similar climatic and edaphicconditions. All eucalypt plantations near the researchsite are given a large amount of P and K fertilisers atplanting time (ca 35 kg ha-1 P and 8.5 kg ha-1 K) and inbasal dressing (ca 90 kg ha-1 K). When these fertilisersare not applied, the growth is drastically reduced andeconomical wood production is not feasible.
Table 5. Amount of NH4+-N and NO3
--N mineralised(0-30 cm) over the first 21 months after site preparation
Treatment NH4+-N NO3
--N
(kg ha-1)
SC 60 17BL1 38 20BL0 32 13SLp 48 13SLb 10 18
Generally, the largest N mineralisation occurred in the0-15 cm soil layer (> 65%) and in the old stand (SC),mineral N in this layer was about 90% of the total N(Table 4).
The highest N mineralisation rates and treatmentdifferences were found in the first 8 months afterclear-cut as a direct effect of the treatments inexposing soil (Fig. 2). Similar trends were also foundfor the soil temperature and moisture (Gonçalves et al.1999). After this time, the fluctuations in mineralisedamounts in each treatment and the differences amongtreatments were small. The superiority of the SC, SLp
and BL1 over other treatments can be seen in Fig. 2.
The fluctuations of N mineralised with time werevery small after the third measurement in the SCtreatment (Fig. 2). Probably it would also have beensmall in the previous evaluations if the eucalypt standhad not been cleared to set up the adjacent plots of theother treatments. Because of the clear-cutting around theSC treatment plots, lateral solar radiation penetrated theSC plots, for about 8 to 12 months until the adjacenttrees grew up. This caused a temperature increase
(Gonçalves et al. 1999) and one of the possible causes ofthe high rates of N mineralisation in this period. Afterthe rates stabilised the average N mineralisation rateswere 2 kg ha-1 month-1 at 0-5 cm, 1 kg ha-1 month-1 at 5-15 cm and 0.4 kg ha-1 month-1 at 15-30 cm. The meanN mineralisation rate was about 41 kg ha-1 yr-1 in the 0-30 cm layer (Fig. 2).
The amount of NH4+-N mineralised was higher
than NO3--N in SC, BL1, BL0 and SLp. The opposite
only occurred in the SLb treatment (residue burned)(Table 5). These results confirm that larger amounts ofN are absorbed in the NH4
+-N form. The total amountof NH4
+ and NO3- mineralised in 0-30 cm soil in SC
and SLp were similar, NH4+ was lower than NO3
- inBL1, BL0 and especially in SLb treatment thedifferences were very high (Table 6). This means thatthe nitrification rates were higher than ammonificationrates in all clearfelled treatments where the residueswere burned, removed or maintained on the soil. Theincorporation of the residues stimulated thenitrification. The burning of residues and the ashdeposition on soil surface stimulated the activity of thenitrifier bacteria, probably due to increasing pH and soilfertility (Gonçalves et al. 1999), which can increasetheir competitive ability with other microorganisms.The burning effect on NO3
- mineralisation wasobserved mainly in the 0-15 cm layer over the first 6months. Similar results were found by Theodorou andBowen (1982) when evaluating the effects of a bushfireon the microbiology of a dystrophic planosol undereucalypt forests. They found that the largest changesoccurred in the 0-2 cm layer, with the effect still beingobserved about 2 months after burning.
The NH4+ mineralised in SC in the 0-5 cm layer
was much higher than NO3- (Table 6). This indicates
an inhibiting effect of the stand on the nitrificationprocess. According to Carlyle (1986), the magnitudeof the nitrification in forest stands is low relative tothat observed in most agricultural lands due to greatuptake of NH4
+ (substrate of the nitrifier bacteria) andthe adverse conditions of many soils used for forestry,such as low natural fertility and high acidity. In mostof forest soils the N demand for heterotrophicorganisms (arboreal, herbaceous species andmicroorganisms) is so high that little NH4
+ remains fornitrifiers (Jansson 1958; Paul and Juna 1981; Attiwilland Leeper 1987). Most of the NH4
+ is either taken upor immobilised.
StManagment-gs Final.pdf 1/31/01 8:29 PM Page 7 (Black plate)

Effects of Site Management in a Eucalyptus grandis Plantation in the Humid Tropics: S�o Paulo, Brazil8
ConclusionsAt 6 months, height growth of the coppice (4.4 m)exceeded that of the seedlings. The higher initial growthof E. grandis coppice shoots compared with plantedseedlings is frequently observed in commercialplantations. However, by 39 months the growth ofcoppice was substantially poorer than all treatmentsexcept where all residue and litter was removed.
Burning the residues stimulated height growth upto 6 months of age. Where litter was retained (BL2) or allthe residues removed (BL0) height growth was poorest.This highlights the effect of the forest residues andnutrient management on the initial tree growth. Therewas a temporary stimulating effect on height growth dueto the high initial availability of nutrients released byburning and incorporation of residue.
The highest rates of N mineralisation (44 kg ha-1 yr-1)were found in the standing crop. Other treatments(residues were incorporated in the soil, and slash andlitter retained with minimum disturbance of the site)gave values of 35 and 33 kg ha-1 yr-1 respectively.
The removal or burning of the residues inhibited Nmineralisation; only 26 and 16 kg ha-1 yr-1 of N,respectively, were produced in these treatments.
The largest N mineralisation rates and differencesamong treatments were observed over the first 8 monthsafter clear-cutting. Subsequently fluctuations ofmineralisation rates were low in and among treatments.
The mineralisation rates of NH4+-N were much
higher than NH3+-N for all treatments, except for where
the residues were burned. The NH4+-N mineralised in
the standing crop (SC) in the 0-5 cm layer was muchhigher than NH3
+-N. This indicates a strong inhibitingeffect of the stand on the nitrification process.
The high rates of N mineralisation in the besttreatments provide a basis for one of the reasons whymost Brazilian eucalypt plantations have little or noresponse to N fertilisation.
Table 6. Nitrogen mineralisation in the form NH4+ and NO3
-, and NH4+ : NO3
- ratio during the first 21 months ofmeasurement in the litter and soil
Treatment N form N mineralised
Litter 0 - 5 cm 5 - 15 cm 15 - 30 cm Total
(kg ha-1)
SC NH4+ 0.4 57.2 11.3 5.2 74.1
NO3- 0.1 19.2 34.9 16 70.2
NH4+: NO3
- 4 3 0.3 0.3 1.1
BL1 NH4+ 3.3 17.7 10.6 18.4 50.0
NO3- 0.9 29.1 43.3 13.3 86.6
NH4+: NO3
- 3.6 0.6 0.3 1.4 0.6
BL0 NH4+ - 19.2 5 17 41.2
NO3- - 22.5 22.8 12.1 57.4
NH4+: NO3
- - 0.9 0.2 1.4 0.7
SLp NH4+ - 29.1 21.9 11.4 62.4
NO3- - 15.5 28.2 15 58.7
NH4+-N: NO3
--N - 1.9 0.8 0.8 1.1
SLb NH4+ - 11.9 -5.2 6.3 13.0
NO3- - 29.6 30.2 17.8 77.6
NH4+-N: NO3
--N - 0.4 -0.2 0.4 0.2
StManagment-gs Final.pdf 1/31/01 8:29 PM Page 8 (Black plate)

J.L.M. Gon�alves, M.I.P. Serrano, K.C.F.S. Mendes and J.L. Gava 9
ReferencesAttiwill, P.M. and Leeper, G.W. 1987. Forest soils and
nutrient cycles. Melbourne University Press,Carlton.
Barros, N.F., Novais, R.F. and Neves, J.C.L. 1990.Fertilização e correção do solo para o plantio deeucalipto. In: Barros, N.F. and Novais, R.F. (eds.)Relação Solo-Eucalipto, 127-186. Folha de Viçosa,Viçosa.
Bellote, A.F.J., Sarruge, J.R., Haag, P.H. and Oliveira,G.D. 1980. Extração e exportação de nutrientes peloEucalyptus grandis Hill ex-Maiden em função deidade: 1 - Macronutrientes. IPEF 20: 1-23.
Bremner, J.M. 1965. Organic nitrogen in soils. In:Bartholomew, W.V. and Clark, F.E. (eds.) Soilnitrogen. Agronomy 10: 93-149.
Carlyle, J.C. 1986. Nitrogen cycling in forestedecosystems. Forestry Abstracts 47: 307-336.
Gava, J.L. 1997. Efeito da adubação potássica emplantios de E. grandis conduzidos em segundarotação em solos com diferentes teores de potássiotrocável. In: Stape, J.L. 4
aReunião técnica sobre
manejo de brotação de Eucalyptus, 89-94. SérieTécnica IPEF. Piracicaba, Brazil.
Gonçalves, J.L.M. 1995. Efeito do cultivo mínimosobre a fertilidade do solo e ciclagem de nutrientes.In: Disperati, A.A., Ferreira, C.A., Machado, C.,Gonçalves, J.L.M. and Soares, R.V. (eds.) 1
o
Seminário Sobre Cultivo Mínimo do Solo emFlorestas. Curitiba, 43-60. IPEF-CNPf-SIF-FUPEF,Brazil.
Gonçalves, J.L.M. and Barros, N.F. 1999. Improvementof site productivity for short-rotation plantations inBrazil. Bosque 20: 89-106.
Gonçalves, J.L.M., Barros, N.F., Nambiar, E.K.S. andNovais, R.F. 1997. Soil and stand management forshort-rotation plantations In: Nambiar, E.K.S. andBrown, A.G. (eds.) Management of soil, nutrientsand water in tropical plantation forests, 379-418.ACIAR Monograph No. 43. ACIAR, Canberra.
Gonçalves, J.L.M., Poggiani, F., Stape, J.L., Serrano,M.I.P.S., Mello, S.L.M., Mendes, K.C.F.S., Gava, J.L.and Benedetti, V. 1999. Eucalypt plantations in thehumid tropics: São Paulo, Brazil. In: Nambiar, E.K.S.,Cossalter, C. and Tiarks, A. (eds.) Site managementand productivity in tropical plantation forests:
workshop proceedings 16-20 February 1998,Pietermaritzburg, South Africa, 5-12. CIFOR, Bogor.
Herbert, M.A. and Schönau, A.P.G. 1990. Fertilisingcommercial forest species in Southern Africa:research progress and problems (part 2). SouthAfrican Forestry Journal 152: 34-42.
Jansson, S.L. 1958. Tracer studies on nitrogentransformation in soil with special attention tomineralisation - immobilization relationships.Kunliga Lantbrukshogskolans Annaler 24: 100-361.
Maluf, J.L.P. 1991. Efeito da queima, métodos depreparo do solo e da adubação no crescimento de E.camaldulensis em areia quartzosa. M. Sc. Thesis.Universidade Federal de Viçosa, Viçosa. 78p.
McGill, W.B. and Christie, E.K. 1983. Biogeochemicalaspects of nutrient cycle interactions in soils andorganisms. In: Bolin, B. and Cook, R.B. (eds.) Themajor biogeochemical cycles and their interactions,271-301. Wiley, New York.
Paul, E.A. and Juna, N.G. 1981. Mineralisation andimmobilization of soil nitrogen by microorganisms.In: Clark, F.E. and Rosswall, T. (eds.) Terrestrialnitrogen cycles: processes, ecosystem strategies andmanagement impacts. Ecological Bulletin,Stockholm 33: 179-195.
Poggiani, F. 1985. Ciclagem de nutrientes emecosistemas de plantações florestais de Eucalyptus ePinus. Implicações silviculturais. AssociateProfessor Thesis. University of São Paulo, Brazil.
Raison, R.J., Connell, M.J. and Khanna, P.K. 1987.Methodology for studying fluxes of soil mineral-Nin situ. Soil Biology Biochemistry 19: 521-530.
Reis, M.G.F., Barros, N.F. and Kimmins, J.P. 1987.Acúmulo de nutrientes em uma seqüência de idadede Eucalyptus grandis Hill ex Maiden plantado nocerrado, em duas áreas com diferentesprodutividades, em Minas Gerais. Revista Árvore11: 1-15.
Theodorou, C. and Bowen, G.D. 1982. Effects of abushfire on the microbiology of a South Australianlow open (dry sclerophyll) forest soil. AustralianForestry Research 12: 317-327.
Tiarks, A., Nambiar, E.K.S. and Cossalter, C. 1998. Sitemanagement and productivity in tropical forestplantations. CIFOR Occasional Paper no. 16.CIFOR, Bogor. 11p.
StManagment-gs Final.pdf 1/31/01 8:29 PM Page 9 (Black plate)

IntroductionSince 1978, 42 000 ha of clonal Eucalyptus plantationshave been established around Pointe Noire by ECO sa(Eucalyptus du Congo Société Anonyme). Theseplantations are based on two natural hybrids(Eucalyptus PF1 and E. tereticornis x E. grandis) and,increasingly, on the artificial hybrid E. urophylla x E.grandis. The plantations consist of 9000 ha of firstrotation planted trees, 18 000 ha of coppice and 15 000ha of replanted sites. They are on sandy, acidic soilswith small reserves of available nutrients. Potentialrisks of nutrient and water deficiencies exist in themedium or long term. The sustainability of theseplantations has therefore been identified by UR2PI, anassociation of the Congo government, CIRAD and ECOsa for research and development, as a priority forresearch. Complementary studies focusing on this goalhave been conducted since 1997.
A long-term field study has been set up in asavanna and in a planted crop of E. PF1 clone 1-41 toquantify the main fluxes through the two ecosystems,and to establish comparative water balances and nutrientbudgets. First results relating to accumulation ofnutrients in the stands, atmospheric inputs, andchemistry of through fall and soil solutions are alreadyavailable (Laclau et al. 1999, 2000).
Other work has focused on the influence ofsuccessive rotations on changes in soil biologicalfertility (IRD 1999). The main changes likely inbiological factors as plantations get older are: higherlitter fall and increase of litter decomposition rateleading to enhanced nutrient cycling; increase of soilorganic matter in the top layer which may induce ahigher Cation Exchange Capacity; increase of parasiticnematode density with probable injurious effect oncuttings planted on former Eucalyptus areas; increasein abundance of earthworms and termites leading toimproved soil properties. The CIFOR/UR2PIexperiment includes two complementary trials, set upto assess harvesting methods and soil preparation forsustainable management of the replanted sites. Theaim of this paper is to present the current resultsobtained and the potential consequences for thesilvicultural practices.
Effects of Site Management on Eucalyptus Plantations in the Equatorial Zone,
on the Coastal Plains of the Congo
J.P. Bouillet1, J.D. Nzila2, J.P. Laclau1 and J. Ranger3
AbstractSustainability is a research priority for clonal eucalypt plantations planted on very sandy and poorsoils in the Congo. Results from a study using cloned Eucalyptus hybrids conducted since 1997 show:(1) a marked depressive effect on tree growth of removing slash and tree biomass after harvest; (2) ahigh risk of nutrient leaching in the first year after harvesting linked to the high rate of litterdecomposition; (3) a temporary starter effect of litter burning but a depressive effect in the mediumterm; and (4) a slow but lasting impact of burying litter. It is concluded that site management mustconserve a maximum amount of organic matter to ensure a sustainable production system. Debarkingand retention on site of the upper stem and other harvesting slash without burning is recommended.
1 UR2PI/CIRAD-Forêt, PO Box 1291, Pointe-Noire, Congo. Tel:+242 94 3184, Fax: +242 94 4795, E-mail: [email protected] UR2PI, PO Box 1291, Pointe-Noire, Congo. Tel: +242 94 3184, Fax:242 94 4795, E-mail: [email protected] INRA, Centre de Nancy, Equipe Cycles biogéochimiques,Champenoux, 54280 Seichamps, France. Tel: +33 4 83394068, Fax:+33 4 83394069, E-mail: [email protected]
3
StManagment-gs Final.pdf 1/31/01 8:29 PM Page 11 (Black plate)

Effects of Site Management on Eucalyptus Plantations in the Equatorial Zone, on the Coastal Plains of the Congo12
Location and Site DescriptionThe general plantations are established on coastalplains around Pointe-Noire (latitude 4°48'S, longitude11°5'E) with an elevation varying between 40 m and180 m. The climate is subequatorial with an annualrainfall of 1200 mm, a rainy season from October toMay (90% of the annual precipitation) and a dry seasonfrom June to September. Climatic conditions and soilshave been described in detail in Bouillet et al. (1999).The soils, developed on very deep continental detriticmaterial, are arenosols. They are characterised byhomogeneous sandy texture, limited available nutrients,very low levels of exchangeable cations, organic matterand small cation exchange capacity, and are highlyerodible. The soils on the trial sites share these generalcharacteristics.
Stand Description
Experiment 1Experimental details have been described previously inBouillet et al. (1999). Before planting, the originalsavanna vegetation was burnt, regrowth controlled andthe site ripped along the planting lines. The originalstand was E. PF1 clone 1-41 planted in 1990 at a spacingof 4.0 x 4.7 m. NPK fertiliser was applied at the base ofeach tree at a rate of 13.8 kg ha-1 N, 13.8 kg ha-1 P and22.3 kg ha-1 K. A further 26.0 kg ha-1 N, 26.0 kg ha-1 Pand 42.0 kg ha-1 K was applied after three years. Atharvesting in 1997, the stand had a mean height of 26.1m, basal area of 12.9 m2 ha-1 and standing volume underbark of 129 m3 ha-1. The stumps were weakened withglyphosate.
The second rotation trial was planted in 1998with clone E. PF1 1-41. Spacing was 2.7 x 4.7 m (800stems ha-1). NPK fertiliser (15.6 kg ha-1 N, 15.6 kg ha-1
P and 25.2 kg ha-1 K). was applied at the base of eachtree soon after planting. At 8 months, weeds werecontrolled with herbicide between the rows andmanually in the rows.
Experiment 2The stand was originally planted with E. PF1 clone 1-60in October 1981. The area was ploughed with a discharrow and then ripped along each planting row. Treespacing was 4.0 x 6.0 m (417 stems ha-1). Fertiliser, 100g NPK (13-13-21), was applied in the planting hole (5.4
kg ha-1 N, 5.4 kg ha-1 P and 8.8 kg ha-1 K). Weeding wascarried out mechanically with a disc harrow betweenthe rows and manually in the rows. Five passes werenecessary during the first three years. The first harvestwas in August 1988. During the second rotationweeding was carried out mechanically. No fertiliser wasapplied. The second harvest was in November 1994. Atthe end of this first coppice rotation, the yield was low(10 m3 ha-1 yr-1) and the plot had to be replanted.
After harvesting, the stumps were treated withtriclopyr and in April 1995 weeds were sprayed withglyphosate. In July and August 1995 the treatmentsincluding burning, ploughing or ripping wereestablished. Cuttings were planted in October 1995 at adensity of 800 stems ha-1. The blocks were monoclonal;E. PF1 clones 1-87 and 1-131, E. tereticornis x E.grandis clones 2-6, 2-45 and L2-123 and E. urophylla xE. grandis clone 18-52 were used. Weed control was at3, 6 and 19 months using glyphosate.
Experimental Design and Methods
Experiment 1The experimental design is a complete randomised blockwith four replications. A unit plot has a gross area of 0.26ha and an inner plot of 0.11 ha (88 trees) with two borderrows (112 trees). Harvest residue treatments were:
BL0 All above-ground residues removed from the plot.BL1 Whole-tree harvest. All above-ground components
of the commercial trees (stem diameter at breastheight > 11cm) were removed.
BL2 Stemwood + bark harvested. Only the commercial-sized boles (top-end over-bark diameter > 2 cm)and associated bark was removed.
BL3 Double slash. All the trees werere logged as in theBL2 treatment. The residue of the treatment and thatfrom BL1 were distributed on the ground.
BL4 Stemwood harvested. Only the commercial-sizedboles, debarked, were removed.
BL5 BL4 + residue burned.
Litter samples were collected before harvesting thestand. Litter decomposition was assessed as follows:samples were collected every three months fromSeptember 1998 to December 1999, from blocks 1 and 3,for BL1, BL2, BL3 and BL4 treatments. For each of the
StManagment-gs Final.pdf 1/31/01 8:29 PM Page 12 (Black plate)

J.P. Bouillet, J.D. Nzila, J.P. Laclau and J. Ranger 13
three inter-row types, four samples were collected toquantify remaining biomass, and pooled for mineralcontent estimation. Litterfall was collected weekly usingtraps 50 cm square, for each treatment of block 1. Thesesamples were used to estimate biomass and pooled at theend of each month for mineral content determination.
Two hundred soil samples were taken before standharvesting from depths of 0-10, 10-20, 20-50, 50-70 and70-100 cm. One year after planting (April 1999)samples were collected again in the same way. SinceNovember 1998, N mineralisation by in situ methods(Raison et al. 1987) was measured every two weeks forBL0, BL3 and BL4 of block 1. However it must bestressed that all the tubes were open, with cationic oranionic resins placed at the bottom of each to retainleached mineral-N (Jussy 1998).
Weed development was estimated as an index ateight months. A rope was put along the two diagonals ofeach inner plot and the weed re-establishment rate wasdefined as the ratio between the length of the rope restingon weeds and the length of the two diagonals expressed asa percentage.
Twelve trees were sampled to quantify above groundbiomass and nutrient content of the stand beforeharvesting. Regression equations relating biomass andnutrient content of each tree component to the girth atbreast height were developed (Bouillet et al. 1999). Thesetables were applied to the inventory data to estimate thebiomass of the stands. The same approach was used toestimate the above ground biomass and nutrient contentfor BL0, BL3, BL4 and BL5 of block 1 one year afterplanting (end of the rainy season).
Experiment 2The experimental design was a composite of three littertreatments and three site preparation treatments. The grossexperimental unit is 0.42 ha and the inner plot 0.13 ha withfour border rows.
Litter and soil preparation treatments were:C undisturbed (control) D incorporated with a disc harrowB controlled burnNS no subsoiling1T subsoiling using one tine3T subsoiling using three tines
Fifty-four litter samples were collected, five monthsafter the coppice harvesting. At the same places, soilsamples were taken at 0-10 cm and 10-20 cm (54 samplesfor each level). Thirty-six other soil samples were takenfor the treatment NS x B, immediately after burning.Samples were taken again, one year after planting.
Results
Experiment 1Biomass and nutrient contentThe aboveground biomass and nutrient content of the treesbefore clearfelling were reported by Bouillet et al. (1999).The average biomass of the stand was ca 118 t ha-1
corresponding to 316 kg ha-1 N, 48 kg ha-1 P, 199 kg ha-1 K,74 kg ha-1 Ca and 48 kg ha-1 Mg. The biomass, one yearafter planting, of the stands for BL0, BL3, BL4 and BL5, isgiven in Table 1. Determination of the correspondingnutrient content is still in process.
Table 1. Biomass of the aboveground components of the trees for BL0, BL
3, BL
4and BL
5at 12 months in Experiment 1
Components Treatments
(t ha-1) BL0
BL3
BL4
BL5
Wood (diameter >1 cm o.b.) 2.07 a 2.69 a 2.28 a 2.61 a
Bark (diameter > 1 cm o.b.) 1.13 a 1.46 b 1.50 b 1.82 c
Live leaves 0.64 a 3.29 bc 2.93 b 3.56 c
Branches + top stem 2.07 a 2.28 ab 2.38 ab 2.70 b
Total stand 5.91 a 9.71 b 9.09 b 10.68 b
Letters a and b indicate significant differences between treatments according to Bonferroni test (threshold : 5%).
StManagment-gs Final.pdf 1/31/01 8:29 PM Page 13 (Black plate)

Effects of Site Management on Eucalyptus Plantations in the Equatorial Zone, on the Coastal Plains of the Congo14
BL0 had a significantly lower total biomass and avery poor crown development (0.64 t ha-1 of leavescompared with an average of 3.26 t ha-1 for the othertreatments). Conversely the highest biomass was in BL5,where litter was burnt.
Tree growthUp to 12 months, there were no significant differences inheight and diameter between treatments, but at 18 monthstree growth in BL0 was significantly lower than in BL3.There is also a tendency to a better growth for treatmentswith an initial higher amount of organic matter (BL3 andBL4) and for BL5 (Table 2).
Nitrogen mineralisationThere is no significant difference between treatments onnet N mineralisation. However higher values wereobserved in BL3: amounts produced in BL0, BL3, and BL4,between 7 and 19 months, are 49.1 kg ha-1, 57.8 kg ha-1,
and 45.5 kg ha-1 respectively (Figure 1). The trend to agreater mineral-N production for the double slashtreatment is due to a higher nitrification rate: NO3
--Nproduction is significantly larger in BL3 than in BL0
(Table 4). We emphasise that net nitrification representsrespectively 63%, 76% and 69% of net N mineralisationfor BL0, BL3 and BL4.
Table 2. Height and circumference of trees at 18 months in Experiment 1
Parameters Treatments
BL3 BL5 BL4 BL2 BL1 BL0
Height (m) 8.64 a 8.49 ab 8.31 ab 8.28 ab 7.99 ab 7.72 b
Circumference (cm) 26.36 a 25.17 ab 24.85 ab 24.14 abc 22.48 bc 21.37 c
Letters a, b, c indicate significant differences between treatments according to Bonferroni test (threshold: 5%).
Understorey developmentThe understorey is mainly monocotyledons (Loudetiaarundinacea and Panicum maximum), except in block 2which was invaded by Chromolaena odorata. Weed re-growth indices at eight months are given in Table 3. Therewere significant differences between treatments with moreweeds where there was less slash retained.
Table 3. Weed regrowth index (WRI) at 8 months inExperiment 1
Treatments BL0 BL2 BL1 BL5 BL4 BL3
WRI (%) 86 a 78 a 77 ab 67 ab 56 b 42 c
Letters a, b, c indicate significant differences between treatmentsaccording to Bonferroni test (threshold: 5%).
Figure 1. Changes in net N mineralisation from November 1998 to November 1999.Quantities produced during two weeks in 0-15 cm soil layer in Experiment 1
-2
-1
0
1
2
3
4
5
6
7
8
17.11
.98
16.1
2.98
19.0
1.99
16.0
2.99
16.0
3.99
13.0
4.99
11.0
5.99
22.0
6.99
20.0
7.99
17.0
8.99
14.0
9.99
12.1
0.99
09.11
.99
Sampling Dates
Nit
roge
nm
iner
alis
atio
nkg
Nha
-1
BL0 BL3 BL4
StManagment-gs Final.pdf 1/31/01 8:29 PM Page 14 (Black plate)

J.P. Bouillet, J.D. Nzila, J.P. Laclau and J. Ranger 15
Litter decompositionInitially, the amount of slash in BL1 was half that of BL2
and BL4 and a third of BL3 (Table 5), but at 15 monthsthe differences between treatments were much less.Almost all leaves and bark were decomposed and theslash remaining made up mainly of dead branchesalready fallen at the end of the previous rotation orbroken during harvesting. Their amounts were similar inthe different treatments.
Experiment 2
Tree growthLitter treatmentsLitter burning induced better growth during the firstyear, but this effect disappeared during the second year.In the third year, average growth in undisturbed litterand buried litter treatments was significantly better thanin the litter burning treatments: 16.1 m3 ha-1 yr-1
compared to 14.2 m3 ha-1 yr-1.
Table 4. Mean net nitrification and ammonification.Quantities produced during two weeks in 0-15 cm soillayer, between ages 7 and 19 months in Experiment 1
Treatments N-NO3- N-NH4
+
(kg ha-1)
BL3 1.70 a 0.53 a
BL4 1.20ab 0.54 a
BL0 1.18 b 0.70 a
Letters a and b indicate significant differences between treatmentsaccording to Bonferroni test (threshold: 5%).
Soil preparation treatmentsSignificant differences on total volume incrementbetween subsoiling with three tines (9.2 m3 ha-1 yr-1) andno subsoiling (7.6 m3 ha-1 yr-1) were found at 11 monthsbut at 21 months and 36 months these treatments wereno longer significantly different.
Growth of trees in different rows within plotsIn logged areas, three types of interrows can beidentified (Bouillet et al. 1999):l slash interrows well stocked with leaves, bark,
branches and twigs;l log interrows used to store debarked wood; andl haulage interrows (used by machines collecting the
crop) contain a small amount of litter and havecompacted soil.
At 36 months, production on haulage interrows(14.2 m3 ha-1 yr-1) was lower than on log interrows (15.4m3 ha-1 yr-1) and slash interrows (16.7 m3 ha-1 yr-1). Thechanges of main effects are comparable, for each typeof interrow, to those observed previously on the entireplots. It must be stressed that significant differencesbetween subsoiling with three tines and no subsoilingstill exist at 36 months on slash interrows, but not on theother interrows (Table 6). Hence, subsoiling effect ismainly linked to a better organic matter mineralisation,but not to the decompaction of the soil: a higher increaseof production is thus observed on slash interrows,characterised by an abundant litter. Therefore, thedifferences of production between interrows can beexplained by the amounts of organic matter andbiological activity but not due to soil compaction.
Table 5. Changes in slash quantity (S) in t ha-1 and decomposition rate (D) as a proportion of initial weight (%)in Experiment 1
Treatment Before harvest After harvest 6 months 9 months 12 months 15 months
S S S D S D S D S D
BL1 12.66 16.07 9.99 37.8 7.44 53.7 5.91 63.2 5.14 68.0
BL2 14.81 30.22 14.23 52.9 9.33 69.1 6.78 77.6 5.48 81.9
BL3 13.08 49.38 17.11 65.4 13.75 72.2 9.47 80.8 6.08 87.7
BL4 13.04 33.93 14.38 57.6 9.03 73.4 7.02 79.3 5.61 83.5
StManagment-gs Final.pdf 1/31/01 8:29 PM Page 15 (Black plate)

Table 7. Growth of trees in treatment combinations at age 36 months in Experiment 2
D/NS C/3T D/3T D/1T C/1T C/NS B/3T B/1T B/NS
m3 ha-1 yr-1
16.5 a 16.1 a 16.1 ab 15.7 ab 15.2 ab 14.9 ab 14.7 ab 14.1 bc 13.8 c
Letter a, b, c indicate significant differences between treatments according to Bonferroni test (threshold: 5%).
Effects of Site Management on Eucalyptus Plantations in the Equatorial Zone, on the Coastal Plains of the Congo16
Combined treatmentsAt 11 and 21 months the best growth was when litterburning was combined with subsoiling with three tines.But at 36 months the best growth was in plots where thelitter had been buried or conserved while plots whichincluded controlled burning of the litter had weakergrowth (Table 7).
Discussion
Experiment 1
Tree growth and biomassRemoving all slash including litter (BL0) depressedcrown development and tree growth. The opposite effectwas observed when high amounts of slash are retained.Decomposition of the leaves of harvested trees hasalready had a positive impact on growth (BL2 is slightlybetter than BL1). A similar conclusion can be made forbark decomposition (BL4 vs BL2). The initial impact ofslash burning is still evident at 18 months. This result isconsistent with previous observations on Experiment 2(Nzila et al. 1998). It will be important to quantify thereal impact of this site preparation in the coming years.
Understorey developmentRegardless of the treatment, there was abundant growthof weeds, with the index and cover increasing from 5%
before harvesting to more than 40% eight months afterplanting. However, this weed development is greatlyreduced if a large amount of slash is retained, as in BL3
and BL4. Weed development is not particularly strongwhere there was controlled burning of slash residues.This result is consistent with previous observations inExperiment 2 (UR2PI 1999).
Nitrogen mineralisationGonçalves et al. (1999a) found high rates of Nmineralisation when high amounts of residues weremaintained at the soil surface in Eucalyptus grandisplantations located on oxisols in Brazil. The authorspoint out the better conditions for mineralisation(cooler temperature and more substrate for the soilmicroorganisms to process) in comparison with BL0.Such results were also observed in Australia inEucalyptus globulus plantations located on grey sandsites (O’Connell and Grove 1999; O’Connell et al.1999). However, in our study, N mineralisation in BL0
was not less than in a single slash treatment, such asBL4. It will be important to observe if Nmineralisation in BL4 treatment increases in the nearfuture above the level of the BL0 plots, as observed inAustralia from the second year after standestablishment in Pinus plantations growing on sandypodzols (Smethurst and Nambiar 1990) or from thethird year after planting in Eucalyptus standsestablished on red earth sites (O’Connell et al. 1999).
Table 6. Comparison of the mean annual increment on different subsoiling treatments and interrow types at 36 monthsin Experiment 2
Interrow type Subsoiling using 3 tines Subsoiling using 1 tine No subsoiling
(m3 ha-1 yr-1)
Haulage interrow 14.72 a 14.04 a 13.97 a
Log interrow 15.34 a 15.13 a 14.55 a
Slash interrow 17.54 a 16.92 a 15.56 b
Letters a and b indicate significant differences between treatments according to Bonferroni test (threshold: 5%).
StManagment-gs Final.pdf 1/31/01 8:29 PM Page 16 (Black plate)

J.P. Bouillet, J.D. Nzila, J.P. Laclau and J. Ranger 17
In this study the nitrification is higher thanammonification, contrary to the results obtained inBrazil by Gonçalves et al. (1999a) or in Australia byO’Connell et al. (1999), but in agreement with theresults of Smethurst and Nambiar (1990) from thesecond year after replanting. Therefore in the Pointe-Noire region there is a risk of marked N leaching in theyoung stand stage, when the stand uptake is limited by aroot system that is not well developed.
The net N mineralisation in the 0-15 cm layer issimilar, about 50 kg ha-1 for a stand age ranging between7 and 19 months, for the different treatments. Severalother points merit consideration here:l even though the analyses are still in progress, it can be
assumed that the amount of N accumulated by youngtrees in BL3 or BL4 in the first year after replantingmust be of the same magnitude (ca 50 kg ha-1);
l a large part of NO3-N mineralised may have beenleached in the first year after replanting;
l the starter fertilisation provided only 16 kg ha-1 of N, apart of which would have been lost by leaching;
l the atmospheric inputs were low (ca 5 kg N ha-1 yr-1);l the pool of mineral-N in the soil is low (Fig 2).It appears that trees must take up a large part of the Nrequired from the decomposing forest floor, removed inBL0. This interpretation is consistent with the markedresponse to N fertilisation observed on the replantedsites (Safou-Matondo and Bouillet 1999).
Even though the rate of N mineralisation is of thesame order of magnitude as in Brazil (Gonçalves et al.1999a) and in Australia (Smethurst and Nambiar1990), a methodological problem seems to occur atour site. During the rainy season a higher watercontent is observed inside the incubated cylinders, upto double the field capacity (Fig. 3). This may be dueto soil compaction when setting the cores (Jussy1998). This water accumulation could be alsoexplained by the discontinuity existing between theincubated soil and the actual soil, due to the resin layerput at the bottom of the cores. Similar observationswere made with plate lysimeters in a nearby stand.
0
1
2
3
4
5
Sampling Dates
17.11
.98
16.1
2.98
19.0
1.99
16.0
2.99
16.0
3.99
13.0
4.99
25.0
5.99
22.0
6.99
0.07
.99
17.0
8.99
14.0
9.99
12.1
0.99
09.11
.99
Min
eral
Nkg
Nha
-1
Mineral N
N-NO3
N-NH4
0
5
10
15
20
+
17.1
1.98
15.1
2.98
19.0
1.99
16.0
2.99
16.0
3.99
27.0
4.99
25.0
5.99
22.0
6.99
20.0
7.99
17.0
8.99
14.0
9.99
12.1
0.99
9.11
.99
Sampling Dates
Gra
vim
etric
wat
erco
nten
t(%
)
0
50
100
150
200
250
Pre
cipi
tatio
ns(m
m)
P (mm)incubated soilscontrol soils
Figure 2. Changes in mineral-N pool, in field-incubated soils (means of BL0, BL3 and BL4
treatments), during two weeks in 0-15 cm soil layer in Experiment 1
Figure 3. Soil water content in incubated soils and control soils (means of BL0, BL3 and BL4
treatments)
StManagment-gs Final.pdf 1/31/01 8:29 PM Page 17 (Black plate)

Effects of Site Management on Eucalyptus Plantations in the Equatorial Zone, on the Coastal Plains of the Congo18
The high soil water content could decrease Nmineralisation by reducing aerobic microorganismactivity (Sanchez 1976). Losses of N by denitrificationcould also occur (Jussy 1998). Tests were performed toadapt this methodology to the local site conditions. Amethodology (Raison et al. 1987, Smethurst and Nambiar1990, Weston and Attiwill 1996) using open and coveredcores without resins at the bottom of the cylinders wastested. After two weeks with 122 mm of rain the watercontent was the same in the control soil and in the coveredcores, but a higher moisture content was observed in theopen cores especially when resin was present at the baseof the core (Table 8).
Other experiments lead to consistent results(Table 9) with a higher soil water content in the cylinderscontaining resins. However the comparison of bothmethods indicates that greater values of net Nmineralisation are observed with open cores and resins.This difference may be partly a consequence of theleaching by rainfall of N mineralised in the litter. Weconclude that the methods using open cores with resins atthe bottom shows rates of mineralisation consistent withthe accumulation of N in the stands and so is appropriateto assess N mineralisation in soils at Pointe Noire.
Litter decompositionA large proportion of organic matter (68-88%)disappeared in 15 months, corresponding to an annual
decomposition coefficient (k) of 0.54 to 0.70. If weassume that the decomposed parts were mainly leaves,bark and twigs but not large branches, these results areconsistent with previous studies. In the Congo,Bernhard-Reversat (1993) found k values of 0.61 forleaves and 0.24 for total litter for a 10-year-old standof E. tereticornis x E. grandis. In Australia, Attiwill etal. (1995) reported k values of 0.2 to 0.4 for litter ineucalypt forests.
The rate of decomposition of the litter wasparticularly high during the first six months afterharvesting: 38% (BL1) to 65% (BL3) of the slashdisappeared during this period. A similar observationwas made in Brazil (Gonçalves et al. 1999b) where34% of the litter decomposed during the first sixmonths following the clearcut of a 7-year-old E.grandis stand, where the slash had been removed.Thus, the risk of nutrient leaching is high, especially ifthere is a long interval between clearfelling andplanting.
Experiment 2Initially, treatments with burnt slash residues had ahigher production. This starter effect can be explainedby the rapid release of nutrients by litter combustion.Soil analyses at one year confirm the increase of base
Table 8. Changes in soil water content in incubated soils according to three types of cores and in control soils fortreatments BL0 and BL3 of Experiment 1
Control soil Control soil Covered cores Open cores Open cores + resins
(1) (2)
Soil water content %
BL0 4.4 8.3 9.2 10.2 12.3BL3 4.3 8.7 7.7 9.9 14.9Mean 4.4 8.5 8.5 10.1 13.6
Period: 26 October; (1) - 9 November 1999; (2). Precipitation: 122 mm.
Table 9. Soil water content and net N mineralisation in incubated 0-15cm soil layer in treatment BL4 of Experiment 1
Period Covered cores Open cores + resins
Water content (%) Net mineralisation Water content (%) Net mineralisation
(kg ha-1) (kg ha-1)
04/01/00 - 18/01/00 5.1 -3.56 9.7 -1.9218/01/00 - 01/02/00 10.8 2.49 19.1 4.2001/02/00 - 15/02/00 6.5 5.32 11.3 6.08
StManagment-gs Final.pdf 1/31/01 8:29 PM Page 18 (Black plate)

J.P. Bouillet, J.D. Nzila, J.P. Laclau and J. Ranger 19
cation availability in the topsoil of the burnt treatments(Bouillet et al. 1999), but burning also leads to a loss ofsignificant quantities of nutrients by volatilisation orleaching since after three years the trees are lessvigorous. Conversely, if the litter is incorporated or leftundisturbed there is a slow and continuousmineralisation of organic matter.
Subsoiling using three tines had a significantpositive effect during the first year. This may beexplained by a quicker organic matter mineralisation butnot by the decompaction of the interrow as this impact ismarked only on slash interrows. We note that a Nmineralisation increase due to litter incorporation wasalso observed in a young Pinus radiata plantation(Smethurst and Nambiar 1990). After three years, theplanting hole technique resulted in stand growth similarto subsoiling.
ConclusionsThese initial results show that management of organicmatter of sandy and poor soils is of paramountimportance to ensure ecosystem sustainability. Treegrowth, but more generally soil quality, is stronglylinked to the soil organic matter content mainly throughmineral-N production. These results show that sitemanagement is able to quickly change the soil organicmatter status.
From a practical point of view it is recommendedthat the maximum quantity of slash be retained on thesite i.e. debarking and retention of the upper stem andcrown on site. Slash must not be burnt but incorporatedin the soil with a disc harrow or left undisturbed. Thefirst option is preferred, especially if uncontrolled fire isa possibility, but the ground slope must be gentle (< 2-3%) because of high erosion risks on these soils.Subsoiling is likely to be of little benefit.
AcknowledgementsThe authors are grateful to the Center for InternationalForestry Research for supporting their participation inthe workshop in Kerala, to the International Foundationfor Science for financial contributions for equipmentand chemical analyses, and to ECO sa and UR2PI forestablishing and conducting the trials.
ReferencesAttiwill, P.M., Polglase, J.P., Weston, C.J. and Adams,
M.A. 1996. Nutrient cycling in forests of south-easternAustralia. In: Attiwill, P.M. and Adams, M.A. (eds.)Nutrition of eucalypts, 191-224. CSIRO, Australia.
Bernhard-Reversat, F. 1993. Dynamics of litter andorganic matter at the soil interface in fast-growingtree plantations on sandy ferralitic soils (Congo).Acta Oecologica 14: 179-195.
Bouillet, J.P., Nzila, J.D., Ranger, J., Laclau, J.P. andNizinski G. 1999. Eucalyptus plantations in theequatorial zone, on the coastal plains of the Congo.In: Nambiar, E.K.S., Cossalter, C. and Tiarks, A.(eds.) Site management and productivity in tropicalplantation forests: workshop proceedings 16-20February 1998, Pietermaritzburg, South Africa, 13-21. CIFOR, Bogor.
Gonçalves, J.L.M., Gava, J.L., Serrano, M.I.P. andMendes, K.C.F. 1999a. Eucalypt plantation in humidtropics: Sao Paulo, Brazil. Paper to workshop on sitemanagement and productivity in tropical plantationforests, 7-9 December 1999, Kerala, India. 5p.
Gonçalves, J.L.M., Poggiani, F. and Stape, J.L. 1999b.Eucalypt plantations in the humid tropics: Sao Paulo,Brazil. In: Nambiar, E.K.S., Cossalter, C. and Tiarks,A. (eds.) Site management and productivity intropical plantation forests: workshop proceedings16-20 February 1998, Pietermaritzburg, SouthAfrica, 5-12. CIFOR, Bogor.
IRD 1999. Change towards forest environment whenEucalyptus are planted on savanna soils: biologicalfactors of fertility as affected by plantationmanagement. IRD(ORSTOM) /UR2PI /CIFORagreement report, I scientific part. 12p.
Jussy, J.H. 1998. Minéralisation de l’azote, nitrificationet prélèvement radiculaire dans différentsécosystèmes forestiers sur sol acide. Effets del’essence, du stade de développement du peuplementet de l’usage ancien des sols. Thèse de Doctorat,Université Henri Poincaré, Nancy I. 156p.
Laclau, J.P., Ranger J., Nzila, J.D. and Bouillet, J.P.1999. Study of biogeochemical cycles in a maturestand of eucalypt and adjacent savanna in Congo.Paper to workshop on site management andproductivity in tropical plantation forests, 7-9December 1999, Kerala, India. 5p.
StManagment-gs Final.pdf 1/31/01 8:29 PM Page 19 (Black plate)

Effects of Site Management on Eucalyptus Plantations in the Equatorial Zone, on the Coastal Plains of the Congo20
Laclau, J.P., Bouillet, J.P. and Ranger, J. 2000. Thedynamics of biomass and nutrient accumulation in aclonal Eucalyptus plantation in Congo. ForestEcology and Management 128: 181-196.
Nzila J.D., Bouillet J.P. and Hamel O. 1998. Effets de lalitière et du travail du sol sur la fertilité des solssableux sous Eucalyptus de replantation au Congo.Paper to the World Congress of Soil Sciences,Montpellier, 20-26 August 1998. 6p.
O’Connell, A.M. and Grove, T.S. 1999. Eucalyptplantations in South-Western Australia. In: Nambiar,E.K.S., Cossalter, C. and Tiarks, A. (eds.) Sitemanagement and productivity in tropical plantationforests: workshop proceedings 16-20 February 1998,Pietermaritzburg, South Africa, 53-59. CIFOR,Bogor.
O’Connell, A.M., Grove, T.S., Mendham, D., Rance,S.J. 1999. Eucalypt plantations in South-WesternAustralia. Paper to workshop on site managementand productivity in tropical plantation forests, 7-9December 1999, Kerala, India. 13p.
Raison, R.J., Connell, M.J. and Khanna, P.K. 1987.Methodology for studying fluxes of soil mineral-N insitu. Soil Biology Biochemistry 19: 521-530.
Sanchez, P.A. 1976. Properties and management of soilsin the tropics. Wiley. New York. 618p.
Safou-Matondo, R. and Bouillet, J.P. 1999. Essaifactoriel NPK 33 sur replantation. Parcelle R97-8.Mensurations à 9, 13 et 18 mois. Report UR2PI,Pointe-Noire, Congo. 12p.
Smethurst, P.J. and Nambiar, E.K.S. 1990. Distributionof carbon and nutrients and fluxes of mineralnitrogen after clear-felling a Pinus radiataplantation. Canadian Journal of Forest Research 20:1490-1497.
UR2PI. 1999. Quatrième Conseil Scientifique du 25 au26 janvier 1999. Tournée de terrain du ProgrammeSylviculture et Environnement. Report UR2PI.Pointe-Noire, Congo. 51p.
Weston, C.J. and Attiwill, P.M. 1996. Clearfelling andburning effects on nitrogen mineralisation andleaching in soils of old-age Eucalyptus regnansforests. Forest Ecology and Management 89: 13-24.
StManagment-gs Final.pdf 1/31/01 8:29 PM Page 20 (Black plate)

Introduction Research conducted in hardwood plantations in SouthAfrica over the past 50 years has demonstrated thebenefits of early, intensive silviculture. Substantialimprovements in productivity have resulted from sitepreparation (Smith 1998), fertilisation at time ofplanting (Herbert and Schönau 1990, Herbert 1996, DuToit 1998) and management of competing vegetation(Little 1998). Site preparation options investigatedvary from soil tillage operations where virgin land wasafforested to the management of harvesting residue inreplanted areas. Research on harvesting impactsshowed current levels of soil compaction are unlikelyto have an adverse effect on productivity on the mostcommon soil types used for forestry in South Africa(Smith 1998). Soil disturbance and mixing caused bymechanised harvesting operations may significantlyaffect nutrient availability (Smith and Du Toit 1998),however, the processes governing the magnitude ofthis effect have not been quantified. There has beenresearch on potential effects of harvesting on thenutrient capital in various biomass pools of hardwoodstands (Herbert and Robertson 1991), but the dynamicprocesses of nutrient movement between pools havenot been studied in detail.
The impact of specific operations (harvesting orearly silviculture) on the nutrient capital and nutrientdynamics of the site needs to be quantified. Also, sincenutrient dynamics are strongly influenced by soil water,the interplay between water dynamics and nutrientdynamics needs examination. These aspects form thebasis of this project.
Objectives Short term objectives are to understand and quantify theprocesses governing nutrient accretion across a range ofsilvicultural management options in young tree stands,specifically: (1) rate of macronutrient release fromharvesting residue, (2) N and P supplying capacity of thesoil, (3) rate of macronutrient uptake by trees, (4) nutrientcontent and quantity of litter fall as affected by treatments,and (5) carbon cycling and its effect on nutrient dynamics.Also to evaluate the effects of soil water availability andthe microclimate on these processes.
Effects of Site Management in Eucalyptusgrandis Plantations in South Africa
B. du Toit1, L.J. Esprey1, R.A. Job1, G.F. Fuller1 and S.D. Dovey1
AbstractThis project investigates the effects of early, intensive management operations on stand productivityand long-term nutritional sustainability in Eucalyptus grandis plantations. The design, layout andobjectives (including crop rotation treatment with Acacia mearnsii) are discussed. Before clear fellingthe previous eucalypt crop, the stand characteristics and biomass in the various ecosystemcomponents were assessed. The standing volume was 147 m3 ha-1. Biomass of stem wood, harvestresidue, forest floor, stumps and roots amounted to 124, 40, 70, 20 and 63 t ha-1, respectively.Treatment implementation (harvesting operations, slash management and re-establishment) aredescribed. Changes in the mass of the forest floor plus harvesting residue over time are illustrated. Atthe time of planting the residue in the double slash, single slash and burnt treatments amounted to169, 117 and 31 t ha-1, respectively. Initial indications are that nutrient availability in the fertilised,slash burnt and slash disturbed treatments is responsible for the superior growth responses recorded.
1 Institute for Commercial Forestry Research, P.O. Box 100281,Scottsville 3209, South Africa. Tel: +27 33 386 2314, Fax: +27 33 3868905, E-mail: [email protected]
4
StManagment-gs Final.pdf 1/31/01 8:29 PM Page 21 (Black plate)

Effects of Site Management in Eucalyptus grandis Plantations in South Africa22 Effects of Site Management in Eucalyptus grandis Plantations in South Africa22
Medium to long-term objectives are to: (1)quantify changes in nutrient capital of the site due tosilvicultural and harvesting treatments, (2) quantifychanges in soil physical properties induced throughcompaction and site preparation, and (3) place thevariations in nutrient and water dynamics in the broadercontext, through additional measurements in a matureeucalypt stand, a developing acacia stand and virgingrassland.
Location and Site DescriptionThe Karkloof experiment is located near Howick in theMidlands of KwaZulu-Natal (KZN) province, SouthAfrica. Site location and climatic data are presented inTable 1 (interpolated from various sources) and for theCedara Agricultural College (a weather station with
long-term historical data, situated approximately 17 kmfrom the site).
Estimates of mean monthly rainfall and referencepotential evaporation from an open water surface (Er)have been calculated for the site, using the ACRUModel (Schulze et al. 1995). These values are presentedin Fig. 1 with the monthly value (0.3*Er) to demonstratethe approximate duration of the water deficit period andthe ‘moisture growing season’ on the site, according tothe FAO method cited by Schulze et al. (1995). Thestart of the moisture growing season is on day 244(Julian calendar, i.e. 1 September) and the end is on day105 (i.e. 15 April). The average duration is 226 days. Apronounced period of water deficit prevails in thewinter months of May to August (Fig. 1). Meanmonthly minimum and maximum temperatures areshown in Fig. 2. Light frost events occur sporadically
Table 1. Site location and weather data
Site Karkloof Project Cedara Agricultural College
Latitude 29¡ 24' S 29¡ 32' SLongitude 30¡ 12' E 30¡ 17' EAltitude 1260 m 1067 mMean annual rainfall ca. 950 mm1 877 mmRainfall concentration index 51%2 -Mean annual temperature ca. 15.2¡C3 16.2¡CRadiation (monthly min-max) - 15.9 - 27.8
(MJ.m-2.day-1)1 Mean value of seven stations recording only rainfall, located within a 5 km radius from the site with a mean recording period of 28.7 years;2 Based on the methodology of Markham (1970) as cited in Schulze (1997);3 Value estimated from adiabatic lapse rate for KZN (5¡C per 1000 m increase in altitude).
Median rainfall Mean reference evaporation
Month
Rai
n an
d ev
apor
atio
n (m
m)
J F M A M J J A S O N D
0
50
100
150
200 Moisture deficit period 0.3*Er
Figure 1. Mean monthly values for evaporation (Er),rainfall (P) and the value 0.3*Er (dark line) at the site (themoisture growing season occurs where P> 0.3 Er, i.e.Sept.-April)
Figure 2. Mean monthly minimum and maximumtemperatures at the site
15
20
25
30
Maximum temperature
Tem
pera
ture
(de
gree
s C
)
Minimum temperature
StManagment-gs Final.pdf 1/31/01 8:29 PM Page 22 (Black plate)

B. du Toit, L.J. Esprey, R.A. Job, G.F. Fuller and S.D. Dovey 23
during most winters and episodic snowfalls occur inthe region on sites with altitudes over 1150 m(Gardner and Swain 1996). Recording of climaticdata at the site started August 1998, about 6 monthsprior to trial establishment.
The soils suitable for forestry are dominated byhighly weathered soils derived principally fromsedimentary rocks (shale, sandstone and mudstone),with igneous (dolerite) intrusions. The gentlyundulating terrain at the site is derived from a mixtureof dolerite and shale of the Ecca group. An area witha relatively uniform soil profile and standcharacteristics (based on stocking and tree sizedistribution) was selected for the trial. Arepresentative soil profile is described in Table 2. Thesoil is classified as a Kranskop 1100 (FAOclassification = ferralsols). Soils in this group do nothave a well-defined macrostructure since the clayminerals are dominated by 1:1 clays andsesquioxides. A well-developed microstructureensures that the soils are stable, porous and well-drained. The potential for P fixation is high.
Stand DescriptionA stand of Eucalyptus grandis was established on virgingrassland in 1964. After the initial harvest, the stumpswere allowed to coppice and were harvested three times(1973, 1982 and 1991). The fourth and final crop fromthe stumps was clear felled during the last quarter of1998. It is common practice in the region to allow forone or two coppice crops. It is less common to allow athird coppice crop to grow to maturity, as was the caseon this site.
Following the standard recommendations, coppiceshoots are reduced to two or three stems per stump whenmean shoot height is 4 m and are then reduced to one ortwo stems per stump (depending on stump mortality)when mean shoot height is 8 m (Stubbings and Schönau1980). A spacing of 2.44 x 2.44 m was used in theoriginal stand giving an initial stand density of 1680stems ha-1.
Experimental Design and MethodsThe experimental design has been changed slightlyfrom the plan proposed by Du Toit et al. (1999). Thevegetation management treatments have beengrouped together in a separate trial that will beimplemented in 2000. The project is a set ofexperiments, consisting of a large, replicated trial,two satellite trials using smaller plots (forcompaction and vegetation management treatments)as well as several additional plots (grassland, matureeucalypt stand, crop rotation treatments, and shortrotation plots). The main E. grandis experiment ismade up of four replications of three core treatmentsand the five optional treatments.
The core treatments are:BL0 Slash removed: all harvesting residue (including
bark, branches and foliage) and litter layermanually removed from the plot.
BL2 Regular slash load: harvesting residue retainedand broadcast on the plot.
BL3 Double slash: material from the ‘slash removed’plot deposited on top of existing slash.
Table 2. Soil characteristics at the trial site
Horizon Depth of horizon Texture class Particle size analysis pH Organic
(cm) Clay (%) Silt (%) Sand (%) (KCl) carbon (%)
A 20 Clay 68 19 13 3.98 6.97
B1 40 Clay 68 14 18 4.09 3.27
B2 80 Clay 68 8 24 4.62 1.53
C 95 Silty clay 50 24 25 4.21 0.48
StManagment-gs Final.pdf 1/31/01 8:29 PM Page 23 (Black plate)

Effects of Site Management in Eucalyptus grandis Plantations in South Africa24
The optional treatments are:BS Slash burnt: harvesting residue burnt in a
medium intensity fire.SD Topsoil disturbed: slash disturbed and mixed
with soil through mechanical loading andstacking of timber with a three-wheeled loader.
SF Fertilised: regular slash load, followed by theapplication of an NP (+Zn) mixture.
SC Base cation replacement: regular slash load plusgypsum and lime treatment to be implemented infuture rotations.
SX For future use: regular slash load. No follow-uptreatment selected for this rotation to allow someflexibility in future.
Additional treatments with the E. grandis trial that areused to place nutrient dynamics in a broader contextinclude the following:G Virgin grassland: a plot of virgin grassland. M Mature crop: mature E. grandis coppice crop.R Crop rotation: group of plots where Acacia
mearnsii will be rotated with eucalypts.C Compaction: plots compacted by forwarders
during timber extraction. W Vegetation management: stand-alone trial with
various vegetation management treatments (to beimplemented in 2000).
E Stand density: plots with higher stand densitieson a shorter rotation span (to be implemented in2000).
Biomass and Nutrient Pools in the Pre-harvest StandThe standing crop was surveyed before clear felling. Theestimated site index was 18 m (SI5 - i.e. mean height ofthe 20% of trees with the largest diameter at thereference age = 5 years). During September 1998, theareas representing future measurement plots werelocated. The stem number per plot and the diameter atbreast height (dbh) of all trees in the plot were measured.The data was used to stratify standing trees into 18diameter classes weighted by frequency per hectare.Sample trees were selected from the midpoint for eachclass, felled, debranched and crosscut into 2.5 msections. A wood and bark disc was taken from eachsection to determine moisture content and to develop ataper equation for the stems. Bark was removed from thestem sections with thin end diameter > 7 cm over bark.Leaves and fruits (capsules) were removed from thebranches. Tree biomass was divided into the followingcomponents: stem wood (debarked) for each 2.5 msection, stem top with bark (i.e. the section of the main
leader < 7 cm diameter over bark), dead branches, livebranches > 3 cm diameter, branches < 3 cm diameter,bark from logs > 7 cm diameter, leaves and capsules ofthe current growing season, leaves and capsules olderthan the current season. This separation was made easyby the fact that old capsules had opened and youngcapsules not. All samples were weighed fresh in thefield, and representative subsamples collected formoisture and nutrient content determinations. Leaf areasof subsamples with known mass were determined byscanning with a LiCor(tm) Model LI 3100 Area Meter.
Three stumps with their root systems wereexcavated to estimate root and stump mass and to obtainsamples for nutrient content determination. An arearepresenting the spacing (2.44 x 2.44 m) was markedaround each of the stumps. Soil was excavated at: 0-20,20-60,and 60-100 cm (the bottom end of the deepestlayer graded into weathered rock). Four core sampleswere taken per layer to determine root (< 10 mmdiameter mass. The stump and all roots greater than 10mm diameter were sampled per layer, split into coarseand medium fractions (greater and smaller than 10 cmdiameter, respectively), airdried and weighed.Subsamples were taken for moisture and nutrientcontent determinations.
Pre-harvesting Preparations (November1998)Samples of forest floor were taken with a ringsampler of 30 cm diameter. They were separated intocoarse (> 10 mm) medium (2-10 mm) and fine (< 2 mm)fractions, and weighed. The fine and medium fractionscontained some soil and hence, the ash-free dry mass ofeach sample has been reported. In the BL0 (slashremoved) treatments, the bulk of the freshly fallen (L)layer was manually raked up into piles and transferred tothe BL3 (double slash) treatments. Old tree stumps weretreated with herbicide (glyphosate/triclopyr mix)between one and 14 days before clear felling (the ‘basalfrill treatment’ described by Little et al. (2000)).Coppice regrowth was not desirable as it would havenecessitated several coppice control operations andwould have altered the nutrient dynamics on site.
Harvesting and Slash ManagementTreatments Experimental treatments were laid out in December 1998.Plots were demarcated and all trees felled by chainsawand debarked manually. Logs were stacked in rowsoutside the plots. In the SD treatments, a three-wheeledloader with grapple was used to pick up all logs. This
StManagment-gs Final.pdf 1/31/01 8:29 PM Page 24 (Black plate)

B. du Toit, L.J. Esprey, R.A. Job, G.F. Fuller and S.D. Dovey 25
operation mimicked a loading operation since the loadertravelled in a zigzag fashion across virtually the entireplot (only the borders of the outer plots were notimpacted). The forwarder (25 t) was only allowed totravel in a predetermined path on the outside of the twolines of stacked timber. No vehicular traffic was allowedin the plots, except for the topsoil disturbed treatments. Inthe slash removed treatments the harvesting residue wasraked up and transferred to the double slash treatments.Internal firebreaks were cleaned between replications aswell as around the plots where the slash was burnt. Theslash was burnt in one medium intensity fire.
Re-establishment, Fertilisation and WeedControl Improved seeds of E. grandis were collected from trialEB 011K, of Sappi (Pty) and seedlings were raised in theICFR nursery. The original spacing was maintainedwhen the site was pitted for replanting because optimumeconomic returns on low productivity sites (such as thetrial site) can be obtained with a final stocking of 1400-1500 trees ha-1. Acacia mearnsii seedlings fromgenetically improved stock were used in crop rotationplots. The acacias were planted at a high stocking (2560stems ha-1) to accommodate for mortality, possible frostdamage, browsing by buck, and to permit a lightthinning. Eucalypt seedlings were planted on 3-4February 1999, following substantial rains (45 mmduring 1-3 February). A drench, consisting of 0.5 ml ofDeltamethrin (5% suspension concentrate) in one litre ofwater, was applied to seedlings at planting to preventproblems with insect pests. Acacia seedlings wereplanted on 9 February 1999. Eucalypt mortality ratewas assessed at 20 and 43 days after planting and deadtrees replaced (blanked). Blanking amounted to 2.5%overall. Eucalypts were fertilised with 90 g of mono-ammonium phosphate (MAP + Zn) per tree (16.6 kg N+ 33.2 kg P and 1.1 kg Zn ha-1). The acacias werefertilised with 76 g concentrated superphosphate per tree(39.2 kg P ha-1). The fertiliser was applied as a spottreatment 15 cm from the seedling. Fertiliser applicationrates were based on recommendations by Du Toit (1995,1999).The few coppice sprouts were removed manually.Weeds were controlled once in the first nine monthsafter planting by spot-spraying with glyphosate.
Slash Decomposition and NutrientAvailabilityTwo sets (each consisting of three bulked samples) ofharvesting residue plus forest floor (hereafter calledslash) were collected at three-monthly intervals from
each plot in the burnt, double slash and single slashtreatments (eight bulked samples per treatment persampling). To allow for differences in nutrient contentdue to differences in degree of decomposition, thesamples were separated into fine, medium and coarsefractions. After sieving, each fraction was oven-dried,weighed and analysed for macronutrient content.
The nitrogen mineralisation rate was determinedquarterly (Raison et al. 1997) incorporating somemodifications suggested by A.M. O’Connell, CSIRO,Australia (personal communication). The principalmodification was that the uncapped core used toestimate leaching losses was omitted. Topsoil sampleswere also collected quarterly (using soil cores) to studythe fluctuations in soil organic C and plant-available P.
Tree Growth, Leaf Area Development andNutrient UptakeHeight of all trees in the measurement plots wasmeasured every three months.. The followingmeasurements are taken each six weeks from 16 treesper plot: height (Ht), crown diameter (CD), live crownlength (CL), and ground level diameter (GLD). Biomassindex (BI) of individual trees were calculated as a non-destructive measure of tree performance (Eccles et al.1997) using the formula:
BI = mean Ht x (GLDq)2 x stocking (where GLDq is thequadratic mean diameter).
Leaf surface index (LSI) (modified from the method ofShiver and Knowe 1990) was calculated as CD x CL.
Four trees per treatment were selected fordestructive sampling at quarterly intervals. Thesesamples were divided into foliar and woody componentsand weighed. Subsamples were taken for nutrient andmoisture content and leaf area determinations.
Climatic Variables and Soil Water ContentsAn automatic weather station (AWS), installed in July1998 on a farm 2 km north of the trial, records the airtemperature, relative humidity, solar radiation, rainfall,wind speed and direction. The data logger attached tothe AWS has been programmed to calculate referenceevaporation from a short grass surface, using thePenman-Monteith equation (Monteith 1965). Throughthe use of suitable crop coefficients, Er can betransformed to an equivalent Er for E. grandis. Anadditional rain gauge has been installed in the
StManagment-gs Final.pdf 1/31/01 8:29 PM Page 25 (Black plate)

Effects of Site Management in Eucalyptus grandis Plantations in South Africa26
grassland plot on the trial site for purposes ofcomparison with the AWS.
The water retention characteristics data are beingdetermined using undisturbed soil cores. Variations insoil water content (SWC) are monitored through anetwork of loggers and sensors. Instrumentation usingfrequency domain reflectometry (FDR) technologywas installed during February and May 1999 andcomprises two CR10 loggers and 15 CS615 soil watersensors. These sensors have been placed within theBL2, BL3, SB and SD treatments, in two of the fourreplications, and measure the SWCs at a depth of 0.15m. Variations in soil water content in the deeper layersare currently monitored on weekly intervals with aneutron moisture meter.
Results
Characteristics and Biomass of the Standbefore Harvest The mean stocking at harvest was 1461 stems ha-1 from1306 stumps ha-1, an average of 1.1 stems stump-1.Sample tree height was regressed against dbh as:
Ht = 24.25 - 27.75 x 0.8860(dbh) (n = 18; s.e. = 0.72;variance accounted for = 92.5%)
The mean dbh of the stand was 134 mm in theseven year-old stand (Figure 3) and the estimated topheight 21.1 m (mean height of the 20% of trees withgreatest dbh). Basal area was 23.3 m2 ha-1 and theutilisable timber volume 147 m3 ha-1. The stand had aleaf area index of 3.2.
The biomass of components is shown in Table 3.Nutrient content analyses of the biomass componentshave not been completed. The mass of abovegroundcomponents was slightly lower than that of another E.grandis crop of similar age grown on a comparable site(Herbert and Robertson 1991). This was probablybecause the stand in this study is fourth coppicecompared to the stand used by Herbert and Robertson(1991) which was based on trees grown from seedlings.The litter accumulation under the stand was large (70 tha-1) and this is assumed to be primarily due to the coolclimate of the site and associated slow decompositionrate. The amount found in this study is high compared totropical plantations (O’Connell and Sankaran 1997).
The root biomass was 30% of the total biomass,which exceeds the range of 4-11% for tropical plantationspecies given by Vogt et al. (1997) by a large margin.Two factors may have contributed to this: (1) the age ofthe root system is 34 years and that of the pre-harvestcoppice crop is 7 years, and (2) the bulk of the entireroot system that has roots > 10 mm diameter has beenexcavated at each sampling since the excavationextended into the weathered rock in each case. Thisdiffers from most studies where the soil depth is muchdeeper than the zone of root sampling.
4050
0
20
40
60
80
100
120
140
160
180
200
70 90 110 130 150 170 190 210 23060 80 100
Diameter class midpoint (mm)
Fre
quen
cy (
stem
s ha
-1)
120 140 160 180 200 220 240
Figure 3. Diameter class distribution of the standbefore harvest
Components Dry mass (t ha-1)
Standing Bark 9.0crop Branches 23.7
Capsules 2.8Leaves 4.7Total potential residue 40.1Stem wood 83.2Total standing crop 123.3
Forest Coarse fraction (> 10 mm) 26.2 floor Medium fraction (2-10 mm) 18.9
Fine fraction (< 2 mm) 25.2Total forest floor 70.3
Stumps Old stumps (above ground) 19.5Roots Coarse roots (> 100 mm ¿) 41.7
Medium roots (10-100 mm ¿) 21.5Total roots > 10 mm 63.2
Total Standing crop + roots + stumps 206.0biomass Standing + roots + stumps + litter 276.3
Table 3. Mass and distribution of biomass of thestanding crop
StManagment-gs Final.pdf 1/31/01 8:29 PM Page 26 (Black plate)

B. du Toit, L.J. Esprey, R.A. Job, G.F. Fuller and S.D. Dovey 27
Early Growth of Replanted Trees The development of tree height, ground level diameter,leaf area index and biomass index is shown graphicallyin Fig. 4 (a,b,c,d). Based on biomass index, leaf areaindex and ground level diameter measurementstreatment effects can be ranked in the following(increasing) order:1. Slash removed2. Regular slash and double slash3. Slash disturbed and slash burnt4. Fertilised
It is difficult to interpret these results at this stageas the results of N mineralisation rate and plant-available nutrients are still being processed. The growthin the slash-removed treatment (BL0) was very poor, allparameters growth had decreased from the othertreatments as early as 40 days after planting (Fig. 4a,b,c,d). This growth reduction does not appear to be dueto lack of soil water for the following reasons: thetopsoil in both slash-removed treatment and burnt plots
was exposed after treatment. During the water deficitmonths (Fig. 1) the volumetric soil water content at adepth of 15 cm in these two treatments was similar (datanot shown), but the growth responses were verydifferent. The main reason for the poor growth in theBL0 treatment is likely to be due to low nutrientavailability. Despite the exposed surface, there washardly any weed growth in slash-removed plots, incontrast to the burnt treatments where weeds re-established well.
The single and double slash treatments had similargrowth rates. Any positive effects of the double slashtreatment (in terms of increases in the nutrient capital)are likely to show only over the longer term. However,in the short term it has become apparent that thetemperatures in the planting pits that were made in thedouble slash treatment are more extreme than that inother treatments (data not presented). Similarobservations were recorded in heavy slash in pine standsin South Africa (Allan 1999). The double slash
Tree age (days)
Tree
hei
ght (
m)
0 50 100 150 200 250 300
0
0.2
0.4
0.6
0.8
1
1.2
BLo BL2 BL3 SB SD SF X
+
a
Tree age (days)
Gro
und
line
diam
eter
(mm
)
0 50 100 150 200 250 300
0
5
10
15
20
BLo
BL2 BL3 SB SD SF
+
X
b
Tree age (days)
Leaf
sur
face
inde
x (m
2 )
0 50 100 150 200 250
0
0.1
0.2
0.3
0.4
0.5
0.6
0.7
0.8
Legend as for Fig. d c
Tree age (days)
Bio
mas
s in
dex
(mm
3 per
m2 )
0 50 100 150 200 250
0
10000
20000
30000
40000
50000
60000
70000
80000 BLo BL2 BL3 SB SD SF
+
X
d
Figure 4. Development of (a) tree height, (b) ground level diameter, (c) leaf area index, (d) biomass index
StManagment-gs Final.pdf 1/31/01 8:29 PM Page 27 (Black plate)

treatment had the highest level of mortality in the trial,possibly due to the formation of localised frost pockets.
The tree growth responses in the disturbed, burntand fertilised treatments were higher than average. Theincreased growth on the fertilised treatment started todiverge from treatments BL2 and BL3 at 80 days afterplanting (Fig. 4 b,c,d), while the burnt and disturbedtreatments started to diverge at 140 days after planting(Fig. 4 b,c,d).
The development of leaf area is illustrated in Fig. 5.Leaf Area Index (LAI) values are very low since treesare still small and canopy closure is expected to occuronly during the second year. LAI development in theslash-removed treatment already lagged behind by day104, while all other treatments had similar values.However, large treatment differences in LAI developedby day 197, with the disturbed, burnt and fertilisedtreatments having the highest LAIs.
Changes in the Forest Floor and Slash After harvest, the mass of slash was about 40 t ha-1 andthe forest floor about 70 t ha-1 (Table 3). About 50-70%of the forest floor was removed during the litter raking.The difference in litter/slash quantity between single anddouble slash treatments should be approximately 40 t ha-1
(harvesting residue) plus 40 t ha-1 (coarse fraction of theforest floor that was transferred). The differences betweendouble and single slash approximately 100 days after clearfelling (i.e. 21 days after planting in Fig. 6) amounts to 52t ha-1. The difference in mass can be ascribed to twofactors: (1) it was not always possible to broadcast slashevenly during clear felling, and (2) some collection of
104 197
0
0.02
0.04
0.06
0.08
0.1
0.12
0.14 BLo
BL2
BL3 SB
SD
SF
Figure 5. Effects of treatments on leaf area index
Effects of Site Management in Eucalyptus grandis Plantations in South Africa28
firewood by local people. It appears that the rate ofdecomposition is similar in the single slash and doubleslash plots. The mass of forest floor plus harvestingresidue lost due to burning was about 90 t ha-1.
Climate and Soil Water ContentMonthly recorded reference evaporation (Er) rangedbetween 145 mm in January 1999 to 76 mm in July 1999(data not shown). Approximately 76% of the annualrainfall, for the period of 1998 and 1999, occurred betweenOctober and May. Between January 1999 and September1999, there was 285 mm of rainfall compared to a long-term average of 579 mm. The driest period in 1999, whichwas longer than usual, occurred from April to September1999 when there was only 42 mm of rainfall.
Figure 7 shows the rainfall and soil water datafrom March to November 1999. These preliminaryresults show that the soil water content in the slashtreatment retained more soil water during winter andwetted up at a slower rate during the spring months,compared to the other treatments.
Water retention characteristics of two treatmentplots in one replication have been determined and areshown in Table 4. The interplay between rainfall,treatments and soil water dynamics will be exploredfurther as more results become available.
Leaf
are
a in
dex
(m2 M
-2)
Stand age (days)
200
150
150
100
0
Slash burnt
Time zero 21 DAP 112 DAP
Single slash
Sla
sh lo
an (
t ha-
1 )
Double slash
Figure 6. Changes in slash load in selected treatments0, 21 and 112 days after planting (DAP)
StManagment-gs Final.pdf 1/31/01 8:29 PM Page 28 (Black plate)

B. du Toit, L.J. Esprey, R.A. Job, G.F. Fuller and S.D. Dovey 29
Acknowledgements The staff of Sappi, SOS contractors, Dambuza Timberharvesting and our colleagues at the Institute forCommercial Forestry Research are thanked for theircontributions to this project.
ReferencesAllan, R. 1999. Re-establishment research. In:
MacLennan, L. (ed.) Annual research report, 40-42.Institute for Commercial Forestry Research,Pietermaritzburg, South Africa.
Atkinson, P.R. 1997. Recommendations, practices andnotes on the control of pests and diseases incommercial forestry in South Africa. ICFR Bulletin1/97. 21p.
Bredenkamp, B.V. and Loveday, N.C. 1984. Volumeequations for diameter measurements in millimetres.South African Forestry Journal 130: 40.
Du Toit, B. 1995. Guidelines for the fertilization ofpine, eucalypt and wattle plantations in the summerrainfall areas of southern Africa. ICFR Bulletin10/95. 13p.
Du Toit, B. 1998. The role of nutrition in forestproductivity: achievements and opportunities. In:MacLennan, L. (ed.) ICFR Jubilee Seminar. ICFRBulletin 1/98: 36-40.
Du Toit, B. 1999. Nutrition research - hardwoods. In:MacLennan, L. (ed.) Annual research report, 43-51.Institute for Commercial Forestry Research,Pietermaritzburg, South Africa.
Figure 7. Rainfall and variations in volumetric soil water contents between treatments BL2,BL3, SD and SB from March to November 1999
Table 4. Soil water parameters determined from the water retention characteristic
Treatment Bulk density Porosity Field capacity Wilting point Plant available water
(Replication 3) (Mg m-3) (m3 m-3)
Double slash (BL2) 0.90 0.67 0.33 0.14 0.19Slash disturbed (SD) 0.89 0.66 0.41 0.19 0.22
StManagment-gs Final.pdf 1/31/01 8:29 PM Page 29 (Black plate)

Effects of Site Management in Eucalyptus grandis Plantations in South Africa30
Du Toit, B., Smith, C., Carlson, C., Esprey, L., Allan, R.and Little, K. 1999. Eucalypt and pine plantations inSouth Africa. In: Nambiar, E.K.S., Cossalter, C. andTiarks, A. (eds.) Site management and productivityin tropical plantation forests: workshop proceedings16-20 February1998, Pietermaritzburg, South Africa,23-30. CIFOR, Bogor.
Gardner, R.A.W. and Swain, T.L. 1996. Snow damageto timber plantations in KwaZulu-Natal during July1996 and subsequent species recommendations.ICFR Bulletin 8/96. 12p.
Eccles, N.S., Kritzinger, J.L. and Little, K.M. 1997.Appropriateness of non-destructive measures ofyoung pine tree performance in weedingexperiments. South African Forestry Journal 178: 25-29.
Herbert, M.A. 1996. Fertilizers and eucalypt plantationsin South Africa. In: Attiwill, P.M. and Adams, M.A.(eds.) Nutrition of eucalypts, 303-325. CSIRO,Australia.
Herbert, M.A. and Schönau, A.P.G. 1990. Fertilizingcommercial forest species in South Africa: researchprogress and problems (part 2). South AfricanForestry Journal 152: 34-42.
Herbert, M.A. and Robertson, M.A. 1991. Above-ground biomass composition and nutrient content forEucalyptus species in the south-eastern Transvaal.In: Schönau, A.P.G. (ed.) Intensive forestry: the roleof eucalypts. Proceedings of IUFRO symposium,Durban, South Africa, 2-6 September 1991, Vol 2,662-674. IUFRO.
Little, K.M. 1998. Managing vegetation for optimumestablishment. In: MacLennan, L. (ed.). ICFRJubilee Seminar. ICFR Bulletin 1/98: 32-35.
Little, K.M., Arnot, L., Du Toit, B. and Maxfield, M.2000. The killing of Eucalyptus grandis multiple-stem cut-stumps in the Karkloof Project: puttingrecommendations into practice. ICFR Bulletin3/2000. 7p.
Monteith, J.L. 1965. Evaporation and environment. In:Fogg, G.E. (ed.) The state and movement of water inliving organisms. Proceedings of the 19thSymposium of the Society of Experimental Biology,205-234. Cambridge University Press.
Raison, R.J., Connell, M.J. and Khanna, P.K. 1987.Methodology for studying fluxes of soil mineral-N insitu. Soil Biology and Biochemistry 19: 521-530.
O’Connell, A.M. and Sankaran, K.V. 1997. Organicmatter accretion, decomposition and mineralisation.In: Nambiar, E.K.S. and Brown, A.G. (eds.)Management of soil, nutrients and water in tropicalplantation forests, 443-480. ACIAR Monograph No.43. ACIAR, Canberra.
Schulze, R.E. 1997. South African atlas ofagrohydrology and climatology. Report TT82/96.Water Research Commission, Pretoria.
Schulze, R.E., Smithers, J.C., Lynch, S.D. and Lecler,N.L. 1995. Obtaining and interpreting output inACRU. In: Smithers, J.C. and Schulze, R.E. ACRUagrohydrological modelling system: user manual,version 3.00, AM 7-1 to AM 7-21. Report TT70/95.Water Research Commission, Pretoria.
Shiver, B.D. and Knowe, S.A. 1990. Comparison ofchemical site preparation treatments in the GeorgiaPiedmont. Southern Journal of Applied Forestry 14:24-32.
Smith, C.W. 1998. Three decades of site preparationresearch: lessons for the future. In: MacLennan, L.(ed.) ICFR Jubilee Seminar. ICFR Bulletin 1/98: 28-31.
Smith, C.W. and Du Toit, B. 1998. The combined effectof harvesting operations and fertilisation on thegrowth of E. grandis x camaldulensis on a sandyFernwood soil in Zululand: early results. ICFRNewsletter, February 1998: 15-19.
Stubbings, J.A. and Schönau, A.P.G. 1980.Management of short rotation coppice crops ofEucalyptus grandis. South African Forestry Journal115: 38-46.
Turner, J. and Lambert, M.J. 1996. Nutrient cycling andforest management. In: Attiwill, P.M. and Adams,M.A. (eds.) Nutrition of eucalypts, 229-248. CSIRO,Australia.
Vogt, K., Asbjornsen, H., Ercelawn, A., Montagnini, F.and Valdés, M. 1997. Roots and mycorrhizas inplantation ecosystems. In: Nambiar, E.K.S. andBrown, A.G. (eds.) Management of soil, nutrientsand water in tropical plantation forests, 247-296.ACIAR Monograph No. 43. ACIAR, Canberra.
StManagment-gs Final.pdf 1/31/01 8:29 PM Page 30 (Black plate)

Introduction There are more than one million hectares of eucalyptplantations in southern China and most have beenestablished recently (Xu et al. 2000). Former landpractices have led to site degradation and soils on sitesavailable for eucalypt plantations are poor. Productivityis very low (average 5-10 m3 ha-1 yr-1) and variable (3-40m3 ha-1 yr-1) compared with eucalypt plantations in othercountries (Brown et al. 1997, Xu et al. 1999a). Chineseeucalypt plantations commonly have trees with verysmall crowns and grow slowly when more than 4 yearsold (Xu 1997), so trees are harvested after a shortrotation period (3-6 years). Even though productivity isalready low, it appears to be declining with successiverotations in some areas. Some reports relate the lowproductivity to low soil fertility (Dell and Malajczuk1994; Xu and Dell, 1997) and low available soil P(Wang and Zhou 1996). Serious soil erosion (>13 t ha-1
yr-1) after plantation establishment and associatednutrient loss (Xu et al. 1997) and organic materialharvesting (Xu 1996) may be contributing factors.Fertilisation in the first year or first two years is a
common practice (Wang and Zhou 1996; Zhong et al.1998). Therefore, improving or maintaining soil fertilityis essential to prevent tree growth stagnation in mid-rotation (3-4 years) and to increase or sustainproductivity of eucalypt plantations.
The goal of this collaborative project is to developalternative options for site management that will sustainor improve productivity of eucalypt plantations oversuccession rotations in southern China. Morespecifically the objectives are to understand therelationship between site management practice andproductivity over successive rotations by studying:1. impacts of different harvest levels and intercropping
on soil physical and chemical properties, treegrowth, biomass accumulation and nutrient cycling;
Effects of Site Management in Eucalyptus urophylla Plantations
in Guangdong Province, China
D.P. Xu1, Z.J. Yang1, B. Dell2 and M. Gong1
Abstract Effects of harvest residue management, intercropping with N-fixing trees, fertilisation and regenerationby coppice and replanting on tree growth, soil properties and soil nutrient availability are discussed inthis paper. A reduction in the amount of residue removed during harvest increased tree growth byincreasing available nutrient supply and reducing the loss of soil organic C after tree planting. Treegrowth in the treatment where all organic matter was removed and weeds were periodically controlledwas better than in the whole tree harvest plots because of reduced weed competition. Intercroppingwith N-fixing trees enhanced tree growth two years after planting. Application of N, P and K fertiliserincreased tree growth substantially. Growth increment was much higher than that obtained by harvestresidue management on this poor degraded soil. Coppice trees grew better than replanted trees. Thedifference between coppice and replanted trees was reduced by fertilisation. Harvest residue retention,adequate fertilisation and coppice regeneration are therefore recommended as operational practices foreucalypt plantations in south China.
1 Research Institute of Tropical Forestry, Chinese Academy ofForestry, Longdong, Guangzhou 510520, P.R. China. E-mail:[email protected] School of Biological Sciences and Biotechnology, MurdochUniversity, Perth 6150, Australia
5
StManagment-gs Final.pdf 1/31/01 8:29 PM Page 31 (Black plate)

Effects of Site Management in Eucalyptus urophylla Plantations in Guangdong Province, China32
2. impacts of regeneration options and fertilisation onsoil physical and chemical properties, tree growth,biomass accumulation and nutrient cycling;
3. impacts of site management options on the processof soil fertility; and
4. long-term change in productivity over successiverotations.
Materials and Methods
Site description The experimental site is located in Yangxi county,5 km from Zhilong town (21043'N, 111035'E),Guangdong province. The site is 20-50 m asl on asmall hill with a slope of about 5 degrees.
The main features of the climate are: averageannual rainfall 2178 mm, maximum rainfall in a day242 mm, annual mean temperature 22.00C, maximumtemperature 37.00C, minimum temperature 2.10C,mean temperature in the coldest month 15.00C, meantemperature in the hottest month 28.00C, and annualmean humidity 81%. More detailed climaticinformation was reported by Xu et al. (1999b).
The soil is lateritic red soil (Ultisol) over granite.The soil profile is more than 2 m deep with less than20 cm A horizon. Soil bulk density is quite high andabout 60% of the topsoil (0-40 cm) is white graniticsand (Xu et al. 1999b). As the soil was tilled for thefirst rotation eucalypt plantation, the bulk density ofthe 0-10 cm soil layer (1.46 g cm-3) is compared to1.43 g cm-3 in the 10-20 cm layer. Because it isdegraded land and soil erosion was quite serious aftercultivation for the first rotation, the fraction of whitesand in the topsoil is higher than in the subsoil.Organic C in the topsoil is very low compared withother soils in south China. However, the relativelyhigher organic C in the 0-10 cm layer compared to the10-20 cm layer indicates that litter from the first-rotation plantation contributed some organic C to thetopsoil. Both total and available nutrientconcentrations in the soil are low compared withundisturbed forest soils in south China (Xu et al.2000). More information on soil was reported by Xu etal. (1999b).
This site is typical for eucalypt plantationsplanted on degraded soils in southern China. As a
result, nutrient and water availability is limited in thetopsoil during the dry season, and Eucalyptusurophylla S.T. Blake cannot grow well without soilcultivation and fertilisation. Soil erosion on the sitewas very serious after site preparation and treeplanting (ca 13 t ha-1 yr-1). In the dry season (Octoberto March), water stress limits tree growth because ofthe shallow root system of E. urophylla.
In 1991, the original vegetation of mixed shrubswith scattered trees of Pinus massoniana Lamb. wascleared and the site cultivated to establish a plantationof E. urophylla. Spacing for the plantation was 2 x 3m. At planting, 100 g NPK fertiliser (10.0% N; 4.4%P; 8.3% K) was applied per tree as basal fertiliser. In1992, the fertilisation was repeated.
Soil and plant analysis Soil samples for chemical analyses were made afterplots were established but before any treatments wereapplied. More soil samples were collected two yearsafter planting. Five points in each plot were sampled inExperiment 1 and three points in each plot inExperiment 2, and the soil separated into three layers (0-10, 10-20 and 20-40 cm). Soil samples (0-20 cm layer)for NO3-N, NH4-N, available P and exchangeable Kdeterminations were collected at 2-month intervals inthe rainy season and 3-month intervals in the dry season.Methods for soil analysis were: • total N, by H2SO4 digestion (with K2SO4, CuSO4
and Se) and H3BO3 absorption;• available N (hydrolysable N), 1 mol L-1 NaOH
hydrolysis and H3BO3 absorption (Cornfield1960);
• total P, by ignition followed by colorimetricmolybdate blue (Murphy and Riley 1962);
• available P, by Mehlich-1 extractant (0.05 mol L-1
HCl and 0.025 mol L-1 H2SO4 extractable P);• total K, by ignition method (same as total P) and
determined by flame photometer; • exchangeable K, by 1 mol L-1 NH4OAc extraction
and determined by flame photometer; • exchangeable Ca and Mg, by NH4OAc extraction
and determined by atomic absorption; • pH, 1:2.5 water solution; • organic C, by Tyurin method (Tyurin 1931). • NO3-N, by CaSO4 extraction and C6H5OH and
H2SO4 colorimetry (Bremner 1965). and• NH4-N, by MgO and H3BO3 absorption (Bremner
1965).
StManagment-gs Final.pdf 1/31/01 8:29 PM Page 32 (Black plate)

D.P. Xu, Z.J. Yang, B. Dell and M. Gong 33
Methods for plant analysis were: • N by: H2SO4 (ZnSO4, FeSO4) digestion and
Kjeldahl; • P by HNO3 and HClO4 digestion and colorimetry; • K by HNO3 and HClO4 digestion and flame
photometer; and• Ca and Mg, by HNO3 and HClO4 digestion and
atomic absorption.
Experimental Design and LayoutThe subproject consists of two adjacent experimentshaving separate but complementary objectives andexperimental designs.
Experiment 1: Impacts of different harvestintensities and intercropping with acaciaThe impacts of different harvest intensities andintercropping are measured when a first-rotation E.urophylla plantation is harvested and a second cropestablished. The experimental design is a randomisedcomplete block with five treatments and four blocks. Thetreatments are:BLo All aboveground organic residue is removed from
the plot (tree components, understorey and litter).BL1 Whole tree harvest (aboveground tree components
excluding stem wood removed from plot anddistributed on BL3).
BL2 Stem and bark harvest (remaining branches andfoliage distributed evenly on the plot).
BL3 Double slash (foliage and branches from treesharvested from plot plus the slash from BL1 aredistributed evenly over the plot).
BL4 Stem and bark harvest plus intercropping withAcacia holosericea A. Cunn. ex G. Don.
Each of the 20 plots is 360 m2 in area with 60 trees(6 x 10) spaced at 2 x 3 m. They were laid out in acomplete block design. The designated harvest level wasapplied to each plot as it was harvested in March 1997.Planting holes (40 x 40 x 30 cm) were prepared at thesame spacing as the former plantation (2 x 3 m).Fertilisers used were: urea (46% N), potassium chloride-KCl (40% K) and superphosphate (6.4% P) were placedin each hole. On 8 April 1997, seedlings grown fromseeds collected in the plantation were planted andcoppice from the first rotation stumps was removedevery 2-3 months. In the BL4 treatment, seedlings of A.holosericea were planted between rows of plantedeucalypt seedlings without any fertiliser.
Experiment 2: Impacts of differentregeneration methods and fertilisationThe experimental design is split plot with threetreatments (fertilisation level), two subtreatments(regeneration method) and four blocks. The maintreatments are: Fo no additional fertilisation;F1 low level fertilisation: N 76.7 kg ha-1, P 16.0 kg
ha-1 and K 53.4 kg ha-1;F2 high level fertilisation: N 153.3 kg ha-1, P 32 kg
ha-1 and K 106.7 kg ha-1.
The two subtreatments are: MTo coppice; MT1 seedling planting.
Seedlings were planted on April 8, 1997. Thecoppice subtreatment was thinned to two coppicestems per tree on 15 July 1997. The harvesting levelon all of these plots was BL1. An additional twosubplots were added in each block to compare theeffects of different harvest levels when no fertiliser isadded. They were BL0 (all aboveground organicresidue removed from the plot) and BL3 (doubleslash). There are 72 trees in each plot (6 x 12) and 36trees in each subplot. The spacing is 2 x 3 m. The areaof each plot is 432 m2. As in Experiment 1, thedesignated harvest level was applied to each plot inMarch 1997. Trees were harvested in March 1997 andthe experiment was laid out. Planting holes (40 x 40 x30cm) were prepared on the planted subplots while thecoppice plots were left undisturbed.
The F1 treatments received 25 g urea, 40 g KCl and150 g superphosphate as base fertiliser for each treebefore planting and 25 g urea was applied 3 months afterplanting. In coppice subplots, the entire 50 g urea, 40 gKCl and 150 g superphosphate were applied 3 monthsafter cutting. Both the planted and coppice plotsreceived 50 g urea and 40 g KCl one year after planting.The F2 fertiliser treatments were the same as in F1 exceptthe seedling subplots received 50 g urea, 40 g KCl and150 g superphosphate as base fertiliser and another 50 gurea and 40 g KCl were applied 3 months after planting.The F2 coppice plots received 100 g urea, 80 g KCl and150 g superphosphate 3 months after cutting. On bothplanted and coppice subplots, an additional 100 g urea,80 g KCl and 150 g superphosphate were applied oneyear after planting.
StManagment-gs Final.pdf 1/31/01 8:29 PM Page 33 (Black plate)

Effects of Site Management in Eucalyptus urophylla Plantations in Guangdong Province, China34
Tree diameter was significantly different in the fivetreatments (p<0.001). At 8 months, the best twotreatments for diameter were BL0 and BL3 (Table 1). At16 months, the best treatment was BL3 and BL3 poorestwas BL1. At 31 months, the best treatment in treediameter was still BL3 and the next was BL4. Thepoorest was still BL1 (Table 1).
Results
Experiment 1: Impacts of different harvestintensities and intercropping with acacia Tree height was significantly different among the 5treatments (p<0.01) 8 months after planting and thisdifference increased with time (Fig. 1). Until 8 monthsold, trees in BL3 and BL0 were taller than trees in theother three treatments (Fig. 2). After 31 months thetallest trees were in BL3 and BL4 and the poorest growthwas BL1. Treatments BL0 and BL2 were intermediate(Fig. 2). Tree height growth of BL0, BL1, BL2, BL3 andBL4 from 8-20 months was 1.7, 1.6, 1.9, 2.2 and 2.0 mrespectively. Compared to BL2 and BL3, the rate ofheight growth in BL0 and BL1 declined in the period.Height growth of BL0 BL1, BL2, BL3 and BL4 from 20 to31 months was 1.8, 1.6, 1.7, 1.9 and 2.1 m respectively.The rate of tree height growth in BL4 increased after age20 months compared to all of the other treatments.
Figure 1. Tree height of different harvest residuetreatments
0
1
2
3
4
5
6
7
0 5 10 15 20 25 30 35
Time since planting (month)
Tre
ehe
ight
(m)
BL0
BL1
BL2
BL3
BL4
0
0.5
1
1.5
2
2.5
BL0 BL1 BL2 BL3 BL4
Treatment
Tre
ehe
ight
at8
mon
ths(
m)
b a
b
ab
0123456789
BL0 BL1 BL2 BL3 BL4
Treatment
Ave
rage
tree
heig
htat
31m
onth
s(m
)
bc
ba a
Figure 2. Tree height at 8 and 31 months after planting. Means of the treatment with same letter are notsignificantly different at the level of P=0.05 usingNewman-Keuls critical range test. Bars = standarddeviation
Table 1. Tree diameter between 3 and 31 months from planting (the first two measurements were at 10 cm height andthe others at 1.3 m)
Treatment Age (months)
3 8 16 20 25 31
cm
BL0 0.9 3.1 a 2.4 b 3.0 3.7 4.5 b
BL1 0.8 2.5 b 2.0 c 2.5 3.0 3.9 c
BL2 0.7 2.5 b 2.3 b 2.8 3.4 4.3 b
BL3 0.9 2.9 a 2.8 a 3.2 4.0 4.9 a
BL4 0.7 2.5 b 2.4 b 2.8 3.5 4.5 ab
Means of the treatment with same letter are not significantly different at the level of P=0.05 using Newman-Keuls critical range test.
StManagment-gs Final.pdf 1/31/01 8:29 PM Page 34 (Black plate)

0
5
10
15
20
25
30
35
0 5 10 15 20 25
Time after planting (month)
Exc
hang
eabl
eK
into
psoi
l(m
g/kg
)
BL0
BL1
BL2
BL3
D.P. Xu, Z.J. Yang, B. Dell and M. Gong 35
Available nutrients in topsoil BL3 had the highest mean available P in 0-20 cm topsoilover 10 collection times and BL1 the lowest (p<0.005).BL0 and BL2 were similar (Fig. 3).
There was also a significant difference (P<0.001) ofavailable P among 10 sampling times. Available P in thetopsoil in the second year was higher than that in first yearafter planting (Fig. 4). During the 2 years (3-8 and 15-20months after planting), available P in the topsoil washigher in the wet season than that in the dry season.
Available P in the harvest residue treatmentsvaried with sampling time. Generally it was highest inBL3 and lowest in BL1. Two months after planting,available P in BL0 was the highest but by 4 months itwas the lowest and remained lower than BL3 and BL2
until 13 months after planting (May, the end of dryseason) when it increased temporarily (May-July).
0
0.1
0.2
0.3
0.4
0.5
0.6
BL0 BL1 BL2 BL3
Treatments
Mea
nav
aila
ble
P(m
g/kg
) abb
a ab
0
0.1
0.2
0.3
0.4
0.5
0.6
0 5 10 15 20 25 30
Time since planting (month)
Ava
ilabl
eP
inso
il(m
g/kg
)
BL0
BL1
BL2
BL3
0
1
2
3
4
5
6
7
8
9
10
0 5 10 15 20 25
Time since planting (month)
NH
4-N
into
pso
il(m
g/k
g) BL0
BL1
BL2
BL3
Figure 4. Change in concentrations of available P in thetopsoil
Figure 3. Mean available P in topsoil of different harvesttreatments over 10 collection times
Means of the treatment with same letter are not significantly different atthe level of P=0.05 using Newman-Keuls critical range test. Bars =
standard deviation.
Figure 6. Change in concentration of NH4-N in thetopsoil
There was a significant difference (p<0.01) ofexchangeable K in topsoil between 10 sampling times(Fig. 5) but there was no seasonal pattern. There was nosignificant difference (p>0.05) among the harvestresidue treatments. There was a significant difference(p<0.01) of NH4-N in topsoil over the sampling times.The NH4-N was higher in the first year after plantingthan that in the second year (Fig. 6). There was alsosome difference (p=0.065) of NH4-N in the four harvestresidue treatments. NH4-N in BL3 was higher than thatin other three treatments in the first year, but not in thesecond year after planting.
Figure 5. Change in concentration of exchangeable K inthe top soil
There was a significant difference (p<0.01) of NO3-N in topsoil over the sampling times. Nitrate-N in topsoilin the first year was higher that that in the second year afterplanting. It was more variable in different sampling timesthan available P, exchangeable K and NH4-N. Howeverthere was no significant difference (p>0.05) among the
StManagment-gs Final.pdf 1/31/01 8:29 PM Page 35 (Black plate)

Effects of Site Management in Eucalyptus urophylla Plantations in Guangdong Province, China36
harvest residue treatments. NO3-N in BL3 and BL2 wasonly higher than the no harvest residue treatments (BL0
and BL1) at four sampling times (Fig. 7).
Changes in soil properties two years aftertree plantingIn the 2 years after planting, soil organic C decreasedacross all treatments but the retention of harvestresidue reduced the decline (Fig. 8). In BL0 (removalof all organic materials), C in the 0-10 cm layerdeclined by 2.4 g kg-1 whereas in BL3 (double harvestresidue) it fell by less than 1.0 g kg-1. In the 10-20 cmsoil horizon, organic C fell by 1.5 g kg-1 but thedecrease in BL3 was much lower than othertreatments. In the 20-30 cm soil layer the declineswere less than in the topsoil, nevertheless, even at thisdepth C declined by 1.3 g kg-1 in BL0. The decline wascaused by decomposition of organic C present in thesoil prior to replanting. It is concluded thatreplacement of this organic C by slash was helpful inslowing the loss of organic C. Removal of all organicmaterials in BL0 is likely to have increased soiltemperature resulting in faster decomposition.
Total soil N also declined after planting. Thetrends in the three soil layers were similar to those fororganic C. The largest decline occurred in BL0 andBL1. There was no obvious change of total P and totalK in different treatments.
Available N and P, and exchangeable K, Ca andMg increased in the 2 years after tree planting (Fig. 9).Available N in BL0 was lower than that in the other
-2
0
2
4
6
8
10
0 5 10 15 20 25
Time since planting (month)
NO
3-N
into
psoil
(mg/k
g)
BL0
BL1
BL2
BL3
-35
-30
-25
-20
-15
-10
-5
00 1 2 3 4 5 6 7 8 9
Organic C (g/kg)
Soi
ldep
th(c
m)
At planting
BL0
BL3
-35
-30
-25
-20
-15
-10
-5
00 0.1 0.2 0.3 0.4 0.5 0.6 0.7 0.8
Total N (g/kg)
Soil
dept
h(c
m)
At planting
BL0
BL3
Figure 8. Soil organic C and total N in different harvestresidue treatments at planting and 2 years later
Figure 7. Change in concentration of NO3-N in thetopsoil
treatments but in the surface horizon of BL0 itincreased, possibly due to decomposition of organicmatter in the topsoil. Available P was highest in BL3
and lowest in BL0 indicating the importance ofharvest residue as a source of P to the soil.Exchangeable Ca in topsoil was also increased byharvest residue intensity. There was also a positiveeffect of harvest residue on exchangeable K and Mg.
Considering total nutrient content in 0-40 cmtopsoil, it was found that organic C and total Ndecreased but less so with high slash retention (Table2). Total P was not changed and total K was slightlyincreased. Available N and exchangeable Mgsignificantly (p<0.05) increased in the 2 years, as didavailable P and exchangeable Ca and K (p<0.01), allassisted by higher slash retention.
Experiment 2: Impacts of regenerationmethods and fertilisationThe effect of fertilisation on tree growth was verysignificant (p<0.001). It dramatically increased tree heightand diameter growth at all measurement times (Fig. 10).
StManagment-gs Final.pdf 1/31/01 8:29 PM Page 36 (Black plate)

Table 2. Organic C and nutrients in the top 40 cm of soil before harvest and 2 years after planting
Properties Before harvest Two years after planting
BL0 BL1 BL2 BL3 BL4
Organic C (t ha-1) 34.4 25.3 26.6 26.9 31.3 32.2
Total N (t ha-1) 2.9 2.2 2.4 2.4 2.6 2.6
Total P (t ha-1) 0.6 0.7 0.7 0.7 0.7 0.7
Total K (t ha-1) 18.4 21.1 21.3 19.1 21.3 22.6
Available N (kg ha-1) 192.9 209.8 225.7 228.7 276.8 270.2
Available P (kg ha-1) 2.3 2.3 2.46 3.2 4.7 3.7
Exchangeable K (kg ha-1) 40.0 63.5 75.9 72.3 70.0 90.4
Exchangeable Ca (kg ha-1) 0.8 2.3 2.4 3.2 4.7 3.7
Exchangeable Mg (kg ha-1) 1.4 1.5 1.8 2.1 1.8 1.7
D.P. Xu, Z.J. Yang, B. Dell and M. Gong 37
-35
-30
-25
-20
-15
-10
-5
00 20 40 60 80
Available N (mg/kg)
Soi
ldep
th(c
m)
At planting
BL0
BL3
-35
-30
-25
-20
-15
-10
-5
00 5 10 15 20 25 30
Exchangeable K (mg/kg)
Soi
ldep
th(c
m)
At planting
BL0
BL3
-35
-30
-25
-20
-15
-10
-5
00 0.1 0.2 0.3 0.4 0.5 0.6
Exchangeable Mg (mg/kg)
Soil
dept
h(c
m)
At planting
BL0
BL3
-35
-30
-25
-20
-15
-10
-5
00 0.2 0.4 0.6 0.8 1
Exchangeable Ca (mg/kg)
Soil
dept
h(c
m)
At planting
BL0
BL3
-35
-30
-25
-20
-15
-10
-5
00 0.5 1 1.5
Available P (mg/kg)
Soi
ldep
th(c
m)
At planting
BL0
BL3
Figure 9. Available nutrient changes in different harvest residue treatments 2 years after planting
StManagment-gs Final.pdf 1/31/01 8:29 PM Page 37 (Black plate)
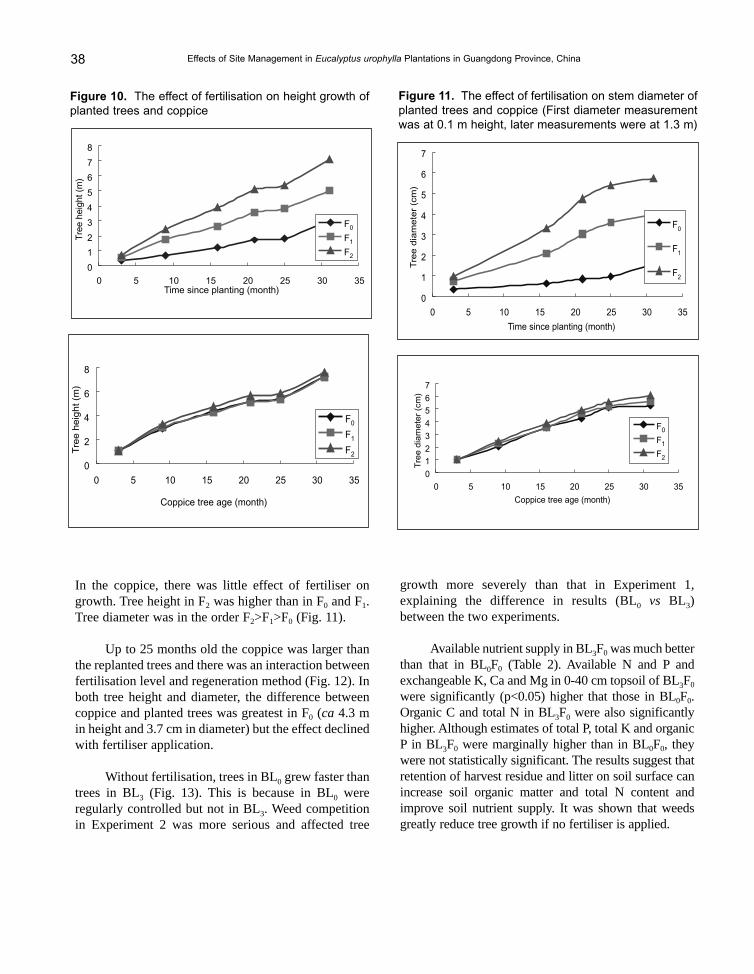
Effects of Site Management in Eucalyptus urophylla Plantations in Guangdong Province, China38
In the coppice, there was little effect of fertiliser ongrowth. Tree height in F2 was higher than in F0 and F1.Tree diameter was in the order F2>F1>F0 (Fig. 11).
Up to 25 months old the coppice was larger thanthe replanted trees and there was an interaction betweenfertilisation level and regeneration method (Fig. 12). Inboth tree height and diameter, the difference betweencoppice and planted trees was greatest in F0 (ca 4.3 min height and 3.7 cm in diameter) but the effect declinedwith fertiliser application.
Without fertilisation, trees in BL0 grew faster thantrees in BL3 (Fig. 13). This is because in BL0 wereregularly controlled but not in BL3. Weed competitionin Experiment 2 was more serious and affected tree
growth more severely than that in Experiment 1,explaining the difference in results (BL0 vs BL3)between the two experiments.
Available nutrient supply in BL3F0 was much betterthan that in BL0F0 (Table 2). Available N and P andexchangeable K, Ca and Mg in 0-40 cm topsoil of BL3F0
were significantly (p<0.05) higher that those in BL0F0.Organic C and total N in BL3F0 were also significantlyhigher. Although estimates of total P, total K and organicP in BL3F0 were marginally higher than in BL0F0, theywere not statistically significant. The results suggest thatretention of harvest residue and litter on soil surface canincrease soil organic matter and total N content andimprove soil nutrient supply. It was shown that weedsgreatly reduce tree growth if no fertiliser is applied.
0
1
2
3
4
5
6
7
8
0 5 10 15 20 25 30 35Time since planting (month)
Tre
ehe
ight
(m)
F0
F1
F2
0
1
2
3
4
5
6
7
0 5 10 15 20 25 30 35
Time since planting (month)
Tre
edia
mete
r(c
m)
F0
F1
F2
0
1
2
3
4
5
6
7
0 5 10 15 20 25 30 35
Coppice tree age (month)
Tre
edia
mete
r(c
m)
F0
F1
F2
0
2
4
6
8
0 5 10 15 20 25 30 35
Coppice tree age (month)
Tre
ehe
igh
t(m
)
F0
F1
F2
Figure 11. The effect of fertilisation on stem diameter ofplanted trees and coppice (First diameter measurementwas at 0.1 m height, later measurements were at 1.3 m)
Figure 10. The effect of fertilisation on height growth ofplanted trees and coppice
StManagment-gs Final.pdf 1/31/01 8:29 PM Page 38 (Black plate)

Table 2. Main chemical properties of 0-40 cm topsoil intwo residue treatments
Properties Residue/fertiliser/treatment
BL0F0 BL3F0
Organic C (g kg-1) 5.38 b 7.43 a
Total N (g kg-1) 0.46 b 0.56 a
Total P (g kg-1) 0.11 0.12
Total K (g kg-1) 3.82 3.52
Organic P (g kg-1) 29.89 33.86
Available N (mg kg-1) 44.28 b 62.49 a
Available P (mg kg-1) 0.59 b 1.18 a
Exchangeable K (mg kg-1) 13.25 b 18.78 a
Exchangeable Ca (mg kg-1) 0.46 b 0.59 a
Exchangeable Mg (mg kg-1) 0.36 b 0.49 a
D.P. Xu, Z.J. Yang, B. Dell and M. Gong 39
Discussion and Conclusions Harvest residue management had significant impact ontree growth in the early stage of the second rotation ofan E. urophylla plantation because harvest residueincreased the available nutrient supply and lessened thereduction of organic C and total N in the topsoil duringthe inter-rotational period. At the same time, retention of
harvest residue also reduced soil loss and water runoffduring plantation establishment. Before the 1980salmost all harvest residues, understorey and litter on thesoil surface in eucalypt plantations in southern Chinawere collected as firewood. Even today, all harvestresidues (including leaves, branches and main roots) arecollected from sites, mainly for firewood. This, alongwith serious soil and nutrient runoff, due toinappropriate site cultivation, partly explains why soildegradation and productivity decline of eucalyptplantations have been so common in southern China.Study is needed to determine the impact of harvestresidues on soil and water runoff in eucalypt plantations.Weed control was another important factor significantlyaffecting productivity. As noted earlier, BL0 alone wasweeded regularly in the early stages of plantationestablishment and this resulted in the trees in BL0
growing at a rate similar to those in BL2 and faster thanin BL1. Without fertilisation, weed control obscured theeffects of slash management so that trees inBL3F0 weresmaller than trees in BL0F0 although nutrient supply inBL3F0 was better than that in BL0F0. Weed control hasnot been an important problem in eucalypt plantations insouthern China in the past because of total soil tillageand understorey harvesting. If new site preparationmethods are adopted for soil fertility conservation andthere is less and less understorey collection, weedcontrol should be practised. More study is needed todevelop weed control options for forest farmers.
Figure 12. Interaction between regeneration methodsand fertilisation levels on tree growth
012345678
F0 F1 F2
Fertilisation treatments
Tre
ehe
ight
s(m
)
Coppice
Replanting
0
0.5
1
1.5
2
2.5
3
3.5
BL3+F0 (D) BL0+F0 (D) BL3+F0 (H) BL0+F0 (H)
Treatments
Dia
me
ter
(cm
)o
rh
eig
ht(m
)
01234567
F0 F1 F2
Fertilisation treatments
Tree
diam
ete
r(c
m)
Coppice
Replanting
Figure 13. Average tree diameter (D) and height (H) inBL0 and BL3 without fertilisation
Values designated a and b for each property are significantlydifferent (P<0.05) from each other.
StManagment-gs Final.pdf 1/31/01 8:29 PM Page 39 (Black plate)

Effects of Site Management in Eucalyptus urophylla Plantations in Guangdong Province, China40
Coppice was better than planting for the secondrotation up to 31 months old. There was interactionbetween the regeneration method and fertilisation level.Response of coppice trees to fertilisation was muchlower than planted trees. It suggests that well-developedroot systems helped the coppice to uptake soil nutrientsbetter than the smaller root systems of the planted trees.The coppice probably used more nutrients from the soilthan from fertiliser. It is recommended that coppiceshould be adopted for second rotation eucalyptplantations unless better genetic material is available forplanting.
AcknowledgementsThis paper is part of a PhD thesis study by D.P. Xu. Weare grateful to the Center for International ForestryResearch and the Chinese Foundation for Science forsupporting this study. Zhang Ningnan and Zhou Taoassisted with the study.
ReferencesBremner, J.M. 1965. Inorganic forms of nitrogen. In:
Black, C.A. (ed.) Methods of soil analysis, 1179-1237. American Society of Agronomy, USA.
Brown, A.G., Nambiar, E.K.S. and Cossalter, C. 1997.Plantations for the tropics - their role, extent andnature. In: Nambiar, E.K.S. and Brown, A.G., (eds.)Management of soil, nutrients and water in tropicalplantation forests, 1-19. Monograph No. 43. ACIAR,Canberra.
Cornfield, A.H. 1960. Ammonium released on treatingsoil with N sodium hydroxide as a possible means ofpredicting the nitrogen-supplying power of soils,Nature 187: 260-261.
Dell, B. and Malajczuk, N. 1994, Boron deficiency ineucalypt plantations in China. Canadian Journal ofForest Research 24: 2409-2416.
Murphy, J. and Riley, J.P. 1962. A modified singlesolution for determination of phosphate in naturalwaters. Analysis Chemistry Acta 27: 31-36.
Tyurin, I.V. 1931. A modification of a volumetricmethod of humus determination with chromic acid.Pochvovedenie No. 5-6: 36.
Wang, H.R. and Zhou, W.L. 1996. Fertiliser andeucalypt plantations in China. In: Attiwill, P.M. andAdams, M.A. (eds.) Nutrition of eucalypts, 389-397.CSIRO, Melbourne.
Xu, D.P. 1996. Soil degradation, a key factor inrestraining productivity of tropical tree plantations insouth China. In: Proceedings of IUFRO Conferenceon Effects of Environmental Factors on Tree andStand Growth, Dresden, Germany, 251-258.University of Dresden, Germany.
Xu, D.P. 1997. An approach to nutrient balance intropical and south subtropical short rotationplantations. In: Yang, C. (ed.) Forest soil, 78-87.Science and Technology Publishing House, Beijing.
Xu, D.P. and Dell, B. 1997. Importance ofmicronutrients for productivity of plantationeucalypts in east Asia. In: Kikkawa, J. et al. (eds.)Proceedings of 6th Annual BIO-REFOR Workshopheld in Brisbane, Queensland, December, 1997, 133-138. BIO-REFOR, University of Tokyo, Tokyo.
Xu, D.P., Bai, J.Y. and Dell B. 2000. Overcoming theconstraints to productivity of eucalypt plantations insouthern China. In: Proceedings of InternationalWorkshop on Mycorrhizas in Forestry inGuangzhou, China, in September 1998, 150-162.China Forestry Publishing House, Beijing.
Xu, D.P., Liu, Y. and Yang, Z. 1999a. Soil erosioncontrol by vegetation restoration in southern China.In: Proceedings of International Symposium on SoilErosion and Dryland Farming, Xian, China,September 1997, 256-268. Soil Society of America,USA.
Xu, D.P., Yang, Z.J., Chen, M.H. and Chen Q.D. 1999b.Plantations of Eucalyptus urophylla S.T. Blake inGuangdong province, China. In: Nambiar, E.K.S.,Cossalter, C. and Tiarks, A. (eds.) Site managementand productivity in tropical plantation forests:workshop proceedings, 16-20 February 1998,Pietermaritzburg, South Africa, 31-38. CIFOR,Bogor.
Zhong, C., Gong, M., Chen, Y., Wang, F. and Chen, Y.1997. Productivity of Eucalyptus plantations insouthern China: mycorrhizal fungi and fertilisers. In:Kikkawa, J. et al. (eds.) Proceedings of 6th AnnualBIO-REFOR Workshop, Brisbane, Queensland, 236-246. BIO-REFOR, University of Tokyo, Tokyo.
StManagment-gs Final.pdf 1/31/01 8:29 PM Page 40 (Black plate)

IntroductionPT. Musi Hutan Persada has managed a plantation forestof 193 500 ha in South Sumatra, Indonesia since 1990.Acacia mangium Willd. is the principal species used andcomprises over 90% of the plantation area. A speciestrial conducted on the site in the early 1980s confirmedthe superiority of A. mangium over other species.Silviculturally A. mangium is easy to manage in thenursery and in the field, relatively free from seriouspests and diseases, and fast-growing. Its wood is suitablefor pulp and papermaking (Logan 1987). Since 1999 thecompany has harvested its plantations for a pulp millwith capacity of 450 000 t of bleached kraft pulpannually. Only merchantable wood with diameter morethan 10 cm, including bark, is currently harvested, whilethe remainder of the tree is left on site. The logged-overareas are replanted with A. mangium.
Tree harvesting and establishment of secondrotation plantations are new activities for PT. MusiHutan Persada and experience is limited. On the otherhand, the company is very concerned with the long-termsustainability of its plantations as it has a long-termcommitment to supply wood to the pulp mill. Inter-rotation site management has been identified as one of
the critical factors contributing to the productivity(Nambiar and Brown 1997). This paper reports progressin the inter-rotation site productivity and managementresearch in an A. mangium plantation.
Location and Site DescriptionThe overall concession area is geographically located at1030 10'-1040 25'E longitude and 30 05'-50 28'S latitude.The plantations are established on alang-alang(Imperata cylindrica) grassland, scrublands and logged-over secondary forest areas. Both the grassland andshrublands were the result of long-term shiftingcultivation using fire for site preparation. The altituderanges from 60 to 200 m above sea level. The terrain isflat to undulating (0-8%) although some areas are quiterolling (8-15%). The experimental site is flat with slopeof 0-3%.
The area has a lowland humid environment withthe average daily temperature ca 290C (range 22-330C).
Effects of Site Management in Acacia mangiumPlantations at PT. Musi Hutan Persada,
South Sumatra, Indonesia
E.B. Hardiyanto1, A. Ryantoko1 and S. Anshori1
AbstractAcacia mangium plantations managed by PT. Musi Hutan Persada are located mostly on redyellow podsolic soils having poor nutrient reserves. This study on the effects of inter-rotationmanagement on site productivity addresses the growing concern about the long-termproductivity of the plantations. Preliminary results indicate total standing biomass at 9 yearsof age was 18.95 t ha-1 and litter production 16.80 t ha-1. Nitrogen, Ca and K are in highdemand by A. mangium, while P and Mg are taken up in smaller amounts. Harvestingmerchantable stems with minimum diameter of 10 cm will remove from one hectare 375 kgN, 9.3 kg P, 73 kg K, 267 kg Ca and 18 kg Mg.
1 Jl. Basuki Rahmat 98 Palembang, Indonesia. Tel: +62 711 310371,Fax: +62 711 363084, E-mail: [email protected]
6
StManagment-gs Final.pdf 1/31/01 8:29 PM Page 41 (Black plate)

Effects of Site Management in Acacia mangium Plantations at PT. Musi Hutan Persada, South Sumatra, Indonesia42
The annual rainfall in the last eight years has been in therange 1890-3330 mm, mostly between January to Maywith a dry spell between October and December.However, during the dry spell there may be some lightrain. The average relative humidity varies from 56% inthe dry season to 81% in the rainy season. In 1991, 1994and 1997 prolonged dry seasons increased fireincidence.
The soil is a red-yellow podsolic or typickandiudult (Soil Survey Staff 1992). It has an Aphorizon of dark grey clay (0-25 cm) overlying abrownish red clay B horizon of 25-80 cm depth over awell-defined yellowish red clay BC horizon (80-150cm). The soil is mainly derived from sedimentary rocksof tuff, sandy tuff, sandstone and claystone with a verysmall portion from volcanic materials. The majority ofthe soils are red-yellow podsolics (ultisol and oxisol).This soil is inherently poor in nutrient reserves, and haslow pH and low base saturation. Data on soil chemicalproperties under stands of A. mangium of different agesin the area reported by Setiawan (1993) are given inSiregar et al. (1999). Organic C ranged from low tohigh, Ca and Mg were low, N and K were low tomedium, and P ranged from medium to high.
Stand DescriptionThe first rotation plantations of A. mangium wereestablished using unimproved genetic materials from alocal land race (Subanjeriji). This seed source wasderived from provenances from the Cairns region ofQueensland, Australia. Plantations grown from this seedsource had suboptimal growth on the plantation site(Hardiyanto et al. 1997, Siregar et al. 1999). The landpreparation methods for grasslands included mechanicalpreparation (clearing and ploughing) on flat land orherbicides on sloping areas. Before 1995 the debris wasburnt. Trees were planted manually and fertilised onemonth after planting. Weeds were controlled,particularly in the first two years, by manual slashing orthe application of herbicide as required.
The majority of trees in first rotation plantationsare multistemmed since singling (reducing multipleleaders to one leader) was not applied. Singling is nowthe normal silvicultural practice. Consequently, thestem density sometimes exceeds 2000 stems ha-1. Atsix years of age the stand usually begins to self-thin andsome trees die. Currently 150-300 m3 ha-1 of marketable
wood with a minimum stem diameter over bark of 10cm can be harvested with overall average production ca175 m3 ha-1.
The first rotation stand in which this study is beingconducted was established in January 1990 on alang-alang grassland. A spacing of 3 x 3 m was used.Fertiliser at a rate of 10 g urea (4.6 g N), 10 g triplesuperphosphate (2.0 g P) and 10 g KCl (5.0 g K) wasapplied to each seedling one month after planting. Therewas no singling and the majority of trees weremultistemmed. The average density of the stand was1382 stems ha-1, 19 % of stems in the stand were dead.At clear felling the predominant height was ca 22 m andbasal area 30.4 m2 ha-1. The diameter range was 5-38 cmand the average diameter was 17.7 cm. More than 40%of living stems were in diameter class 10-15 cm, and28% in diameter class 20-25 cm (Fig. 1). The marketablewood was 228 m3 ha-1.
Figure 1. The diameter class distribution of live standingtrees
Experimental Details
Core ExperimentThe experiment was arranged in a randomised completeblock design, with five core treatments and fourreplications. The plot size is 40 x 36 m. There are 180trees (4 x 2 m) in total or 128 measured trees within eachplot.
The treatments in the core experiment are:BL0 No slash. All above ground biomass, litter and
understorey removed. BL1 Single slash, whole-tree harvest. All trees
including non-commercial parts removed.Understorey and litter are retained.
0
10
20
30
40
50
<5 5-10 10-15 15-20 20-25 25-30 >30
Diameter class (cm)
Fre
qu
ency
(%)
StManagment-gs Final.pdf 1/31/01 8:29 PM Page 42 (Black plate)

E.B. Hardiyanto, A. Ryantoko and S. Anshori 43
BL2 (1) Single slash, merchantable tree harvest. Onlystems of commercial size (diameter >10 cmincluding bark) removed. Non-commercialwood components, foliage, litter andunderstorey distributed evenly.
BL2 (2) Similar to BL2(1) to be used for destructivesampling for biomass and nutrientaccumulation data.
BL3 Double slash, merchantable tree harvest. Thesame as BL2 but non-commercial residues fromplot BL1 are brought in and distributed evenly,adding to the slash already present.
SC Standing crop. An area of ca 2 ha close to andrepresentative of the harvested stand left as acontrol for comparison and for measuringchanges in soil and other site properties.
Before starting the inventory of trees in each plot,standing dead trees were pushed by hand; those whichfell were categorised as litter. All trees within each plotwere measured for diameter at breast height. Sampletrees representing the whole range of diameter weretaken to determine the dry mass of all abovegroundbiomass components. Allometric relationships betweendiameter and biomass components were developedusing the model: Y = a + bX where Y is the dry biomasscomponent in kg and X is diameter. Biomass andnutrient quantities within each plot were then estimatedfrom the inventory tree data using the developedregression equations.
The dry mass of dead standing trees was calculatedseparately based on measured dbh, height and sampledry mass. Litter (woody materials, leaves (phyllodes)and reproductive parts) and understorey were sampledbefore tree felling. Four square plots, 1 m2 in area, weredistributed randomly, the litter sampled, and the dryweight of litter components and understorey were thendetermined.
The biomass and litter components as well asunderstorey were subsampled and oven-dried at 760C toa constant weight. Half of the subsamples were sent thelaboratory for chemical analysis, while the remainingsubsamples were kept for future use.
Soil cores were taken from five points within eachplot at soil depths: 0-10, 10-20 and 20-40 cm. Bulkdensity was measured from three points in each plot inevery block and also separated into soil depths similar tothose for chemical analyses. The soil core samples were
air dried and sieved through a 2 mm screen. The sampleswere subsampled; some of the subsamples were sent tothe laboratory for soil analysis and the remainingsubsamples were kept for further use.
Plant and soil analyses were carried out at theLaboratory of the Center for Soil and AgroclimateResearch, Bogor. Methods of biomass and litter analysiswere (Sudjadi et al. 1971, Staf Laboratorium Kimia1998): • total N, by H2SO4 digestion and Kjeldahl;• total P, by HNO3 and HClO4 digestion followed by
spectrophotometer;• total K, by HNO3 and HClO4 digestion and measured
by flame photometer; and• total Ca and Mg, by HNO3 and HClO4 digestion and
determined by atomic absorption spectrophotometer(AAS).
Methods for soil analysis were:• organic C, by K2CrO7 and H2SO4 digestion and
measured by spectrophotometer;• total N, by H2SO4 digestion and Kjeldahl;• available P, by the Bray # 1 extraction;• exchangeable K, Ca and Mg, by NH4Ac extraction
and measured by AAS; and• pH, in 1:2.5 water solution.
Tree felling and wood extraction from plots werecarried out manually from 31 August to 5 October 1999.This was followed by treatment application. Plantingwas done in December 1999 with a spacing of 4 x 2 m.The best available genetic source (Wipim, Papua NewGuinea, provenance seed stand) was used. Fertiliser wasapplied at following rates per tree: 30 g urea (13.8 g N)and 87.5 g SP36 (superphosphate containing 36 % P2O5
(14.0 g P) given at planting time. Singling will be donethree months after planting.
The experiment will be measured for growth(diameter and height) every six months for the first-twoyears and every year thereafter up to the end of rotation(8 years). Biomass and foliar sampling for nutrient willbe undertaken from BL2 (2) plots.
In addition to growth measurements and chemicalanalyses, information on litter decomposition will alsobe obtained. Freshly fallen leaves were collected fromthe stand in the study site before the stand washarvested, while branches (diameter of <1 cm and 1-5cm) were collected from newly felled trees. Leaves and
StManagment-gs Final.pdf 1/31/01 8:29 PM Page 43 (Black plate)

Effects of Site Management in Acacia mangium Plantations at PT. Musi Hutan Persada, South Sumatra, Indonesia44
branches were oven-dried at 350C to a constant moisturecontent. The oven-dried leaves and branches will be putin into 20 x 20 cm nylon mesh bag of 2 mm, 25 g foreach bag. Nylon bags containing litter components willbe spread randomly over the soil surface on BL2 afterseedlings have been planted in the field. A similar studywill be repeated under the designated standing crop. Aplot 40 x 36 m will be located away from the standboundary. The plot will be divided into three subplotswith a size of 40 x 12 m for each subplot. The previouslyprepared litter samples will be randomly distributed ineach subplot. Weight loss will be determined everymonth for the first three months, followed by twomonthly intervals up to the 13 months and then everythree months to the end of the trial (2 years).
Optional Treatments Two optional treatments, Nutrition studies A and B, willbe applied. Nutrition study A is a 3 x 3 factorialexperiment involving different rates of N and Papplication. The following rates of N will be used (g Ntree-1): 0, 13.8 (30 g urea) and 27.6 (60 g urea), whilethose of P are (g P tree-1): 0, 14.0 (87.5 g SP36), and 28.0(175 g SP36).
Nutrition study B is a missing element trialinvolving K and Ca. In total there will be four treatments:control, Ca, K and K+Ca. The rate of K is 0 g and 75 g(150 g KCl) tree-1, while that of Ca is 0 kg ha-1 and 275kg ha-1 or 730 kg ha-1 hydrated lime [Ca(OH)2]. All
fertilisers will be applied at planting time. Eachcombination of treatments will also receive the fertiliserscurrently applied: 30 g urea and 87.5 g SP36. Phosphorusfertiliser will be put in the planting hole, while N and Kfertilisers will be placed in a furrow about 10 cm fromthe seedling. Lime will be broadcasted.
The experiment is also laid out as a randomisedcomplete block design replicated four times. Thenutrient studies are set up at the same site as the coreexperiment and the block positions are adjacent to thecorresponding block of the core experiment. The plotsize is 24 x 36 m with a spacing of 4 m between rowsand 2 m within rows (108 trees in total or 64measured trees.
Ten soil cores per replication were taken across thetwo nutrient studies for chemical analyses. Soil wasseparated into three soil depths: 0-10, 10-20 and 20-40 cm.
Results
Soil PropertiesSoil physical and chemical properties of theexperimental site are given in Table 1, and nutrientstorage status of the experimental site is shown in Table2. The soil in the experimental site has a high claycontent and medium bulk density. As is the case withmost soils in Sumatra, it is very acidic and the pHgradually increases with soil depth.
Table 1. Soil physical and chemical properties of the experimental site
Properties Soil depth (cm)
0-10 10-20 20-40
Bulk density (g cm-3) 1.22 1.24 1.24Sand (%) 23.5 27.0 24.5Silt (%) 12.25 11.0 9.25Clay (%) 64.0 62.0 66.5pH (H20) 4.29 4.34 4.40pH (KCl) 3.84 3.85 3.89Organic C (%) 2.64 2.19 1.39N total (%) 0.23 0.19 0.13C/N 12.1 11.6 10.7P total (mg kg-1) 172.1 161.4 134.9Available P (mg kg-1) 5.77 4.95 3.35Exchangeable K (mg kg-1) 33.74 32.57 27.89Exchangeable Ca (mg kg-1) 148.6 110.7 74.4Exchangeable Mg (mg kg-1) 62.52 55.20 43.02
StManagment-gs Final.pdf 1/31/01 8:29 PM Page 44 (Black plate)

E.B. Hardiyanto, A. Ryantoko and S. Anshori 45
The N concentration in the surface layer is medium-low and decreases with soil depth. The level of organic Cin the top layer is medium, decreasing to low at 20-40 cm.The C/N ratios are relatively low which favours Nmineralisation. Concentrations of other elements such as Pand Ca are very low. Nitrogen level is highly correlatedwith soil organic C (R2=0.93) (Fig. 2). Correlationbetween the organic C content and P concentration(available P or total P) is very low, indicating that the soilorganic C has no direct effect on the available P in thisacidic soil with high P fixation.
Figure 2. Regression between total N and organic C inthe soil
Biomass
Regression analysisThe regression analysis involving stem diameter withdry weight of biomass components generally gave goodprecision, except for branches which showed lessprecision (R2 = 0.71). This is probably due to forking insome sample trees. For illustration, Fig. 3a. shows therelationship between diameter and dry weight of totalstanding biomass, and Figure 3b the relationshipbetween diameter and dry weight of stem wood.
Table 2. Organic C and nutrient content of soil in the experimental site
Soil depth Nutrient content (kg ha-1)
cm OC N P K Ca Mg
0-10 32 270 2660 7.1 41.3 182 76.510-20 27 110 2317 6.1 40.3 137 68.220-40 17 280 1623 4.2 34.5 92 53.3Total 76 660 6600 17.4 116.1 411 198.0
y = 0.0675x + 0.0385R2 = 0.93
0
0.05
0.1
0.15
0.2
0.25
0.3
0 1 2 3 4
Total Nitrogen (%)
Org
anic
Car
bo
n(%
)
y = 18.907x - 160.48R2 = 0.9399
-100
0
100
200
300
400
500
0 10 20 30 40
Diameter (cm)
Tota
ldry
bio
mas
s(k
g/t
ree)
y = 16.527x - 171.04R2 = 0.9385
-50
0
50
100
150
200
250
300
350
0 10 20 30 40
Diameter (cm)
Dry
ste
mw
oo
d(k
g/t
ree)
Figure 3 a. Regression between diameter and dry weight of total standing biomass
b. Regression between diameter and dry weight of stem wood
Biomass distribution and nutrient contentThe dry mass of tree components between plots variedlittle. The average biomass per plot was: stem wood(17.95 t), bark (2.05 t), branches, including stem lessthan 10 cm diameter, (6.71 t) and leaves (0.59 t). Drymass of standing dead wood varied between plots, from0.66 to 1.16 t with the average 0.84 t. Litter biomass
StManagment-gs Final.pdf 1/31/01 8:29 PM Page 45 (Black plate)

Effects of Site Management in Acacia mangium Plantations at PT. Musi Hutan Persada, South Sumatra, Indonesia46
ranged from 2.2 to 2.81 t plot-1, while that of understoreyvaried from 0.15 - 0.47 t plot-1.
The dry weights for biomass of the stand in theslash study are given in Table 3. The total weight ofstanding biomass was 189.5 t ha-1. More than 73% ofthe total dry biomass was merchantable stem, of which66% was wood and 7.5% bark. Leaves (2.2%) andbranches/upper stem (24.6%) made up the remainingbiomass. Fruits and flowers made up only a smallportion and their presence depends on the season.Litter production in this stand was 16.8 t ha-1 andunderstorey was 1.9 t ha-1.
Nitrogen, Ca and K appear to be in the highestdemand as shown by nutrient content in the biomass.In comparison Mg and P were a smaller quantities. Ingeneral the highest concentrations of nutrients were
found in leaves, flowers and fruit. These werefollowed by stem bark, branches and stem wood inthat order (Table 4).
The nutrient content in the litter indicates that N isfound in the largest quantity followed by Ca, K, Mg inthat order. Phosphorus is found in the smallest quantityat 2.5 kg ha-1. For nutrient content in the understorey Nwas found in the greatest quantity at 33.9 kg ha-1
followed by K, Ca, and Mg. Again, P was found in thesmallest quantity.
Distribution of Harvest Residues, Litter andUnderstoreyFollowing treatment application, the average biomassin BL1, BL2 and BL3 plots are shown in Table 5. Theresults are estimates based on biomass regressionsdescribed earlier (Fig. 3, Table 3).
Table 3. Biomass and nutrient content of Acacia mangium stand at 9 years of age
Component Biomass Nutrient (kg ha-1)
(t ha-1) N P K Ca Mg
Leaves 4.1 113 3.5 58.3 20.5 6.4
Branches and stem (<10 cm) 46.6 173 1.5 59.9 128.1 17.5
Stem wood (>10 cm) 124.7 236 7.8 37.4 103.5 12.5
Bark 14.2 1390 1.5 35.6 163.7 5.5
Total living standing biomass 189.5 661 14.3 191.2 415.8 41.9
Standing dead wood 5.8 15.8 0.3 2.7 10.1 0.9
Litter 16.8 271 2.5 29.5 123.3 21.9
Understorey 1.9 35.5 1.2 33.9 7.3 4.5
Table 4. Nutrient concentration of biomass components
Biomass component Nutrient (%)
N P K Ca Mg
Stem wood 0.19 0.01 0.03 0.08 0.01
Stem bark 0.98 0.01 0.25 1.15 0.04
Live branches (<1 cm) 1.00 0.03 0.82 0.56 0.22
Live branches (1-5 cm) 0.36 0.01 0.13 0.26 0.03
Live branches (5.1-10 cm) 0.26 0.00 0.06 0.22 0.02
Dead branches (< 1 cm) 0.67 0.01 0.11 0.62 0.09
Dead branches (1-5 cm) 0.63 0.00 0.07 0.58 0.05
Dead branches (5.1-10 cm) 0.45 0.00 0.09 0.42 0.03
Leaves 2.76 0.09 1.42 0.50 0.16
Flowers 2.16 0.12 1.74 0.37 0.18
Pods 1.76 0.08 1.46 0.20 0.11
StManagment-gs Final.pdf 1/31/01 8:29 PM Page 46 (Black plate)

E.B. Hardiyanto, A. Ryantoko and S. Anshori 47
Table 6. Biomass comparison of Acacia mangium with other tree species
Species Site Age Biomass MAI Biomass Reference(yr.) (t ha-1) (t ha-1 yr-1)
Acacia mangium Subanjeriji, 9 189.5 21.1 This study
South Sumatra
A. mangium Subanjeriji, 9 146.4 16.3 Ihwanudin
South Sumatra (1994)
A. mangium Sarawak, 4.5 82.1 18.2 Tsai (1986)
Malaysia
A. mangium Sarawak, 6 123.2 20.5 Helenda
Malaysia (1988)
Eucalyptus grandis Sao Paulo, Brazil 7 160.9 23.0 Goncalves
et al. (1999)
Paraserianthes falcataria Philippines 5 76.6 15.1 Kawahara
et al. (1981)
It is clear that the increasing amount of harvestresidues in BL3 plot (double slash) will also improve thenutrient status in the plot. The nutrient content in BL1
plot will only come from litter and understorey.Treatment BL0 would have only negligible amounts ofresidue and nutrients associated with slash and litter.
DiscussionThe productivity of A. mangium at this site is high(189.5 t ha-1 aboveground biomass). It is much higherthan reported by Ihwanudin (1994) for an A. mangiumstand in the same region (Subanjeriji) at the same age. Itis also much greater than reported by Helenda (1988)from a biomass study in Sarawak where at six years ofage total dry weight living biomass of the plantation wasestimated at 123.2 t ha-1. Total biomass of A. mangiumin this study is slightly lower than Eucalyptus grandisplanted in Brazil (Table 6).
Litter production of the stand was alsoreasonably high (16.8 t ha-1). Rachmawaty (1993)reported that litter accumulation under an 8-year-oldA. mangium stand in Subanjeriji was 13.0 t ha-1. Therate of litter decomposition and mineralisation of A.mangium is likely to be relatively rapid as suggestedby low C/N ratios in the soil (Table 1). The litterdecomposition study which is being conducted willinvestigate this. A study by Setiawan (1993) indicatedthat under an 8-year-old stand the remaining weight oflitter after 12 months was 26.8% for leaves, 31.1% forreproductive parts and 35.5% for twigs. As expectedthe N content in the litter is high because of the N-fixing ability of A. mangium.
Litter has an important role in the A. mangiumstand, making up about 8.9% of the total livingbiomass, while understorey plays a minor role as itcomprises only 1.03% of the total living biomass.
Table 5. The average biomass residues and nutrient content for different plots
Plot Biomass residues Nutrient (kg ha-1)
(t ha-1) N P K Ca Mg
BL1 17.49 303.9 5.8 70.7 133.3 28.5
BL2 62.66 627.2 75.1 254.1 295.6 58.8
BL3 99.54 1000.3 139.0 419.7 471.6 91.8
StManagment-gs Final.pdf 1/31/01 8:29 PM Page 47 (Black plate)

Effects of Site Management in Acacia mangium Plantations at PT. Musi Hutan Persada, South Sumatra, Indonesia48
The dead standing trees in the stand are more than5.8 t ha-1 which is high. As mentioned in the precedingsection, the stand had high stocking density which isvery typical in A. mangium stands with multiple stemsand grown at close spacing.
Soil nutrient depletion in plantations grown onintensive short rotations (6-7 years) will be very rapidif they are improperly managed. If harvesting removesstem wood of merchantable size and bark, the loss ofnutrients per hectare will be: N 375 kg, P 9.3 kg, K 73kg, Ca 267 kg and Mg 18 kg. This represents a 5.7%loss of total N; loss of exchangeable cations will be63.4% K, 65.0% Ca and 9.1% Mg of the total nutrientpool and that of extractable P in the soil 53.8% (basedon a soil depth of 40 cm). The magnitude of the loss ofthese nutrients, particularly P, K and Ca is cause forconcern about the long-term site productivity since,apart from N, nutrient reserves in the soil are very low(Tables 1 and 2). Reduction of nutrient removal byleaving all harvest residues on the site and returningnutrients to the site in the form of fertiliser seemsessential. The nutrition study currently beingconducted will examine this further.
ConclusionsTotal standing biomass of A. mangium on the study siteis high (189.5 t ha-1) at 9 years old. Among the nutrientstaken up by A. mangium stand, N, Ca and K are in thehighest demand. The net amount of P in biomass,although it appears small, represents a large portion ofextractable P. Harvesting of merchantable stems,including bark, will remove large quantities of nutrients.The level of nutrient removal and the means of reducingnutrient loss are among the many factors that need to betaken into account in managing long-term siteproductivity of A. mangium plantations, since thenutrient reserves in the soil are low.
AcknowledgementsWe would like to express our gratitude to CIFOR forsponsoring the research network and arranging theworkshop. We also acknowledge the management ofPT. Musi Hutan Persada for their strong commitmentto this site productivity study. Our special thanks areextended to Dr. Sadanandan Nambiar of CSIRO for hisinvaluable advice and critiques.
ReferencesGoncalves, J.L.M., Poggiani, F., Stape, J.L., Serrano,
M.I.P., Mello, S.L.P., Mendes, K.C.F.S., Gava, J.L.and Benedetti, V. 1999. Eucalypt plantations in thehumid tropics: Sao Paulo, Brazil. In: Nambiar,E.K.S., Cossalter, C. and Tiarks, A. (eds.) Sitemanagement and productivity in tropical plantationforests: workshop proceedings 16-20 February1998, Pietermaritzburg, South Africa, 5-12.CIFOR, Bogor.
Hardiyanto, E.B., Siregar, S.T.H., Chandralika, andSyarifudin. 1997. Hasil uji provenans Acaciamangium umur 28 bulan di Setuntung. TechnicalNotes R&D PT. Musi Hutan Persada Vol.7 No.5.(Internal publication). 7p.
Helenda, C.J. 1988. The ecology of an Acaciamangium plantation established after shiftingcultivation in Niah Forest Reserve. ForestResearch Report, Forest. Ecology 1. Ecology UnitForest Department, Kuching, Sarawak, Malaysia.59p.
Ihwanudin, A. 1994. Ketersediaan unsur hara N, P, Kdi hutan tanaman Acacia mangium Willd. di ArealHTI Subanjeriji, Sumatra Selatan. (UnpublishedThesis). Fakultas Kehutanan, Institut PertanianBogor, Bogor. 84p.
Kawahara, T., Kanazawa, Y. and Sakurai, S. 1981.Biomass and net production of man-made forestsin the Philippines. Journal of the Japanese ForestrySociety 63: 320-327.
Logan, A.F. 1987. Australian acacias for pulpwood.In: Turnbull, J.W. (ed.) Australian acacias indeveloping countries, 89-94. ACIAR ProceedingsNo. 16. ACIAR, Canberra.
Nambiar, E.K.S. and Brown, A.G. 1997. Towardssustained productivity of tropical plantations:science and practice. In: Nambiar, E.K.S andBrown, A.G. (eds.) Management of soil, nutrientsand water in tropical plantation forests, 527-557.ACIAR Monograph No. 43. ACIAR, Canberra.
Rachmawaty, V.A. 1993. Pengukuran produktivitasseresah Acacia mangium Willd. di hutan tanamanindustri Subanjeriji, Sumatera Selatan.(Unpublished Thesis). Fakultas Kehutanan, InstitutPertanian Bogor, Bogor. 93p.
Setiawan, I. 1993. Studi proses dekomposisi Acaciamangium Willd. di hutan tanaman industri
StManagment-gs Final.pdf 1/31/01 8:29 PM Page 48 (Black plate)

E.B. Hardiyanto, A. Ryantoko and S. Anshori 49
Subanjeriji, Sumatera Selatan. (Unpublishedthesis). Fakultas Kehutanan, Institut PertanianBogor, Bogor. 98p.
Siregar, S.T.H., Hardiyanto, E.B. and Gales, K. 1999.Acacia mangium plantations in PT Musi HutanPersada, South Sumatera, Indonesia. In: Nambiar,E.K.S., Cossalter, C. and Tiarks, A. (eds.) Sitemanagement and productivity of tropical plantationforests: workshop proceedings 16-20 February1998, Pietermaritzburg, South Africa, 39-44.CIFOR, Bogor.
Soil Survey Staff. 1992. Keys to soil taxonomy.SMSS Technical Monograph No. 19. 5th ed.Pocahontas Press, Blacksburg, Virginia. 541p.
Staf Laboratorium Kimia. 1998. Penuntun analisiskimia tanah dan tanaman. (Unpublished). PusatPenelitian Tanah dan Agroklimat, Bogor.
Sudjadi, M., Widjik, I.M. and Soleh, M. 1971.Penuntun analisa tanah. Publikasi No. 10/71.Lembaga Penelitian Tanah, Bogor.
Tsai, L.M. 1986. Biomass and productivity of 4.5year-old Acacia mangium in Sarawak. Pertanika9: 81-87.
StManagment-gs Final.pdf 1/31/01 8:29 PM Page 49 (Black plate)

IntroductionNutrient cycles in undisturbed natural forests are in astate of dynamic equilibrium where inputs and outputsof nutrients are in balance and plant demand fornutrients is met by efficient recycling systems - the so-called ‘closed nutrient cycle’ (Zech and Drechsel 1995).Where short-rotation plantations replace natural forests,changes in nutrient storage and cycling processes occur.These changes are due to factors such as harvest exports,changed distribution and quality of organic matter,altered patterns of nutrient inputs and outputs(fertilisation, erosion, leaching, volatile losses etc.) andmodified patterns of organic matter turnover. All ofthese factors can impact on storage and supply of soilnutrients for plant growth and consequently thesustainability of plantation systems.
India is the world’s largest grower of eucalyptplantations. They occupy 4.8 million ha (Davidson1995) and represent about 25% of the country’splantation estate. Because natural forests cannot beharvested in India, plantations of various tree species are
becoming increasingly important for supply of forestproducts such as industrial wood and domesticfirewood. However, earlier studies have suggested thatshort rotations of some species in plantations will not besustainable in the long-term (e.g., Bargali and Singh1991). Nevertheless, there is clear evidence fromresearch in other parts of the world that prudentmanagement, especially that directed at conservationand enhancement of soil organic matter and soil nutrientstatus, can result in sustainable ecosystems.Furthermore, it has been demonstrated that site qualityand wood production can be improved over successivecrop rotations (Nambiar 1996). The need to apply theseprinciples in India in order to maximise sustainableproduction from plantations is given additional impetusbecause of the limited land-base available and theconstraints to increasing the area under plantations.
Effects of Site Management on EucalyptusPlantations in the Monsoonal
Tropics - Kerala, India
K.V. Sankaran1, K.C. Chacko1, R.C. Pandalai1 J. Kallarackal1, C.K. Somen1, J.K. Sharma1, M. Balagopalan1, M. Balasundaran1, S. Kumaraswamy1, S. Sankar1, R.J. Gilkes2,
T.S. Grove3, D. Mendham3 and A.M. OÕConnell3
AbstractThe research is being conducted at four different locations in Kerala and is based on the two maineucalypts (Eucalyptus tereticornis and E. grandis) used in industrial plantations in the region. At eachlocation, a series of six designed experiments has been initiated to investigate aspects of harvest residuemanagement, nutrient application, ground vegetation control, use of legume undercrops to increase soilfertility and practical methods of water and soil conservation. Within the general experimental frameworkestablished, research is focused on four inter-linked subprojects, investigating the impact of silviculturaloptions on - (1) nutrient status and nutrient cycling, (2) plant physiology and water relations (3) treegrowth and nutrient uptake, and (4) soil process and tree growth modelling. In this paper we give detailsof the research programmes and describe initial results on site inventory, turnover of nutrients in harvestresidues and plant physiological and tree growth responses to applied treatments.
1 Kerala Forest Research Institute, Peechi, 680 653, Kerala, India2 University of Western Australia, Nedlands, WA 6907, Australia3 CSIRO Forestry and Forest Products, Private Bag, PO Wembley, WA6014, Australia
7
StManagment-gs Final.pdf 1/31/01 8:29 PM Page 51 (Black plate)

Effects of Site Management on Eucalyptus Plantations in the Monsoonal Tropics - Kerala, India 5252
Thus, enhancing productivity from existing eucalyptforests and sustaining productivity in subsequentrotations is a priority for research.
Kerala has about 40 000 hectares of eucalyptplantations distributed across two broad elevationalregions. At lower elevations on the undulating coastalplains E. tereticornis dominates and accounts for about60% of the State’s eucalypt resource. Here, soils arederived from erosional material deposited as colluviumand from in situ weathering of granitoid rock. Lateritealso occurs frequently. At higher elevations, in theWestern Ghats, E. grandis is the principal plantationspecies. The research is focussed on these two species.A brief account of the productivity of eucalyptplantations in Kerala and aims of this research are givenin Sankaran (1999). In summary, the aim is to providethe scientific data for developing silvicultural regimes tooptimise conservation and use of site resources. It ishypothesised that these principles will form the basis fordeveloping sustainable management systems foreucalypt plantations in India in general.
In this paper we describe research directed atidentifying and developing practices for manipulatingsoil organic matter, and soil and tree nutrient and waterstatus. We focus on results from the harvest residuemanipulation experiments but also include data fromother experiments, especially the nutrient rate trials, forcomparative purposes.
Location and Site DescriptionKerala State, located between latitudes 8-130N, issituated in southwest India between the Arabian Sea andthe Western Ghats mountain ranges. There are two lowaltitude experimental sites based on E. tereticornis atKayampoovan (10041'N, 76023'E, 120 m) and Punnala(9006'N, 76054'E, 150 m) located on foothills adjacent tothe undulating coastal plain. respectively. In the WesternGhats there are two sites with E. grandis at Surianelli(10002'N, 77010'E, 1280 m) and Vattavada (10008'N,77015'E, 1800 m)
For a detailed description of the environment ofKerala and the experimental sites see Sankaran (1999).The climate is tropical warm humid monsoonal. Thereare two main monsoons. The southwest monsoon,corresponding with the principal rainy season, starts in
early June and extends to October. At the main KFRIresearch centre at Peechi annual rainfall is 2500 mm,most falling in June, July and August (Fig. 1). This isalso the coolest period of the year. The northeastmonsoon is relatively dry with only occasional rainsduring December to February. The summer season isMarch to May. Average rainfall for Kerala is 3000 mm(range 2200-3600 mm) in about 120 rain days. Meantemperature is 270C (range 20-420C) and relativehumidity ranges between 64% (Feb-March) and 93%(June-July).
Figure 1 Climatic data for Peechi
At all four experimental sites the soil parentmaterials were saprolite or predominantly saproliticcolluvium derived from Precambrian granites andgneiss. These igneous and metamorphic rocks and inparticular the charnockites may contain abundantferro-magnesian minerals that contribute to thechemical fertility of sites where rocks are present atshallow depth or in outcrop. At all sites the local reliefand depth to bedrock or saprolite is highly variable andmay be reflected in the heterogeneity of standperformance.
Most soil profiles contained a ferralic B horizon(FAO 1988) although the persistence of rock structure asremnant geneissic saprolite fragments sometimesexceeded 5 volume percent which is the upper limit forthe horizon and may require assignment to an argic Bhorizon. Until complete analytical data are available, thesoils have been broadly classified as ferralsols. The verylow contents of exchangeable cations present in the Bhorizon of some profiles may lead to their assignment asgeric ferralsols.
05
1015202530354045
Jan Feb Mar Apr May Jun Jul Aug Sep Oct Nov Dec
Month
Tem
pera
ture
0
200
400
600
800
1000
Rainfall Max Temp Min Temp
StManagment-gs Final.pdf 1/31/01 8:29 PM Page 52 (Black plate)

Sankaran et al. 53
Because of the complex interactions of erosion ofsaprolite and deposition of colluvium, there is aconsiderable variation in profile depth and morphologyat each site. This variation is reflected in the veryvariable extent of root proliferation in subsoil horizons.It is probable that the capacity of the soil column toretain water is strongly dependent on the depth of soilover bedrock or saprolite.
Experimental DesignThe project incorporates experiments within two basicframeworks: (1) experiments at the inter-rotationperiod when plantations are harvested and re-established (inter-rotation phase), and (2) a smallerexperiment where comparisons of nutrient status andnutrient cycling are being made between anestablished eucalypt plantation and adjacent areas ofnative vegetation. The inter-rotation experiments arethe core of our research and have been established inplantations at four locations.
Five experiments were established at eachlocation during 1998. The design of each is arandomised block with 4 replicates. Plot size is 20 x 20m, tree spacing 2 x 2 m, with 100 seedlings per plot (36measurement trees after allocating buffer rows - exceptat Kayampoovam where 18 x 18 m plots were used dueto restricted area available). Following harvesting ofstands at each site, experiments were established toinvestigate impacts of (1) manipulation of harvestresidue slash, with six treatments, including burning,slash removal, slash retention and slash addition; (2)use of inter-row legumes as cover crops, with threelegumes plus a non-legume control at each site; (3)conservation of soil and water using soil trenching tominimise overland flow during heavy monsoonalrainfall events; (4) ground vegetation managementusing three different strategies for control of weedgrowth; and (5) nutrient additions, primarily focussingon application of N and P fertilisers with basaladditions of other major and minor nutrients.
The harvest residue management studyincorporated 6 treatments. The first five treatmentsincluded the addition of a spot application of fertiliser(100g N:P:K 17:7:17) applied in two doses at plantingand 3 months later to assist seedling establishment.Harvest residue management treatments were:
BL0 No slash - all litter and, slash material removed.BL1 Single slash - uniformly redistributed. BL3 Double slash - addition of slash from the ‘no
slash’ (BL0) treatment.L Leaf residue only retained; all wood removed.BS Burn - (BL1 - slash burnt).B Burn without added starter fertiliser.
Experimental DetailsIn each experimental area soils were characterised intwo to three soil pits excavated to depths exceeding 1 m.Soil samples were collected for chemical andmineralogical analysis. Pre-harvest inventories of plantand litter biomass and their nutrient stores were obtainedfor each site. Aboveground biomass and nutrient storesin trees were determined by measuring tree diameter oneach plot and applying allometric functions derivedfrom destructive tree harvesting. Biomass and nutrientcontent of shrubs and litter were determined fromharvested quadrats. Surface soils (0-10 and 10-20 cm)were sampled within each experimental plot in May1998 to provide base-line soil chemical characteristicsfor each of the applied organic matter treatments (ninesoil cores, 42 mm diameter, bulked within each plot).Annual sampling of soil from selected treatments isbeing conducted in July-September each year toevaluate impacts of applied treatments on critical soilcharacteristics and processes. The focus is on changes inC and P status of soils and their N supplying capacity.Organic matter turnover and nutrient release fromdecomposing harvest residues is being evaluated bysequential harvest of bulk residue quadrats in the fieldand by the litter bag technique using specific harvestresidue fractions in each bag. Plant physiologicalresponses are being evaluated on selected treatments attwo sites through measurements of leaf area index, leafwater potential, stomatal conductance andphotosynthesis. Tree growth is being monitored atregular intervals through measurements of stem diameterand height.
Results
Stand DescriptionBiomass of the original stands varied four-foldbetween the different sites, partly as a result ofdifferences in stocking rates of the coppiced regrowth
StManagment-gs Final.pdf 1/31/01 8:29 PM Page 53 (Black plate)

Effects of Site Management on Eucalyptus Plantations in the Monsoonal Tropics - Kerala, India 5454
and partly due to differences in soil fertility andcompetition from weeds between the experimentalareas. At each site the majority of tree biomass was instem wood (70-80%) while bark contributed 9-14% oftotal tree weight (Fig. 2). Leaves were a minorcontributor, representing 3% of the mass.
Differences in nutrient distribution between stands(Table 2) reflected in part the different amounts of totalbiomass accumulated at the various sites (Fig. 2) and theamounts of nutrient-rich materials such as leaves andsmall twigs present in each. The Punnala site wasnotable in this respect. Trees at this site produced thesmallest amounts of total aboveground biomass and thesmallest amounts of leaves and twigs. Across all sitesabout half the P in the tree biomass was associated withbole wood. Aboveground biomass at Punnala wasparticularly low in P, possibly because of the lownatural plant-available P status of soil at this site asindicated by the response in tree growth to addedfertilisers (see Fig. 7 below).
Table 1. Vegetation characteristics prior to harvesting the existing stands
Site Species Density Tree Shrub Litter (stems biomass biomass biomassha-1) (t ha-1) (t ha-1) (t ha-1)
Kayampoovam E. tereticornis 1356 63.0 6.7 12.1Punnala E. tereticornis 965 33.7 4.5 10.5Vattavada E. grandis 3898 141.9 2.4 10.6Surianelli E. grandis 1056 43.5 9.0 14.4
Table 2. Nutrient distribution in tree components
Site/species Nutrient Nutrients stores (kg ha-1)
Leaves Branches Bark Wood Total
Kayampoovam N 38.9 32.0 32.5 74.6 178(E. tereticornis) P 2.4 8.2 11.0 20.5 42.1
K 23.0 45.6 70.8 90.3 230Punnala N 20.7 8.1 20.2 42.7 92(E. tereticornis) P 1.3 1.5 2.6 2.9 8.3
K 14.5 12.3 24.3 33.3 85Surianelli N 58.1 15.3 9.0 23.5 106(E. grandis) P 4.2 2.5 3.7 11.9 22.3
K 16.9 16.1 16.5 39.9 89Vattavada N 82.0 36.7 34.9 78.8 232(E. grandis) P 5.4 4.7 5.2 12.8 28.1
K 42.0 52.7 67.1 109.1 271
Figure 2. Distribution in biomass of tree components atthe four experimental sites
0
20
40
60
80
100
120
140
160
S.Nelli V.Vada Punnala K.Poovam
Bio
ma
ss(t
ha-1
)
Leaf
Branch
Bark
Wood
Aboveground storage of N was dominated by leafand wood fractions. All the P and N in boles would havebeen removed by harvesting the wood. Nitrogen storedin leaves and deposited in harvest residues would havebeen either volatilised during site preparation burningor recycled through decomposition and Nmineralisation where residues were retained.
StManagment-gs Final.pdf 1/31/01 8:29 PM Page 54 (Black plate)

Sankaran et al. 55
Table 3. Nutrients in trees, shrubs and litter for each site prior to harvesting
Kayampoovam Punnala Surianelli Vattavada
N P Ca N P Ca N P Ca N P Ca
(kg ha-1)
Trees 178 42.1 405 92 8.2 194 106 22.3 405 236 28.1 724
Shrubs 66 5.6 55 41 3.5 44 87 6.5 51 48 6.2 29
Litter 117 8.1 175 96 7.1 121 110 6.6 207 66 5.0 145
Site Inventory of Nutrient StoresAboveground nutrient stores for each site are shown inTable 3. These pools are small compared with the totalstores in the soil within the tree rooting zone (data notshown). However, they do represent the biologicallyactive pool of nutrients at each site. The abovegroundcomponent is also that part of the ecosystem most likelyto be affected by stand harvesting and subsequentmanagement of harvest residues during site preparationfor the next tree crop.
Harvest Residue Biomass and NutrientContentThe amounts of harvest residues (treatment BL1 - Table 4)partly reflected differences in site productivity andaccumulated biomass at each site. Smallest amounts ofresidues were at Punnala and Surianelli and greatestamounts at Kayampoovam and Vattavada. The amount ofharvest residues at Vattavada was lower than expectedand may reflect greater efficiency of wood extractionfollowing logging. Total amounts of harvest residue, theproportion of the various slash fractions and differencesbetween species in tissue nutrient concentrationsdetermined the quantities of nutrients deposited on thesoil during logging operations. The amounts of nutrientsin slash at Punnala were markedly lower than at the otherthree sites and resulted from both the small weight ofharvest residues and the low proportion of leaf material inthe slash.
Table 4. Harvest residue biomass and nutrient content at each site (treatment BL1)
Kayampoovam Punnala Surianelli Vattavada
Mass N P Mass N P Mass N P Mass N P
t ha-1 kg ha-1 t ha-1 kg ha-1 t ha-1 kg ha-1 t ha-1 kg ha-1
Leaf 2.9 52 2.7 0.5 8 0.4 5.5 96 5.1 2.3 49 2.9
Bark 5.3 20 5.0 3.3 12 3.1 1.4 8 0.5 4.7 18 2.2
Wood 11.2 56 10.3 2.6 13 2.4 4.9 27 2.2 11.9 62 6.6
Total 19.4 128 18.1 6.4 33 5.9 11.8 131 7.9 18.9 128 11.7
Figure 3. Weight loss from mesh bags duringdecomposition of harvest residue fractions for 1 year atPunnala (E. tereticornis) and Vattavada (E. grandis)
(a) E. tereticornis
0
50
100
0 4 8 12Months
Ma
ssre
ma
inin
g
Leaf Bark T 0.5 cmT 2 cm T 4 cm
Ma
ssre
ma
inin
g
(b) E. grandis
0
50
100
0 4 8 12Months
Leaf Bark T 0.5 cmT 2 cm T 4 cm
StManagment-gs Final.pdf 1/31/01 8:29 PM Page 55 (Black plate)

Effects of Site Management on Eucalyptus Plantations in the Monsoonal Tropics - Kerala, India 56
Organic Matter TurnoverDecomposition of harvest residues and return ofnutrients to the soil is being evaluated by twomethods. Firstly, pre-selected randomly locatedquadrats within the harvest residue experiment arebeing sampled periodically to determine changes inweight and nutrient content. Secondly, a conventionalmesh bag study is being used to determinedecomposition rates of five fractions from the harvestresidues at each site. Here we report data from themesh bag study for one each of the E. tereticornis andE. grandis sites (Fig. 3, Table 5).
Weight loss differed markedly between residuefractions and species. Among the various slash residues,leaves decomposed fastest at all sites compared to otherfractions. Decay rate of bark was similar to (E.tereticornis) or greater than (E. grandis) that of twigs.Decay rates of slash residues at E. tereticornis siteswere higher than those at the high elevation E. grandissites. For example, more than 90% of leavesdecomposed in the first year after harvest at the E.tereticornis sites while about one third of leaf residuesremained at the E. grandis sites after the same period.Likewise, while about two thirds of the bark weight waslost in 12 months at E. tereticornis sites, more than 60%remained at the E. grandis sites. Decomposition rateconstants and residue half lives (Table 5) determinedfrom fitted first order decay functions (Olson 1963)reflected these differences between the sites andspecies. In general, half-lives were two to four-foldgreater for E. grandis than for E. tereticornis residues.
Release of nutrients from decomposing harvestresidues also differed markedly between the species andthe fractions examined (Fig. 4).
Table 5. Decomposition rate constants and half lives for various harvest residue fractions of E. tereticornis and E. grandis and goodness of fit of the first order decay function (Olson 1963)
Residue type Punnala (E.tereticornis) Vattavada (E. grandis)K Half life R2 K Half life R2
(yr-1) (yr) (yr-1) (yr)
Leaf 2.83 0.24 0.92 1.12 0.62 0.82
Bark 1.13 0.60 0.95 0.56 1.25 0.68
Twig 0.5 cm 1.58 0.4 0.83 0.37 1.88 0.87
Twig 2 cm 0.87 0.8 0.72 0.31 2.21 0.64
Twig 4 cm 0.90 0.77 0.95 0.38 1.83 0.66
Figure 4. Nutrients remaining in decomposing leafmaterial after 5 months at (a) Punnala (E. tereticornis)and (b) Vattavada (E. grandis)
(a) E. tereticornis
0
50
100
P N Mg Ca K
%R
emai
nin
g
(b) E. grandis
0
60
120
P N Mg Ca K
%R
emai
nin
g
For both species, release of K duringdecomposition was rapid with the majority of K lostfrom all residues in the first month of exposure in thefield. Release of other nutrients was slower with ratesfollowing the trend Mg and P most rapid, Caintermediate and N slowest for most residuefractions. Release of all nutrients was generally mostrapid from leaf residues, reflecting the rapiddecomposition rate of this fraction relative to theother residues (Fig. 4, Table 5).
StManagment-gs Final.pdf 1/31/01 8:29 PM Page 56 (Black plate)

Sankaran et al. 57
Differences between the species in release rates ofnutrients generally mirrored the difference in decayrates, with more rapid release of nutrients from E.tereticornis than E. grandis residues. In particular Ndynamics differed markedly between the two species(Fig. 5). For E. grandis there was no net mineralisationof N from decomposing residues after 5 months, with allfractions showing immobilisation of N. For the morerapidly decaying E. tereticornis residues net Nmineralisation occurred in all fractions except barkduring this period.
Plant Physiological Responses to AppliedTreatmentsAt this stage, plant physiological data (pre-dawn leafwater potential, stomatal conductance photosynthesis andleaf area index) are available only during the first year oftree growth. No clear trends due to treatment effects areevident in the data. However, these may develop overtime as the trees grow and completely occupy the sites.Measurements to date indicate low levels of water stressin both E. tereticornis and E. grandis with pre-dawn leafwater potentials in the range 0.4 to 0.8 MPa at both sitesduring the hottest period of the year in February-March1999. Decline in pre-dawn leaf water potential in Marchcorresponded with periods of increased air temperaturesand to a reduction in soil water content at both sites. FromApril onwards pre-dawn water potentials graduallyincreased in both species.
Measurements of stomatal conductance (gs) inNovember and March in E. tereticornis showed no cleartreatment effects and no decline over the measurementperiod. In contrast, in E. grandis, there was a markeddecline in gs between November and March on alltreatments, suggesting greater adjustment in this species
57
in response to environmental constraints. Furthermeasurements are in progress to follow these trends asthe stands age.
Leaf area index (LAI) of each species increased inthe period December to March as the trees establishedand crown expansion occurred. However LAI values byMarch were still mainly in the range 0.3 to 1.0 at the E.tereticornis site and 0.2 to 0.5 at the E. grandis site,reflecting the early stage of tree growth. Estimates ofLAI within each of the harvest residue managementexperiments showed no clear treatment effects at thisstage of tree development.
Tree Growth in Response to OrganicResidue TreatmentsSeedling growth at the four experimental sites paralleledthe productivity of the previous stands (Figs. 2 and 6)with Surianelli being the least productive and Vattavadathe most productive sites. However, in the newlyestablished stands there was only limited response toapplied harvest residue management treatments (Fig. 6).Of the six treatments, the burn without added starterfertiliser showed systematically less growth than theother residue treatments. At Punnala and Surianelli thesedifferences were statistically significant. However, theseeffects were due to differences in applied nutrients(addition or not of a spot application of starter fertiliser)rather than the harvest residue management treatmentsapplied. There were no significant differences in growthbetween the other harvest residue treatments at any ofthe four experimental sites. However, the BS treatmentshowed greatest growth across all sites, suggesting anearly positive effect to burning on growth. This isconsistent with an increase in available nutrients insurface soils due to ash additions following burning asindicated by the surface soil chemistry (data not shown).
Figure 5. Amounts of N remaining in various decomposing harvest residue materials after 5 months at Punnala(E. tereticornis) and Vattavada (E. grandis).
(a) E. tereticornis
0
50
100
150
200
250
Leaf Bark Twig 0.5 cm Twig 2 cm Twig 4 cm
%N
rem
ain
ing
(b) E. grandis
0
50
100
150
200
250
Leaf Bark Twig 0.5 cm Twig 2 cm Twig 4 cm
%N
rem
ain
ing
StManagment-gs Final.pdf 1/31/01 8:29 PM Page 57 (Black plate)

Effects of Site Management on Eucalyptus Plantations in the Monsoonal Tropics - Kerala, India 5858
DiscussionThe amounts of nutrients in harvest residues (Table 4)correspond to a relatively small proportion of the totalstore of site nutrients to 1 m depth of soil. Nevertheless,the pool of nutrients in harvest residues does represent asignificant part of the biologically active component ofsite nutrients. Consequently, any management practiceadversely affecting this pool is likely to impact on siteproductivity in the longer term. Current plantationmanagement in Kerala involves several rotations ofcoppice regeneration following successive harvests.When plantations are re-established with seedlings, sitesare prepared by burning accumulated harvest debris andunderstorey vegetation and litter. This practice willresult in immediate volatile loss of some nutrients andincrease the run-off and erosion with associated nutrientloss during the monsoon season. We estimate that at ourexperimental sites, between 30 and 130 kg N ha-1 wouldhave been volatilised from harvest residues during sitepreparation burning operations. Burning of litter andunderstorey vegetation (Table 3) would contributefurther to this loss, while additional N in near-surface
soils could also be also be volatilised, especially if highintensity fires were used in preparing the sites. Theselosses represent a direct depletion of site nutrient capital,which can only be replaced by fertiliser additions orthrough the biological N fixation systems.
Although burning does assist in clearing the site,our data show that harvest residues decay rapidly (Fig.3) and are unlikely to be a serious impediment to sitepreparation and planting operations, especially on thelow elevation E. tereticornis sites. Furthermore, ingeneral the amount of slash left after log removal issmall because of the low productivity. For example,within 7 months of harvest, 70-80% of leaf residues haddecomposed and after 1 year little leaf materialremained. Additionally, by the end of the first yearfollowing harvest, more than half of most of the woodresidues had disappeared from the E. tereticornis sites.These decomposition rates are much more rapid than hasbeen reported generally for eucalypt residues in thetropics (O’Connell and Sankaran 1997) and for decay ofeucalypt litter in the same geographic region (Sankaran
Figure 6. Growth responses after one year to alternative harvest residue management treatments at the fourexperimental sites
(c) E. grandis Suryanelli site
0
500
1000
BL0 BL1 BL3 L BS B
Ste
mvo
lum
e(c
m3
tree
-1)
(a) E. tereticornis Kyampoovam site
0
1000
2000
BL0 BL1 BL3 L BS B
Ste
mvo
lum
e(c
m3
tree
-1)
(b) E. tereticornis Punnala site
0
1000
2000
BL0 BL1 BL3 L BS B
Ste
mvo
lum
e(c
m3
tree
-1)
(d) E. grandis Vattavada site
0
1000
2000
3000
4000
5000
6000
BL0 BL1 BL3 L BS B
Ste
mvo
lum
e(c
m3
tree
-1)
StManagment-gs Final.pdf 1/31/01 8:29 PM Page 58 (Black plate)

Sankaran et al. 59
1993). This difference probably reflects differencesin chemical composition between harvest residues,which originate from green tissues, and normal leaflitterfall, which is largely composed of senescenttissues. Similar differences have been reported intemperate eucalypt forests (O’Connell 1997). Inaddition to the fast turnover of harvest residues,release of nutrients from these materials is also rapid(Figs. 4 and 5). Thus where residues are retained onthese lowland sites, much of the nutrient capitalstored in them is quickly returned to the soil for re-use by the newly planted tree crop. Decomposition ofresidues was much slower at the E. grandis sites,reflecting the generally lower temperatures and lessfavourable conditions for decomposers in thesehigher elevation regions. Nevertheless, retention ofharvest residues on these sites probably acts as animportant buffer against nutrient loss throughleaching during the wet season. This may beparticularly important for retention of site nitrogenstores, which appear to be readily immobilised in thedecomposing harvest residues (Fig. 5).
There were few growth responses during thefirst year after planting attributable to the differentoptions for managing harvest residues. Lower growthrates on the burn (B) plots compared with the otherfive treatments (Fig. 6) is due to the absence of starterfertiliser on the B areas. In contrast to the harvestresidue management experiments, there were largegrowth responses in adjacent trials where effects ofadded nutrients (N and P) were being investigated.Figure 7 compares tree growth on the harvest residuemanagement experiment for the B and BL3 treatmentswith the best responses obtained in the N and P ratetrials at two sites. Twelve months after planting,application of optimum rates of N and P resulted in upto a four-fold increase in growth over residuetreatments with added starter fertiliser, and a 13-foldincrease where no starter fertiliser was used.Consequently, at these sites there are good prospectsfor significant increases in productivity withappropriate nutrient management strategies. Wherethese regimes are combined with conservative sitemanagement practices, such as retention of harvestresidues rather than burning, the nutrient capital ofthe site will be better protected. This will enhance theprospect of increased and sustainable plantationproduction in the long-term.
AcknowledgmentsThe Australian Centre for International AgriculturalResearch (ACIAR) is providing funding for thisresearch. Assistance, including provision of land and in-kind support for establishment of the field trials, hasbeen provided by Kerala Forest Department, KeralaForest Development Corporation and HindustanNewsprint Limited and is gratefully acknowledged. Weare indebted to the former Director of KFRI, Dr K.S.S.Nair, for his support during the planning and initiation ofthis project. We also thank the many KFRI staff who areproviding ongoing technical support for the project.CIFOR provided financial support for those attendingthe workshop in India.
Figure 7. Growth response comparing the B and BL3
treatments from the harvest residue managementexperiment with treatments from the N and P rateexperiments showing optimum growth. Data forexperiments at Punnala (E. tereticornis) and Surianelli(E. grandis)
(a) E. tereticornis - Punnala
0
1000
2000
3000
4000
B BL3 High N-P
Ste
mvo
lum
e(c
m3
tree
-1)
(b) E. grandis - Surianelli
0
1000
2000
3000
4000
B BL3 High N-P
Ste
mvo
lum
e(c
m3
tree
-1)
StManagment-gs Final.pdf 1/31/01 8:29 PM Page 59 (Black plate)

Effects of Site Management on Eucalyptus Plantations in the Monsoonal Tropics - Kerala, India 6060
ReferencesBargali, S.S. and Singh S.P. 1991. Aspects of
productivity and nutrient cycling in an 8-year-oldEucalyptus plantation in a moist plain area adjacentto central Himalaya, India. Canadian Journal ofForest Research 21: 1365-1372.
Davidson, J. 1995. Ecological aspects of eucalyptplantations. In: Proceedings of the Regional ExpertConsultation on Eucalyptus, Vol. 1, 35-72. FAORegional Office for Asia and the Pacific, Bangkok.
FAO 1988. FAO/UNESCO soil map of the world,revised legend. World Resources Report 60. FAO,Rome.
Nambiar, E.K.S. 1996. Sustained productivity of forestsis a continuing challenge to soil science. Soil ScienceSociety of America Journal 60: 1629-1642.
O’Connell, A.M. 1997. Decomposition of slashresidues in thinned regrowth eucalypt forest inWestern Australia. Journal of Applied Ecology 34:111-122.
O’Connell, A.M. and Sankaran, K.V. 1997. Organicmatter accretion, decomposition and mineralisation.In: Nambiar, E.K.S. and Brown, A.G. (eds.)
Management of soil, nutrients and water in tropicalplantation forests, 443-480. ACIAR MonographNo. 43. ACIAR, Canberra.
Olson, J.S. 1963. Energy storage and the balance ofproducers and decomposers in ecological systems.Ecology 44: 322-331.
Sankaran, K.V. 1993. Decomposition of leaf litter ofalbizia (Paraserianthes falcataria), eucalypt(Eucalyptus tereticornis) and teak (Tectona grandis)in Kerala, India. Forest Ecology and Management56: 225-242.
Sankaran, K.V. 1999. Eucalypt plantations inmonsoonal tropics - Kerala, India. In: Nambiar,E.K.S., Cossalter, C. and Tiarks, A. (eds.) Sitemanagement and productivity in tropical plantationforests: workshop proceedings 16-20 February 1998,Pietermaritzbug, South Africa, 45-51. CIFOR,Bogor.
Zech, W. and Drechsel, P. 1995. Degradation andamelioration of soils and tree nutrient status withoutand with mineral fertiliser. In: Schulte, A. andRuhiyat, D. (eds.) Soils of tropical forest ecosystems,Vol 5, 5-30. Mulawarman University Press,Samarinda, Indonesia.
StManagment-gs Final.pdf 1/31/01 8:29 PM Page 60 (Black plate)

IntroductionEucalypt plantations in southwestern Australia currentlycover about 150 000 ha. The planted area is expandingat more than 30 000 ha yr-1 with most existingplantations having been established within the last 10years. In this region, eucalypt plantations arepredominantly developed by industry with woodprocessing interests or by investor groups and individuallandholders that supply wood for these industries. Treesare also being planted increasingly by farmers formultipurpose values, including the amelioration ofenvironmental problems resulting from wind erosion,salinisation and waterlogging. However, the mainimpetus for plantation establishment has been thedevelopment of a hardwood plantation industry. Thedominant species is Eucalyptus globulus Labill. grown
on 10-year rotations to provide wood for the pulp andpaper industries.
Plantations are mostly established on cleared landthat has been utilised for agriculture. Much of this landhas a low level of soil fertility due to long periods ofweathering and the absence of soil rejuvenationprocesses. However, management practices employedby farmers, primarily annual applications of phosphate-based fertilisers and the introduction of leguminouspasture species, have markedly improved the fertility
Effects of Site Management in Eucalypt Plantations
in Southwestern Australia
A.M. OÕConnell1, T.S. Grove1, D. Mendham1 and S.J. Rance1
AbstractThe impact of alternative strategies for managing harvest residues in second rotation Eucalyptusglobulus plantations is being examined at two sites of contrasting soil fertility status in southwesternAustralia. Treatments being examined in a randomised block experiment are complete residueremoval, residue retention, increased residue and residue burning. Large changes in soil propertiesdue to burning residues (increases in pH, cation concentrations and labile P) were relatively short-lived with these properties returning to near pre-burn levels within 1 to 2 years after treatment. Highrates of residue application significantly increased cation concentrations in near surface soil (0-5cm). There were very few significant effects below this depth. Effects of residue manipulation onsoil organic C levels were limited even at rates of application up to 160 t ha-1. Variation in some soilproperties (labile C and exchangeable K) was related to time since harvest rather than residuetreatment effects. Mineral N dynamics were significantly affected by residue treatments with higherrates of mineralisation and greatest concentrations of potentially available N being associated withhigh residue treatments. Tree growth responses to treatments were small at the two sites. At the morefertile site there were no impacts of harvest residue management on growth 4 years after planting.At the less fertile site, highest levels of retained residues were associated with trends of increasedgrowth, but differences in growth rates between treatments were significant at only a limited numberof measurement periods.
1 CSIRO Forestry and Forest Products, Private Bag, PO Wembley,Australia 6014. Tel: +618 9333 6661, Fax: +618 9387 8991, E-mail:[email protected]
8
StManagment-gs Final.pdf 1/31/01 8:29 PM Page 61 (Black plate)

Effects of Site Management in Eucalypt Plantations in Southwestern Australia62
status of these soils. Consequently, the growth rate ofplantations established on farms is usually three to fourtimes greater than is obtained where trees are grown onsites recently cleared of natural vegetation. The extent towhich soil fertility and plantation productivity onfarmland will be maintained in the long-term isuncertain and is the focus of our research programme.
Our overall research objectives are to (1) quantifylonger-term changes in the nutrient-supplying capacityof soils in eucalypt plantations growing on agriculturalland, (2) determine nutritional requirements for growthof trees in second-rotation plantations, and (3) developmethodologies to manage soil fertility to maintain highproductivity. An outline of the experimental approach isgiven in O’Connell and Grove (1999). In this paper wereport on aspects of the inter-rotation site managementexperiments which relate to the CIFOR NetworkProject. Our focus is on management of harvest residuesand its impact on soil organic matter, soil nutrient status,nutrient flux rates and tree growth in the four yearsfollowing harvest of the first rotation of E. globulusplantations.
Location and Site DescriptionThe southwest region of Australia has a Mediterraneantype climate (Table 1) with cool wet winters and warmdry summers. Mean monthly temperatures increase fromsouth to north and summer evaporation increases two-fold from the southern coast to the northern extent ofjarrah forest near Perth. Rainfall is highest on the southcoast and to the west along the Darling escarpment justsouth of Perth and declines from southwest to northeastfrom the southern coast and from west to east along thewestern coast.
The majority of eucalypt plantations areestablished within the southwest region where annual
rainfall exceeds 700 mm. Here, the pattern of rainfall ismarkedly seasonal, with the majority of precipitation inthe cool winter period (June, July and August). As aconsequence, growth and survival of plantations duringthe dry season is dependent on access to water stored indeep soil profiles. Where soil water storage isinsufficient to meet tree demands during the summerperiod, plantations are subject to water stress. On siteswith shallow soils having insufficient moisture storagecapacity, tree death can occur as plantations developmaximum leaf area from age four years onwards.
Soils of this southwestern region are derived fromthe erosion of an ancient plateau developed on theArchaean crystalline rocks, comprised primarily ofgranites and granitic gneisses. Much of this plateau hasbeen subject to extended periods of weathering and iscovered by deep profiles mantled by laterite (McArthur1991). Various elements of the lateritic profile form thesource materials for many of the soils of the region. Asa consequence, the soils are often inherently low innutrients and organic matter, and generally contain highlevels of Fe and Al oxides that are strongly reactive withapplied P (Turton et al. 1962).
Stand DescriptionOur research was conducted at two second-rotation E.globulus plantation sites in southwestern Australia(O’Connell and Grove 1999). They were established onfarmland. The two sites, near Busselton (latitude 33045'S,longitude 115007'E) and Manjimup (latitude 34020'S,longitude 116000'E), fall within the main climatic rangewhere the majority of eucalypt plantations are established(Table 1). The site near Manjimup is on relatively fertilekarri forest soil (red earth - Ferralsol). The site nearBusselton is on a low-fertility soil (grey sand over laterite- Podzol). General chemical properties of surface soils ateach site are listed in Table 2.
Table 1. Climatic data at Manjimup and Busselton
Location Annual (mm) Mean daily max. Mean daily min. Cloudy Clear Mean rainfall temperature (0C) temperature (0C) days days annual RH
(9 am) (%)Jan. July Jan. July (yr-1)
Manjimup 1023 27.1 14.2 13.0 6.4 145 64 56
Busselton 825 28.5 16.3 13.8 7.5 101 97 72
StManagment-gs Final.pdf 1/31/01 8:29 PM Page 62 (Black plate)

A.M. OÕConnell, T.S. Grove, D. Mendham and S.J. Rance 63
The first rotation stand of E. globulus at theManjimup site was established in 1986 at a spacing of 4x 2 m. At the time of harvest in August 1994,aboveground biomass of the stand totalled 275 t ha-1,with 170 and 24 t ha-1 removed in harvested bole woodand associated stem bark, respectively. At Busselton,the first rotation of E. globulus was established in 1987and harvested in May 1995. Productivity at this sitewas lower than at the Manjimup site with totalaboveground biomass accumulation of the stand beingapproximately 98 t ha-1 at the time of harvest. About 59t ha-1 was removed from the site in harvested bole woodand 8 t ha-1 in bark.
Both sites were replanted with seedlings duringwinter in July-August 1995 at a density of 1250 stemsha-1. There was no prior cultivation of the soil. A singlespot application of 130 g of a compound fertilisercontaining 23 g N, 10 g P, 22 g S was applied adjacentto each seedling. Weeds were controlled by handcultivation and by glyphosate herbicide in the first twoyears after planting.
Experimental Design and MethodsAt each site, four experiments were established toinvestigate impact of organic matter amendment(harvest residue management), inter-row cover crops(five agricultural legumes), and the responses to addedN and P fertilisers at different rates. Only the harvest
residue management studies are discussed in detail inthis paper.
A randomised block design was used, with sixtreatments randomised within each of four replicateblocks. Treatment plots were 18 m x 18 m, with 40 treesper plot. Harvest residue management treatments were:
BL0 No slash - all litter and, slash material removed.BL2 Single slash - uniformly redistributed. BL3 Double slash - addition of slash from the ‘no
slash’ (BL0) treatment.B Burn - (BL2 with retained slash burnt).BL2 + fertiliser - broadcast (50 kg P ha-1 as triple
superphosphate and 45 kg K ha-1 as K2SO4).BL2 + fertiliser + legume - broadcast P and K fertiliser
with cover crop of vetch (Vicia sativa).
Results from the first four treatments arediscussed here.
Soils were sampled annually in December eachyear to assess the impact of treatments on soil chemicalproperties over time, with the exception that atBusselton the first sampling was made in June 1995.Additionally, samples were collected on the burn plots(B) at each site immediately after the residues had beenburnt to assess the direct effects of fire. At eachsampling time, nine steel tubes, 44 mm diameter, weredriven into the soil to a depth of 20 cm at randomisedlocations within each plot. Soils were separated into
Table 2. Soil chemical properties at the two experimental sites at time of application of harvest residue treatments
Site/ pH Organic C Labile C Total N Total P Bray P Cations (cmol kg-1)
depth(cm) (g kg-1) (mg kg-1) Ca Mg K
Red earth
0-5 5.81 55.3 17.1 2.5 0.45 104 2.50 0.54 0.42
5-10 5.60 43.5 12.1 1.9 0.35 90 1.32 0.24 0.23
10-20 6.02 30.5 8.3 1.1 0.20 35 2.05 0.24 0.15
Grey sand
0-5 5.13 45.6 14.3 1.8 0.10 3.5 1.99 0.59 0.18
5-10 4.77 33.8 12.1 1.2 0.06 1.8 1.18 0.33 0.12
10-20 4.76 22.4 7.2 0.6 0.04 1.8 0.77 0.17 0.06
StManagment-gs Final.pdf 1/31/01 8:29 PM Page 63 (Black plate)

Effects of Site Management in Eucalypt Plantations in Southwestern Australia64
three depths (0-5, 5-10, 10-20 cm) and the nine coreswithin each plot were bulked, air dried and sievedthrough 2 mm. Soils were analysed for pH (1:5 waterextracts), organic C (Walkley Black method), cations(NH4Cl extracts) and Bray-extractable P according toprocedures outlined by Hingston et al. (1979). Labileorganic C was determined by partial oxidation with 333mM permanganate as outlined by Blair et al. (1995).
Labile N status and rate of N mineralisation wereassessed by the in situ coring technique (Raison et al.1987). Field incubations were conducted every 4 weeks.At the commencement of each sampling period, 18 steeltubes (44 mm diameter) were driven into the soil to 20 cmat each plot. Nine of the soil cores were withdrawnimmediately and returned to the laboratory for analysisand the remainder were covered with plastic caps andallowed to incubate for 4 weeks under field conditionsand then returned to the laboratory for analysis.Immediately following sampling, soil cores were placedin cooled insulated containers, transported to thelaboratory and stored at 40C before preparation andanalysis. Soil cores were divided into two depths (0-10and 10-20 cm), sieved through a 5 mm screen to removelarge roots and gravel and the nine cores of each typewithin each plot were bulked for analysis of ammoniumand nitrate. Net N mineralisation rates were calculatedeach month from the difference in mineral N content ofincubated and unincubated soil core samples. Potentiallymineralisable N was determined on all unincubated soil
samples by the anaerobic incubation method of Keeneyand Bremner (1966).
Tree growth was assessed periodically bymeasuring tree diameter and height within a centralmeasuring plot containing 18 trees. Biomass wasdetermined by relating tree volume to weight usingallometric relationships derived from harvested sampletrees. These sample trees were also used to determineallocation of biomass between various tree components.LAI was determined from allometric functions relatingleaf area to stem basal area at the crown base.
Results
Amounts and Nutrient Content of HarvestResiduesMarkedly lower concentrations of total and labile P aswell as exchangeable K in the coarse textured grey sandcompared to the soil from the red earth site were the mainfeatures differentiating soil nutrient status of the two sites(Table 2). This in turn was one of the factors that affectedthe relative tree growth at each site and consequently theamounts of harvest residues (Table 3). At the red earthsite, which represents the upper range of plantationproduction in Western Australia, more than 50 t ha-1 ofresidues with end diameter < 3 cm were deposited on theforest floor during harvesting. At the less fertile grey
Table 3. Biomass dry weight and nutrients in harvest residues at the two experimental sites
Biomass Nutrients (kg ha-1)
(t ha-1) N P Ca Mg K
Red earth Leaves 21.5 259 15 315 30 96Wood, bark and miscellaneous(a) 29.6 88 8 282 29 86
Total 51.1 347 23 597 59 182
Grey sandLeaves 13.0 138 9 188 18 56Wood, bark and miscellaneous(a) 18.3 81 7 200 18 55
Total 31.3 219 16 388 36 111
(a) Wood residues < 3 cm diameter. At the red earth a further 30 t ha-1 of larger wood residues (> 3 cm diameter) was present on the soil surfacefollowing harvesting. This is a greater amount of wood residues than left under current harvest practice and it has not been included incalculating the nutrient stores in Table 3.
StManagment-gs Final.pdf 1/31/01 8:29 PM Page 64 (Black plate)

A.M. OÕConnell, T.S. Grove, D. Mendham and S.J. Rance 6565
sand site 31 t ha-1 of residues remained followingharvesting. There was a corresponding difference in thenutrient loads added in harvest residues (Table 3).
Impact of Harvest Residue Management onSoil Stores of NutrientsChanges in soil chemical properties have beenmonitored annually since December 1994 (red earthsite) and June 1995 (grey sand site), with the most recentresults available for December 1998 at both sites.Changes in soil nutrient status appear to result fromthree processes, namely (i) immediate effects of fire inthe burn treatment, (ii) longer term impacts due toaddition of harvest residues to the soil surface, and (iii)longer term changes in soil which appear to be largelyindependent of applied treatments.
Burning harvest residues significantly increasedsoil pH, cation concentrations and labile P (grey sandsite only) in surface (0-5 cm) soil due to the addition ofash. There was little impact of fire on lower soilhorizons. Many of the observed changes were large withincreases of up to more than 1 unit in pH, more than100% in some exchangeable cation concentrations(Figs. 1, 2), and greater proportional change in labile P.However, all these effects were relatively short lived,with soil properties returning to near pre-burn levelswithin one to two years after treatment.
The main long-term impacts on soil nutrient statusof harvest residue management relate largely to effects onsoil cation concentrations and are primarily associatedwith the highest levels of added residues (BL3). At each ofthe sites this treatment resulted in significantly increasedsurface soil concentrations of exchangeable Ca and Mg(Fig. 1) and at the red earth site significantly increasedexchangeable K (Fig. 2). Again, these effects were largelyconfined to the upper 5 cm of the soil profile. Despite thelarge amounts of residues added, there appears to havebeen limited impact on soil C status. At the grey sand sitethere was no significant effect of harvest residuemanagement on soil organic C concentrations for any ofthe treatments at any soil depth. In surface soil (0-5 cm)at the red earth site there were significant treatmenteffects (P<0.05) on soil organic C levels during the lasttwo of the five sampling periods (3.5 and 4.5 years afterstand harvest). At these times the BL3 treatment, whichhad received about 160 t ha-1 added residues, containedorganic C levels in 0-5 cm soil which were 20-25%greater than in the other three treatments. There were nosignificant treatment effects at other depths.
Changes in soil chemical status appear to berelated more to time since stand harvest than to thetreatments applied. This was evident for severalelements. In particular, soil exchangeable Kconcentrations declined in all treatments duringsuccessive sampling periods (Fig. 2) at both sites. Thedecrease in K concentrations was greatest in surface soil(2.1 to 2.8 fold), intermediate in 5-10 cm soil (1.8 to 2.1fold) and least in 10-20 cm soil (1.2 to 1.6 fold) over theperiod of the experiment. Likewise, labile Cconcentrations were not affected by harvest residuetreatments but they did vary significantly with timesince stand harvest at both sites (Fig. 3). In the first oneto two years after harvest, labile C concentrationsdecreased and in subsequent years gradually increasedagain to approach levels similar to those in immediatepost-harvest soil samples.
(a) Ca
0
1
2
3
4
5
6
7
8
Dec 1994 Dec 1995 Dec 1996 Dec 1997 Dec 1998
Ca
(cm
ol/k
g)
Burn BL0BL2 BL3
``
(b) Mg
0.0
0.2
0.4
0.6
0.8
1.0
1.2
Dec 1994 Dec 1995 Dec 1996 Dec 1997 Dec 1998
Mg
(cm
ol/k
g)
Figure 1. Variation in (a) exchangeable Ca and (b)exchangeable Mg concentration in surface (0-5 cm) soilat the red earth site in relation to harvest residuemanagement treatments and time since harvest.Standard error of the treatment means shown at each sampling time
StManagment-gs Final.pdf 1/31/01 8:29 PM Page 65 (Black plate)

Effects of Site Management in Eucalypt Plantations in Southwestern Australia66
Impact of Slash Treatments on MineralNitrogen Flux RatesHarvest residue management had a significant impact onthe dynamics of soil mineral N. High concentrations ofmineral N were present in soil immediately followingharvest (Fig. 4). These pools declined in subsequentyears, probably largely through leaching of nitratebelow the root zone. At the more highly textured redearth site, mineral N pools were significantly higherwhere residues had been removed (BL0 and Btreatments). At the sandy site the opposite was the case- highest mineral N concentrations in soil after harvestwere associated with the highest level of residueretention (BL3 treatment).
Both the measured rates (Fig. 5) and potential(Fig. 6) for N mineralisation in surface soil (0-10 cm)were significantly affected by harvest residuetreatments. At both sites cumulative annual rates of Nmineralisation were significantly higher on highresidue (BL3) treatments compared to low residuetreatments in the third and fourth years ofmeasurement. At the red earth site treatment BL2
followed similar trends. For these treatments thecumulative annual rates of N mineralisation alsoappear to be increasing over time. Annual rates ofmineralisation per unit weight of soil were generallyhigher in the more highly textured and fertile red earthsoil than in the grey sand.
Figure 2. Variation in exchangeable K at (a) the red earth and (b) the grey sand site in surface soil (0-5 cm) inrelation to harvest residue treatments and time since harvest. Standard error of the treatment means shown at eachsampling time
(a) Red earth
0.0
0.5
1.0
Dec 1994 Dec 1995 Dec 1996 Dec 1997 Dec 1998
K(c
mo
l/kg
)
Burn BL0
BL2 BL3
(b) Grey sand
0.00
0.15
0.30
Jun 1995 Jun 1996 Jun 1997 Jun 1998
K(c
mo
l/kg
)
Figure 3. Variation in concentrations of labile soil C with time since stand harvest (July 1994 at the red earth site andApril 1995 at the grey sand site)
(a) Red earth
0
5
10
15
20
Post-har. Dec-95 Dec-96 Dec-97 Dec-98
Lab
ile
C(m
g/k
g)
(b) Grey sand
0
5
10
15
20
Post-har Dec-95 Dec-96 Dec-97 Dec-98
Lab
ile
C(m
g/k
g)
0-5 cm 5-10 cm 10-20 cm
StManagment-gs Final.pdf 1/31/01 8:29 PM Page 66 (Black plate)

A.M. OÕConnell, T.S. Grove, D. Mendham and S.J. Rance 67
Figure 4. Impact of harvest residue treatments on annual average concentrations of mineral N in surface (0-10 cm)soil at (a) red earth and (b) grey sand sites. Standard error of the treatment means shown for each year
Figure 5. Impact of harvest residue treatments on cumulative annual N mineralisation rates in surface (0-10 cm) soilat (a) red earth and (b) grey sand sites. Standard error of the treatment means shown for each year
(a) Red earth
0
20
40
0.5 1.5 2.5 3.5 4.5Years
Min
eral
N(µ
g/g
)
Burn BL0
BL2 BL3
(b) Grey sand
0
20
40
0.5 1.5 2.5 3.5 4.5Years
Min
eral
N(µ
g/g
)
(a) Red earth
50
75
100
0.5 1.5 2.5 3.5 4.5Years
Min
era
lise
dN
(µg
/g/y
r)
Burn BL0
BL2 BL3
(b) Grey sand
25
50
75
0.5 1.5 2.5 3.5 4.5Years
Min
era
lised
N(µ
g/g
/yr)
Figure 6. Impact of harvest residue treatments on mean annual potential rates of N mineralisation in surface (0-10 cm)soil at (a) red earth and (b) grey sand sites. Potential for N mineralisation is estimated as the ammonium produced afteranaerobic incubation at 400C for 7 days. Standard error of the treatment means shown for each year
(a) Red earth
10
30
50
0.5 1.5 2.5 3.5 4.5Years
Po
ten
tial
N(µ
g/g
)
Burn BL0BL2 BL3
(b) Grey sand
10
20
30
0.5 1.5 2.5 3.5 4.5Years
Po
ten
tial
N(µ
g/g
)
StManagment-gs Final.pdf 1/31/01 8:29 PM Page 67 (Black plate)

Effects of Site Management in Eucalypt Plantations in Southwestern Australia68
Figure 8. Growth on BL2 and BL3 treatments relative to BL0 over the 4-year measurement period since planting at (a)red earth and (b) grey sand sites
(a) Red earth
0
1
2
Jul-95 Jul-96 Jul-97 Jul-98 Jul-99
Ste
mv
olu
me
rela
tiv
eto
BL
0 BL2 BL3
(b) Grey sand
0.0
0.5
1.0
1.5
Jul-95 Jul-96 Jul-97 Jul-98 Jul-99
Ste
mv
olu
me
rela
tiv
eto
BL
0
Annual average potential rates for Nmineralisation in soil showed similar treatment effects tothe measured rates of mineralisation. High residuetreatments resulted in significantly higherconcentrations of potentially mineralisable N at bothsites during each measurement period. As withmineralisation rates, potential for N mineralisation wassystematically higher in the red earth soil compared tothe grey sand.
Impact of Harvest Residue Management onTree GrowthThere were little or no responses in tree growth toharvest residue treatments at the two sites (Fig. 7). At thered earth site, growth rates during the first year afterplanting were significantly greater (P<0.05) on thehighest residue plots (BL3) compared with other
treatments. However in subsequent years growth ontreatments BL0 and BL2 increased relative to BL3 (Fig.8a) and the significance of growth differences betweenresidue treatments declined. In years 2, 3 and 4 afterplanting there were no significant differences in growthamongst the applied treatments.
At the grey sand site there was a significantdifference in tree growth between residue treatmentsduring the first year after planting with highest growthwhere residues had been removed. This trend wasreversed by the end of the first year (Fig. 8b) withgreater relative growth rates for treatments with highestamounts of retained harvest residues. However,although growth on the high residue treatment BL3 wasgreater than on other treatments during the last threeyears of measurement, these differences were generallynot statistically significant.
Figure 7. Impact of harvest residue treatments on mean tree conical volume at the (a) red earth and (b) grey sand sites
(a) Red earth
0
40
80
120
Jul-95 Jul-96 Jul-97 Jul-98 Jul-99
Ste
mvo
lum
e(c
uc
m/t
ree
x1
0-3)
BL0 BL2 BL3 (b) Grey sand
0
20
40
Jul-95 Jul-96 Jul-97 Jul-98 Jul-99
Ste
mv
olu
me
(cu
cm
/tre
ex
10-3
)
BL0 BL2 BL3
StManagment-gs Final.pdf 1/31/01 8:29 PM Page 68 (Black plate)

A.M. OÕConnell, T.S. Grove, D. Mendham and S.J. Rance 69
Leaf area index (LAI) differed markedly betweensites, reflecting differences in soil nutrient status, wateravailability and tree growth rates. At each site leaf areaincreased rapidly in the second year of growth, reachinga plateau between 3.5 to 3.7 at the red earth site and 1.2to 1.4 at the grey sand site. Over most of the growthperiod there was no significant systematic difference inLAI between the applied harvest residue treatments.
DiscussionThe amounts of added residues and their nutrientcontents were significant in relation to the stores insurface soils at both sites. For the BL2 treatment, total Cadditions (assuming approximately 50% C content inresidues) amounted to more than two thirds and onethird of the soil-stored C in surface soil (0-10 cm) at thered earth and grey sand sites, respectively. When largerwoody residues (> 3 cm) are considered, the amount ofC in harvest residue additions to the red earth siteexceeded that present in surface soil. Much of thismaterial had decomposed by December 1998 (4.5 and3.5 years after harvest of the red earth and grey sandsites, respectively). Surprisingly, the addition of theseresidues has resulted in very little change in soil-storedC over the period of the experiment. Treatment BL3,which received double the residue additions applied toBL2, also showed limited change in the pool of C insurface soil. At the red earth site, C stored in 0-10 cmsoil increased during the 4-year measurement period byonly about 2% from values found at the initial sampling6 months after harvest. There was a small decline in Cstorage in 0-10 cm soil at the grey sand site during thesame period. Several studies in the tropics havesuggested that decay of eucalypt residues results insmaller contributions to soil organic matter than doesturnover of residues from other species (Bernhard-Reversat 1987, 1993; Wang et al. 1991; Bargali et al.1993). The extent to which these conclusions apply totemperate forests is uncertain. Monitoring of soils in thecurrent study will continue annually throughout therotation and should provide insights into dynamics ofsoil C.
Burning of the harvest residues impacts markedlyon soil pH and the storage and availability of many ofthe nutrients. Increases in plant availability of thecations and P after fire is one of the most commonresponses found (Grove et al. 1986). In our study, theseeffects tended to be relatively short lived, with most soilproperties returning to their pre-fire levels within the
first or second year after fire. Possibly of moreimportance is the long-term impact of residue burningon site N status (Raison et al. 1993), especially if fire isused repeatedly after harvesting short rotation plantationforests. We estimate that at the red earth site, Nvolatilisation losses from burning harvest residues andassociated surface soil organic matter, together withremoval of N in harvested logs, probably exceeded 500kg N ha-1. Replacement of these amounts of N would notnormally be possible within the time scale of one 10-year rotation.
Retention of harvest residues may also play animportant role in moderating the fluxes of mineral N inthe early stage of tree growth following harvest and re-establishment of the new plantation. In a laboratorystudy, Aggangan et al. (1999) found eucalypt litter to bean effective agent for immobilisation of mineral N andhypothesised that eucalypt residues may act as animportant buffer against N loss through leaching orother processes during periods of disturbance. At oursites there were large accumulations of mineral N in soilfollowing harvest, probably because of the maintenanceof conditions conducive to N mineralisation and thelimited uptake by a newly developing root system. Atthe red earth site much of this labile N was present asnitrate and would have been subject to leaching losswith the onset of winter rains. Accumulations of nitratewere lower where residues had been retained, probablyas a result of N immobilisation as suggested byAggangan et al. (1999), with the concomitant reducedprospect of N loss through leaching. In the third andfourth years after seedling establishment Nmineralisation on BL2 and BL3 treatments increasedabove BL0 plots but at this time most of the mineralisedN would have been taken up by the well-established rootsystems. At the less fertile grey sand site, Nmineralisation tended to be higher where residues hadbeen retained at all stages of stand development. Thestanding pool of mineral N was initially highest at thegreatest level of residue retention (BL3), but in this caselabile N was predominantly in the ammonium form andwould have been less likely to be leached below therooting zone.
Two soil changes which are unrelated to residuetreatment, but which are of importance in relation to Cstorage and plantation nutrition are (1) the patterns oflabile C variation (Fig. 3) and (2) the decline in soil Kstatus at both sites following stand harvest (Fig. 2).Worldwide, there is currently great interest in
StManagment-gs Final.pdf 1/31/01 8:29 PM Page 69 (Black plate)

Effects of Site Management in Eucalypt Plantations in Southwestern Australia70
sequestration and storage of atmospheric CO2 byalternative land use systems. The data presented hereillustrate the difficulty in measuring changes in total soilC levels in response to land management, despite thelarge amounts of added residues and the robustexperimental designs. Alternative measures of soil Cstatus, such as the fraction of C oxidised by weakpermanganate solution, may provide a more sensitiveoption for tracking changes in soil C in response todifferent land management options.
The decline over time in exchangeable soil K atboth sites to about half the levels present in the first soilsampling following harvest is of interest. The extent towhich this represents a general pattern across a widerange of plantation sites is uncertain but warrants furtherexamination. If such a trend exists more generally thengreater attention to managing K nutrition in E. globulusplantations in second and subsequent rotations may berequired in the future.
At the red earth site there was no impact ofresidue management on tree growth 4 years afterplanting. This site is at the upper end of soil fertility ofthe land utilised for plantations in southwesternAustralia. Growth rates on BL0 and BL3 treatmentswere similar to those where high rates of N and P hadbeen used in nutrient application rate experiments atthis site (Fig. 9a) indicating that nutrient limitations
were not restricting growth on the harvest residuemanagement experiments. Consequently, in the shortterm, harvest residue management is unlikely to impacton plantation growth on such sites. However, in thelonger term, over a number of rotations, anymanagement practice which affects nutrient status of thesite, such as N loss associated with burning, mayadversely impact on site productivity. At the grey sandsite, which has a low natural fertility, there was a trendtowards higher growth associated with greatestapplication rates of harvest residues. However duringthe majority of measurement periods these differenceswere not statistically significant. At this site, there werealso large responses to added nutrients (Fig. 9b). Greaterretention of harvest residues is associated withsignificantly increased rates of soil N mineralisation andthis may partly explain the relative patterns of treegrowth found at the grey sand site. Growth trends willbe monitored throughout the rotation to assess whetherslash residue management impacts significantly onproductivity of the second rotation harvest. Our currentresults indicate that demonstrating statisticallysignificant growth differences between the alternativeoptions for managing slash materials may be difficult insome circumstances. Nevertheless, conservative harvestresidue management will assist in maintenance of sitenutrient capital and this, coupled with appropriatefertiliser regimes, will favour sustained plantationproductivity in the long-term.
Figure 9. Comparison of growth of 4-year old trees on harvest residue management treatments andtreatments with high rates of applied N and P fertilisers over BL2 treatment at (a) red earth and (b) greysand sites
(a) Red earth
0
20
40
60
80
100
120
BL0 BL3 High N-P
Ste
mv
ol(
cu
cm
/tre
ex
10-3
)
(b) Grey sand
0
20
40
60
80
BL0 BL3 High N-P
Ste
mvo
l(cu
cm/t
ree
x1
0-3)
StManagment-gs Final.pdf 1/31/01 8:29 PM Page 70 (Black plate)

A.M. OÕConnell, T.S. Grove, D. Mendham and S.J. Rance 7171
AcknowledgmentsFunding for this research was initially providedthrough Australian Government Industry StatementFunds to the CSIRO Centre for MediterraneanAgricultural Research and subsequently by theAustralian Centre for International AgriculturalResearch, the Rural Industries Research andDevelopment Corporation, Bunnings Treefarms andthe Western Australian Department of ResourcesDevelopment. Field assistance, in-kind support andland provided by Bunnings Treefarms Pty Ltd, MrMorris Cox and Mr Cliff Winfield are gratefullyacknowledged. Many CSIRO colleagues, particularlyG. Wan, P. Damon, Tuyen Pham, S. Snelling and A.Stilwell provided technical support. CIFOR providedfinancial support for attending this workshop.
ReferencesAggangan, R.T., O’Connell, A.M., McGrath, J.F. and
Dell, B. 1999. The effect of Eucalyptus globulusleaf litter on C and N mineralisation in soils frompasture and native forest. Soil Biology andBiochemistry 31: 1481-1487.
Bargali, S.S., Singh, S.P. and Singh, R.P. 1993.Patterns of weight loss and nutrient release fromdecomposing leaf litter in an age series of eucalyptplantations. Soil Biology and Biochemistry 25:1731-1738.
Bernhard-Reversat, F. 1987. Litter incorporation tosoil organic matter in natural and planted treestands in Senegal. Pedobiologia 30: 401-417.
Bernhard-Reversat, F. 1993. Dynamics of litter andorganic matter at the soil-litter interface in fast-growing tree plantations on sandy ferrallitic soil(Congo). Acta Ecologica 14: 179-195.
Blair, G.J., Lefroy, R.D.B. and Lisle, L. 1995. Soilcarbon fractions based on their degree of oxidation,and the development of a carbon managementindex for agricultural systems. Australian Journalof Agricultural Research 46: 1459-1466.
Grove, T.S., O’Connell, A.M. and Dimmock, G.M.1986. Nutrient changes in surface soils after anintense fire in jarrah (Eucalyptus marginata Donnex Smith) forest. Australian Journal of Ecology 11:303-317.
Hingston, F.J., Turton, A.G. and Dimmock, G.M.1979. Nutrient distribution in karri (Eucalyptusdiversicolor F. Muell.) ecosystems in southwestWestern Australia. Forest Ecology andManagement 2: 133-158.
Keeney, D.R. and Bremner, J.M. 1966. A chemicalindex for soil nitrogen availability. Nature 211:892-893.
McArthur, W.M. 1991. Reference soils of south-western Australia. Dept. of Agriculture, WesternAustralia. 265p.
O’Connell, A.M. and Grove, T.S. 1999. Eucalyptplantations in south-western Australia. In:Nambiar, E.K.S., Cossalter, C. and Tiarks, A. (eds.)Site management and productivity in tropicalplantation forests: workshop proceedings, 16-20February 1998, Pietermaritzburg, South Africa, 53-59. CIFOR, Bogor.
Raison, R.J., Connell, M.J. and Khanna, P.K. 1987.Methodology for studying fluxes of soil mineralnitrogen in situ. Soil Biology and Biochemistry19: 521-530.
Raison, R.J., O’Connell, A.M., Khanna, P.K. andKeith, H. 1993. Effect of repeated fires onnitrogen and phosphorus budgets and cyclingprocesses in forest ecosystems. In: Trabaud, L. andProdon, R. (eds.) Fire in Mediterranean ecosystems347-363. CEC, Brussels-Luxembourg.
Turton, A.G., Marsh, N.L., McKenzie, R.M. and Mulcahy,M.J. 1962. The chemistry and mineralogy of lateriticsoils in the south-west of Western Australia. SoilPublication No. 20. CSIRO Australia.
Wang, D., Bormann, F.H., Lugo, A.E. and Bowden,R.D. 1991. Comparison of nutrient use efficiencyand biomass production in five tropical tree taxa.Forest Ecology and Management 46: 1-21.
StManagment-gs Final.pdf 1/31/01 8:29 PM Page 71 (Black plate)

IntroductionIn Queensland, the exotic pine estate (129 497 ha) iscomprised of 37% slash pine (Pinus elliottii Engelm.),42% Honduras Caribbean pine (P. caribaea var.hondurensis Barr. et Golf.) and 18% the hybrid betweenthese two taxa. Since 1991 most plantings have beenwith hybrids. In 1997/98, 90% of the pine plantingswere with the hybrid and 97% of sites planted weresecond rotation areas. Typical rotation length is 30years. Maintenance and improvement of long-term siteproductivity of plantations is an important goal ofmanagement.
Tiarks et al. (1998) have described the needs,objectives and basis of long-term experimentation forthis international network, coordinated by the Center forInternational Forestry Research (CIFOR). Currently thisis the only trial using a Pinus species. Two trials witheucalypts in Western Australia (O’Connell et al. 1999)are relevant to the work being undertaken in Queenslandand will provide a useful contrast at a national level.Simpson et al. (1999) described the experimental site in
Effects of Site Management in Pine Plantations on the Coastal Lowlands
of Subtropical Queensland, Australia
J.A. Simpson1, Z.H. Xu1, T. Smith1, P. Keay1, D.O. Osborne1 and M. Podberscek1
AbstractBiomass and nutrient distribution in a 30-year-old slash pine (P. elliottii) plantation were estimated atclear fall to provide a basis for interpreting changes in the nutrient pools and tree responses to harvestresidue management practices applied at the establishment of the second rotation. Total biomass atclearfall of a typical slash pine stand is 316 t ha-1, of which 206 t ha-1 is removed in logs. Nitrogen and Premoved in logs account for 7.6% and 3.4% of total N and P in the ecosystem. Residues remaining afterlogging contain 12% of the total N and 5.2% of the total P. Proper management of these residues istherefore critical for sustaining site productivity. Following clear falling, a long-term experiment wasestablished to assess the impacts of harvesting residues and litter management regimes on soil fertilityand productivity of the second crop F1 hybrid between slash pine and Honduras Caribbean pine (P.caribaea var. hondurensis). The early results from this experiment show tree stem volume and aboveground biomass production have been increased by 31% and 29% respectively at age 39 months byretaining litter and logging residues, compared with the treatment in which logging residues and litterwere removed. Further improvements in tree growth have been achieved by doubling the quantity ofresidues retained and by controlling weed competition. Foliar nutrient concentrations indicated that Nmay play an important role in the maintenance of long term site productivity. Differences exist in thegrowth and foliar nutrient concentrations between the different hybrid families tested but all familiesresponded similarly to the residue treatments. The presence of the residues increased soil moisture levelsin the surface soil during a dry season. There was a marked reduction in the quantity of residue, especiallythe finer fraction, after 39 months. This study has contributed to an improved understanding of the soiland plant factors controlling productivity and provided a basis for more detailed studies on processesunderpinning plantation sustainability.
1 QDPI - Forestry, Queensland Forest Research Institute, M.S. 483,Fraser Road, Gympie 4570 Australia. Tel: +61 7 54820883, Fax: +617 54828755, E-mail: [email protected]
9
StManagment-gs Final.pdf 1/31/01 8:29 PM Page 73 (Black plate)

Effects of Site Management in Pine Plantations on the Coastal Lowlands of Subtropical Queensland, Australia74
southeast Queensland and reported the early results ofthe work which formed a part of the internationalnetwork. Biomass and nutrient distribution in a typicalrotation aged slash pine stand were also reported. Theearly responses of F1 hybrid pine established in thesecond rotation under a range of logging residuemanagement treatments showed that retention oflogging residues did not affect survival but improvedheight growth by 11-24% at age 17 months. This paperprovides further details on the experimental methodsand recent results.
Site and Stand DescriptionDetails of the experimental site were described bySimpson et al. (1999). The study was carried out atToolara in Queensland, Australia (26°00'S latitude,152°49'E longitude and 61 m altitude). The area has ahumid subtropical climate, with a mean annual rainfallof 1354 mm. The site originally carried dry sclerophyllnative forest which was cleared in 1959 for plantationestablishment. Soils at the site are derived fromMesozoic sandstones, and are acidic, deep and sandy,and classified as Grey Kandosols (Isbell 1996) or GleyicAcrisols (FAO 1974). Inherent soil fertility is low andlarge responses of the first rotation stand to the additionsof P fertiliser were obtained (Simpson and Grant 1991,Simpson 1995). The soils are well-drained in the upperhorizons but can become waterlogged for short periodsduring the wet season when the watertable rises within50 cm of the soil surface.
The first rotation slash pine stand was planted inJuly 1966 at 1234 stems ha-1. Fertiliser, 310 kg ha-1
Nauru rock phosphate (50 kg P ha-1) was broadcast in1966 and a further application of triple superphosphate(44 kg P ha-1) was applied aerially in 1980. The standwas thinned at age 15.6 years to a stocking of 679 stemsha-1, and clearfelled in November 1995, at age 29.4years. The site index [average height (m) of the 50 talleststems ha-1 at age 25 yr] of the area was 23.7, comparedwith a district average of 23.4 for the species. Atclearfelling, the stand had a predominant height of 25.2m, standing basal area of 39.6 m2 ha-1 and standingvolume to a 7 cm top end diameter of 325.4 m3 ha-1.
Allometric relationships were established fromsample trees harvested from a 29.4-year-old firstrotation slash pine stand and biomass nutrient pools
estimated. Litter, underground biomass and soil nutrientpools were also estimated.
Experimental Design and MethodsThe residue management trial consists of six treatmentslaid out as a randomised complete block experimentreplicated four times. Gross plots are 12 rows by 12 treesat 3m x 3m spacing (0.13 ha) with a 6 m border and netplots of 0.058 ha. The treatments were:
BL0 Removed both litter and loggingdebris + 50 kg P ha-1.
BL2 Retained both litter and loggingdebris + 50 kg P ha-1.
BL3 Applied double quantities of litterand logging debris + 50 kg P ha-1.
BL2 + Legumes BL2 + leguminous cover crops.BL2 - Weeds BL2 + complete weed control.BL2 - P BL2 without P fertiliser.
It was not possible with the equipment used toremove the small amount of litter/logging residue (< 10t ha-1) remaining in the BL0 without excessive sitedisturbance. The normal residue treatments (BL2)carried 60 t DM ha-1 (50.8 to 73.8 t ha-1) of whichapproximately 40% was in the forest floor litter. Doubleresidue (BL3) treatment (140 t ha-1) was not intended asan operational alternative, but to widen the treatmenteffects on tree growth and soil processes.
The slash management treatments were applied inFebruary 1996, 3 months after clearfalling, and surfacebiomass estimated for individual plots. Planting spotswere prepared using an excavator-mounted rotarycultivation head. Pre- and post-planting herbicides wereapplied in the first year along the planting rows. Theplots were planted in May 1996 at 3 x 3 m spacing(1111 stems ha-1) with container-grown F1 hybridseedlings raised from seed collected from six separateorchards. Each orchard was comprised of a singlefamily of slash pine which was mass-pollinatedfollowing emasculation. The same families wererepresented in two old and two young orchards and thesame pollen used in mass pollination but a degree ofself pollination occurred in the older orchard as a resultof difficulty in achieving complete emasculation. Seedsource identity was retained. Triple superphosphate wasapplied to supply 45g P seedling-1 in all treatments
StManagment-gs Final.pdf 1/31/01 8:29 PM Page 74 (Black plate)

J.A. Simpson, Z.H. Xu, T. Smith, P. Keay, D.O. Osborne and M. Podberscek 75
except for BL2-P. A mixture of legume seedscontaining lotononis (Lotononis bainesii), Wynscassia (Cassia rotundifolia) and Maku lotus (Lotuspedunculatus cv Maku) was sown on three occasions inthe BL2 + Legumes treatment. The legumes were slow todevelop and in 1999 covered < 50% of the area.
Tree height and diameter were measured annually.Foliar samples of the most recent fully formed fasciclesfrom the basal spring whorl developed in the seasonprior to sampling were collected in August 1998 andAugust 1999. Fifty fascicles from each of four treeswere combined to give a composite sample for eachsample. Biomass and nutrient pools in the above groundtree fractions were estimated immediately before non-merchantable thinning of the stand at age 39 months.following the same principles used for the biomasssampling of the first rotation stand. Sample trees,representing the diameter distribution of the stand, wereharvested. Weights and nutrient concentrations of thetree components were determined. Allometricrelationships were established and biomass and nutrientcontents estimated. Slash residues were sampled at age0 and 30 months by taking five one-metre squaresamples per plot, and at 39 months with two similarsamples per plot. After collection, the material wassorted into size classes, oven dried and sampled forchemical analysis. Nutrient analysis of plant and soilsamples was carried out by the Queensland ForestryResearch Institute’s chemistry laboratory (Collins2000a, b). Gravimetric moisture content of the surfacesoil (0-10 and 10-20 cm) at the time of residue sampling(30 and 39 months) was recorded.
Results
Impacts of Harvesting and Site Preparationon Biomass/Slash and NutrientsIn this study, 80% of the biomass on the site wasaboveground and contained between 72 and 78% ofmacronutrients in the biomass (Table 1). Between 52and 72% of the macronutrients in the biomass were inthe standing trees. The relatively low quantity of K inthe litter is of note. Depending on the nutrient,between 16 and 28% of the nutrients in the biomasswere in tree roots. Integrated logging removed 65% ofthe biomass, 39% of N and P, and 54% of K in thebiomass. Details of the biomass and nutrientdistribution in mature slash pine stands were reportedin Simpson et al. (1999).
The weight of the aboveground biomass(including litter but excluding logs) was lower (46 t ha-1
than that harvested as merchantable timber (wood +bark) (206 t ha-1) but both components contained similarquantities of nutrients, except for K (Table 1). Logharvest removed an estimated 7.6% of the N, 3.4% ofthe P and 171% of the exchangeable soil K, 16.3% of theexchangeable soil Ca and 5.6% of the exchangeable soilMg in the ecosystem. While the loss of N and P from thepool through logging is relatively small, this loss isdoubled if the logging residues plus litter were removedduring site preparation at establishment of a secondcrop. Any acceleration of nutrient loss from a site wouldadversely impact on the maintenance of long-term siteproductivity unless replaced by fertiliser.
Table 1. Biomass and nutrient distribution in a 29.4-year-old slash pine stand at Toolara, Queensland
Component Biomass N P K Ca Mg
(kg ha-1)
Foliage 2 03 16.0 1.3 4.1 7.8 4.0
Branches and stem tip 24 18 48.1 3.7 17.0 68.2 17.5
Stem wood, bark (>7cm diam.) 205 74 189.1 10.8 63.2 170.3 64.6
Litter 19 80 98.2 4.3 4.7 83.4 20.3
Stump 33 00 38.3 2.1 11.1 20.7 10.7
Roots 30 94 95.7 5.1 16.4 71.6 22.2
Total biomass 315 69 485.4 27.3 116.5 422.0 139.3
Soil (to 120 cm) 1991 288 37a 1045 a 1148 a
Total ecosystem 315 69 2476 315 - - -
a Exchangeable cations determined in neutral ammonium acetate extract (Collins 2000b).
StManagment-gs Final.pdf 1/31/01 8:29 PM Page 75 (Black plate)

Effects of Site Management in Pine Plantations on the Coastal Lowlands of Subtropical Queensland, Australia76
Survival and Growth At the end of the first season seedling survival was 99%in all treatments. Trees grew little during the winter andno treatment effects were apparent by spring of the firstyear. Treatment differences became apparent during thefollowing spring season. At age 17 months there waslittle difference in development of the trees in thetreatments where litter was retained and P fertiliserapplied. The legume treatment was ineffective (Fig. 1).
At age 39 months, residue retention treatmentshad resulted in improved tree growth (Table 2); heightby 8.9%, diameter by 11.6%, basal area by 23.9%, andtotal volume by 31.4%. Doubling the quantity ofresidues retained resulted in a further improvement intree growth. Complete weed control markedlyimproved tree growth when compared with the singleresidue retention treatment (mean height increased by7.1%, diameter by 17.7%, basal area by 38.5% andtotal volume by 52.1%). The legume treatment had noeffect on tree growth. The treatment without P isequivalent to the nil residue plus P treatment. Thesedifferences are also reflected in current increments fordiameter, basal area and total volume (Table 2).
The residue treatments had a major influence onbiomass production, with retention of litter andlogging residues improving tree biomass by 29%(Table 3). Double amounts of residues improvedbiomass by a further 17% and weed control resulted inan improvement of 38% over the single residuetreatment. The increased production is accompaniedby a corresponding increase in nutrient uptake.
Family EffectsFamily variation in tree growth is shown in Table 4.There were significant differences between familiesbut the family by residue interaction is generally non-significant. This suggests that the families respondedin a similar fashion to residue managementtreatments.
0
1
2
3
4
5
6
0 5 10 15 20 25 30 35 40
Age (months)
Mea
nh
eig
ht(m
)
BL0
BL2
BL3
BL2+legume
BL2-Weeds
BL2-P
Table 2. Effect of slash treatments on the stand growth at age 39 months
Treatment Mean height DBH Basal area Volume Increment 27-39 months
(m) (cm) (m2 ha-1) (m3 ha-1) DBH Basal area Volume(cm) (m2 ha-1) (m3 ha-1)
BL0 5.0 8.6 6.7 15.9 4.1 4.8 13.2
BL2 5.5 9.6 8.3 20.9 4.2 5.6 16.8
BL3 5.7 10.4 9.8 26.3 4.6 6.7 21.0
BL2 + Leg. 5.3 9.3 7.8 19.4 4.3 5.5 15.9
BL2 - Weed 5.9 11.3 11.5 31.8 4.6 7.3 24.4
BL2 - P 5.1 8.9 7.1 17.2 4.2 5.1 14.2
LSD p=0.05 0.4 1.0 1.8 5.9 0.23 0.83 3.9
Figure 1. Height growth of hybrid pine to residuemanagement treatments on a second rotation site atToolara
StManagment-gs Final.pdf 1/31/01 8:29 PM Page 76 (Black plate)

J.A. Simpson, Z.H. Xu, T. Smith, P. Keay, D.O. Osborne and M. Podberscek 77
Foliar Nutrients For the initial collection, samples were kept separate foreach family. The residue treatments had little effect on foliarconcentrations of macronutrients. The K effect wassignificant with the trees in the nil residue treatment havingthe lowest foliar K concentrations and trees in the doubleslash treatment having the highest concentration (Table 5).The converse situation occurs for foliar Na concentrationswhich were significantly higher in the nil residue treatmentthan all other treatments. There were significant differencesin foliar N, P, Ca, Mg, Na, and Zn concentrations betweenthe families. The residue treatment by family interactionwas not significant for any of the nutrients.
Foliar concentrations of P, K, Ca, and Mg wereabove the critical concentrations for both samplings,indicating that deficiencies of macronutrients werenot a factor limiting tree growth (Table 6). Foliar Nconcentrations declined markedly between ages 27and 39 months, especially in the nil residuetreatment, suggesting that N nutrition over time mayplay an important role in maintenance of long-termsite productivity. The addition of inorganic Pfertiliser has not significantly improved foliar Pconcentrations at this age. Foliar K concentrations,although above critical concentrations, are lowest inthe nil residue treatment.
Table 3. Effect of slash treatments on aboveground tree biomass and nutrient pools at age 39 months
Treatment Biomass N P K Ca Mg
(kg ha-1)
BL0 13 365 30.3 5.1 21.9 27.7 9.7
BL2 17 292 39.3 6.4 29.7 36.2 12.2
BL3 20 292 46.3 7.3 35.7 42.6 14.2
BL2 + Leg 16 234 36.9 6.0 27.6 33.9 11.5
BL2 - Weeds 23 920 54.6 8.5 42.8 50.3 16.5
BL2 - P 14 678 33.3 5.1 24.5 30.6 10.5
LSD p=0.05 3 860 8.9 1.2 7.5 8.2 2.5
Table 4. Growth of six hybrid pine families at age 39 months
Family Mean DBH Basal area Total Increment 27-39 months.number height volume
(m) (cm) (m2 ha-1) (m3 ha-1) Height Basal area Total (m) (m2 ha-1) volume
(m3 ha-1)
1 6.1 10.6 10.1 28.3 2.3 6.6 22.12 6.1 11.0 10.8 29.6 2.4 7.2 23.53a 4.5 8.1 5.8 12.0 1.8 4.2 10.04b 5.7 10.5 9.8 25.8 2.2 6.7 20.75b 4.6 7.5 5.1 10.8 2.0 3.6 8.96a 5.7 10.4 9.7 25.1 2.2 6.6 20.2Mean 5.4 9.7 8.5 21.9 2.2 5.8 17.6LSD p=0.05 0.2 0.4 0.8 2.7 0.1 0.5 1.9Interactionc 0.013 NS 0.011 0.001 NS NS 0.001
a - b Family numbers with the same superscript have the same nominal parentage but originate from different-aged orchards and have a different
degree of self-pollination; c Refers to the significance (p levels) of the family by residue interaction; NS = not significant.
StManagment-gs Final.pdf 1/31/01 8:29 PM Page 77 (Black plate)

Effects of Site Management in Pine Plantations on the Coastal Lowlands of Subtropical Queensland, Australia78
Table 5. Effect of residue management on foliar nutrient concentrations of hybrid pines
Treatment Foliar nutrient concentrations (%)
N P K Ca Mg Na
(a) (b) (a) (b) (a) (b) (a) (b) (a) (b) (a) (b)
BL0 .90 .48 .12 .10 .39 .39 .35 .18 .14 .09 .10 .11BL2 .87 .57 .12 .09 .48 .46 .34 .18 .15 .09 .08 .07
BL3 .91 .61 .11 .11 .59 .62 .33 .22 .15 .12 .07 .07
BL2+ Leg .94 .64 .12 .08 .53 .46 .34 .19 .14 .10 .08 .07
BL2 - Weeds .88 .55 .12 .09 .57 .51 .33 .17 .14 .10 .07 .08
BL2-P .89 .55 .10 .09 .53 .63 .34 .18 .14 .11 .07 .07
LSD p=0.05 NS .071 NS NS .11 NS NS NS NS .02 .02 .02
Decomposition of Residue There was a marked reduction in the quantity of litterplus residue on the soil surface during the 39 monthssince establishment (Table 6). The reduction was mostmarked in the < 1mm fraction. Weeds contributed onlya small proportion to the total surface biomass. Legumeestablishment has been variable and unsuccessful.
There was a strong positive, linear relationship(r2 = 0.91) between soil moisture and quantity ofresidue at 30 months. At the time of sampling the soilwas quite dry with gravimetric moisture contents inthe range 7-12%. This relationship was poor (r2 = 0.11)in the 39 month samples which were collected afterrainfall and the soil moisture contents in the range 20-
Table 6. Surface biomass at ages 0, 30 and 39 months in residue management treatments
Treatment Age Logging residue plus litter (t ha-1)
(months) < 1mm Fraction > 1mm Fraction Total
BL0 0 6.37 2.61 8.9830 2.64 1.76 4.4039 2.84
BL2 0 25.28 25.47 50.7530 11.18 19.43 30.6139 13.93
BL3 0 56.98 84.45 141.4330 17.56 27.23 44.7939 24.89
BL2+ Leg 0 22.73 33.65 56.3830 8.57 9.46 18.0339 12.32
BL2-Weeds 0 25.33 32.65 57.9830 12.38 32.70 45.0839 21.18
BL2-P 0 34.88 38.99 73.8730 14.85 22.77 37.6239 33.96
Mean 0 28.59 36.30 64.8930 11.20 18.89 30.0939 18.19
(a) August 1998; (b) August 1999.
StManagment-gs Final.pdf 1/31/01 8:29 PM Page 78 (Black plate)

J.A. Simpson, Z.H. Xu, T. Smith, P. Keay, D.O. Osborne and M. Podberscek 79
25% (approaching field capacity). The litter pluslogging residues apparently reduced evaporation fromthe soil surface during dry conditions.
The stand was thinned at 39 months to 694 stemsha-1 to remove the less vigorous and poorly formed stemswith due regard to spacing. Estimates of abovegroundbiomass and nutrient content for thinned and remainingstems are summarised in Table 7 and for theaboveground tree components in Table 8. Thedistribution of biomass was as follows: wood 45%,foliage 28% and bark plus branches 26%. The
proportion of the nutrient pools in the various treefractions is vastly different from the biomassproportions. For N, 63% is in the foliage, compared with10% in the wood (cf biomass figures of 28% and 45%respectively). For P and K approximately 55% is in thefoliage and 22% in the wood whereas for Ca, 73% iscontained in the foliage and only 11% is in the wood.
While 38% of the stems were thinned theycontained only 26% of the aboveground biomass andbetween 25% and 28% of the nutrients in the biomass. There was no litter fall observed at age 39 months.
Table 7. Estimated above ground biomass and nutrient content of thinnings and remaining trees at age 39 months
Treatment Stand Biomass N P K Ca Mg
component t ha-1 (kg ha-1)
BL0 Stand 9.89 22.5 3.7 16.7 20.6 7.1Thinnings 3.47 7.8 1.4 5.2 7.1 2.6Total 13.36 30.3 5.1 21.9 27.7 9.7
BL2 Stand 12.79 29.1 4.7 22.4 26.9 8.9Thinnings 4.50 10.2 1.7 7.3 9.3 3.3Total 17.29 39.3 6.4 29.7 36.2 12.2
BL3 Stand 14.94 34.1 5.3 26.7 31.4 10.4Thinnings 5.36 12.2 2.0 9.0 11.2 3.8Total 20.29 46.3 7.3 35.7 42.6 14.2
BL2+ Leg Stand 12.09 27.5 4.4 21.0 25.3 8.5Thinnings 4.14 9.4 1.6 6.6 8.6 3.0Total 16.23 36.9 6.0 27.6 33.9 11.5
BL2-Weeds Stand 17.19 39.3 6.1 31.1 36.2 11.8Thinnings 6.74 15.3 2.4 11.6 14.1 4.7Total 23.92 54.6 8.5 42.7 50.3 16.5
BL2-P Stand 10.82 24.6 4.0 18.6 22.7 7.6Thinnings 3.86 8.7 1.5 6.0 7.9 2.9Total 14.68 33.3 5.5 24.6 30.6 10.5
Table 8. Biomass and nutrient content of above ground tree components at age 39 months (prior to thinning)
Parameter Tree component
Biomass N P K Ca Mg
(kg ha-1)
Wood 7 910 6.7 1.5 6.7 4.2 2.1Bark 2 750 5.1 0.8 4.5 2.1 1.5Branch 1 920 3.0 0.5 2.3 3.8 1.3Foliage 5 050 25.4 3.6 16.8 26.8 7.5Total 17 630 40.2 6.4 30.3 36.9 12.4
StManagment-gs Final.pdf 1/31/01 8:29 PM Page 79 (Black plate)

Effects of Site Management in Pine Plantations on the Coastal Lowlands of Subtropical Queensland, Australia80
DiscussionWith more emphasis on improved productivity andprofitability of plantations in Queensland, intensivesilvicultural practices are being employed, forexample improved genetic material is being deployedand more attention is being placed on implementingoptimum site specific silvicultural prescriptions.These measures, which result in increased plantationproductivity, are expected to increase nutrientdemands on the site. As sustainable forestmanagement is a goal, this study is aimed at helping toprovide a scientific basis for identifying desirableinter-rotation management practices. The nutrientinput-output budgets provide essential data foridentifying potential long-term nutrient problems.
In this study, on an infertile site, retention ofharvesting residues has resulted in improvedplantation productivity. This result is similar to the 5-year results from a trial in Mississippi, USA where, ona low nutrient status site, litter and logging debrisretention improved volume production of loblolly pine(P. taeda) by 40% (Tiarks et al. 1999). In acomparable trial with P. taeda in Louisiana, retentionof litter and logging residue on a site high in nutrientsand organic matter did not improve tree growth.O’Connell et al. (1999) found a similar pattern inyoung eucalypt plantations in southwestern Australiawith no growth response to retained litter and residueson a relatively fertile site but significantly increasedgrowth on a less fertile site.
In the Queensland trial, foliar N concentrationsof the hybrid pines declined markedly between ages2.2 and 3.2 years, especially in the nil residuetreatment, suggesting that N may play an importantrole in the maintenance of long-term site productivityof these infertile sites. Retention of harvestingresidues on site has resulted in improved plantationproductivity. The mechanisms resulting in thisimprovement have not been clearly identified and arelikely to include enhancement of soil physical,chemical and biological properties. These resultsindicate that improved moisture conditions underretained residues are a contributing factor, but severalother mechanisms are also likely to be involved.Identifying and interpreting the significance andapplication of these factors to operational forestrypresent a challenge. Addressing this challenge is
necessary if a reliable prognosis for the long-termmaintenance of productivity of exotic pine plantationsin Queensland is to be achieved.
ConclusionsThe major findings of this study are:
The nutrient losses due to harvesting and theremoval of litter and logging residue combined weresignificant and in some cases high in relation to thetotal and available nutrient pools in the ecosystem.
Survival of F1 hybrid pines was not affected bythe residue management treatments.
At 39 months, tree volume was improved by31% as a result of retaining litter and logging residues;doubling the quantity of residues retained improvedvolume growth by a further 30%; complete weedcontrol improved tree volume by 52% over residueretention alone; legumes had no effect and the slashretention without P treatment was the same as nilresidue plus P treatment.
The increased tree growth was accompanied by acorresponding increase in nutrient uptake in treebiomass.
Major differences were found in the growth ofdifferent families but all families responded in asimilar fashion to the residue treatments.
Foliar nutrient concentrations were abovecritical concentrations and little affected by theresidue management treatments. Significantdifferences existed between families.
Foliar N concentrations declined markedlybetween ages 2.2 and 3.2 years, especially in the nilresidue treatment, indicating that N may play animportant role over time in the maintenance of long-term site productivity.
There was a marked reduction in the quantity ofresidue remaining by age 39 months and this reductionwas most marked in the < 1 mm residue fraction.
In dry conditions residue retention increasedmoisture levels in the surface soil.
StManagment-gs Final.pdf 1/31/01 8:29 PM Page 80 (Black plate)

J.A. Simpson, Z.H. Xu, T. Smith, P. Keay, D.O. Osborne and M. Podberscek 81
AcknowledgementsThe research described forms part of the QueenslandForest Research Institute’s programme funded byQueensland Department of Primary Industries. Someof the laboratory studies associated with this workwere facilitated by the Institute’s involvement in theCooperative Research Centre for SustainableProduction Forestry.
ReferencesCollins, P. (ed.) 2000a. Plant analysis methods.
Queensland Forestry Research Institute. TechnicalNote No 16. Queensland Department of PrimaryIndustry, Brisbane.
Collins, P. (ed.). 2000b. Soil analysis methods.Queensland Forestry Research Institute. TechnicalNote No. 17. Queensland Department of PrimaryIndustry, Brisbane.
FAO. 1974. FAO - UNESCO soils map of the world 1:5000 000. Vol. 1 Legend. (UNESCO, Paris). 59p.
Isbell, R. 1996. The Australian soil classification.CSIRO, Collingwood. 143p.
O’Connell, A.M., Grove, T.S., Mendham, D. andRance, S.J. 1999. Eucalypt plantations in south-western Australia. Paper presented at the ThirdInternational CIFOR Workshop Site Managementand Productivity in Tropical Plantation Forests -Impacts on Soil and Options for Managementover Successive Rotation, Kerala, India,December 1999. 13p.
Queensland DPI Forestry. 1998. DPI forestry yearbookfor the financial year 1997-98. Department ofPrimary Industries, Brisbane. 67p.
Simpson, J.A. 1995. Site-specific fertiliserrequirements of exotic pine plantations inQueensland. In: Schulte, A. and Ruhiyat, D. (eds.)Proceedings of the International Congress (ThirdConference on Forest Soils), ‘Soils of TropicalForest Ecosystems.’ Vol. 5: Soil fertility andfertilisation, Balikpapan, Indonesia, 29 October-3November 1995, 90-106. Mulawarman UniversityPress, Samarinda, Indonesia.
Simpson, J.A. and Grant, M.J. 1991. Exotic pinefertiliser practice and its development inQueensland. Queensland Forest Service TechnicalPaper No. 49: 1-17.
Simpson, J.A., Osborne, D.O. and Xu, Z.H. 1999. Pineplantations on the coastal lowlands of subtropicalQueensland, Australia. In: Nambiar, E.K.S.,Cossalter, C. and Tiarks, A. (eds.) Site managementand productivity in tropical plantation forests:workshop proceedings 16-20 February 1998,Pietermaritzburg, South Africa, 61-67. CIFOR,Bogor.
Tiarks, A., Nambiar, E.K.S. and Cossalter, C. (1998).Site management and productivity in tropicalplantations - impacts on soils and options formanagement over successive rotations. CIFOROccasional Paper No. 16. CIFOR, Bogor. 11p.
Tiarks, A., Elliot-Smith, M. and Stagg, R. 1999.Loblolly pine (Pinus taeda L.) plantations in thesemitropical southeastern United States. Paperpresented at the Third International CIFORWorkshop Site Management and Productivity inTropical Plantation Forests - Impacts on Soil andOptions for Management over Successive Rotation.Kerala, India, December 1999. 4p.
StManagment-gs Final.pdf 1/31/01 8:29 PM Page 81 (Black plate)

IntroductionChinese fir (Cunninghamia lanceolata (Lamb.) Hook. is afast-growing tree species that is used for timber. It plays avery significant role in wood production in southernChina. Generations of consecutive planting have led todegradation of land productivity (Sheng 1992, Yu 1996,Yu et al. 1996). When good land management is notpractised, productivity decline of Chinese fir plantationshas been serious. The research group is conducting long-term and fixed-site research on the effects leaving differentamounts of logging residue during harvest as a method ofpreventing loss of productivity.
Site Details The experimental site is located in Fujian Province,southeastern China (Xiayang state forest farm,Nanping), latitude 26045'N, longitude 118010'E andaltitude ca 250 m. This is in the middle subtropical zonewith mean annual precipitation 1817 mm, mean annualtemperature 19.40C, and extreme temperature rangefrom -5.80C to 410C.
The soil is an unidentified red soil with a depthmore than 1 m. Soil samples were collected from five
points in each plot at depths of 0-10, 10-20 and 20-40cm. The soils are acidic and have high levels ofexchangeable Al. The soil chemical and physicalproperties are summarised in Table 1.
Stand DescriptionThe Chinese fir stand of the previous rotation was 29years old when felled in the winter of 1996. Beforefelling, the height and diameter of all trees in the plotwere measured. Biomass and nutrient content weredetermined on selected sample trees before felling.The trees averaged 19.6 m in height and 23.7 cm dbh.The average stocking was 1259 trees ha-1, but rangedfrom 900 to 1597 trees ha-1 in the four blocks. Theaverage volume for the experimental area was 518 m3
ha-1 and the mean annual volume growth was 17.9 m3
ha-1 yr-1. The total biomass and nutrient accumulationof the trees, the litter and understorey were alsodetermined (Table 2).
Effects of Site Management in Chinese Fir(Cunninghamia lanceolata) Plantations
in Fujian Province, China
Fan Shaohui1, Yang Chendong1, He Zongming2, He Zhiying2, Lin Sizu2, Lu Shantu3,Ying Jinhua3, and Yang Xujing3
AbstractThe effects of leaving different amounts of logging residue on the growth of 2-year-old Chinese fir(Cunninghamia lanceolata) planted after harvesting a 29-year-old, first rotation plantation in Fujianprovince, China, were studied. The best survival and growth of the trees were on the double slashtreatment but the next best treatment was complete removal of organic matter residues. The poorestbiomass accumulation was 372 g tree-1 in the whole tree harvest treatment and increased incrementallyas more slash was retained with 576 g tree-1 in the double slash treatment. Burning logging slash did nothave any significant effect on survival or growth compared to the treatment with the same amounts ofslash but not burned.
1 Institute of Forestry, Chinese Academy of Forestry, Beijing, 1000912 Fujian Forestry College, Nanping, 3530013 Nanping Forestry Committee, Nanping, 353000
10
StManagment-gs Final.pdf 1/31/01 8:29 PM Page 83 (Black plate)

Effects of Site Management in Chinese Fir (Cunninghamia lanceolata) Plantations in Fujian Province, China84
Experimental Design and MethodsThe experimental design is a completely randomisedblock with four replications containing five plots. Thetreatments were arranged into four blocks, with theblocking based on slope position and aspect. The area ofeach of the 20 plots is 600 m2 and each has 150 treesplanted in it (2500 trees ha-1). The five residuetreatments applied after harvest were:
BL0 No slash. All aboveground organic residueincluding the crop trees, understorey andlitter was removed from the plots.
Table 1. Soil chemical and physical properties of the experimental site
Parameter Soil depth (cm)
0-10 10-20 20-40
pH 5.1 4.9 4.9Organic matter (%) 5.3 4.3 3.0Total N (%) 0.113 0.088 0.067Total P (mg kg-1) 367 357 411Available P (mg kg-1) 3.1 2.3 1.1Exchangeable cations (c mol kg-1) 156.5 132.6 126.6Ca 10.7 6.6 5.8Mg 5.5 2.8 2.3K 2.5 1.6 1.2H 1.5 1.1 1.0Al 53.6 57.9 51.2Soil bulk density (g cm-3) 0.94 1.00 1.08
Table 2. Biomass and nutrients in the Chinese fir, ground cover (herbs + litter + shrubs) and slash (leaves + branches)of the first-rotation stand
Biomass Nutrients
N P K Ca Mg
(t ha-1) (kg ha-1)
Trees 197 195 39.8 241 246 76.7Ground cover 9.9 82 6.8 126 79 27.9Slash 26.1 114 15.6 134 147 41.7
Table 3. Aboveground biomass and nutrients retained by each harvesting treatment
Biomass Nutrient (kg ha-1)
N P K Ca Mg
BL1 9.9 82 6.8 126 79 27.9BL2 36.0 196 22.4 261 226 69.6BL3 62.1 310 38.0 395 373 111.3
BL1 Whole-tree harvest. All aboveground parts ofthe trees removed.
BL2 Stem + bark harvest. Only the main bole andattached bark was removed.
BL3 Double slash. Branches, leaves and other non-commercial components of trees from the BL1
treatment were applied to this treatment.BL2B Stem and bark harvest + burning. Same as BL2
except the residue was burned (B).
Aboveground biomass and nutrients retained byeach harvesting treatment are given in Table 3.
Biomass component
retained (t ha-1)
StManagment-gs Final.pdf 1/31/01 8:29 PM Page 84 (Black plate)

Fan Shaohui, Yang Chendong, He Zongming, He Zhiying, Lin Sizu, Lu Shantu, Ying Jinhua and Yang Xujing 85
Treatment BL0 would have only negligible amounts ofresidue and nutrients associated with slash and litter.
The seedlings were planted in pits in February1997 and a complete NPK fertiliser applied 3 monthslater at a rate of 100 g tree-1. All dead trees were replacedin December 1997. The stand was weeded twice eachyear by manual hoeing.
Tree growth was measured at the end of the firstand second growing seasons. All trees were measured,but only the data on trees from the initial planting(excluding the replanted seedlings) is reported. Resultsinclude: survival rate, diameter at breast height or basediameter, height, crown width and biomass in treecomponents. Analysis of variance and Duncan’sMultiple Range test were used to determine thestatistical significance of the treatments.
Aboveground biomass measurements (includingstem, bark, branches and leaves) were made based onone plant in all plots in year 1 (January 1998) and in the
protective rows in five plots in block I in year 2 (January1999). Regression equations predicting the biomass ofthe various components of a Chinese fir tree on its basediameter and height were developed (Table 4).
Results and DiscussionThe overall survival of seedlings planted in February1997 was poor because of harsh site conditions andcompetition from weeds. The dead trees were replacedafter 10 months but there were large differences in treesize between the two plantings. As noted earlier, thegrowth and the survival of the February 1997 plantingonly is reported here.
After two seasons of growth, the treatments had astatistically significant effect on survival, diameter,height, crown width and biomass of Chinese fir (Table5). Survival was in the range 61-79% and wasparticularly low in the whole tree harvest (BL1) andburning (BL2B). The double slash plots (BL3) had the
Table 4. The regression of biomass of various organs of a single Chinese fir plant on base diameter and height at agetwo years
Organs Regression equation R n Range of base Range ofdiameter (cm) height (m)
Branches WB=8.450429*DG^1.850987* 0.8654 24 0.640-3.65 0.50-2.00
H^0.4358788
Stem WS=11.45523*DG^1.457363* 0.9880 24 0.640-3.65 0.50-2.00
H^1.378857
Bark WBK=4.33395*DG^1.592445* 0.9730 24 0.640-3.65 0.50-2.00
H^0.3286018DG-diameter at ground level (cm); H-tree height (m).
Table 5. Effects of treatments on the growth of Chinese fir after two growing seasons
Treatment Survival rate Base diameter Height Crown width range Biomass(%) (cm) (m) (m) in trees
(g tree-1)
BL0 76bc 3.2bc 1.60a 1.06ab 457a
BL1 62ab 2.8a 1.45a 1.00a 372a
BL2 67abc 2.9ab 1.50a 1.03ab 399a
BL3 79c 3.4c 1.80b 1.18b 567b
BL2B 61a 3.1ab 1.55a 1.04ab 428a
Values in a column followed by the same letter are not significantly different (alpha=0.05).
StManagment-gs Final.pdf 1/31/01 8:29 PM Page 85 (Black plate)

Effects of Site Management in Chinese Fir (Cunninghamia lanceolata) Plantations in Fujian Province, China86
explore more fully these issues as well as the long-term effects of treatments.
ReferencesFan, S., Lin, G. and He, Z. 1999a. Research on the effects
of different measures of site management on growth ofone-year-old plantation of the second-rotation ofChinese fir, Science Silvae Sinica 35(3): 120-126. (inChinese)
Fan, S., Yang, C., Huang, Z., He, Z., Zheng, L., Deng, R.,Ying, J. and Yang, X. 1999b. Chinese fir plantation inFujian province, China. In: Nambiar, E.K.S., Cossalter,C. and Tiarks, A. (eds.) Site management andproductivity in tropical forest plantation forests:workshop proceedings, 16-20 February, 1998,Pietermaritzburg, South Africa, 69-72. CIFOR, Bogor.
Sheng, W. 1992. Degradation of land productivity ofplantations as well as its control countermeasures inChina. In: Sheng W. (ed.) The research on degradationof land productivity of plantations, 15-19. Science andTechnology Press of China, Beijing. (in Chinese)
Yu, X. 1996. The research and countermeasures ondegradation of land productivity of Chinese fir. Journalof Science and Technology of Forestry 9: 1-2. (inChinese)
Yu, X., Fan, S. and Sheng, W. 1996. The current situationof research on role of Chinese fir in plantations ofChina and its nutrient management. Journal of Scienceand Technology of Forestry 9: 34-41. (in Chinese)
largest trees and 79% survival. This may have been atleast partially due to the mulching effect in the firstgrowing season that inhibited understorey competitionand at the same time improved soil moisture retention.The apparent (although not statistically significant)slightly better growth of the complete removaltreatment (BL0) may also be due to the reduction ofcompeting vegetation. The marginally poorer growthand survival in the whole tree harvest treatment (BL1)may also be the result of greater understoreycompetition than in the other plots. The treatmentsaffected the biomass of leaves, branches, stem and barkin a similar manner as the total growth (Table 6). Thetree components were consistently and significantlylargest on double slash plots (BL3). The leaf and barkcomponents were significantly larger on the completeremoval treatment (BL0) compared to the whole treeharvest (BL1) treatment.
These results are similar to those after oneseason of growth (Fan et al. 1999a, 1999b) except thatthe biomass of the trees in the complete removaltreatment was no longer significantly greater than thatin all other treatments with the same amount of slashretained. It is noteworthy that the burning treatmenthas had no significant effect on the growth of the treesat this stage. The relatively high mortality thatoccurred at the site during the first year may haveconfounded the early results. Preliminary observationsindicate that the replacement planting may catch upwith the others during the stand establishment period.Data from future measurements will be used to
Table 6. Effects of treatments on the biomass of tree components of Chinese fir after two growing seasons
Treatment Leaves Branches Stem Bark Tree (g tree-1)
BL0 196b 93a 135a 32b 457a
BL1 163a 74a 109a 26a 372a
BL2 174ab 80a 116a 28ab 399a
BL3 230c 115b 184b 38c 567b
BL2B 184ab 87a 127a 30ab 428a
Values in a column followed by the same letter are not significantly different (alpha=0.05).
StManagment-gs Final.pdf 1/31/01 8:29 PM Page 86 (Black plate)

IntroductionPT. Riau Andalan Pulp and Paper (RAPP) is a pulp andpaper producing subsidiary of Asian Pacific ResourcesInternational Holdings (APRIL). It uses residualhardwood from logged-over forest concessions for pulpwhile establishing Acacia plantations for a sustainable,long-term wood supply. The land allocated for plantationsis either logged-over forest, belukar or grassland in Riauprovince, Sumatra, Indonesia. Acacia mangium Willd. isthe main species planted and grown on a seven-yearrotation. Plantation-grown wood will progressivelyreplace wood from native forest concessions as rawmaterial for the pulp mill. The mill needs 6 million m3 ofwood annually to provide fibre for 1.3 million t yr-1 ofpulp. Starting in 1993, RAPP plantation development hasincreased dramatically. For the period 1997/1998, theannual planting programme of RAPP and its associatedcompanies was over 35 000 ha. Its plantation area isplanned to reach 270 000 ha by year 2002.
Research is in progress to develop seeds andclones of superior genetic quality, and improvedplantation silvicultural practices for sustainable woodproduction. Since 1995, a government ‘no burn’ policy
has been enforced in the company’s plantationdevelopment. Initially it was problematic but moreefficient extraction of utilisable wood from the site hasmade it easier for planting and tending. It is envisagedthat even with a high level of planting practices and fieldmanagement, some land degradation will occur withshort rotation plantations over the long-term. This isparticularly likely to occur in this humid tropicalenvironment with high annual radiation, temperatureand rainfall. The soils are highly weathered and low infertility and must be managed in accordance with theircapabilities. Retention of adequate organic matter tomaintain soil structure, water and nutrient supply isessential. This is very critical as RAPP’s large-scale pulpproduction requires a sustained supply of superiorquality wood.
The objective of this study is thus to obtain an in-depth understanding of the processes controlling short-rotation forest plantation productivity in the long-term.
Site Management and Productivity of Acacia mangium in Humid Tropical
Sumatra, Indonesia
C.K. Mok1, L.C. Cheah1 and Y.K. Chan1
AbstractPT. Riau Andalan Pulp and Paper (RAPP) is establishing plantations in Riau province, Sumatra, Indonesiafor sustainable wood supply for a pulp mill. Acacia mangium is the dominant species planted and is grownon a seven-year rotation. Since 1993, RAPP’s plantation development activities have increaseddramatically with an annual planting programme of about 35 000 hectares. The plantation area is plannedto reach 270 000 hectares by 2002. This paper describes the study plan for research on inter-rotational siteproductivity and management of A. mangium. The experiment will test on-site effects of differenttreatments of organic matter or aboveground biomass management. The objective is to develop moresustainable management practices through in-depth understanding of processes affecting soil and tropicalforest plantation productivity in the long-term. Growth of the previous A. mangium stand in relation toclimate, terrain and soil is discussed. Harvesting and treatment applications are planned for April 2000.
1 PT Riau Andalan Pulp and Paper, Pangkalan Kerinci, Pekanbaru,Sumatra, Indonesia, Fax: +62 761 95306
11
StManagment-gs Final.pdf 1/31/01 8:29 PM Page 87 (Black plate)

Site Management and Productivity of Acacia mangium in Humid Tropical Sumatra, Indonesia88
It will measure the impact of selected managementpractices that could reduce the impact of tree harvestingand establishment practices and mitigate any adverseeffects on the soil. The research is part of the CIFORnetwork project on site management and productivity intropical plantation forests.
Location and Site DescriptionThe RAPP forest concessions are located 10 N and 10S ofthe equator at elevations below 400 m asl on undulatingto hillocky plains in Riau province, Sumatra. Theresearch site is ca 10 km northeast of Baserah town. It isbetween latitude 00 20' 46''S and longitude 1010 47’ 04''Eand latitude 0' 20'37''S and longitude 1010 49'31''E at analtitude of ca 100 m. The terrain and soil type arerepresentative of most RAPP forest concessions. Theexisting stand of A. mangium has grown satisfactorilyand is near harvestable age.
The climate in the region is warm humid tropicalwith mean annual temperature of 270C, with smallseasonal variations, average maximum temperature320C, average minimum temperature 230C, and highhumidity 78-100%. Mean annual rainfall over 10 yearsis 2700 mm. The wetter months, October to May, havemonthly average of 230 mm. The drier months, June toSeptember, can have less than 60 mm per month.
Mean annual rainfall in the Baserah area from1996 to 1998 was 2305 mm falling in 107 days. January,June and July were low rainfall months with meanmonthly precipitation less than 100 mm and four to sixraindays (Table 1). The other nine months had meanmonthly rainfall of 153-365 mm and eight to fourteenraindays. In 1997, the annual rainfall was 1910 mm. butthere were six months with rainfall of between 17 and 69mm due to El Nino and a five-month consecutive dryperiod (June-October) affected tree growth.
An automatic weather station is being establishedclose to the experimental site to obtain daily, weekly andmonthly data for rainfall, temperature, humidity andsolar radiation.
The research site has undulating to rolling terrain.Most slopes are 4-8% but some are 9-15%. The geologyconsists of Pleo-Pleistocene sediments comprisingsandstones, siltstones, mudstones, tuffites and fine-grained tephra. They are low in weatherable mineralsand contain kaolinitic clays.
An upland soil, ‘type C’ and an alluvial soil, ‘AL’are found in the project area. The alluvial soil isassociated with low-lying areas and stream valleys andis derived from recent riverine alluvium. The soil is deepbut poorly drained and very variable in texture. It isclassified as a Typic Tropofluvent (USDA), Dystric
Table 1. Rainfall in Baserah Sector, 1996 to 1998
Month Year Mean
1996 1997 1998mm Days mm Days mm Days mm Days
January 50 7 47 3 107 9 68 6February 305 15 148 8 144 6 199 10March 395 13 472 17 228 8 365 13April 301 14 354 17 237 10 297 14May 49 4 200 10 324 15 191 10June 161 5 53 3 78 5 97 4July 159 5 23 1 108 9 97 5August 317 10 17 1 389 13 241 8September 265 12 41 2 161 14 156 9October 312 15 69 4 90 6 157 8November 265 13 336 9 251 9 284 10December 80 13 150 8 229 10 153 10Total 2659 126 1910 83 2346 114 2305 107
StManagment-gs Final.pdf 1/31/01 8:29 PM Page 88 (Black plate)

C.K. Mok, L.C. Cheah and Y.K. Chan 89
Fluvisol (FAO) and Alluvial Distrik (IndonesianClassification System). The upland soil is a TypicHapludult (USDA), a Ferric Acrisol (FAO) and aPodsolik Ortoksik (Indonesian Classification System). Itis the dominant soil in RAPP’s forest concessions.
Soil type C has a dark yellowish brown sandy clayloam to clay loam topsoil, generally less than 10 cmthick. The matrix is made up of moderate, coarse tomedium subangular blocky structures with friable tofirm consistencies when moist. This horizon iscommonly underlain by strong brown clay withstructures of moderately-coarse subangular blockybecoming moderately-coarse angular blocky with depth.Below 70 cm many light brownish grey, brownishyellow and red mottles are present. The soil typically hasfirm consistency to at least 110 cm depth.
Chemically the soils are acidic with pH (KCl)below 4.0 (Table 2). The N and C contents of the topsoilare medium but tend to become low to very low withdepth. The cation exchange capacity is low, reflectingthe kaolinitic nature of the clay minerals. Except for the
surface layer (0-9 cm), the base saturation is very low,less than 10% throughout the profile. Available P is alsovery low. Physical and chemical properties of soil typeC sampled at the experimental site are given in Table 2.
Soil samples will be collected from each plot aftertreatment application but before planting. Samples willbe taken from 10 points in each plot at 0-10, 10-20 and20-40 cm and bulked by depth. Air-dried subsampleswill be used to determine particle size distribution by thepipette method and for chemical analysis. Chemicalanalyses of soil samples (< 2 mm fraction) from eachplot will include pH (water), organic C (potassiumdichromate), total N (kjeldhal digestion/distillation),total P, K, Ca, Mg (25% HCl), available P (Bray II),exchangeable K, Ca, Mg (ammonium acetate, pH 7),and exchangeable Al.
Bulk density measurements will be made onundisturbed core samples of known volume from fivepoints in each plot at 0-10, 10-20 and 25-35 cm depth fordry weight determination at 1050C. Infiltration rate todefine initial soil surface condition will be measured
Table 2. Physical and chemical properties of soil type C
Parameter Depth (cm)
0-9 9-50 50-68 68-110
Particle size %- Coarse sand 20 8 8 5- Fine sand 16 8 8 5- Silt 31 25 20 20- Clay 33 59 64 70pH - H20 4.1 4.2 4.3 4.4- KCl 3.8 3.6 3.5 3.5N (%) 0.32 0.13 0.12 0.10C (%) 2.56 0.90 0.67 0.46Phosphorus (µg g-1):- Total P (25 % HCl) 266 116 86 26- Available P (Bray II) 1.33 0.47 0.40 0.76CEC, pH7 (c mol kg-1 soil) 16.5 14.6 16.8 22.0Exchangeable cations:(c mol kg-1 soil)- K 0.41 0.24 0.18 0.30- Ca 2.52 0.49 0.26 0.13- Mg 1.64 0.73 0.54 0.56- Na 0.16 0.12 0.13 0.14Total K, 25 % HCl(µg g-1) 464 427 389 439Base saturation (%) 28.7 10.8 6.6 5.1
StManagment-gs Final.pdf 1/31/01 8:29 PM Page 89 (Black plate)

Site Management and Productivity of Acacia mangium in Humid Tropical Sumatra, Indonesia90
before and after felling. Cylinders 10-15 cm diameterwill be placed over the litter sampling square and pushedinto the soil to 3 cm depth. The rate of decrease of thewater level in the cylinder is the infiltration rate of thesoil. There will be further soil sampling and analysis inyear 3 of the experiment.
Stand Establishment andMaintenanceThe research site was originally scrubland (belukar)with a very low wood volume. It was slashed and felledand the slash spread mechanically. A. mangiumseedlings of Claudie River provenance from northernQueensland were planted in November 1993 at 3 x 2 mspacing, 1667 trees ha-1. The seedlings were 8-10 weeksold, grown in polybags, and planted in pits 20 x 20 x 20cm. Blanking was completed within one month afterplanting.
Triple superphosphate (100 g) was applied in theplanting hole and after planting, 20 g (9.2 g N) urea wasbroadcast 20 cm from the stem. This was to encouragerapid development of roots and establishment of theseedling. Fertiliser application after planting is notnormally carried out.
Noxious weeds and woody regrowth werecontrolled for 18 months or to canopy closure whicheverwas earlier. Manual weeding to maintain a 50-100 cmradius, weed-free circle around the plant was carried outduring the first three to six months. Chemical spotspraying was done post-planting with glyphosate for
lalang (Imperata cylindrica), paraquat dichloride(gramoxone) for grasses, sedges and brackens, and acocktail of paraquat and 2.4-D amine for mixture ofgrasses, broadleaved herbs and woody saplings.
Pests and diseases have not been a very seriousthreat to the plantations so far. The initial plantingdensity allows for some losses due to pests anddiseases, windthrow and other causes. Singling wascarried out four to six months after planting, when thetrees were 1.5-2.0 m tall, and again at eight to twelvemonths of age.
Tree GrowthTree growth data are available from permanent samplingplots, tree enumeration and diameter measurements oftrial plots.
Permanent sampling plotTo monitor rate of stand growth, permanent sample plots(PSP) are established at age 1.5-2.0 years with one plotto about 500 ha. The A. mangium PSP 30 of 0.02 halocated in compartment EO2 of Baserah is in the trialarea. It was established 3 May 1995 with latestmeasurement 7 February 1999.
The number of stems per hectare declined from afull stocking of ca 1650 trees at three years to 1200 inthe fifth year (Table 3). However, at 5.3 years the meanheight was 23.8 m and mean diameter was 16.8 cm. Thetotal volume (under bark) increment averaged 55.2 m3
ha-1 yr-1 and is still rising.
Table 3. Stems ha-1, mean height, mean diameter, volume, MAI and CAI trend with age of Acacia mangium in PSP 30Baserah
Age Density Mean height Mean diameter Volume MAI CAI(yr) (stems ha-1) (m) (cm) (m3 ha-1) (m3 ha-1 yr-1) (m3 ha-1 yr-1)
1.5 1667 7.9 8.9 36.4 24.3 0.0
2.2 1667 11.5 11.0 76.9 35.0 57.8
2.7 1667 14.2 11.7 105.5 39.1 57.3
3.2 1633 17.0 13.0 150.0 46.9 89.1
3.7 1533 18.7 14.0 176.9 47.8 53.6
4.2 1400 20.2 14.8 192.7 45.9 31.7
4.7 1267 22.4 15.8 216.8 46.1 48.2
5.3 1200 23.8 16.8 246.1 46.4 58.6
StManagment-gs Final.pdf 1/31/01 8:29 PM Page 90 (Black plate)

C.K. Mok, L.C. Cheah and Y.K. Chan 91
The mean (MAI) and current (CAI) annualincrements (total stem volume under bark) declined inyear 4 probably due to five consecutive dry months inJune-October 1997 associated with El Nino. Both MAIand CAI have increased again at 5.3 years.
Tree enumerationIn September 1999, the number of living trees in allexcept three of the experimental plots was 200-300.Plots 1 to 6 in block IV have lower numbers dueprobably to localised site effects
Tree diameterThe diameter breast height over bark (dbh) of livingtrees measured in September 1999 had a mean of 16.0cm with a maximum of 38.5 cm (Fig. 1). This is close to
the average diameter (16.8 cm) of PSP 30. Variation inmean dbh between blocks was small (Table 4).
Block IV with the highest mean dbh (16.5 cm) hasthe lowest total number of living trees, (Table 4). InBlock II this is reversed, highest number of living treesbut smallest mean dbh (15.6 cm). This relationshipbetween the number of living trees and diameter growthis as expected.
On the basis of the dbh frequency distribution 84-91% of living trees in each block are between 8-24 cmdiameter. Only 1.2% of the experimental trees aremultistemmed so the impact on stand dbh distributionis minimal.
0
100
200
300
400
500
600
700
1 3 5 7 9 11 13 15 17 19 21 23 25 27 29 31 33 35 37 39
Dbh (cm)
Range : 2.2 - 38.5 cm Mean : 16.0 cm, SD : 5.0
Freq
uenc
y
Figure 1. Diameter distribution of living trees in experimental plots
Table 4. Number and diameter of living trees in each block
Block Number of living trees Diameter (cm)
Plot mean SD Plot mean SD
I 263 16 16.1 4.8II 274 17 15.6 4.9
III 248 16 15.9 5.2
IV 208 14 16.5 5.6
V 261 16 15.9 4.9
StManagment-gs Final.pdf 1/31/01 8:29 PM Page 91 (Black plate)

Site Management and Productivity of Acacia mangium in Humid Tropical Sumatra, Indonesia92
Understorey VegetationGrass species observed in most plots were Digitariawallichiana, Panicum repens, Scleria sumatrensis andPanicum sarmentosum. The two common ferns wereStenochlaena palustris and Pteridium esculentum.Shrubs were mainly Clidemia hirta, Melastome sp.,Ageratum conyzoides, Elettariopsis curtisi. Treesincluded Celastrus sp., Macaranga sp., Mezzettialepotoda, Santiria rubiginosa and Vitex sp.
Experimental DetailsThe experimental design and core treatments willconform to those of CIFOR network project (Tiarkset al. 1999).
Experimental design will be a randomised completeblock with five replicates. The five core treatments aresummarised below together with the two optionaltreatments of special interest to RAPP. One optionaltreatment, BL4, is on-site manual debarking with stemwood removed. The other, BL5 is manual debarking onsite with manual stacking and wood transported byforwarder along access placed at 15 m intervals.
Each block will have seven experimental treatments.However, the five replicates of core treatment standingcrop (SC) will be a single continuous block as they will notbe harvested (Fig. 2). The six remaining treatments will beallocated at random to plots 1 to 6 in each replicate.
A treatment plot will be 48 x 48 m with an internalplot of 32 x 32 m for growth measurements andsampling. The buffer area is to be used for biomassharvest and chemical analysis sampling. The gross plotsize of standing crop is slightly smaller, 50 x 40 m, so asto obtain a continuous single block away from otherplots. The 35 plots will be laid out in five replications onsoil type C in an area of 15.4 ha (Fig. 2). Four of theplots are entirely on 9-15% slopes, and 12 plots partlyon 4-8% and partly on 9-15% slope. The remaining 19plots are on 4-8% slopes.
Core treatments:BL0 All crop trees with bark, understorey vegetation,
slash and litter removed.BL1 Whole-tree harvest. All crop trees with bark
(tops, branches and slash) removed to BL3.Understorey vegetation and litter retained.
BL2 Merchantable tree harvest. Commercial woodand bark removed. Tops, branches and slash,
understorey vegetation and litter retained andevenly distributed.
BL3 Double slash. Commercial wood and barkremoved. Non-commercial residues from BL1
brought in and distributed evenly, adding to theslash already present.
SC Standing crop retained undisturbed.
Optional treatments:BL4 Commercial felling, all commercial wood
without bark removed. Bark, tops, branches,slash, understorey vegetation and litter retained.
BL5 Manual felling, all commercial wood minus barktransported by forwarder. Bark, tops, branches,slash, understorey vegetation and litter retained.
MeasurementMeasurements to be recorded are described below.
Pre-harvest Biomass and NutrientsStanding treesTwenty five trees will be randomly sampled by diameterclass with two to four trees per diameter class forestimating mass of wood and bark in main stem,branches including bark separated into < 1 cm, 1-5 cmand > 5 cm, young phyllodes (‘leaves’) separated fromfully mature phyllodes, if not separable they can bebulked, flower, pods and seeds if any.
For stem biomass, each sampled tree will be felled.After measuring its length to diameter 7 cm, the stemwill be cut into four sections of equal length. Freshweight of each stem section will be determined.
A 5 cm thick disc will be cut from the middle ofeach stem section and discs pooled from different treesto obtain four replicated samples within each heightclass. There will be four such pools of discs, one foreach section length. Discs will be cut into pies of 300
size, and bulked by height class. They will besubsampled to obtain four replicated samples from eachheight class for basic density determination of wood andbark after oven drying at 1050C. Another foursubsamples are for nutrient (N, P, K, Ca, Mg)determinations after oven drying at 700C.
Phyllodes will be stripped off branches andseparated into young and fully mature groups. Eachgroup will be subsampled for dry weight determinationand for nutrient determination. Branch and twig biomass
StManagment-gs Final.pdf 1/31/01 8:29 PM Page 92 (Black plate)

C.K. Mok, L.C. Cheah and Y.K. Chan 93
AL C
C C
Fig
ure
2.
PT.
R
iau
And
alan
Pul
p an
d P
aper
tria
l site
StManagment-gs Final.pdf 1/31/01 8:29 PM Page 93 (Black plate)

Site Management and Productivity of Acacia mangium in Humid Tropical Sumatra, Indonesia94
and nutrient determinations will be carried out in thesame manner as for phyllodes.
Understorey biomass and nutrientsOn each plot, the dominant species, composition andbiomass of the understorey will be determined from fivesubplots of 1 m2, and separated into grasses, herbs andshrubs. After weighing, samples will be bulked by blockand representative subsamples taken for dry weight andnutrient determinations.
Litter on forest floorThe litter will be sampled down to the mineral soilsurface from five subplots used in understorey sampling.It will be separated into phyllodes, branches (wood andbark), twigs, stem (wood and bark), seeds, pods andstalks, and each component oven dried to obtain dryweight. The litter will then be bulked for all blocks byeach component and subsampled for N, P, K, Ca, Mgdeterminations. A portion of each subsample will beashed at 5000C to express biomass and nutrient valueson ash-free basis.
Tree GrowthHeight and diameter of trees on each treatment plot willbe measured at 6-monthly intervals until 24 months andthen annually during the rotation. Volume and biomassequations will be developed from sample trees so thatthey can be estimated from diameter data. Standnutrition up to canopy closure is to be monitored bycollecting phyllode samples for nutrient analysis at 6-monthly intervals.
Trial Implementation andManagementAfter sampling the biomass of standing trees,understorey and litter, the stand will be clearcut usingchainsaws with manual removal of wood from the plot
except for the treatment where a forwarder is to be usedto transport the wood.
Close supervision will ensure directional felling iscarried out for easier access and work in treatment plots.Areas, 6-10 m wide, have been planned between blocksand plots to allow easy access so as to minimise sitedisturbance and ensure wood extraction from theresearch areas is unimpeded.
The trial plots will be planted with a mixture ofselected clonal A. mangium at 3 x 3 m spacing. In ordernot to mask effects of organic matter treatments,minimal amounts of fertiliser will be applied to theplants at planting and none after planting.
A detailed file on the trial is to be kept togetherwith a file to record all measurements, operations, costsand events that may affect the productivity of theexperimental plantings. The trial will run for at least onerotation of seven years.
AcknowledgementsThe authors acknowledge with the thanks assistancegiven by the company’s Research and Development andplanning staff in the fieldwork and preparation of thispaper. The senior author thanks CIFOR for sponsoringhis participation at the workshop.
ReferenceTiarks, A., Nambiar, E.K.S., Cossalter, C. and
Ranger, J. (1999). A progress report. In: Nambiar,E.K.S., Cossalter, C. and Tiarks, A. (eds.) Sitemanagement and productivity in tropicalplantation forests: workshop proceedings 16-20February 1998, Pietermaritzburg, South Africa,73-76. CIFOR, Bogor.
StManagment-gs Final.pdf 1/31/01 8:29 PM Page 94 (Black plate)

IntroductionSince 1978, 42 000 hectares of clonal plantations havebeen established on a former savanna in a 50 km radiusaround Pointe-Noire. Their main purpose is theproduction of pulpwood. Research on the sustainabilityof these plantations is a priority because they are grownon a short rotation on soils with small reserves ofavailable nutrients. Among several studies focussing onthis goal, the biogeochemical cycle was assessed in aclonal plantation of a eucalypt hybrid and in a nativesavanna for 1.5 years. This hybrid comes from naturalcrosses between two or three individuals of Eucalyptusalba Reinw. ex Blume (female parent) and a group ofpoorly identified Eucalyptus hybrids from a Brazilianarboretum (male parent). They are thought to be theresult of crosses between E. grandis, E. robusta, E.urophylla and E. botryoides (Delwaulle 1989). In thesavanna, the biomass of the grass Loudetia arundinacea(Hochst.) Stend. amounts to 80% of the total aerialbiomass throughout the year.
The aim of the study was to characterise thenutrient dynamics in both ecosystems and to establishnutrient budgets. This study is complementary with theCongo experiment within the framework of the CIFORnetwork ‘Site management and productivity in tropicalforest plantations’ (Bouillet et al. 1999). This researchwill provide information on the impact of silviculturalpractices on soil fertility and should contribute to moreefficient fertiliser practices for a sustainable yield of thecommercial plantations around Pointe-Noire.
Materials and MethodsAt the start of the study, the amounts of nutrients wereassessed in the 6-year-old eucalypt plantation, savanna,litter layer and soil. The eucalypt stand and the savannahad an area of about five hectares and were locatedadjacent to each other. The eucalypt plot was planted inJanuary 1992 on the savanna. The nutrient accumulationwas measured using a chronosequence approach for thesame eucalypt clone (Laclau et al. 2000) and everymonth during one year in the savanna (between twoannual fires). The other measurements were carried outin plots of 0.25 ha in both ecosystems as follows:litterfall (with 15 litter traps), precipitation (with threegutters in an open area), throughfall (with threereplicates of three gutters in the eucalypt stand and fourreplicates of collectors on the savanna floor), stemflow(with collars around 10 trunks), solution beneath thelitter layer (collected by four sets of nine narrowlysimeters) and soil solution (collected with fourreplicates of tension lysimeters at the depths of 15 cm,50 cm, 1 m, 2 m, 3 m, 4 m in the savanna and at the samedepths plus 6 m in the eucalypt stand). The drydeposition in the atmospheric inputs of Cl and S wereassessed assuming canopy interactions were negligible.Chloride was used as a tracer to calculate dry depositionfor Ca, and S was used as a tracer for the other elements.A hydrological model was used to assess the seepage
SHORT COMMUNICATION 1
Nutrient Cycling in a Short Rotation Eucalyptus Plantation and an Adjacent
Savanna in Congo
J.P. Laclau1, J. Ranger2, J. de D. Nzila3 and J.P. Bouillet1
1 Cirad-Forêt / UR2PI, BP 1264, Pointe-Noire, Congo2 Equipe cycles biogéochimiques, INRA Centre de Nancy, 54280
Champenoux, France3 UR2PI, BP 1264, Pointe-Noire, Congo
12
StManagment-gs Final.pdf 1/31/01 8:29 PM Page 95 (Black plate)

Nutrient Cycling in a Short Rotation Eucalyptus Plantation and an Adjacent Savanna in Congo96
fluxes. The monitoring of soil moisture with TDRprobes during one year allowed validation of this model.
Samples of solutions were collected weekly in allthe collectors (rainfall, throughfall, stemflow, and soilsolution up to the depth of 6 m), samples were thenstored at 4°C, and bulked every 4 weeks for chemicalanalyses. The solutions were filtered in Pointe-Noireand pH and SO4
2- (by colorimetry) were measured asquickly as possible. The samples were then acidifiedwith H2SO4, and sent to the CIRAD laboratory in Francewhere nitrate, ammonium and chloride were measuredby colorimetry and total Si, P, K, Ca, Mg, Na, by ICPemission spectroscopy. In the plant samples, N wasanalysed by acid-base volumetry after Kjeldahlmineralisation, P by cold colorimetry from the Murphyand Riley reagents, and K, Ca, Mg and Na byspectrophotometry in the IRD laboratory of Pointe-Noire. After a pedological description, soil was sampledfor each horizon down to a depth of 6 m in three pits inthe eucalypt stand and one pit in the savanna. Eachreplicate of sample was analysed separately. Elementswere determined by ICP in the CIRAD laboratory.
Errors in the estimate of the main fluxes of theinput-output budgets (Table 3) were calculated asfollows: (1) atmospheric depositions, 50% of measuredvalues, to take into account the difficulty of assessingdry depositions; (2) starter fertilisation, 5% of thecomposition of the fertiliser; (3) deep drainage, sumover one year of twice the standard error calculatedevery month; (4) harvest, confidence interval (p=0.95)of the values predicted by the nutrient content tables and(5) annual fire, twice the standard error between thereplicates. Errors in the estimate of the budgets werecalculated as the sum of the error of each flux,considering that the errors of determination of each fluxare independent.
Results and Discussion
Amounts of Nutrients in the Compartmentsof the EcosystemWe considered that the depth of soil involved in thenutrition of the stands was 6 m in the plantation and 2 min the savanna. The density of roots beyond these depthswas extremely low. Although the main characteristics ofthe soil were similar in both plantation and savanna, theamounts of P, K, Ca and Mg available are higher in the
soil below the eucalypt probably because of thedifference in depth of soil explored by roots (Table 1).The amounts of total N were high but isotopic studies inthis soil have shown the presence of stable and ancientorganic matter of forest origin. Mean residence time oforganic matter is low in the upper soil horizons andincreases with depth to about 8200 B.P. (Trouvé 1992).
The amount of biomass in plantation is about 11times that of savanna. The aerial part of the savannavegetation was entirely accumulated after fire andreached a maximum at the end of the rainy season about8 months after the fire. In the eucalypt plantation, theamounts of nutrients in the forest floor are largecompared with the accumulation in the stand,particularly N, Ca and Mg. In contrast they were verylow in the savanna floor due to the annual fires.
The Nutrient Use Efficiency (kg of dry matter / kgof nutrient accumulated in the biomass) is much higherin the eucalypt stand than in the savanna for N, P, K andMg. The very low accumulation of K, Ca and Mg in theeucalypt stand (between 47 and 71 kg ha-1) is probablydue to the very low availability of exchangeable cationsin the soil.
Nutrient FluxesOnly the nutrient fluxes in solution and in the litterfallare presented here.
The atmospheric inputs of N, P, K, Mg and S arevery low (< 5 kg ha-1yr-1). The high inputs of Na and Cl(Table 2) might be explained by the short distance fromthe sea (10 km). In Congo, the marked enrichment of Cain the rains indicates the presence of a large amount ofaerosols from local or African desert sources (Lacaux etal. 1992). A foliar uptake of N was observed in both theeucalypt and the savanna. The foliar leaching of P, K andMg was more pronounced in the savanna. A densenetwork of fine roots in the forest floor allowed quickuptake of nutrient in the eucalypt ecosystem. The highfluxes of N, P and Mg in the eucalypt litterfall indicate avery active biological cycle in this ecosystem. Incontrast, in the savanna nutrient fluxes in litterfall werevery low.
There was very little leaching of N, P, K, Ca andMg by deep seepage (< 1 kg ha-1 yr-1 except N below thesavanna). Higher seepage fluxes were measured for Naand Cl below the savanna.
StManagment-gs Final.pdf 1/31/01 8:29 PM Page 96 (Black plate)

J.P. Laclau, J. Ranger, J. de D. Nzila and J.P. Bouillet 97
Input-output BudgetsThe study of biogeochemical cycles is still in progressand the assessment of several fluxes will be improvedi.e. atmospheric deposits, weathering. Thus only themain trends should be considered at this stage (Table 3).
The savanna ecosystem has been known to occurin this area for about 3000 years (Schwartz 1992) and sothe input-output budgets should be balanced to explainthe sustainability of this savanna. The presence of aleguminous plant (Eriosema erici-rosenii R.E. Fries,Schewed) in the coastal savannas of Congo mightexplain the stability of the nitrogen cycle if a symbioticfixation of about 20 kg ha-1 yr-1 occurs. The total biomassof this legume was about 800 to 1000 kg ha-1 at the endof the rainy season. In a savanna dominated by Loudetia
simplex in Ivory Coast, the nitrogen fixation (mainlynon-symbiotic) was estimated at 12 kg ha-1 year-1 andallowed balancing of the budget (Abbadie et al. 1992).The Congolese savanna studied here has apparently noactual or potential non-symbiotic N fixing activity (LeMer and Roger 1999) but the high biomass of theleguminous species might account for an input ofnitrogen in the ecosystem sufficient to compensate forthe losses. The budgets of the other nutrients are nearlybalanced taking into account the estimated errors ofdetermination of the fluxes.
In the eucalypt plantation the outputs of P, K andMg are only slightly higher than the inputs and the Cabudget is positive. However the nitrogen budget deficit islarge (18 kg ha-1 yr-1) even though the total N available in
Table 1. Biomass and amounts of nutrients in the different compartments of the eucalypt plantation and the nativesavanna
Biomass Nutrients (kg ha-1)
t ha-1 N P K Ca Mg Na Cl S
Eucalypt plantationStand (6-yr-old) 95.6
Stem wood 6.5 115.6 16 34.2 15.4 11.5 32.3 37 7.5Stem bark 3.8 20.7 9.8 12.6 23.8 17.6 16.2 22 1.5Leaves 9.6 56.3 3.9 11.9 6.7 7.7 9.6 3.6 4.4Branches 23.0 21.5 5.0 6.3 6.5 5.1 7.3q 5.9q 1Underground parts(1) 138.5 33.7 3.1 6.4 9.6 5.5 - - -Total 11.4 248 38 71 62 47 > 65 > 69 > 14
Forest floor 81 4 6 33 18 12 - -Soil(2)
0 - 15 cm 775 65 19 38 12 1015 - 50 cm 1552 110 39 80 18 1250 - 200 cm 2695 690 91 397 60 43200 - 600 cm 8292 1826 305 997 180 125Total to 6 m depth 13300 2700 450 1510 270 190
Savanna ecosystemStand (8 months after fire)
Aboveground parts 4.2 22.1 3 7.6 4.1 7 1.5 4.3 2.2Underground parts(1) 8.4 72.7 4.1 8.3 1 3.4 4.9 - -Total 12.6 95 7 16 5 10 6 > 4 > 2
Savanna floor 0.3 3.6 0.2 0.3 1.3 1 0 0.3 0.2Soil(2)
0 - 15 cm 574 45 36 54 13 1615 - 50 cm 1159 96 98 101 24 4650 - 200 cm 3084 472 130 374 60 120Total to 2 m depth 4800 610 260 530 100 180
(1) Na, Cl and S not measured in underground parts.(2) N total, P available with Duchaufour and Bonneau methodology (1959) and exchangeable cations.
StManagment-gs Final.pdf 1/31/01 8:29 PM Page 97 (Black plate)

Nutrient Cycling in a Short Rotation Eucalyptus Plantation and an Adjacent Savanna in Congo98
Table 2. Main fluxes of nutrients in a eucalypt plantation and a native savanna (in italics)
Flux N-NH4+ N-NO3
- P-PO43- K+ Ca2+ Mg2+ Na+ Cl- S-SO4
2-
(mm) (kg ha-1 yr-1)
Atmospheric 1414 1.4 2.9 0.3 2.8 13.4 1.4 7.1 28.5 3.6
inputs (1.4) (2.9) (0.3) (2.8) (14.5) (1.4) (7.1) (32.6) (3.6)
Throughfall 1289 1.0 1.5 1.0 5.8 15.8 3.3 15.2 26.0 3.5
(1207) (1.5) (0.4) (3.5) (17.2) (11.5) (9.7) (6.2) (32.6) (3.6)
Stemflow 19 0.0 0.0 0.1 0.3 0.3 0.2 1.5 2.5 0.1
Litterfall(a) 38.6 3.0 3.3 18.6 17.8
(4.1) (0.2) (0.4) (1.5) (1.1)
Leaching beneath 1308 1.2 1.3 2.9 5.2 8.4 4.9 26.3 28.5 5.8
the forest floor (1207) (1.4) (0.3) (6 (13.2) (27.5) (8.7) (13.2) (28.3) (8.6)
Deep 4 m 336 1.3 0.1 0.05 0.4 0.5 0.3 1.4 7.4 2.3
drainage at (699) (1.5) (1.1) (0.04) (0.8) (0.6) (0.3) (8.6) (15) (2.6)
the depth of:
6 m 293 0.7 0.1 0.06 0.2 0.4 0.3 1.1 4.6 1.3
(a) N in litterfall refers to total N.
Table 3. Input-output budgets (without weathering) in the eucalypt plantation and native savanna (in italics) in Congo
Nutrients (kg ha-1 yr-1)
Input N P K Ca Mg
Atmospheric deposition 4.3 ± 2.1 0.3 ± 0.15 2.8 ± 1.4 13 ± 6.5 1.4 ± 0.7
(4.3 ± 2.1) (0.3 ± 0.15) (2.8 ± 1.4) (14 ± 7) (1.4 ± 0.7)
Fertilisation 5.1 ± 0.3 2,2 ± 0.1 6.9 ± 0.3 0 0
(0) (0) (0) (0) (0)
Weathering - - ? ? ?
Symbiotic fixation (20)(2)
Output
Deep drainage 0.8 ± 1.0 0.06 ± 0.05 0.2 ± 0.2 0.4 ± 0.3 0.3 ± 0.3
(2.6 ± 2.4) (0.04 ± 0.07) (0.8 ± 1.4) (0.6 ± 0.6) (0.3 ± 0.3)
Harvest (1) 27 ± 9 4.1 ± 2.8 9.9 ± 7 5.0 ± 2.8 3.2 ± 1.6
Annual fire (22 ± 14) (2.0 ± 1.8) (2.4 ± 3.7) (3.0 ± 5.9) (2.7 ± 2.4)
Budgets -18.4 ± 12.4 - 1.7 ± 3.1 -0.4 ± 8.9 7.6 ± 9.6 -2.1 ± 2.6
(0 ?) -1.7± 2.0 -0.4 ± 6.5 10.4 ± 13.5 -1.6 ± 3.4
(1) Eucalypt stands are harvested every 7 years in the Congo. Pulpwood de-barked and firewood harvested.(2) Estimated to balance the N budget in the savanna.
StManagment-gs Final.pdf 1/31/01 8:29 PM Page 98 (Black plate)

J.P. Laclau, J. Ranger, J. de D. Nzila and J.P. Bouillet 99
the 50 cm of surface soil is 2300 kg ha-1. In the 15 cm ofsurface soil where most of the mineralisation occurs thepool of total N is very low (< 800 kg ha-1). The removalof Eriosema erici-rosenii in the eucalypt stands byweeding reduces N input, which is of concern for thesustainability of the nitrogen nutrition in the plantations.
ConclusionThere is very little leaching loss of nutrients undereucalypt plantations and savannas. This may be theresult of a high uptake by the stands of nutrient inputs.However the nutrient budgets showed a potential deficitof nitrogen in the eucalypt ecosystem. These resultsindicate that regular fertilisation is necessary to achievea high yield and for the sustainability of theseplantations.
The large quantity of nutrients in the forest floorand in litterfall highlights the importance of themanagement of organic matter for the sustainability ofhigh production eucalypt plantations.
ReferencesAbbadie, L., Mariotti, A. and Menaut, J.C. 1992.
Independence of savanna grasses from soil organicmatter for their nitrogen supply. Ecology 73: 608-613.
Bouillet, J.P., Nzila, J.D., Ranger, J.P., Laclau, J.P. andNizinski, G. 1999. Eucalyptus plantations in theEquatorial Zone, on the coastal plains of the Congo.In: Nambiar, E.K.S., Cossalter, C. and Tiarks, A.(eds.) Site management and productivity in tropicalplantation forests: workshop proceedings 16-20February 1998, Pietermaritzburg, South Africa, 13-21. CIFOR, Bogor.
Delwaulle, J.C. 1989. Plantations clonales au Congo.Point des recherches sur le choix des clones dix ansaprès les premières plantations. In: Gibson, G.L.,Griffin, A.R. and Matheson, A.C. (eds.) Breedingtropical trees. Proceedings IUFRO Conference,Pattaya, Thailand, November 1988. Oxford ForestryInstitute, Oxford.
Duchaufour, P. and Bonneau, M. 1959. Une nouvelleméthode de dosage du phosphore assimilable dansles sols forestiers. Bulletin Association Françaised’Etude des Sols 4: 193-198.
Lacaux, J.P., Delmas, R., Kouadio, G., Cros, B. andAndreae, M.O. 1992. Precipitation chemistry in theMayombé forest of equatorial Africa. Journal ofGeophysical Research 97: 6195-6206.
Laclau, J.P., Bouillet, J.P. and Ranger, J. 2000.Dynamics of biomass and nutrient accumulation in aclonal plantation of Eucalyptus in Congo. ForestEcology and Management 128: 181-196.
Le Mer, J. and Roger, P. 1999. N2 fixation assessment insoil and litter samples from Congolese savanna andeucalypt plantations under various managements,IRD/UR2PI/CIFOR Agreement Report, I ScientificPart. 5p.
Schwartz, D. 1992. Assèchement climatique vers 3000B.P. et expansion Bantu en Afrique centraleatlantique: quelques réflexions. Bulletin SociétéGéologique Française 163: 353-361.
Trouvé, C. 1992. Apport de la géochimie isotopique(*13C) à l’étude du renouvellement des matièresorganiques et des sucres neutres dans les solstropicaux soumis à des changements d’écosystèmes.Cas des aménagements forestiers sur les savanes dePointe-Noire au Congo. PhD thesis. Universitéd’Orléans, France. 112p.
StManagment-gs Final.pdf 1/31/01 8:29 PM Page 99 (Black plate)

IntroductionIn the United States, the majority of publicly ownedforest land is managed by the Forest Service, an Agencywithin the U.S. Department of Agriculture. The laws andregulations that guide the Forest Service requires that nomanagement activity, including wood production, willpermanently impair the productivity of the land. Inpartnership with the National Forest Management, theresearch arm of the Forest Service developed a nationalresearch plan to install studies within major forest typesand physiographic regions (Powers et al. 1990). Theproject has a set of broad objectives. In particular it aimsat understanding how management-induced changes insoil porosity and organic matter affect the long-term siteproductivity. This parallels the core objectives ofCIFOR’s network project (Nambiar et al. 1999).
In the southeastern region of the United States,loblolly pine (Pinus taeda L.) growing on coastal plainsoils represents a productive forest type and makes amajor economic contribution to the region. However,many of the soils are infertile with low water-holdingcapacities and low levels of organic matter. In addition,heavy equipment used for logging and site preparationmay compact the soils and leave logging residueunevenly distributed or removed from the site.Following the experimental protocols of the nationalstudy, study sites were located on National Forests inLouisiana and Mississippi to measure the impacts oforganic matter removal and soil compaction on theproductivity of the following rotation. Some of theresults are reported here.
MethodsThe studies are located on soils with two levels ofnatural fertility. The study in Louisiana is located onsoils relatively high in bases, while in Mississippi thesoils are lower in bases and nutrient storage capacity.The Louisiana site is located on the Kisatchie NationalForest (31040'N, 92030'W) where mean annual rainfallis 1450 mm and average daily temperature rangesfrom 150C in January to 340C in July. The harvestedstands were 50-60-year-old loblolly pine plantationsthat had been thinned several times. The understoreyconsisted of small hardwood trees and bushes eventhough the stands had been prescribed burnt on aregular basis. The Mississippi site is located on the DeSoto National forest (31030'N, 89000'W) where meanannual rainfall is 1430 mm and average dailytemperature ranges from 80C in January to 270C inJuly. The stands harvested for the study were 55-year-old slash pine (Pinus elliottii Engelm.) plantationswith a grass understorey. The Mississippi stands hadbeen thinned and prescribed burned.
The study is replicated at three locations in eachstate. At each location, the treatments consist of threelevels of organic matter removal which are:BL0 All aboveground residue, understorey and litter
removed.
SHORT COMMUNICATION 2
Loblolly Pine (Pinus taeda)Plantations in the Semitropical
Southeastern United States
A. Tiarks1, M. Elliott-Smith1 and R. Stagg1
1 Southern Research Station, USDA-Forest Service, 2500 ShreveportHighway, Pineville, LA 71360
13
StManagment-gs Final.pdf 1/31/01 8:29 PM Page 101 (Black plate)

Loblolly Pine (Pinus taeda) Plantations in the Semitropical Southeastern United States102
BL1 All aboveground parts of pines removed duringharvest.
BL2 Only bole removed, with all logging slashretained.
Each 0.4 ha plot is split into two equal parts: weedswere allowed to develop on one half (H0) and herbicideapplied to the other (H1). A compaction treatment wasapplied at each site with levels of zero, moderate andsevere. Only the results from the uncompacted plots arereported here to conform to the treatments used in the“Site management and productivity in tropical forestplantations’ study (Nambiar et al. 1999).
In both states, the plots were planted withgenetically improved loblolly pine seedlings at aspacing of 2.5 x 2.5 m, so in Mississippi slash pine wasreplaced with loblolly pine. Total tree height anddiameter at breast height (dbh) were measured at age 5years. Total volume (under bark) was calculated usingthe equation developed by Schmitt and Bower (1970).Analysis of variance was used to test for significantdifferences and Duncan’s multiple-range test was usedto separate means.
Soil samples were taken from the 0-10 cm depthfrom 15 randomly located spots in each plot beforeharvesting. The samples were bulked by plot and air-dried for chemical analysis. Chemical properties of soilsare shown in Table 1 as means of the three locationswithin each of the two states. The soil series differs bylocation in Louisiana, so the variability in properties is
higher compared to Mississippi where the same soilseries is at all three locations.
ResultsIn Louisiana, the retention of logging residue did nothave a significant effect on the growth of the loblollypine by age 5 years. Weed control did have astatistically significant effect (P<0.001) increasing theheight from 3.90 m on the untreated plots to 4.73 m onthe herbicide-treated plots. Weed control increased thedbh from 4.9 to 7.0 cm and total volume was increasedfrom 7.4 to 16.0 m3 ha-1.
In Mississippi, data from plots not compactedduring harvest are shown in Table 2. Retaining organicmatter on site increased growth of the newly establishedplantation. Without weed control, the trees on the BL1
plots were 0.16 m taller than trees on the BL0 plots(Table 2). Leaving all of the aboveground organic matteron the plots (BL2) increased the height by an additional0.39 m. The effect of leaving organic matter on the sitewas even greater when weeds were controlled asindicated by a significant organic matter retention byherbicide interaction. By age 5 years on weeded plots,the trees on BL2 plots were 0.45 m taller than on the BL1
plots and 0.97 m taller compared to the BL0 treatment. Asimilar increase in dbh occurred as the amount oforganic matter retained increased. The combinedincrease in height and dbh resulted in more thandoubling of the volume from 4.4 m3 ha-1 for the BL0H1
plots to 9.3 m3 ha-1 on the BL2H1 plots.
Table 1. Soil chemical properties of the 0-10 cm layer of the study sites before harvest
Parameter Location and species
Louisiana MississippiLoblolly pine Slash pine
pH 4.7 (0.3)(3) 5.1 (0.2) OC (g kg-1)(1) 12.3 (2.7) 12.8 (1.3)P Bray2 (mg kg-1) 3.1 (1.2) 2.0 (0.7)K exchangeable (c mol kg-1)(2) 0.12 (0.07) 0.05 (0.02)Ca exchangeable (c mol kg-1) 2.46 (1.64) 0.62 (0.29)Mg exchangeable (c mol kg-1) 1.07 (0.69) 0.28 (0.13)Na exchangeable (c mol kg-1) 0.07 (0.03) 0.06 (0.02)CEC (c mol kg-1) 9.86 (6.23) 2.88 (0.64)
(1) OC determined by combustion; (2) Bases extracted with 1M BaCl2; (3) Standard deviations in parentheses.
StManagment-gs Final.pdf 1/31/01 8:29 PM Page 102 (Black plate)

A. Tiarks, M. Elliott-Smith and R. Stagg 103
Discussion and ConclusionsBecause of the importance of the nutrients in explainingthe results, soils are being sampled at greater depths asthe plantation develops. Samples have been collected toa depth of 30 cm at age 5 years and are being collectedto a depth of 180 cm as the plantations reach 10 yearsold. The plot size was selected to be large enough so thatreliable measurements of pine growth and changes insoil properties can be made throughout the planned 60+year rotation on these public forests. While these resultsshould be used to adjust management practices, theguidelines should be considered tentative until resultsfrom later stages in the rotation are obtained
On soils with higher levels of bases and othernutrients in Louisiana, the pines did not respond to theslash retention treatments. When weeds were controlled,the volume growth increased dramatically. On sites withlower levels of P and bases, pine growth was increasedas more of the organic matter was retained on site. Theincrease was greater when weeds were controlled inaddition to organic matter retention. However, with
weed control, the pine volume on the Louisiana site was72% greater than the best treatment in Mississippi. Thegreater growth occurred in Louisiana even though moreof the precipitation falls during the growing season inMississippi. The amount of N available to the pines hasnot been measured, but was probably higher ontreatments where organic matter was retained,contributing to the growth differences. Both low andhigh nutrient soils can be found in the two states becausethe differences are due to local geology and other soilforming processes. The soil characteristics whichdistinguish the different responses of these two sites areavailable in soil surveys. These surveys, as well as localknowledge of the soils, should be used in tailoringmanagement practices to the site.
ReferencesNambiar, E.K.S., Cossalter, C. and Tiarks, A. 1999. Site
management and productivity in tropical plantationforests: workshop proceedings, 16-20 February1998, Pietermaritzburg, South Africa. CIFOR,Bogor.
Powers, R.F., Alban, D.H., Miller, R.E., Tiarks, A.E.,Wells, C.G., Avers, P.E., Cline, R.G., Loftus, N.S., Jr.and Fitzgerald, R.O. 1990. Sustaining productivityin North American forests: problems and prospects.In: Gessel, S. P., Lacate, D.S., Weetman, G.F. andPowers, R.F. (eds.) Proceedings of the seventh NorthAmerican Forest Soils Conference, July 24-28 1988,Vancouver, British Columbia, 49-79. University ofBritish Columbia, Vancouver, Canada.
Schmitt, D. and Bower, D. 1970. Volume tables foryoung loblolly, slash, and longleaf pines inplantations in south Mississippi. Department ofAgriculture, Forest Service Research Note SO-102,U.S. Southern Forest Experiment Station, NewOrleans, LA. 6p.
Table 2. Effect of logging residue retention andherbicide treatments on the growth of loblolly pine at age5 years in Mississippi
Treatment Height dbh Volume(m) (cm) (m3 ha-1)
BL0H0 2.80a 3.0a 3.5a
BL1H0 2.96ab 3.2a 3.9a
BL2H0 3.35ab 3.8ab 4.9a
BL0H1 3.00ab 3.6a 4.4a
BL1H1 3.52ab 4.4ab 6.6ab
BL2H1 3.97b 5.4b 9.3b
Values in a column followed by the same letter are not significantlydifferent (alpha=0.05).
StManagment-gs Final.pdf 1/31/01 8:29 PM Page 103 (Black plate)

IntroductionAn important feature of this network project is theopportunity for all the participants to meet for sharingresults and ideas at reasonable intervals at one of theproject locations. We met at Kuala Lumpur (Malaysia) forthe first workshop, which discussed and agreed upon thecore objectives, formalised the project plan and thestrategy for implementation. At the second meeting held inPietermaritzburg (South Africa), the workshop reported onlocations of sites, progress in installation, methods andearly results from some sites. This third workshop hostedby the Kerala Forest Research Institute (India) was the firstsince the experiments at most of the sites have beeninstalled. Thus by December 1999, experiments have beenin progress for more than four years in southwesternAustralia and Brazil and for few months at Subanjeriji,Sumatra (Indonesia). A second site in Sumatra is in theplanning stage and completion of the field experiment isexpected in late 2000. This span of time betweenexperiment installations is an added variable, which willpose some challenges when we attempt to synthesise andintegrate results. However, it also presents an immediateopportunity for sharing experience.
In this summary we have brought together the mainprogress achieved which provides a framework forreviewing the scope of the study. One of our core goals isto ensure that each site is designed as a complete, stand-alone study. The results from each can be independentlyinterpreted, reported in publications and applied toimprove forest management.
The information presented to this workshop can begrouped into following categories:• the amounts of biomass and nutrients accumulated by
the stand in the previous rotation; • the amounts of slash and litter removed or retained
after the various treatments had been applied;
• the early growth of the experimental (replanted)stands;
• preliminary results from process level studies, whichwill be useful in understanding the results; and
• five contributions of current research complementaryto the project, two of which are included in thisproceedings.
In addition, the comprehensive field notes provided byKerala Forest Research Institute gave detailed accounts ofthe experiment and results on the four sites in Kerala.
Productivity of the Previous StandThe information on rates of accumulation of biomass inTable 1 is based on the results presented at the second andthird workshops. Caution is required in comparing the rateof accumulation by short rotation stands (7-9 years) withthose in long rotation, which, as in the case of Pinuselliottii in Queensland, was thinned. Furthermore theharvested eucalypt sites in Kerala and South Africa are 2 -3 rotation coppice crops. Continued coppicing is known tolead to decreased productivity. The rate of accumulation ofabove ground biomass by the trees was 34.4 t ha-1 yr-1 onthe highest producing site, Manjimup, southwesternAustralia. This was about seven times the rate ofaccumulation on the lowest producing site at Punalla,Kerala. The wide range of rates of biomass accumulationat these plantations sites, even within short rotation cropsof eucalypts, shows that the partners have implemented theproject on a broad range of sites. It is important to note thefour-fold difference in productivity between four sites inKerala because large differences in productivity between
Summary of the Third Workshop in Kerala, India
A.Tiarks1 and E.K.S. Nambiar2
1 Southern Research Station, USDA-Forest Service, 2500 ShreveportHighway, Pineville, LA 71360, USA2 CSIRO Forestry and Forestry Products, PO Box E4008, Kingston,Canberra, ACT 2604, Australia
14
StManagment-gs Final.pdf 1/31/01 8:29 PM Page 105 (Black plate)

Summary of the Third Workshop in Kerala, India106
Table 1. Location, species, aboveground standing biomass of the previous rotation stand, rate of accumulation of thatbiomass and response to the residue treatments by the new plantation
Country - site Species Previous rotation stand Experimental stand
Age Tree Tree Age(yr) biomass(1) biomass (months)
(t ha-1) (t ha-1 yr-1)
AustraliaQueensland Pinus elliottii 29 232.0 7.9 39(2) Trend for increased
growth with increasing residue
Southwestern AustraliaManjimup Eucalyptus globulus 8 275.0 34.4 48 Early growth differences
disappeared
Busselton Eucalyptus globulus 8 98.0 12.3 48 BL3 largest, but not statistically significant
BrazilItatinga Eucalyptus grandis 7 140.3 20.0 39 BL0 smallest
P.R. ChinaFujian Cunninghamia 29 197.4 6.8 24 BL3 largest; growth rate
lanceolata of BL0 slowing with time
Guangdong Eucalyptus 6 44.0 6.3 31 BL1 shortest, BL0
urophylla received some weedingCongoPointe-Noire Eucalyptus hybrids 8 117.0 14.7 18 Trend for increasing
growth with increasing residue
India, KeralaKayampoovam Eucalyptus 7 63.0 9.1 12 No effect
tereticornis
Punalla Eucalyptus 7 33.7 4.9 12 No effecttereticornis
Vattavada Eucalyptus grandis 7 141.9 20.1 12 No effect
Surianelli Eucalyptus grandis 7 43.5 6.2 12 No effect
IndonesiaSumatra Acacia mangium 9 146.4 NA NA ø
South AfricaNatal Eucalyptus grandis 7 140.3 20.0 8 Trend for increasing
growth with increasing residue
(1) Standing biomass only.(2) Queensland: the previous stand was Pinus elliottii thinned at age 15.6 years; the second crop (this experiment) is a hybrid P. elliottii x P.caribaea var. hondurensis.
response
StManagment-gs Final.pdf 1/31/01 8:29 PM Page 106 (Black plate)

A.Tiarks and E.K.S. Nambiar 107
sites within a region is common in forestry. The largevariation in biomass has also resulted in correspondingdifferences in the amount of slash and contrasting residuetreatments within and between sites. Of the four siteswhere Eucalyptus grandis was harvested, three had nearlyidentical rates of biomass accumulations in the trees of 20t ha-1 yr-1. Since these sites were located in South Africa,Brazil and India, the uniform rate of productivity mayindicate the strong influence of species on productionwhen productivity is not severely curtailed by low soilfertility, as appears to be the case at Surianelli in Keralawhere the rate of accumulation by the same species wasless than 30% of other sites. Because several managementtechniques were applied as options, this possibility can betested as the newly established stands get closer to rotationage. The available data already provides valuableinformation on the extent of nutrient transport, whichwould occur from sites in relation to harvest intensity (e.g.;whole tree vs stem only) and their impact on soil nutrientstore. Thus Simpson et al. note (this volume) that logharvest removed 171% of the exchangeable K in soil to adepth of 120 cm. Several other papers provide estimates ofpotential nutrient depletion in relation to inter-rotationmanagement practices. Overall, the range of sites, harvestimpacts and soils represented in the network would allowthe management options developed by the project to beapplicable to many forest plantations areas in the tropics.At all sites, the new plantations have been established withthe same species as in the previous rotation except inQueensland where P. elliottii has been replaced by P.elliottii x P. caribaea var. hondurensis hybrid. Thus theproject now includes six species and two hybrids.
Effects of Residue Treatments onNew PlantationsThe core treatments applied represent the levels ofbiomass retained on the site, ranging from removal of allaboveground biomass to a ‘double slash’ in which loggingslash from one plot is applied to another. The net amountremoved or retained varied between sites depending on theproductivity of the previous rotation. These treatments aredesigned to achieve maximum contrast in the levels ofstress that can be achieved by manipulation of the loggingresidue and litter.
A summary of the early response of the trees to theresidue treatments along with the age at the latestmeasurement is shown in Table 1. Of the 12 sites for whichgrowth results are available, five showed no response to
amounts of biomass retained. On the seven sites showingan effect of the treatments, the trend was always forincreased tree growth as more residues were retained. Thetrial in South Africa showed the lowest survival in the BL3
(double slash) plots, probably because the insulating effectof the residue allowed the formation of frost pockets.However, the increased growth rates of the surviving treesmade up for the differences in survival so the biomassindex was the larger than on the BL0 and BL2 treated plots.
At the Guangdong, China site, BL0 plots wereweeded manually and the weed biomass removed fromplots in the early stages of tree establishment. Because ofthis at 8 months after planting, the trees are larger on thistreatment than on plots where the logging residue was left(BL2). However, by 31 months after planting, the trees onthese two treatments were the same size. At the Fujian sitein China, the slash treatment had a significant effect onsurvival of the Chinese fir, but this result should be seen inthe background of generally high mortality encountered(including the block effect) at that site.
Process-based InformationThe site-specific responses to the core treatments alsounderscore the importance of the process level studiesbeing undertaken at most sites in developing managementoptions for similar locations. On most of the sites intensivemeasurements are being made on processes that arethought to affect the productivity of the site. At all sitesthere are important additional (optional) treatmentsapplied. These will be vital in explaining the results notonly at that particular site but also for explaining the factorsdetermining productivity across sites. Additionalinformation being obtained includes decomposition ofresidue, N mineralisation, change in organic matter,changes in available nutrient pools and effect of sitemanagement on water relations. On some sites, the networkproject is a part of large integrated project includingdetailed studies on carbon and nutrient cycling (e.g.,Congo, Queensland, southwestern Australia). On severalsites, the decomposition rates of the logging residue arebeing measured and found to be very rapid. For example,at the Congo site, 38 to 65% of the logging residuedecomposed in 6 months. The leaves and twigs, whichcontain the highest concentration of nutrients, were mostlydecomposed with only the larger branches remaining. InKerala, the decomposition rate followed the same pattern,with the half-life of 2 cm diameter twigs twice as long thehalf-life for 0.5 cm twigs. Perhaps even more important in
StManagment-gs Final.pdf 1/31/01 8:29 PM Page 107 (Black plate)

Summary of the Third Workshop in Kerala, India108
terms of network linkages, the E. tereticornis residuedecayed much faster than litter from E. grandis.
Retaining the harvest residue on site can alsoaffect the amount of organic C in the soil. At theGuangdong site in China, increasing the amount ofresidue left on the plots resulted in higher amount of soilcarbon from 25.3 to 31.3 t ha-1 in 2 years after planting.However, harvesting always reduced the soil carbonlevels compared to preharvest. In another phase oforganic residue decomposition, N mineralisation and theavailability of other nutrients is being measured atseveral sites. On the southwestern Australia sites, thepresence of eucalypt residue is thought to slow theformation of nitrates, which can be rapidly leached. Theinhibition of nitrate formation results in the retention ofmore N on the site until the new crop can utilise it.Studies in Brazil are providing detailed information onthe dynamics of N mineralisation over a long periodunder an intensive production system.
The harvest residues also form a mulch, slowingevaporation and retaining more water for the trees. Onthe South African site, the water content was higher inthe double slash treated plots (BL3) compared to thesingle slash plots (BL2). However there was not acorresponding increase in tree growth in the first 8months on the double slash plots. This emphasises thepoint that process level measurements may need to becontinued though much of the rotation. In someinstances water x nutrient interaction may be the keyfactor determining productivity. In general there hasbeen little information provided on foliar nutrientstatus of young experimental trees in relation to siteand /or treatments.
Network EffectivenessAs the information from all the sites become available,gaps and inconsistencies in measurements can beidentified, rectified or explained. The effects of the residuetreatments at each site will become clearer as the standsapproach rotation age. The linkages within the networkwill allow a better understanding of the interactionbetween site and residue treatments, enhancing the utilityof the results. Results from both the core and optionaltreatments will be needed to develop management optionsto maintain or increase productivity. The site-specific
responses to the core treatments underscore theimportance of the process level studies being undertakenin developing management options for similar locations
While the same intensive process-based studies arenot being made at all sites, these studies increase theunderstanding of the tropical plantation ecosystem ingeneral. More importantly, the process level studies thatare ongoing at most of the sites will be the foundation fordevelopment of science-based management options tomaintain and improve the productivity of tropical forestplantations. As some of the sites are located in remoteareas that have little information about the soils, climateand understorey vegetation, a secondary benefit will begreater knowledge about previously neglectedecosystems. Judicious use of this knowledge can be usedto prevent management strategies that will prevent futuredegradation of the soils. Rather, management alternativeswill be developed to correct declines in productivitycaused by past management. While the project is now fullyfunctional, additional sites may be desirable to expand thenetwork to other important ecosystems.
Because of the professionalism and high scientificcalibre of the partners, the Project on Site Managementand Productivity in Tropical Forest Plantations isoperating successfully. At this third workshop, theattendees exchanged ideas on types of measurementsthat should be used and the basis for selecting ameasurement, as well as the concepts that are needed tointerpret the results, develop meaningful managementoptions and transfer the information to users. Theseinteractions showed that partners have establishedstrong linkages and shared commitments. As previouslynoted, one of our core goals is to ensure that each site isdesigned as a complete, stand-alone study, so the resultscan be interpreted and applied to improve local forestmanagement. It is clear that this objective is beingachieved and in some cases partners have alreadyformulated management recommendations. This augerswell for all of us because transferring the scientificinformation to managers and assisting them to apply theresults is a rewarding challenge.
AcknowledgementsWe thank Christian Cossalter, Jacques Ranger and JohnTurnbull for comments.
StManagment-gs Final.pdf 1/31/01 8:29 PM Page 108 (Black plate)