sistema pjsfc investor presentation · investor presentation moscow, 2017. 2 disclaimer certain...
TRANSCRIPT
Sistema PJSFC Investor PresentationMoscow, 2017

2
DISCLAIMER
Certain statements in this presentation may contain assumptions or forecasts in respect to forthcoming eventswithin PJSFC Sistema. The words “expect”, “estimate”, “intend”, “will”, “could” and similar expressions identifyforward-looking statements. We wish to caution you that these statements are only predictions and that actualevents or results may differ materially. We do not intend to update these statements to reflect events andcircumstances occurring after the above-mentioned date or to reflect the occurrence of unanticipated events.Many factors could cause Sistema’s actual results to differ materially from those contained in our projections orforward-looking statements, including, among others, deteriorating economic and credit conditions, ourcompetitive environment, risks associated with operating in Russia, rapid technological and market change in ourindustries, as well as many other risks specifically related to Sistema and its operations.

3
64.2%14.1%
19.0%
2.7%Mr Vladimir Evtushenkov
NSD (MOEX)
GDRs (listed on LSE)
Other
• Largest telecom operator in Russia and Eastern Europe
• Leading pulp and paper holding
• Top children's retail chain in Russia and CIS
• Diversified agricultural holding
• Real estate development, rental assets
• Russia’s leading private healthcare network
• High-tech holding
SISTEMA: EXPOSURE TO A UNIQUE ASSET MIX IN THE GROWING RUSSIAN MARKET
WHO WE ARE
WHAT WE DO
• Largest public investment holding in Russia
• Unique mix of assets across various attractive sectors of Russian economy
• Over 15 sectors of investments and expertise
• Partner of choice for global investors into Russia
• Active management of portfolio via value accretive acquisitions and divestments
• Creating value by developing assets into market leaders with strong cash flow generation and credit quality
• Monetising investments through sales to strategic acquirers and successful IPOs
9M2016HIGHLIGHTS $18bln $7.8bln $2.1bln
Assets Revenue OIBDA*
* Adjusted operating income before depreciation and amortisation**As of end of 2015
Key assets
Shareholding structure**
4
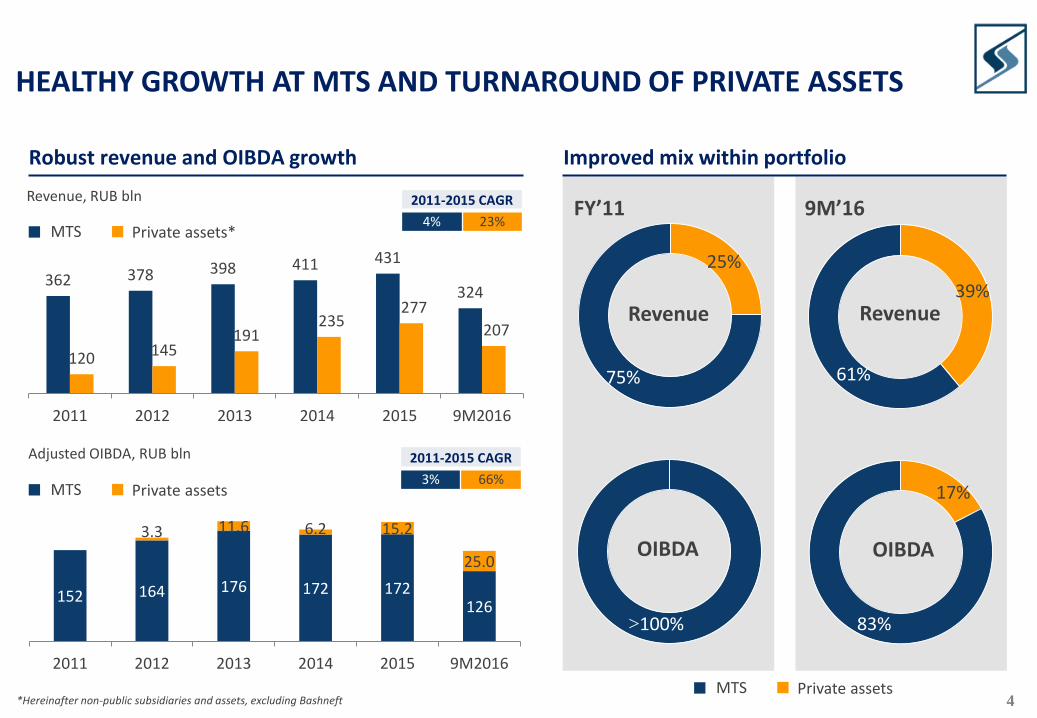
152 164 176 172 172126
3.3 11.6 6.2 15.2
25.0
2011 2012 2013 2014 2015 9M2016
17%
83%
362 378 398 411 431
324
120 145191
235277
207
2011 2012 2013 2014 2015 9M2016
HEALTHY GROWTH AT MTS AND TURNAROUND OF PRIVATE ASSETS
25%
75%
39%
61%
Robust revenue and OIBDA growth Improved mix within portfolio
FY’11 9M’16
Revenue Revenue
OIBDA OIBDA
Revenue, RUB bln
Adjusted OIBDA, RUB bln
MTS Private assets*
MTS Private assets
MTS Private assets
2011-2015 CAGR
4% 23%
2011-2015 CAGR
3% 66%
>100%
*Hereinafter non-public subsidiaries and assets, excluding Bashneft

5
14.9
19.1
24.0 23.6 23.0
1.2
7.15.4
8.4
>12
2012 2013 2014 2015 2016
MTS Private assets
INCREASING CASH FLOW FROM PRIVATE ASSETS AND STABLE DIVIDENDS FROM MTS
Increased profitability at private assets
Stronger dividends and cash returns to Sistema
OIBDA margin
RUB bln
• Sustainable improvement in profitability of private assets with a record OIBDA margin achieved for 9M 2016
• Over 10x growth in dividends and cash returns from private assets over last 5 years
• Share of private assets in total cash returns from subsidiaries to reach 34% for 2016 vs. 8% in 2012
• Stable dividend flow from MTS supports Sistema’s investment resources and liquidity
*
* Management estimates
-2.2%2.3%
6.1%2.6%
5.5%
12.0%
2011 2012 2013 2014 2015 9M2016
6
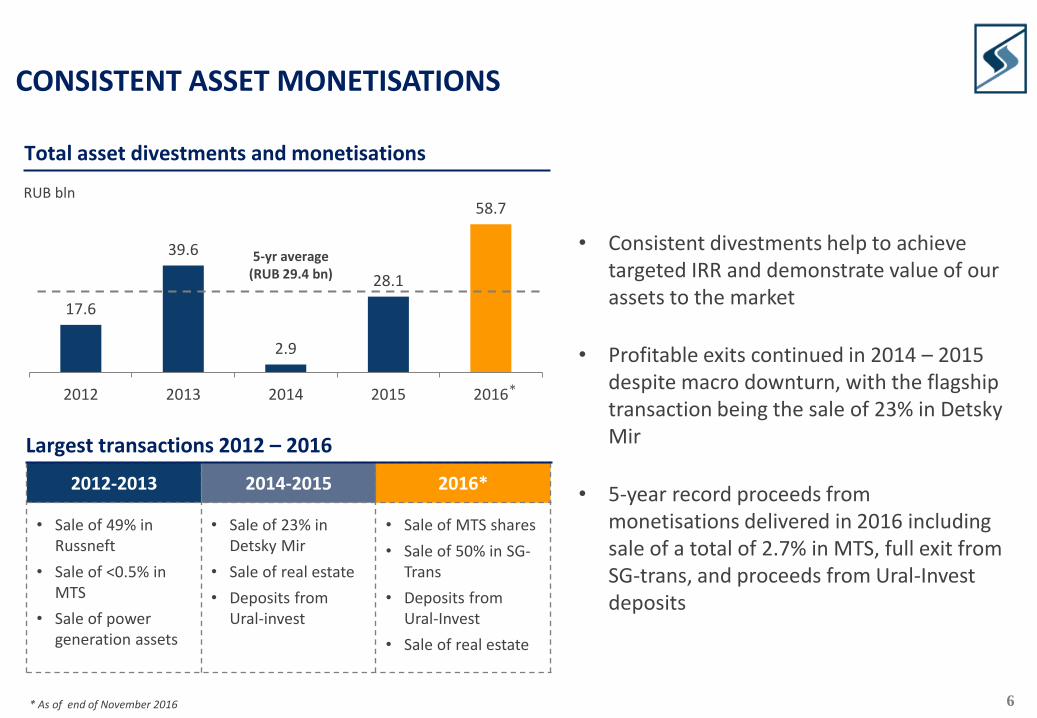
17.6
39.6
2.9
28.1
58.7
2012 2013 2014 2015 2016
CONSISTENT ASSET MONETISATIONS
Total asset divestments and monetisations
RUB bln
2012-2013 2014-2015 2016*
• Sale of 49% in Russneft
• Sale of <0.5% in MTS
• Sale of power generation assets
• Sale of 23% in Detsky Mir
• Sale of real estate
• Deposits from Ural-invest
• Sale of MTS shares
• Sale of 50% in SG-Trans
• Deposits from Ural-Invest
• Sale of real estate
• Consistent divestments help to achieve targeted IRR and demonstrate value of our assets to the market
• Profitable exits continued in 2014 – 2015 despite macro downturn, with the flagship transaction being the sale of 23% in DetskyMir
• 5-year record proceeds from monetisations delivered in 2016 including sale of a total of 2.7% in MTS, full exit from SG-trans, and proceeds from Ural-Invest deposits
5-yr average (RUB 29.4 bn)
*
* As of end of November 2016
Largest transactions 2012 – 2016

7
11.5
11.3
2.4
11.3
9.5
8.9
7.6
14.9
25.7
17.9
48.0
36.3
15.2
10.6
RTI
Real estate
Agriculturalassets
SegezhaGroup
Detsky Mir
BPGC
Medsi
Initial valuation** Valuation in 2016
GROWTH IN THE SELL-SIDE VALUATION OF KEY PRIVATE ASSETS
Analysts’ valuations, consensus*
RUB bln
• Consensus revaluations mainly driven by assets’ performance and improved portfolio’s transparency
• Additional investments in agriculture, real estate and pulp and paper (Segezha) contributed to higher valuations
• Recent asset divestments and monetisations (Detsky Mir, SG-trans) done with a premium to sell-side consensus
* Consensus is based on brokers that updated their valuations during a given year (2016: BCS, Citi, CS, DB, Gazprombank, JPM, MS, Otkritie, RenCap, VTB Capital) ** Initial valuation is dated 2012 for RTI, Detsky Mir, BPGC and Medsi, 2014 for Segezha (represented by cost of acquisition), and 2015 for agricultural assets and real estate
7%
127%
646%
106%
40%
14%
9%
CAGR
8
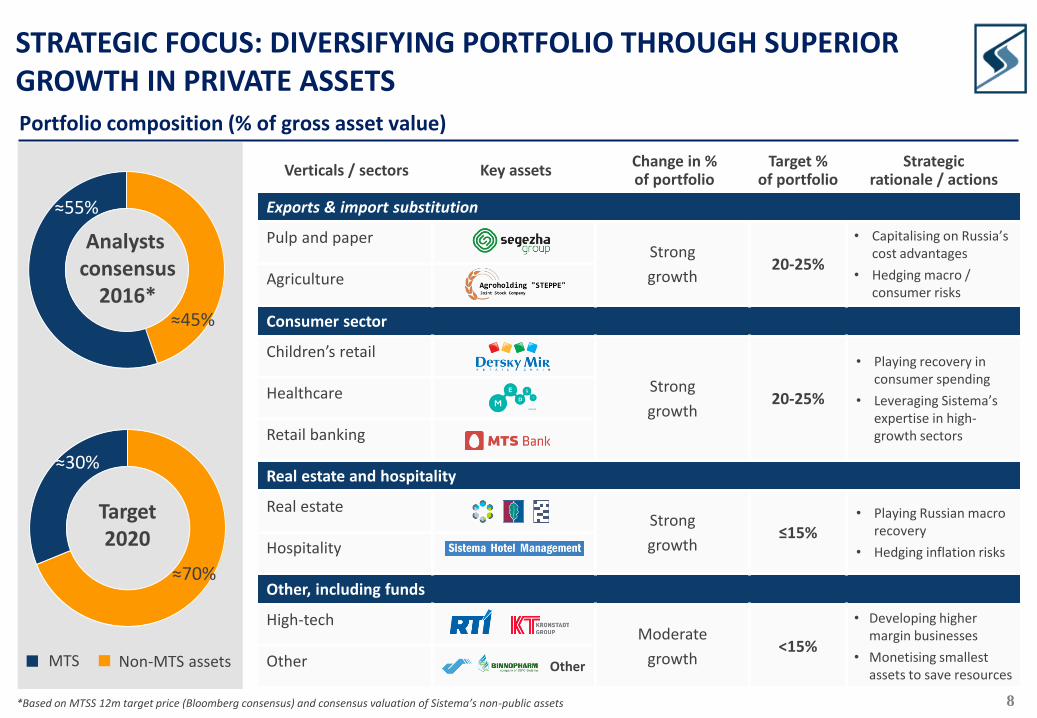
Verticals / sectors Key assetsChange in %of portfolio
Target %of portfolio
Strategic rationale / actions
Exports & import substitution
Pulp and paperStrong
growth20-25%
• Capitalising on Russia’s cost advantages
• Hedging macro /consumer risks
Agriculture
Consumer sector
Children’s retail
Strong
growth20-25%
• Playing recovery in consumer spending
• Leveraging Sistema’s expertise in high-growth sectors
Healthcare
Retail banking
Real estate and hospitality
Real estateStrong
growth≤15%
• Playing Russian macro recovery
• Hedging inflation risksHospitality
Other, including funds
High-techModerate
growth<15%
• Developing higher margin businesses
• Monetising smallest assets to save resources
Other
≈70%
≈30%
≈45%
≈55%
STRATEGIC FOCUS: DIVERSIFYING PORTFOLIO THROUGH SUPERIOR GROWTH IN PRIVATE ASSETS
Analysts consensus
2016*
Target2020
MTS Non-MTS assets
Portfolio composition (% of gross asset value)
Other
*Based on MTSS 12m target price (Bloomberg consensus) and consensus valuation of Sistema’s non-public assets
9
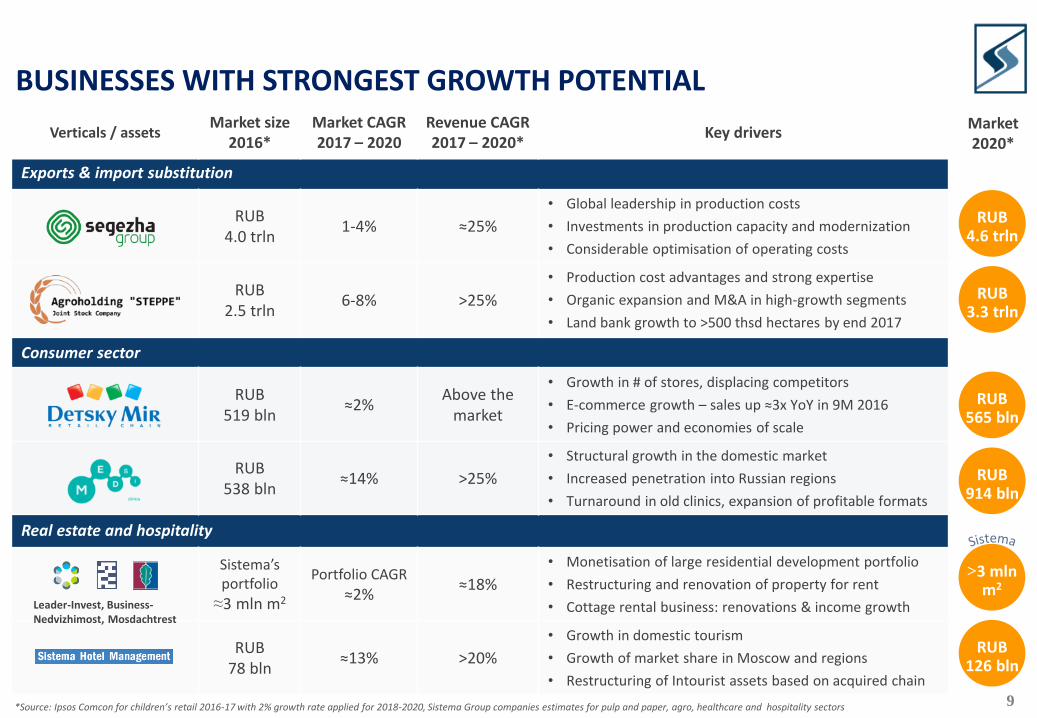
BUSINESSES WITH STRONGEST GROWTH POTENTIAL
Verticals / assetsMarket size
2016*Market CAGR2017 – 2020
Revenue CAGR 2017 – 2020*
Key drivers
Exports & import substitution
RUB 4.0 trln
1-4% ≈25%
• Global leadership in production costs
• Investments in production capacity and modernization
• Considerable optimisation of operating costs
RUB 2.5 trln
6-8% >25%
• Production cost advantages and strong expertise
• Organic expansion and M&A in high-growth segments
• Land bank growth to >500 thsd hectares by end 2017
Consumer sector
RUB 519 bln
≈2%Above the
market
• Growth in # of stores, displacing competitors
• E-commerce growth – sales up ≈3x YoY in 9M 2016
• Pricing power and economies of scale
RUB 538 bln
≈14% >25%
• Structural growth in the domestic market
• Increased penetration into Russian regions
• Turnaround in old clinics, expansion of profitable formats
Real estate and hospitality
Sistema’s portfolio
≈3 mln m2
Portfolio CAGR
≈2%≈18%
• Monetisation of large residential development portfolio
• Restructuring and renovation of property for rent
• Cottage rental business: renovations & income growth
RUB 78 bln
≈13% >20%
• Growth in domestic tourism
• Growth of market share in Moscow and regions
• Restructuring of Intourist assets based on acquired chain
RUB4.6 trln
RUB3.3 trln
RUB565 bln
RUB914 bln
>3 mlnm2
RUB126 bln
Market2020*
*Source: Ipsos Comcon for children’s retail 2016-17 with 2% growth rate applied for 2018-2020, Sistema Group companies estimates for pulp and paper, agro, healthcare and hospitality sectors
Leader-Invest, Business-Nedvizhimost, Mosdachtrest
10
71.3 61.6
45.637.7
64.7
8.1
20.8
-20.8*
-11.8-7.4
-13.3
41.7
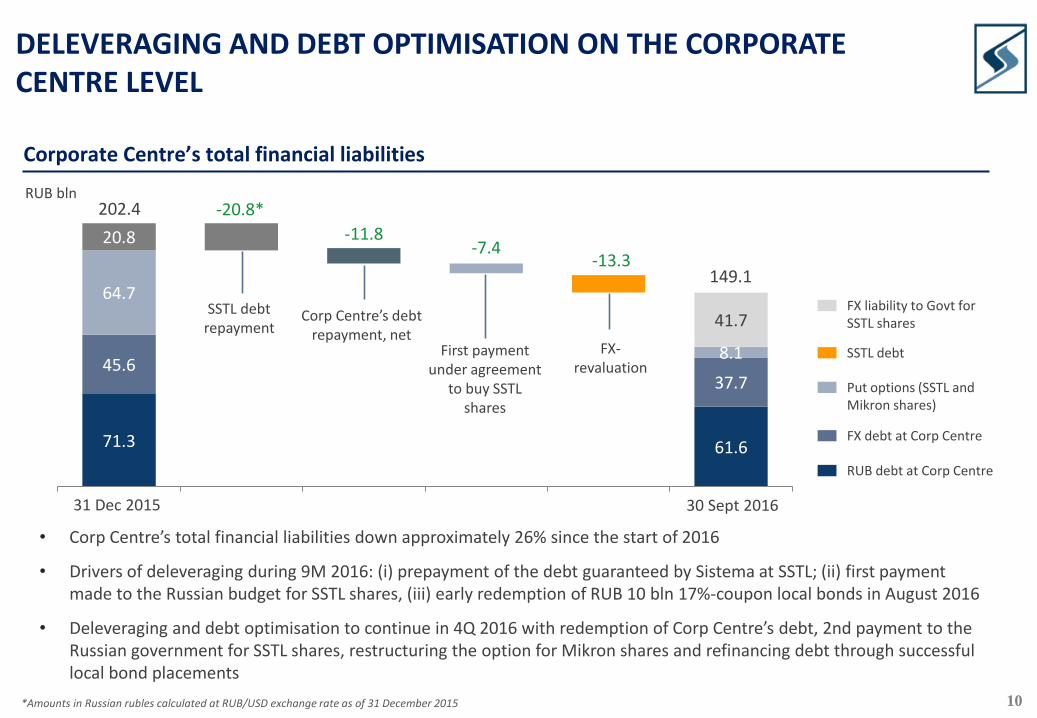
DELEVERAGING AND DEBT OPTIMISATION ON THE CORPORATE CENTRE LEVEL
RUB bln
• Corp Centre’s total financial liabilities down approximately 26% since the start of 2016
• Drivers of deleveraging during 9M 2016: (i) prepayment of the debt guaranteed by Sistema at SSTL; (ii) first payment made to the Russian budget for SSTL shares, (iii) early redemption of RUB 10 bln 17%-coupon local bonds in August 2016
• Deleveraging and debt optimisation to continue in 4Q 2016 with redemption of Corp Centre’s debt, 2nd payment to the Russian government for SSTL shares, restructuring the option for Mikron shares and refinancing debt through successful local bond placements
Corp Centre’s debt repayment, net
SSTL debt repayment
First payment under agreement
to buy SSTL shares
FX-revaluation
202.4
149.1
*Amounts in Russian rubles calculated at RUB/USD exchange rate as of 31 December 2015
Corporate Centre’s total financial liabilities
31 Dec 2015 30 Sept 2016
FX liability to Govt forSSTL shares
SSTL debt
Put options (SSTL andMikron shares)
FX debt at Corp Centre
RUB debt at Corp Centre
11
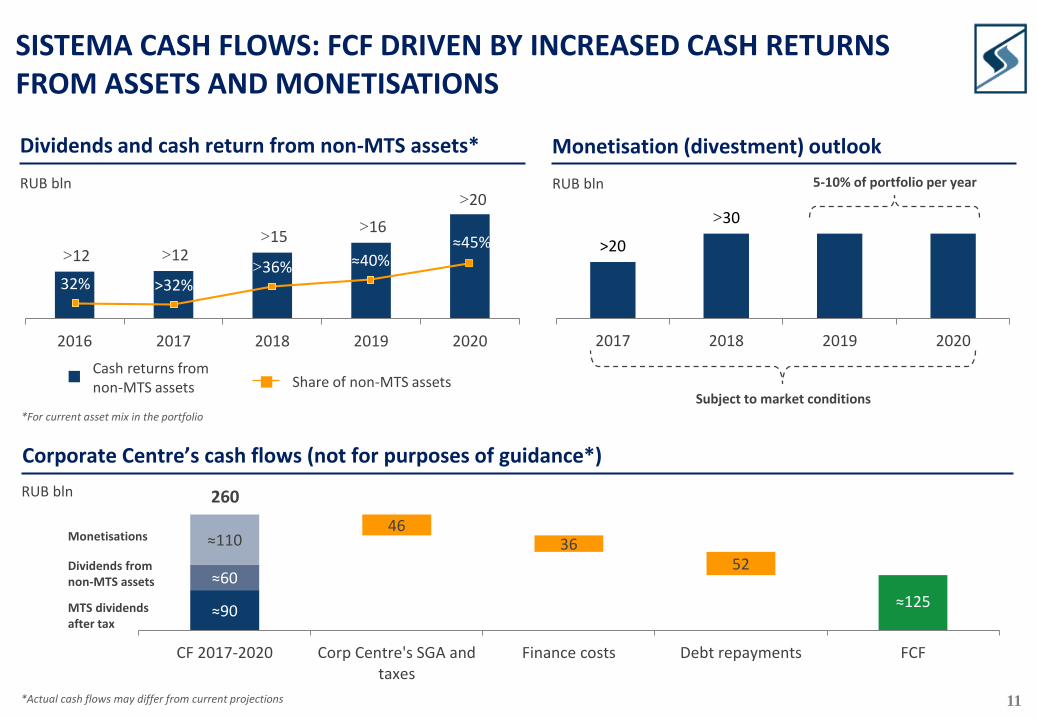
Share of non-MTS assets
Dividends from non-MTS assets
Monetisations
MTS dividends after tax
>20
>30
2017 2018 2019 2020
>12 >12 >15
>16
>20
2016 2017 2018 2019 2020
32% >32%>36% ≈40%
≈45%
SISTEMA CASH FLOWS: FCF DRIVEN BY INCREASED CASH RETURNS FROM ASSETS AND MONETISATIONS
Dividends and cash return from non-MTS assets*
Cash returns from non-MTS assets
RUB bln
Monetisation (divestment) outlook
RUB bln
Subject to market conditions
5-10% of portfolio per year
*For current asset mix in the portfolio
≈90≈125
≈60
≈11046
3652
CF 2017-2020 Corp Centre's SGA andtaxes
Finance costs Debt repayments FCF
Corporate Centre’s cash flows (not for purposes of guidance*)
RUB bln 260
*Actual cash flows may differ from current projections
12
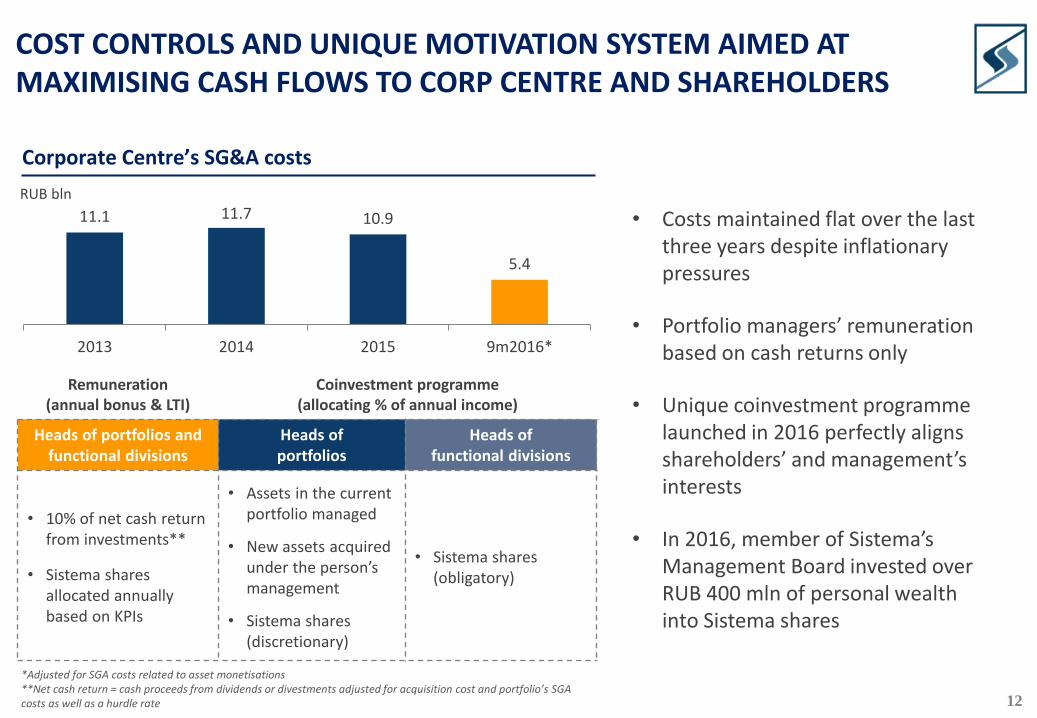
COST CONTROLS AND UNIQUE MOTIVATION SYSTEM AIMED AT MAXIMISING CASH FLOWS TO CORP CENTRE AND SHAREHOLDERS
5.4
10.911.711.1
9m2016*201520142013
Corporate Centre’s SG&A costs
• Costs maintained flat over the last three years despite inflationary pressures
• Portfolio managers’ remuneration based on cash returns only
• Unique coinvestment programme launched in 2016 perfectly aligns shareholders’ and management’s interests
• In 2016, member of Sistema’s Management Board invested over RUB 400 mln of personal wealth into Sistema shares
*Adjusted for SGA costs related to asset monetisations**Net cash return = cash proceeds from dividends or divestments adjusted for acquisition cost and portfolio’s SGA costs as well as a hurdle rate
Remuneration(annual bonus & LTI)
Coinvestment programme(allocating % of annual income)
Heads of portfolios and functional divisions
Heads of portfolios
Heads of functional divisions
• 10% of net cash return from investments**
• Sistema shares allocated annually based on KPIs
• Assets in the current portfolio managed
• New assets acquired under the person’s management
• Sistema shares (discretionary)
• Sistema shares (obligatory)
RUB bln

13
SHAREHOLDER REMUNERATION: FIRST INTERIM DIVIDEND UNDER NEW DIVIDEND POLICY AIMED AT DIVIDEND GROWTH
Total dividend for the year
RUB 0.67 per share(RUB 13.4 per GDR)
4% minimum dividend yield*
The higher of
Sistema dividends for the period, RUB bn
• Transparent dividend policy with a fixed annual floor (RUB 0.67 per share) and a minimum yield of 4%
• Progressive dividend payments to be achieved with market cap growth or minimum yield increased
• Sistema will seek to distribute dividends twice per year
• First interim dividend of RUB 3.7 bln paid in 2016. Total dividend paid during the year reached RUB 10.1 bln and more than doubled vs. 2015
*Annual dividend divided by the weighted average price of Sistema ordinary shares traded at the Moscow Exchange in the relevant reporting year
4.54
6.47
3.65
2014 2015 6M2016
56% of 2015
dividend
New dividend policy approved in 2016… …aimed at increasing payouts
14
BOARD COMPOSITION
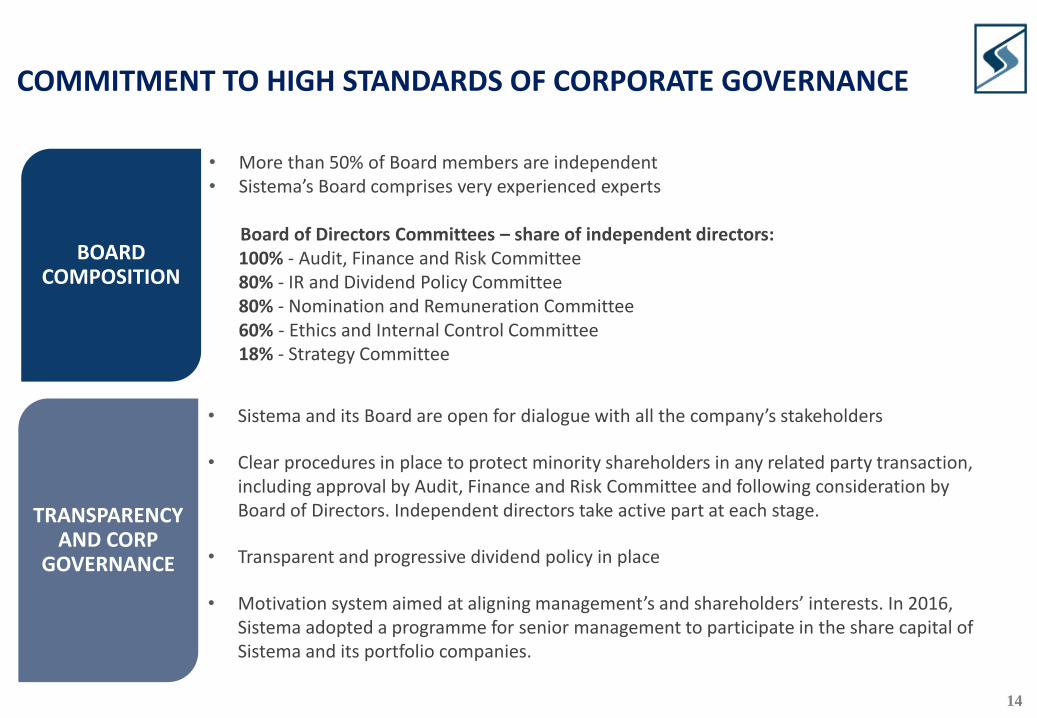
COMMITMENT TO HIGH STANDARDS OF CORPORATE GOVERNANCE
• More than 50% of Board members are independent• Sistema’s Board comprises very experienced experts
Board of Directors Committees – share of independent directors: 100% - Audit, Finance and Risk Committee80% - IR and Dividend Policy Committee80% - Nomination and Remuneration Committee60% - Ethics and Internal Control Committee18% - Strategy Committee
• Sistema and its Board are open for dialogue with all the company’s stakeholders
• Clear procedures in place to protect minority shareholders in any related party transaction, including approval by Audit, Finance and Risk Committee and following consideration by Board of Directors. Independent directors take active part at each stage.
• Transparent and progressive dividend policy in place
• Motivation system aimed at aligning management’s and shareholders’ interests. In 2016, Sistema adopted a programme for senior management to participate in the share capital of Sistema and its portfolio companies.
TRANSPARENCY AND CORP
GOVERNANCE
15
Portfolio Overview: 3Q 2016 Results
16
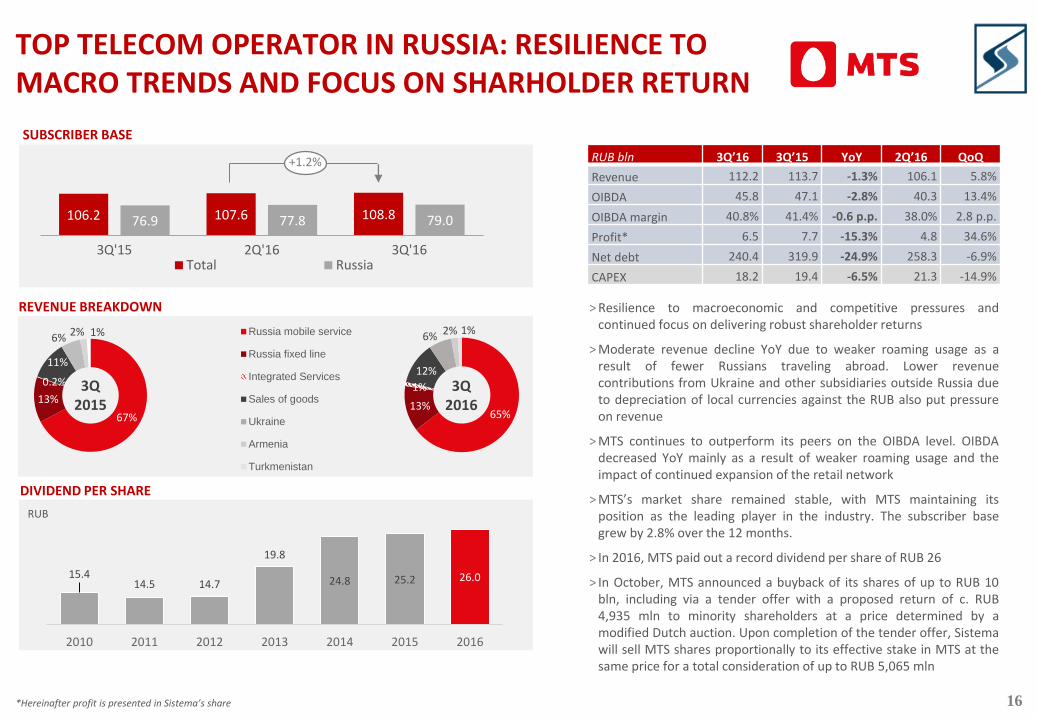
TOP TELECOM OPERATOR IN RUSSIA: RESILIENCE TO MACRO TRENDS AND FOCUS ON SHARHOLDER RETURN
*Hereinafter profit is presented in Sistema’s share
> Resilience to macroeconomic and competitive pressures andcontinued focus on delivering robust shareholder returns
> Moderate revenue decline YoY due to weaker roaming usage as aresult of fewer Russians traveling abroad. Lower revenuecontributions from Ukraine and other subsidiaries outside Russia dueto depreciation of local currencies against the RUB also put pressureon revenue
> MTS continues to outperform its peers on the OIBDA level. OIBDAdecreased YoY mainly as a result of weaker roaming usage and theimpact of continued expansion of the retail network
> MTS’s market share remained stable, with MTS maintaining itsposition as the leading player in the industry. The subscriber basegrew by 2.8% over the 12 months.
> In 2016, MTS paid out a record dividend per share of RUB 26
> In October, MTS announced a buyback of its shares of up to RUB 10bln, including via a tender offer with a proposed return of c. RUB4,935 mln to minority shareholders at a price determined by amodified Dutch auction. Upon completion of the tender offer, Sistemawill sell MTS shares proportionally to its effective stake in MTS at thesame price for a total consideration of up to RUB 5,065 mln
106.2 107.6 108.876.9 77.8 79.0
3Q'15 2Q'16 3Q'16Total Russia
+1.2%
SUBSCRIBER BASE
REVENUE BREAKDOWN
DIVIDEND PER SHARE
RUB bln 3Q’16 3Q’15 YoY 2Q’16 QoQ
Revenue 112.2 113.7 -1.3% 106.1 5.8%
OIBDA 45.8 47.1 -2.8% 40.3 13.4%
OIBDA margin 40.8% 41.4% -0.6 p.p. 38.0% 2.8 p.p.
Profit* 6.5 7.7 -15.3% 4.8 34.6%
Net debt 240.4 319.9 -24.9% 258.3 -6.9%
CAPEX 18.2 19.4 -6.5% 21.3 -14.9%
15.414.5 14.7
19.8
24.8 25.2 26.0
2010 2011 2012 2013 2014 2015 2016
65%13%
1%
12%
6% 2% 1%Russia mobile service
Russia fixed line
Integrated Services
Sales of goods
Ukraine
Armenia
Turkmenistan
67%
13%
0.2%
11%
6% 2% 1%
RUB
3Q2016
3Q 2015
17
15.220.5
3Q-15 3Q-16
2.94.6
9М-15 9М-16
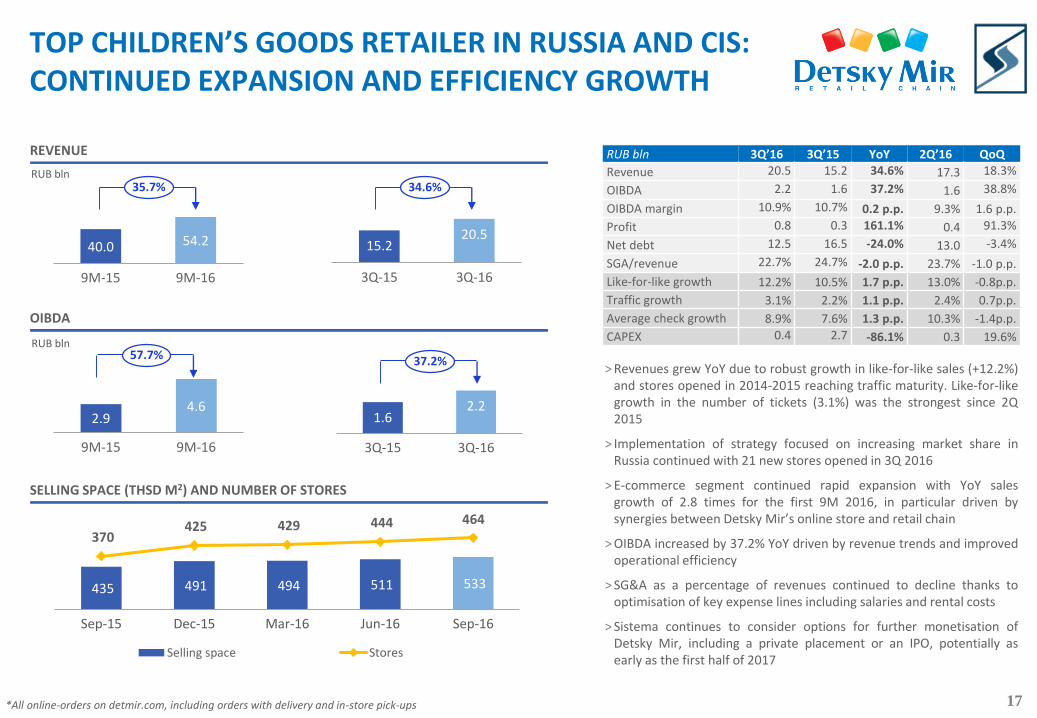
435 491 494 511 533
370 425 429 444 464
Sep-15 Dec-15 Mar-16 Jun-16 Sep-16
Selling space Stores
TOP CHILDREN’S GOODS RETAILER IN RUSSIA AND CIS:CONTINUED EXPANSION AND EFFICIENCY GROWTH
*All online-orders on detmir.com, including orders with delivery and in-store pick-ups
> Revenues grew YoY due to robust growth in like-for-like sales (+12.2%)and stores opened in 2014-2015 reaching traffic maturity. Like-for-likegrowth in the number of tickets (3.1%) was the strongest since 2Q2015
> Implementation of strategy focused on increasing market share inRussia continued with 21 new stores opened in 3Q 2016
> E-commerce segment continued rapid expansion with YoY salesgrowth of 2.8 times for the first 9M 2016, in particular driven bysynergies between Detsky Mir’s online store and retail chain
> OIBDA increased by 37.2% YoY driven by revenue trends and improvedoperational efficiency
> SG&A as a percentage of revenues continued to decline thanks tooptimisation of key expense lines including salaries and rental costs
> Sistema continues to consider options for further monetisation ofDetsky Mir, including a private placement or an IPO, potentially asearly as the first half of 2017
SELLING SPACE (THSD M2) AND NUMBER OF STORES
RUB bln 3Q’16 3Q’15 YoY 2Q’16 QoQ
Revenue 20.5 15.2 34.6% 17.3 18.3%
OIBDA 2.2 1.6 37.2% 1.6 38.8%
OIBDA margin 10.9% 10.7% 0.2 p.p. 9.3% 1.6 p.p.
Profit 0.8 0.3 161.1% 0.4 91.3%
Net debt 12.5 16.5 -24.0% 13.0 -3.4%
SGA/revenue 22.7% 24.7% -2.0 p.p. 23.7% -1.0 p.p.
Like-for-like growth 12.2% 10.5% 1.7 p.p. 13.0% -0.8p.p.
Traffic growth 3.1% 2.2% 1.1 p.p. 2.4% 0.7p.p.
Average check growth 8.9% 7.6% 1.3 p.p. 10.3% -1.4p.p.
CAPEX 0.4 2.7 -86.1% 0.3 19.6%
REVENUE
40.0 54.2
9М-15 9М-16
35.7%RUB bln
1.62.2
3Q-15 3Q-16
57.7%
OIBDA
RUB bln
34.6%
37.2%

18
LEADING PULP AND PAPER HOLDING SEGEZHA GROUP: CONTINUED INVESTMENTS INTO GROWTH
PAPER SACKS SACK PAPER*
SAWN TIMBER PLYWOOD
REVENUE AND OIBDA BY BUSINESS SEGMENTS
57%25%
12%6%
Paper & Paper sacks
Wood processing
Plywood
Forestry
63%20%
15%3%
RUB10.5bln
Revenue OIBDA
RUB bln 3Q’16 3Q’15 YoY 2Q’16 QoQ
Revenue 10.5 8.8 18.9% 10.0 4.4%
OIBDA 2.2 1.7 29.7% 2.2 -1.8%
OIBDA margin 20.8% 18.8% 1.7 p.p. 22.2% -1.4 p.p.
Profit 0.2 0.6 -58.7% 0.5 -53.4%
Net debt 15.9 -0.2 n/a 14.8 7.1%
CAPEX 3.1 0.9 255.3% 2.0 55.5%
Share of FХ-denom.
revenues69% 69% -1 p.p. 70% -2 p.p.
Own forestry consumption 61% 64% -3 p.p. 60% 1 p.p.
Total forestry, ‘000 m3 916.5 731.4 25% 730.9 25%
384324
3Q2015 3Q2016
+19%
3645
3Q2015 3Q2016
-21%
235
106
3Q2015 3Q2016
+122%
2423
3Q2015 3Q2016
+3%
˃ Increase in revenue YoY driven by stronger sales of paper sacks anddoubling of sawn timber production following the consolidation ofLesosibirsk Wood-Processing Plant No.1 in 1Q 2016
˃ Sack paper shipments decreased as a result of the plannedshutdown for modernisation of pulping equipment at Segezha Pulp& Paper Mill aimed at increasing production by 28% to 1,150 tonnesof pulp a day. The plant began operating at full capacity in 4Q 2016
˃ Main factors behind OIBDA margin increase YoY are the increase inshare of sales of high-margin products within the paper sack andsawn timber product lines, as well as optimisation of productioncosts
˃ Major capital investments in 3Q 2016 related to modernisation ofSegezha Pulp & Paper Mill, construction of a new plywood plant inKirov and modernisation of forestry equipment
˃ In 4Q 2016, Segezha Group signed a five-year EUR 383.6 mlnsyndicated loan facility to finance investment programmes and forgeneral corporate purposes
Planned result
*Includes shipment of paper and paper board
Mln Thsd tonnes
Thsd m3 Thsd m3
RUB2.1bln
19
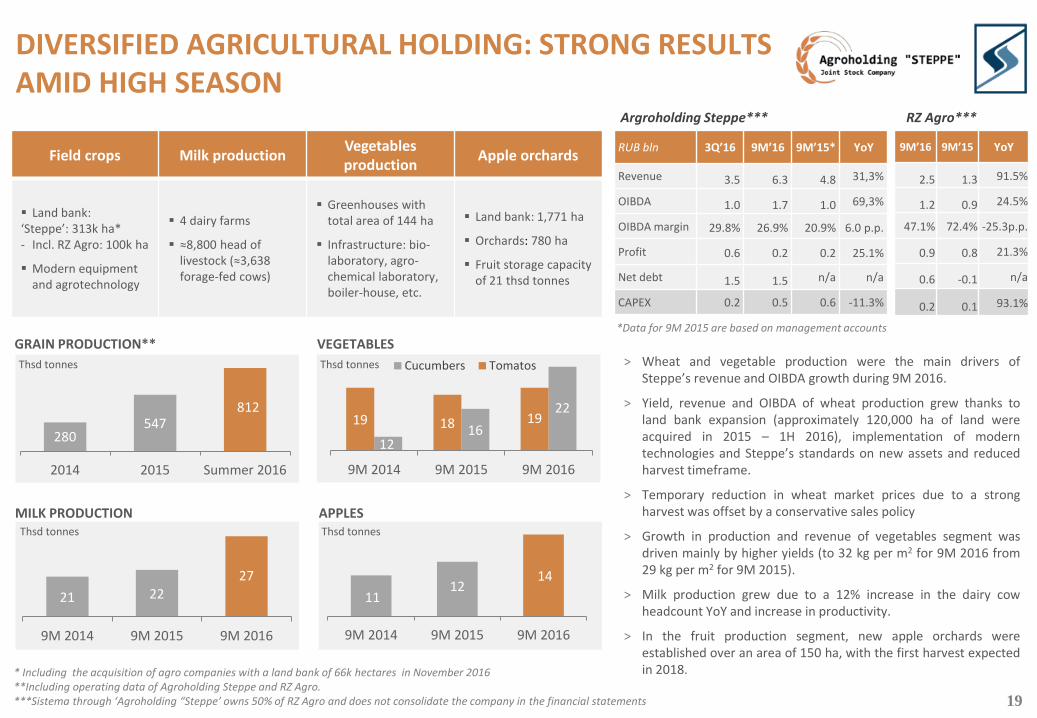
DIVERSIFIED AGRICULTURAL HOLDING: STRONG RESULTS AMID HIGH SEASON
Field crops Milk productionVegetables production
Apple orchards
Land bank:‘Steppe’: 313k ha*- Incl. RZ Agro: 100k ha
Modern equipment and agrotechnology
4 dairy farms
≈8,800 head of livestock (≈3,638forage-fed cows)
Greenhouses with total area of 144 ha
Infrastructure: bio-laboratory, agro-chemical laboratory, boiler-house, etc.
Land bank: 1,771 ha
Orchards: 780 ha
Fruit storage capacity of 21 thsd tonnes
* Including the acquisition of agro companies with a land bank of 66k hectares in November 2016 **Including operating data of Agroholding Steppe and RZ Agro.***Sistema through ‘Agroholding “Steppe’ owns 50% of RZ Agro and does not consolidate the company in the financial statements
Argroholding Steppe***
812547
280
Summer 201620152014
GRAIN PRODUCTION**
22
1612
191819
9M 20169M 20159M 2014
Cucumbers Tomatos
VEGETABLES
1412
11
9M 20169M 20159M 2014
MILK PRODUCTION
RZ Agro***
RUB bln 3Q’16 9M’16 9M’15* YoY
Revenue 3.5 6.3 4.8 31,3%
OIBDA 1.0 1.7 1.0 69,3%
OIBDA margin 29.8% 26.9% 20.9% 6.0 p.p.
Profit 0.6 0.2 0.2 25.1%
Net debt 1.5 1.5 n/a n/a
CAPEX 0.2 0.5 0.6 -11.3%
9M’16 9M’15 YoY
2.5 1.3 91.5%
1.2 0.9 24.5%
47.1% 72.4% -25.3p.p.
0.9 0.8 21.3%
0.6 -0.1 n/a
0.2 0.1 93.1%
APPLES
272221
9M 20169M 20159M 2014
> Wheat and vegetable production were the main drivers ofSteppe’s revenue and OIBDA growth during 9M 2016.
> Yield, revenue and OIBDA of wheat production grew thanks toland bank expansion (approximately 120,000 ha of land wereacquired in 2015 – 1H 2016), implementation of moderntechnologies and Steppe’s standards on new assets and reducedharvest timeframe.
> Temporary reduction in wheat market prices due to a strongharvest was offset by a conservative sales policy
> Growth in production and revenue of vegetables segment wasdriven mainly by higher yields (to 32 kg per m2 for 9M 2016 from29 kg per m2 for 9M 2015).
> Milk production grew due to a 12% increase in the dairy cowheadcount YoY and increase in productivity.
> In the fruit production segment, new apple orchards wereestablished over an area of 150 ha, with the first harvest expectedin 2018.
Thsd tonnes Thsd tonnes
Thsd tonnes Thsd tonnes
*Data for 9M 2015 are based on management accounts

20
RUB bln 3Q’16 3Q’15 YoY 2Q’16 QoQ
Revenue 2.2 2.0 14.7% 2.3 -2.6%
OIBDA 0.4 0.2 174.9% 0.1 3.2х
OIBDA margin 18.6% 7.8% 10.8 p.p. 5.6% 13.0 p.p.
Profit/Loss 0.1 0.1 -33.6 -0.2 n/a
Net debt -1.1 -0.2 n/a -0.6 n/a
Patient visits, ‘000 1 716 1 755 -2.2% 1 843 -6.9%
Services provided, ‘000 2 647 2 684 -1.4% 2 942 -10.0%
HEALTHCARE (MEDSI) AND PHARMACEUTICALS (BINNOPHARM)
> Robust revenue growth YoY was driven principally by an increase in the average check of17.2%. The QoQ revenue decline was the result of seasonality affecting demand for medicalservices
> Medsi’s OIBDA and OIBDA margin increased YoY due to a 9.5% reduction in SG&A versus 3Q2015, as well as one-time income from a counterparty paying off accounts receivables andfines.
> Revenues at Medsi’s largest facility, the Clinical Diagnostic Centre (CDC) at Belorusskaya, roseby 10.3% YoY.
> The CDC opened at Krasnaya Presnya in late 2015 continues to successfully ramp up capacityutilisation and patient visit numbers (+39% QoQ). The facility is expected to become positiveat the OIBDA level in 2017.
Corporate 8%
Insurance 56%
Private 36%
Revenue by clients
Мedsi
Revenue by assets
CDC at Belorusskaya22%
Initial consultationclinics and CDC
43%
Hospitals8%
Others11%
Children’s clinics 16%
Binnopharm
> Binnopharm continued to successfully execute on its strategy to grow the share of its ownproducts in total sales. In line with this strategy, the share of lower-margin distribution sales in3Q 2016 declined to 11%, compared to 61% in the same period in 2015.
> The YoY decline in revenues was due to the reduction in distribution sales in the state segment,which was offset by growth of commercial sales of the company’s own products, as well asimproved operating results.
> Binnopharm’s OIBDA grew to RUB 0.01 bln, versus a loss in 3Q 2015.
> The decrease in revenue and OIBDA QoQ was due to no supplies of Regevak B being deliveredduring the quarter (vaccine shipments were made in 2Q 2016 in line with the contract with theNational Immunobiological Company). Additional pressure on OIBDA resulted from higherspending on building out Binnopharm’s commercial operations.
Production of finished pharmaceutical products, ‘000
2,190
2,664
3Q'15 3Q'16
RUB bln 3Q’16 3Q’15 YoY 2Q’16 QoQ
Revenue 0.3 0.3 -3.9% 0.5 -41.6%
OIBDA 0.01 -0.07 n/a 0.08 -86.3%
OIBDA margin 3.7% n/a n/a 15.8% -12.1 p.p.
Loss -0.07 -0.09 n/a -0.03 n/a
Net debt 1,1 1,1 -2,6% 0.9 11.2%
21
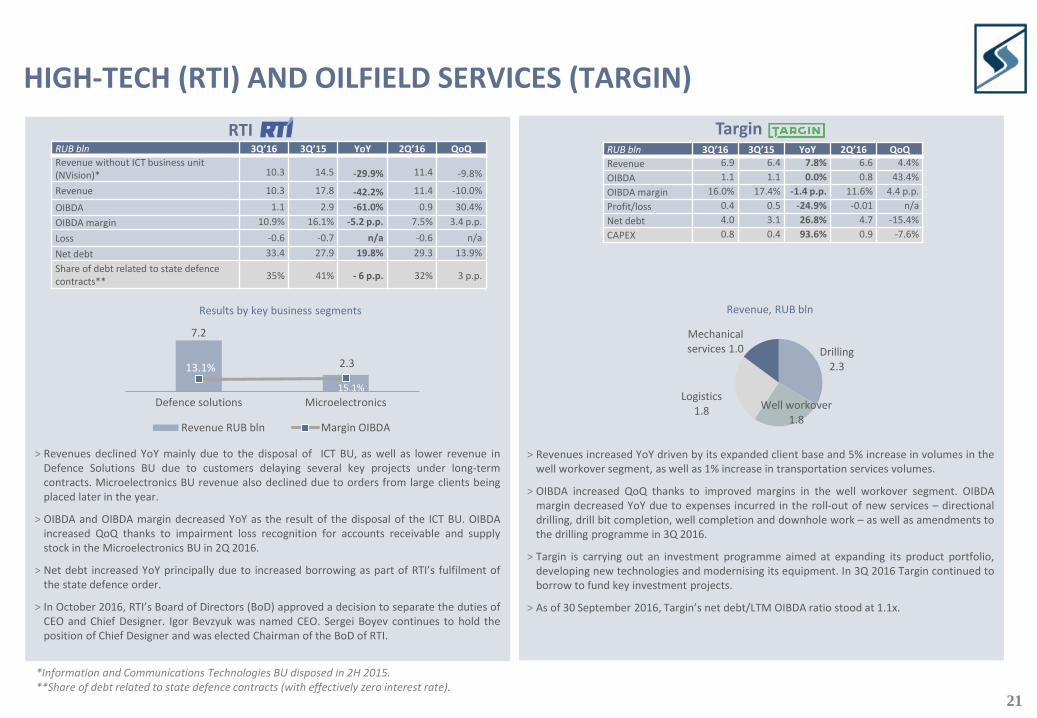
7.2
2.313.1%
15.1%
Defence solutions Microelectronics
Revenue RUB bln Margin OIBDA
HIGH-TECH (RTI) AND OILFIELD SERVICES (TARGIN)
RTI
> Revenues declined YoY mainly due to the disposal of ICT BU, as well as lower revenue inDefence Solutions BU due to customers delaying several key projects under long-termcontracts. Microelectronics BU revenue also declined due to orders from large clients beingplaced later in the year.
> OIBDA and OIBDA margin decreased YoY as the result of the disposal of the ICT BU. OIBDAincreased QoQ thanks to impairment loss recognition for accounts receivable and supplystock in the Microelectronics BU in 2Q 2016.
> Net debt increased YoY principally due to increased borrowing as part of RTI’s fulfilment ofthe state defence order.
> In October 2016, RTI’s Board of Directors (BoD) approved a decision to separate the duties ofCEO and Chief Designer. Igor Bevzyuk was named CEO. Sergei Boyev continues to hold theposition of Chief Designer and was elected Chairman of the BoD of RTI.
*Information and Communications Technologies BU disposed in 2H 2015. **Share of debt related to state defence contracts (with effectively zero interest rate).
Results by key business segments
RUB bln 3Q’16 3Q’15 YoY 2Q’16 QoQ
Revenue without ICT business unit (NVision)* 10.3 14.5 -29.9% 11.4 -9.8%
Revenue 10.3 17.8 -42.2% 11.4 -10.0%
OIBDA 1.1 2.9 -61.0% 0.9 30.4%
OIBDA margin 10.9% 16.1% -5.2 p.p. 7.5% 3.4 p.p.
Loss -0.6 -0.7 n/a -0.6 n/a
Net debt 33.4 27.9 19.8% 29.3 13.9%
Share of debt related to state defence contracts**
35% 41% - 6 p.p. 32% 3 p.p.
> Revenues increased YoY driven by its expanded client base and 5% increase in volumes in thewell workover segment, as well as 1% increase in transportation services volumes.
> OIBDA increased QoQ thanks to improved margins in the well workover segment. OIBDAmargin decreased YoY due to expenses incurred in the roll-out of new services – directionaldrilling, drill bit completion, well completion and downhole work – as well as amendments tothe drilling programme in 3Q 2016.
> Targin is carrying out an investment programme aimed at expanding its product portfolio,developing new technologies and modernising its equipment. In 3Q 2016 Targin continued toborrow to fund key investment projects.
> As of 30 September 2016, Targin’s net debt/LTM OIBDA ratio stood at 1.1x.
Revenue, RUB bln
TarginRUB bln 3Q’16 3Q’15 YoY 2Q’16 QoQ
Revenue 6.9 6.4 7.8% 6.6 4.4%
OIBDA 1.1 1.1 0.0% 0.8 43.4%
OIBDA margin 16.0% 17.4% -1.4 p.p. 11.6% 4.4 p.p.
Profit/loss 0.4 0.5 -24.9% -0.01 n/a
Net debt 4.0 3.1 26.8% 4.7 -15.4%
CAPEX 0.8 0.4 93.6% 0.9 -7.6%
Drilling2.3
Well workover1.8
Logistics1.8
Mechanical services 1.0
22
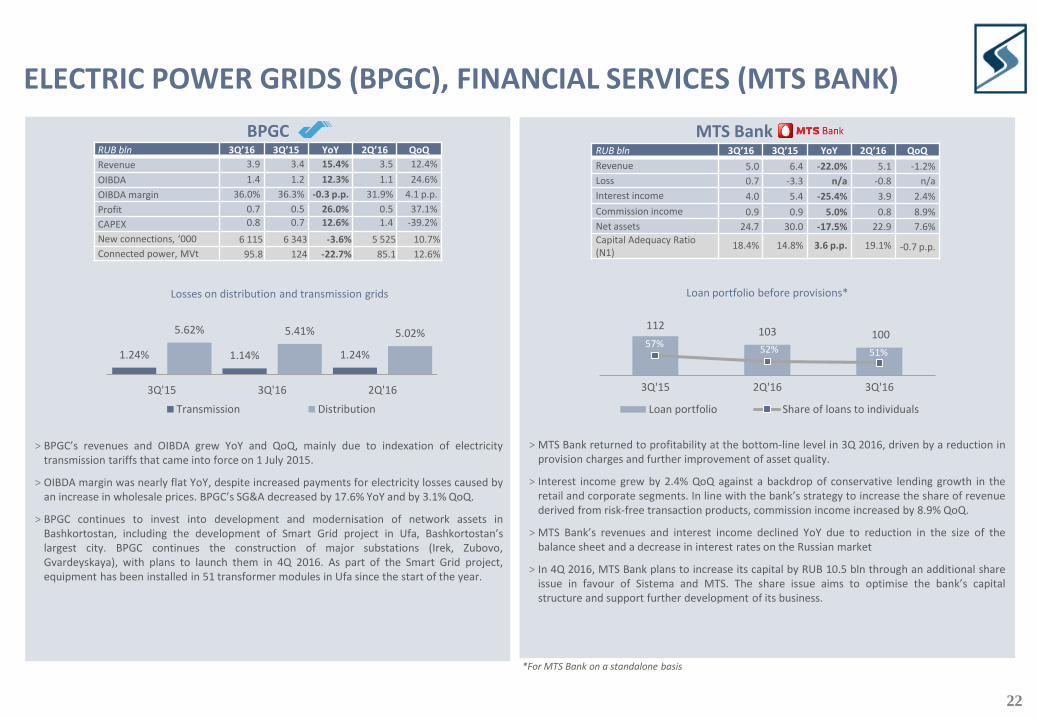
ELECTRIC POWER GRIDS (BPGC), FINANCIAL SERVICES (MTS BANK)
BPGC
> BPGC’s revenues and OIBDA grew YoY and QoQ, mainly due to indexation of electricitytransmission tariffs that came into force on 1 July 2015.
> OIBDA margin was nearly flat YoY, despite increased payments for electricity losses caused byan increase in wholesale prices. BPGC’s SG&A decreased by 17.6% YoY and by 3.1% QoQ.
> BPGC continues to invest into development and modernisation of network assets inBashkortostan, including the development of Smart Grid project in Ufa, Bashkortostan’slargest city. BPGC continues the construction of major substations (Irek, Zubovo,Gvardeyskaya), with plans to launch them in 4Q 2016. As part of the Smart Grid project,equipment has been installed in 51 transformer modules in Ufa since the start of the year.
*For MTS Bank on a standalone basis
1.24% 1.14% 1.24%
5.62% 5.41% 5.02%
3Q'15 3Q'16 2Q'16
Transmission Distribution
Losses on distribution and transmission grids
RUB bln 3Q’16 3Q’15 YoY 2Q’16 QoQ
Revenue 3.9 3.4 15.4% 3.5 12.4%
OIBDA 1.4 1.2 12.3% 1.1 24.6%
OIBDA margin 36.0% 36.3% -0.3 p.p. 31.9% 4.1 p.p.
Profit 0.7 0.5 26.0% 0.5 37.1%
CAPEX 0.8 0.7 12.6% 1.4 -39.2%
New connections, ‘000 6 115 6 343 -3.6% 5 525 10.7%
Connected power, MVt 95.8 124 -22.7% 85.1 12.6%
MTS Bank
˃ MTS Bank returned to profitability at the bottom-line level in 3Q 2016, driven by a reduction inprovision charges and further improvement of asset quality.
˃ Interest income grew by 2.4% QoQ against a backdrop of conservative lending growth in theretail and corporate segments. In line with the bank’s strategy to increase the share of revenuederived from risk-free transaction products, commission income increased by 8.9% QoQ.
˃ MTS Bank’s revenues and interest income declined YoY due to reduction in the size of thebalance sheet and a decrease in interest rates on the Russian market
˃ In 4Q 2016, MTS Bank plans to increase its capital by RUB 10.5 bln through an additional shareissue in favour of Sistema and MTS. The share issue aims to optimise the bank’s capitalstructure and support further development of its business.
112103 100
57%52% 51%
3Q'15 2Q'16 3Q'16
Loan portfolio Share of loans to individuals
Loan portfolio before provisions*
RUB bln 3Q’16 3Q’15 YoY 2Q’16 QoQ
Revenue 5.0 6.4 -22.0% 5.1 -1.2%
Loss 0.7 -3.3 n/a -0.8 n/a
Interest income 4.0 5.4 -25.4% 3.9 2.4%
Commission income 0.9 0.9 5.0% 0.8 8.9%
Net assets 24.7 30.0 -17.5% 22.9 7.6%Capital Adequacy Ratio (N1)
18.4% 14.8% 3.6 p.p. 19.1% -0.7 p.p.
23
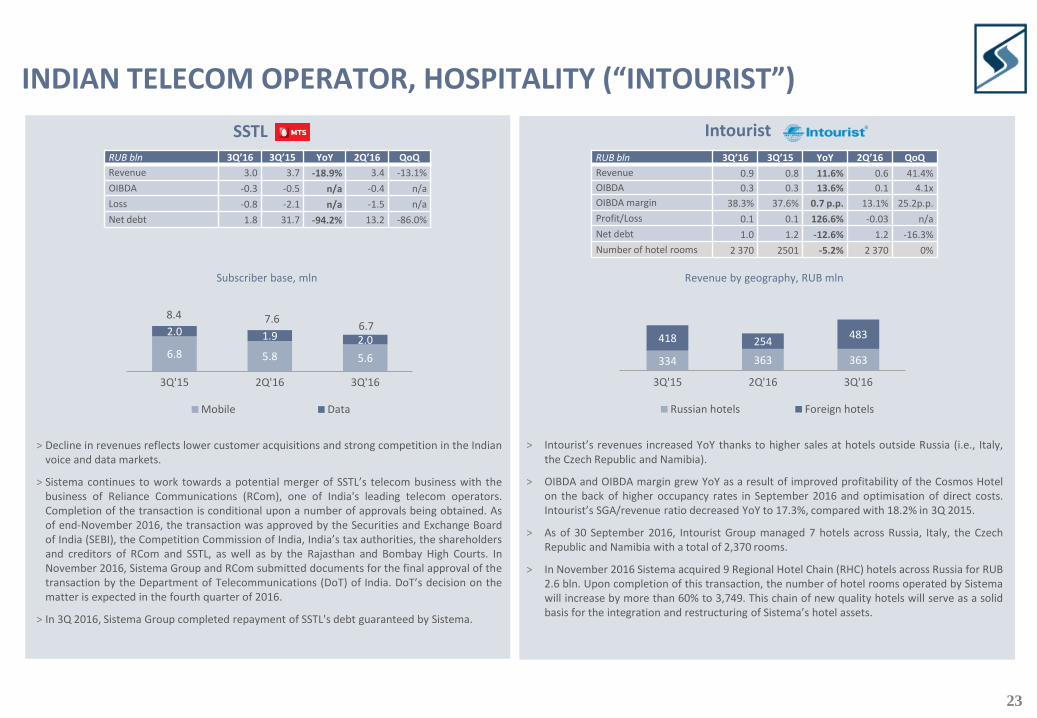
INDIAN TELECOM OPERATOR, HOSPITALITY (“INTOURIST”)
Intourist
RUB bln 3Q’16 3Q’15 YoY 2Q’16 QoQ
Revenue 0.9 0.8 11.6% 0.6 41.4%
OIBDA 0.3 0.3 13.6% 0.1 4.1x
OIBDA margin 38.3% 37.6% 0.7 p.p. 13.1% 25.2p.p.
Profit/Loss 0.1 0.1 126.6% -0.03 n/a
Net debt 1.0 1.2 -12.6% 1.2 -16.3%
Number of hotel rooms 2 370 2501 -5.2% 2 370 0%
> Intourist’s revenues increased YoY thanks to higher sales at hotels outside Russia (i.e., Italy,the Czech Republic and Namibia).
> OIBDA and OIBDA margin grew YoY as a result of improved profitability of the Cosmos Hotelon the back of higher occupancy rates in September 2016 and optimisation of direct costs.Intourist’s SGA/revenue ratio decreased YoY to 17.3%, compared with 18.2% in 3Q 2015.
> As of 30 September 2016, Intourist Group managed 7 hotels across Russia, Italy, the CzechRepublic and Namibia with a total of 2,370 rooms.
> In November 2016 Sistema acquired 9 Regional Hotel Chain (RHC) hotels across Russia for RUB2.6 bln. Upon completion of this transaction, the number of hotel rooms operated by Sistemawill increase by more than 60% to 3,749. This chain of new quality hotels will serve as a solidbasis for the integration and restructuring of Sistema’s hotel assets.
Revenue by geography, RUB mln
SSTL
6.8 5.8 5.6
2.0 1.9 2.0
8.4 7.66.7
3Q'15 2Q'16 3Q'16
Mobile Data
Subscriber base, mln
> Decline in revenues reflects lower customer acquisitions and strong competition in the Indianvoice and data markets.
> Sistema continues to work towards a potential merger of SSTL’s telecom business with thebusiness of Reliance Communications (RCom), one of India's leading telecom operators.Completion of the transaction is conditional upon a number of approvals being obtained. Asof end-November 2016, the transaction was approved by the Securities and Exchange Boardof India (SEBI), the Competition Commission of India, India’s tax authorities, the shareholdersand creditors of RCom and SSTL, as well as by the Rajasthan and Bombay High Courts. InNovember 2016, Sistema Group and RCom submitted documents for the final approval of thetransaction by the Department of Telecommunications (DoT) of India. DoT’s decision on thematter is expected in the fourth quarter of 2016.
> In 3Q 2016, Sistema Group completed repayment of SSTL's debt guaranteed by Sistema.
RUB bln 3Q’16 3Q’15 YoY 2Q’16 QoQ
Revenue 3.0 3.7 -18.9% 3.4 -13.1%
OIBDA -0.3 -0.5 n/a -0.4 n/a
Loss -0.8 -2.1 n/a -1.5 n/a
Net debt 1.8 31.7 -94.2% 13.2 -86.0%
334 363 363
418 254483
3Q'15 2Q'16 3Q'16
Russian hotels Foreign hotels
