sip performance of select schemes - axismf - decembe… · 1 sip performance of select schemes (as...
TRANSCRIPT


1
SIP PERFORMANCE OF SELECT SCHEMES (as on 30th December 2016)The Fund offers flexible and convenient Systematic Investment Plan (SIP) facility. To illustrate the advantages of SIP investments, this is how your investments would have grown if you had invested say Rs. 10,000 systematically on the first Business Day of every month over a period of time.
^Past performance may or may not be sustained in future. Returns greater than 1 year period are compounded annualized. Benchmark: Nifty 50. Additional Benchmak: S&P BSE Sensex. Inception Date: Jan 05, 2010. This scheme is managed by Shreyash Devalkar. Please refer to the Annexure for returns of all the schemes managed by them.
Axis Equity Fund - Growth Option
^Past performance may or may not be sustained in future. Returns greater than 1 year period are compounded annualized. Benchmark: S&P BSE 200. Additional Benchmak: Nifty 50. Inception Date: Dec 29, 2009. This scheme is managed by Jinesh Gopani. Please refer to the Annexure for returns of all the schemes managed by him.
SIP Investments Since Inception SIP 5 Year SIP 3 Year SIP 1 Year SIP
Total Amount Invested (Rs) 8,40,000 6,00,000 3,60,000 1,20,000Market value as on December 30, 2016 (Rs) 15,53,132 9,34,191 4,06,825 1,17,184Returns (Annualised) 17.25% 17.76% 8.11% -4.33%Benchmark Returns (Annualised) 8.50% 12.15% 4.83% 2.78%Additional Benchmark Returns (Annualised) 7.37% 10.30% 2.79% 1.61%
Axis Long Term Equity Fund - Growth Option
^Past performance may or may not be sustained in future. Returns greater than 1 year period are compounded annualized. Benchmark: S&P BSE Midcap. Additional Benchmak: Nifty 50. Inception Date: Feb 18, 2011. This scheme is managed by Shreyash Devalkar. Please refer to the Annexure for returns of all the schemes managed by him.
SIP Investments Since Inception SIP 5 Year SIP 3 Year SIP 1 Year SIP
Total Amount Invested (Rs) 7,00,000 6,00,000 3,60,000 1,20,000Market value as on December 30, 2016 (Rs) 11,40,564 9,01,608 3,96,027 1,16,899Returns (Annualised) 16.63% 16.31% 6.30% -4.77%Benchmark Returns (Annualised) 16.04% 16.97% 13.36% 5.37%Additional Benchmark Returns (Annualised) 7.79% 7.69% 2.79% 1.61%
Axis Midcap Fund - Growth Option
^Past performance may or may not be sustained in future. Returns greater than 1 year period are compounded annualized. Benchmark: Nifty 50. Additional Benchmak: S&P BSE 200. Inception Date: Jun 29, 2012. This scheme is managed by Jinesh Gopani. Please refer to the Annexure for returns of all the schemes managed by him.
SIP Investments Since Inception SIP 3 Year SIP 1 Year SIP
Total Amount Invested (Rs) 5,40,000 3,60,000 1,20,000
Market value as on December 30, 2016 (Rs) 6,99,533 4,05,439 1,21,463
Returns (Annualised) 11.49% 7.88% 2.27%
Benchmark Returns (Annualised) 6.93% 2.79% 1.61%
Additional Benchmark Returns (Annualised) 8.88% 4.83% 2.78%
Axis Focused 25 Fund - Growth Option
^Past performance may or may not be sustained in future. Returns greater than 1 year period are compounded annualized. Benchmark: 35% Nifty 50+ 35% CRISIL Composite Bond Fund Index + 30% INR Price of Gold. Additional Benchmak: Crisil 10 Year Gilt Index. Inception Date: Aug 23, 2010. This scheme is managed by R. Sivakumar & Ashish Naik. Please refer to the Annexure for returns of all the schemes managed by them.
SIP Investments Since Inception SIP 5 Year SIP 3 Year SIP 1 Year SIP
Total Amount Invested (Rs) 7,60,000 6,00,000 3,60,000 1,20,000Market value as on December 30, 2016 (Rs) 9,42,491 7,01,359 3,84,353 1,19,538Returns (Annualised) 6.71% 6.18% 4.30% -0.71%Benchmark Returns (Annualised) 6.73% 6.45% 5.71% 2.51%Additional Benchmark Returns (Annualised) 9.45% 10.21% 12.60% 15.95%
Axis Triple Advantage Fund - Growth Option
^Past performance may or may not be sustained in future. Returns greater than 1 year period are compounded annualized. Benchmark: CRISIL MIP Blended Index. Additional Benchmak: CRISIL 10 year Gilt Index Inception Date: Jul 16, 2010. This scheme is managed by Devang Shah, Jinesh Gopani & Ashish Naik. Please refer to the Annexure for returns of all the schemes managed by them.
SIP Investments Since Inception SIP 5 Year SIP 3 Year SIP 1 Year SIP
Total Amount Invested (Rs) 7,70,000 6,00,000 3,60,000 1,20,000Market value as on December 30, 2016 (Rs) 10,16,266 7,44,969 3,97,700 1,21,562Returns (Annualised) 8.53% 8.59% 6.58% 2.43%Benchmark Returns (Annualised) 9.79% 10.26% 10.48% 11.50%Additional Benchmark Returns (Annualised) 9.40% 10.21% 12.59% 15.90%
Axis Income Saver - Growth Option
SIP Investments Since Inception SIP 5 Year SIP 3 Year SIP 1 Year SIPTotal Amount Invested (Rs) 8,30,000 6,00,000 3,60,000 1,20,000Market value as on December 30, 2016 (Rs) 11,49,443 7,53,963 3,68,359 1,14,913Returns (Annualised) 9.26% 9.07% 1.50% -7.78%Benchmark Returns (Annualised) 7.39% 7.69% 2.79% 1.61%Additional Benchmark Returns (Annualised) 6.83% 6.98% 1.73% 1.18%
SIP returns are computed after accounting for the cash flow by using XIRR method (investment internal rate of return)
^Past performance may or may not be sustained in future. Returns greater than 1 year period are compounded annualized. Benchmark: CRISIL MIP Blended Index. Additional Benchmak: Nifty 50. Inception Date: August 14, 2015. This scheme is managed by Anupam Tiwari & R. Sivakumar. Please refer to the Annexure for returns of all the schemes managed by them.
SIP Investments Since Inception SIP 1 Year SIP
Total Amount Invested (Rs) 1,70,000 1,20,000
Market value as on December 30, 2016 (Rs) 1,72,525 1,20,835
Returns (Annualised) 1.99% 1.30%
Benchmark Returns (Annualised) 10.87% 11.49%
Additional Benchmark Returns (Annualised) 1.51% 1.61%
Axis Equity Saver Fund - Growth Option

FUND STYLE
TYPE OF SCHEME / INVESTMENT OBJECTIVEAn Open-ended Growth SchemeTo achieve long term capital appreciation by investing in a diversified portfolio predominantly consisting of equity and equity related securities including derivatives. However, there can be no assurance that the investment objective of the Scheme will be achieved.
DATE OF ALLOTMENT5th January 2010
FUND MANAGER
Mr. Shreyash Devalkar Work experience: 13 yearsHe has been managing this fund since 23rd November 2016
LATEST NAV (`) as on 30th December 2016 Regular Plan Direct PlanGrowth 18.38 19.19Dividend 13.29 13.89
BENCHMARK
Nifty 50
FUND SIZE (`)Monthly Average AUM 1,897.98 Crore Latest AUM 1,886.26 Crore (as on 31st December 2016)
STATISTICAL MEASURES (3 years)Standard deviation 14.70%Beta 1.00Sharpe Ratio* 0.27
*Risk-free rate assumed to be 6.25% (MIBOR as on 30-12-16) Source: www.fimmda.org
Please note that as per AMFI guidelines for factsheet, the ratios are calculated based on month rolling returns (absolute) for last 3 years.
Data as on 30th December 2016. Source: ACEMF
PORTFOLIO TURNOVER* (1 year)0.97 times* Based on equity, equity derivatives and Fixed Income Securities transactions only. CBLO/Repo/FD/Margin FD/MFU/SLB are not considered.
MINIMUM INVESTMENT AMOUNT (`)5,000/1
MINIMUM ADDITIONAL PURCHASE AMOUNT (`)100/1
MINIMUM SIP INSTALLMENT AMOUNT (`)1,000/1
LOAD STRUCTUREEntry load - Not applicableExit load - 1% if Units are redeemed / switched-out within 12 months from the date of allotment (Effective from 1st October 2013)
PORTFOLIO
DIVIDENDS
FACTSHEET30th December 2016
Value
Inve
stm
ent S
tyle
Market Cap
Blend
Growth
Large Mid Small
Past performance may or may not be sustained in future. Calculations are based on Growth Option NAV. Since inception returns are calculated on ` 10 invested at inception. Since inception returns for Axis Equity Fund - Growth Option & Direct Plan - Growth Option are calculated from 5th January 2010 & 1st January 2013 respectively. Direct Plan was introduced on 1st January 2013.Shreyash Devalkar manages 2 schemes. Please refer to annexure on Page 19 for performance of all schemes managed by the fund manager.
Please note that after the payment of dividend, the NAV falls to the extent of dividend, distribution tax and cess wherever applicable.Past performance may or may not be sustained in future. Face Value of units is ` 10Dividends disclosed above are since the inception of the fund.
Option Record Date
Direct PlanDividend (` Per unit) NAV per
unit (Cum Dividend)
NAV per unit (Ex
Dividend)
Dividend (` Per unit) NAV per unit (Cum Dividend)
NAV per unit (Ex
Dividend) Individu-als/ HUF Others Individu-
als/HUF Others
Dividend
March 10, 2016 1.00 1.00 13.78 12.78 1.00 1.00 14.24 13.24
March 05, 2015 1.00 1.00 16.53 15.53 1.00 1.00 16.89 15.89
March 17, 2014 1.00 1.00 12.57 11.57 1.00 1.00 12.69 11.69
2
SECTOR ALLOCATION (%)Banks 23.58
Finance 10.37
Auto 9.49
Consumer Non Durables 8.38
Software 7.12
Pharmaceuticals 5.80
Media & Entertainment 5.11
Auto Ancillaries 4.33
Construction Project 4.26
Gas 3.33
Industrial Capital Goods 3.01
Industrial Products 2.59
Petroleum Products 2.49
Power 1.73
Cement 1.55
¢
¢
¢
¢
¢
¢
¢
¢
¢
¢
¢
¢
¢
¢
¢
SCHEME PERFORMANCE (as on 30th December 2016)
Dec 31, 2013 To Dec 31,
2014
Dec 31, 2014 To Dec 31,
2015
Dec 31, 2015 To Dec 30,
2016
Since Inception
Current Value of Investment if
` 10,000 wasinvested on
inception date
Date of inceptionAbsolute Return
(%)Absolute Return
(%)Absolute Return
(%) CAGR (%)
Axis Equity Fund - Growth 40.85% -1.24% -3.62% 9.10% 18,38005-Jan-10Nifty 50 (Benchmark) 31.39% -4.06% 3.01% 6.48% 15,510
S&P BSE Sensex (Additional Benchmark) 29.89% -5.03% 1.95% 6.03% 15,055Axis Equity Fund - Direct Plan - Growth 42.67% -0.25% -2.64% 12.04% 15,755
01-Jan-13Nifty 50 (Benchmark) 31.39% -4.06% 3.01% 8.30% 13,756S&P BSE Sensex (Additional Benchmark) 29.89% -5.03% 1.95% 7.99% 13,598
Banks 23.58HDFC Bank Limited 8.31Kotak Mahindra Bank Limited 4.95State Bank of India 4.94ICICI Bank Limited 4.33IndusInd Bank Limited 1.03Finance 10.37HDFC Limited 3.60Bajaj Finserv Limited 3.21Cholamandalam Investment and Finance Company Limited 1.86CRISIL Limited 1.69Auto 9.49Maruti Suzuki India Limited 6.00Tata Motors Limited 3.49Consumer Non Durables 8.38Asian Paints Limited 5.03ITC Limited 2.24Britannia Industries Limited 1.12Software 7.12Infosys Limited 5.10Tech Mahindra Limited 2.02Pharmaceuticals 5.80Lupin Limited 2.07Sun Pharmaceuticals Industries Limited 1.34Sanofi India Limited 1.31Cadila Healthcare Limited 1.09
Media & Entertainment 5.11Zee Entertainment Enterprises Limited 5.11Auto Ancillaries 4.33Motherson Sumi Systems Limited 2.60Endurance Technologies Limited 1.73Construction Project 4.26Larsen & Toubro Limited 4.26Gas 3.33Indraprastha Gas Limited 2.19Gujarat State Petronet Limited 1.14Industrial Capital Goods 3.01Bharat Electronics Limited 1.98Siemens Limited 1.03Industrial Products 2.59Bharat Forge Limited 1.44Cummins India Limited 1.15Petroleum Products 2.49Indian Oil Corporation Limited 1.49Gulf Oil Lubricants India Limited 1.00Power 1.73Torrent Power Limited 1.73Cement 1.55UltraTech Cement Limited 1.55Total Equity 93.14Cash & Other Receivables 6.86
Net Assets 100%
Company Name % of Assets
Company Name % of Assets
For Statutory Details & Risk Factors please refer page 25.

FUND STYLE
TYPE OF SCHEME / INVESTMENT OBJECTIVEAn Open-ended Growth SchemeTo generate long term capital appreciation by investing in a concentrated portfolio of equity & equity related instruments of up to 25 companies.
DATE OF ALLOTMENT29th June 2012
FUND MANAGER
Jinesh Gopani Work experience: 14 yearsHe has been managing this fund since 07th June 2016
LATEST NAV (`) as on 30th December 2016
Regular Plan Direct PlanGrowth 18.36 19.27Dividend 15.43 19.04
BENCHMARK
Nifty 50 FUND SIZE (`)Monthly Average AUM 855.84 Crore Latest AUM 894.85 Crore (as on 31st December 2016)
STATISTICAL MEASURES (3 years)Standard deviation 15.39%Beta 1.04Sharpe Ratio* 0.55
*Risk-free rate assumed to be 6.25% (MIBOR as on 30-12-16) Source: www.fimmda.org
Please note that as per AMFI guidelines for factsheet, the ratios are calculated based on month rolling returns (absolute) for last 3 years.
Data as on 30th December 2016. Source: ACEMF
PORTFOLIO TURNOVER* (1 year)
0.80 times* Based on equity, equity derivatives and Fixed Income Securities transactions only. CBLO/Repo/FD/Margin FD/MFU/SLB are not considered.
MINIMUM INVESTMENT AMOUNT (`)5,000/1
MINIMUM ADDITIONAL PURCHASE AMOUNT (`)100/1
MINIMUM SIP INSTALLMENT AMOUNT (`)1,000/1
LOAD STRUCTUREEntry load - Not applicableExit load - 1% if redeemed/ switched out within 1 year from the date of allotment. (w.e.f. 15th May 2015)
Finance 17.24Cholamandalam Investment and Finance Company Limited 4.72Bajaj Finserv Limited 4.63Gruh Finance Limited 4.41Bajaj Finance Limited 3.48Banks 16.09Kotak Mahindra Bank Limited 7.46HDFC Bank Limited 6.59RBL Bank Limited 2.03Auto Ancillaries 10.55Motherson Sumi Systems Limited 5.20Bosch Limited 3.43Endurance Technologies Limited 1.92Industrial Products 9.58Cummins India Limited 4.86Supreme Industries Limited 2.46Bharat Forge Limited 2.26Auto 8.37Maruti Suzuki India Limited 8.37Software 7.18Tech Mahindra Limited 4.63
Company Name % of Assets
Company Name % of Assets
PORTFOLIO
FACTSHEET30th December 2016
Past performance may or may not be sustained in future. Calculations are based on Growth Option NAV. Since inception returns are calculated on ̀ 10 invested at inception. Since inception returns for Axis Focused 25 Fund - Growth Option & Direct Plan - Growth Option are calculated from 29th June 2012 & 1st January 2013 respectively. Direct Plan was introduced on 1st January 2013.Jinesh Gopani manages 3 schemes. Please refer to annexure on Page 19 for performance of all schemes managed by the fund managers.
Market CapLarge Mid Small
Value
Inve
stm
ent S
tyle
Blend
Growth
3
SECTOR ALLOCATION (%)Finance 17.24
Banks 16.09
Auto Ancillaries 10.55
Industrial Products 9.58
Auto 8.37
Software 7.18
Cement 6.43
Commercial Services 3.26
Chemicals 2.64
Textile Products 2.63
Industrial Capital Goods 2.33
Consumer Non Durables 2.22
Pharmaceuticals 1.62
¢
¢
¢
¢
¢
¢
¢
¢
¢
¢
¢
¢
¢
Option Record Date Dividend (` Per unit) NAV per unit (Cum Dividend) NAV per unit (Ex Dividend) Individuals/HUF Others
DividendMarch 10, 2016 1.00 1.00 14.56 13.56February 25, 2015 1.75 1.75 17.90 16.15
Please note that after the payment of dividend, the NAV falls to the extent of dividend, distribution tax and cess wherever applicable.Past performance may or may not be sustained in future. Face Value of units is ` 10Dividends disclosed above are since the inception of the fund.
DIVIDENDS
SCHEME PERFORMANCE (as on 30th December 2016)
Dec 31, 2013 To Dec 31,
2014
Dec 31, 2014 To Dec 31,
2015
Dec 31, 2015 To Dec 30,
2016
Since Inception
Current Value of Investment if
` 10,000 wasinvested on
inception date
Date of inceptionAbsolute
Return (%)Absolute
Return (%)
Absolute Return
(%)
CAGR (%)
Axis Focused 25 Fund - Growth 38.75% 3.91% 4.56% 14.43% 18,360
29-Jun-12Nifty 50 (Benchmark) 31.39% -4.06% 3.01% 10.22% 15,507
S&P BSE 200 (Additional Benchmark) 35.47% -1.48% 3.95% 11.63% 16,421
Axis Focused 25 Fund - Direct Plan - Growth 40.37% 5.38% 5.82% 13.39% 16,527
01-Jan-13Nifty 50 (Benchmark) 31.39% -4.06% 3.01% 8.30% 13,756
S&P BSE 200 (Additional Benchmark) 35.47% -1.48% 3.95% 9.46% 14,353
Info Edge (India) Limited 2.55Cement 6.43Shree Cements Limited 6.43Commercial Services 3.26Quess Corp Limited 3.26Chemicals 2.64Pidilite Industries Limited 2.64Textile Products 2.63Page Industries Limited 2.63Industrial Capital Goods 2.33Siemens Limited 2.33Consumer Non Durables 2.22Nestle India Limited 2.22Pharmaceuticals 1.62Divi’s Laboratories Limited 1.62Finance 1.01HDFC Limited 1.01Total Equity 91.14Cash & Other Receivables 8.86
Net Assets 100%
For Statutory Details & Risk Factors please refer page 25.

FUND STYLE
TYPE OF SCHEME / INVESTMENT OBJECTIVEAn Open-ended Equity-Linked Savings Scheme with a 3 year lock in. Eligible investors in the Scheme (who are “Assessee” as per the ELSS Rules) are entitled to deductions of the amount invested in Units of the Scheme under Section 80C of the Income Tax Act, 1961 to such extent and subject to such conditions as may be notified from time to time.
To generate income and long-term capital appreciation from a diversified portfolio of predominantly equity and equity-related securities. However, there can be no assurance that the investment objective of the Scheme will be achieved.
DATE OF ALLOTMENT29th December 2009
FUND MANAGER
Jinesh Gopani Work experience: 14 yearsHe has been managing this fund since 1st April 2011
LATEST NAV (`) as on 30th December 2016 Regular Plan Direct PlanGrowth 30.40 31.87Dividend 19.88 27.15
BENCHMARK
S&P BSE 200
FUND SIZE (`)Monthly Average AUM 10,332.69 Crore Latest AUM 10,409.36 Crore (as on 31st December 2016)
STATISTICAL MEASURES (3 years)Standard deviation 14.31%Beta 0.91Sharpe Ratio* 1.01
*Risk-free rate assumed to be 6.25% (MIBOR as on 30-12-16) Source: www.fimmda.org
Please note that as per AMFI guidelines for factsheet, the ratios are calculated based on month rolling returns (absolute) for last 3 years.
Data as on 30th December 2016. Source: ACEMF
PORTFOLIO TURNOVER* (1 year)0.73 times* Based on equity, equity derivatives and Fixed Income Securities transactions only. CBLO/Repo/FD/Margin FD/MFU/SLB are not considered.
MINIMUM INVESTMENT AMOUNT (`)500/500
MINIMUM ADDITIONAL PURCHASE AMOUNT (`)500/500
MINIMUM SIP INSTALLMENT AMOUNT (`)500/500
LOAD STRUCTUREEntry load - Not applicable
Exit load - Nil
Finance 17.61HDFC Limited 5.87Bajaj Finance Limited 3.23Gruh Finance Limited 2.41Sundaram Finance Limited 2.27Multi Commodity Exchange of India Limited 2.15Cholamandalam Investment and Finance Company Limited 1.68Banks 16.55HDFC Bank Limited 8.63Kotak Mahindra Bank Limited 7.92Auto Ancillaries 9.95Motherson Sumi Systems Limited 4.66Bosch Limited 2.84WABCO India Limited 1.69Endurance Technologies Limited 0.76Auto 7.05Maruti Suzuki India Limited 5.72Eicher Motors Limited 1.34Software 6.52Tech Mahindra Limited 3.61Info Edge (India) Limited 1.77Tata Consultancy Services Limited 1.14Pharmaceuticals 6.30Sun Pharmaceuticals Industries Limited 2.77IPCA Laboratories Limited 1.32Cadila Healthcare Limited 1.20Divi’s Laboratories Limited 1.01Consumer Durables 5.08TTK Prestige Limited 2.95Symphony Limited 2.13
Company Name % of Assets
Company Name % of Assets
PORTFOLIO
DIVIDENDS
FACTSHEET30th December 2016
Please note that after the payment of dividend, the NAV falls to the extent of dividend, distribution tax and cess wherever applicable.Past performance may or may not be sustained in future. Face Value of units is ` 10Dividends disclosed above are since the inception of the fund.
Option Record DateDividend (` Per unit)
NAV per unit (Cum Dividend) Individuals/ HUF Others
Regular Dividend
January 25, 2016 2.25 2.25 21.2217
January 22, 2015 2.00 2.00 24.2942
January 6, 2014 1.00 1.00 14.6918
Market CapLarge Mid Small
Value
Inve
stm
ent S
tyle
Blend
Growth
4
SECTOR ALLOCATION (%)Finance 17.61Banks 16.95Auto Ancillaries 9.95Auto 7.05Pharmaceuticals 6.58Software 6.52Consumer Durables 5.08Industrial Products 4.76Construction Project 3.82Chemicals 3.56Pesticides 3.27Consumer Non Durables 2.87Power 1.92Transportation 1.65Industrial Capital Goods 1.05Commercial Services 0.96Telecom - Equipment & Accessories 0.70Textile Products 0.52
¢¢¢¢¢¢¢¢¢¢¢¢¢¢¢¢¢¢
SCHEME PERFORMANCE (as on 30th December 2016)
Dec 31, 2013 To Dec 31,
2014
Dec 31, 2014 To Dec 31,
2015
Dec 31, 2015 To Dec 30,
2016
Since Inception
Current Value of Investment if
` 10,000 wasinvested on
inception date
Date of inceptionAbsolute
Return (%)Absolute
Return (%)Absolute
Return (%) CAGR (%)
Axis Long Term Equity Fund - Growth 66.18% 6.70% -0.69% 17.19% 30,40029-Dec-09S&P BSE 200 (Benchmark) 35.47% -1.48% 3.95% 7.08% 16,149
Nifty 50 (Additional Benchmark) 31.39% -4.06% 3.01% 6.72% 15,778Axis Long Term Equity Fund - Direct Plan - Growth 68.85% 7.87% 0.40% 20.92% 21,368
01-Jan-13S&P BSE 200 (Benchmark) 35.47% -1.48% 3.95% 9.46% 14,353Nifty 50 (Additional Benchmark) 31.39% -4.06% 3.01% 8.30% 13,756Past performance may or may not be sustained in future. Calculations are based on Growth Option NAV. Since inception returns are calculated on ` 10 invested at inception. Since inception returns for Axis Long Term Equity Fund - Growth Option & Direct Plan - Growth Option are calculated from 29th December 2009 & 1st January 2013 respectively. Direct Plan was introduced on 1st January 2013.Jinesh Gopani manages 3 schemes. Please refer to annexure on Page 19 for performance of all schemes managed by the fund manager.
Industrial Products 4.76Cummins India Limited 2.75Astral Poly Technik Limited 1.23Bharat Forge Limited 0.78Construction Project 3.82Larsen & Toubro Limited 3.82Chemicals 3.56Pidilite Industries Limited 3.56Pesticides 3.27PI Industries Limited 3.27Consumer Non Durables 2.61Nestle India Limited 2.61Power 1.92Torrent Power Limited 1.92Transportation 1.65Blue Dart Express Limited 1.00Gujarat Pipavav Port Limited 0.65Industrial Capital Goods 1.05Siemens Limited 1.05Commercial Services 0.96Quess Corp Limited 0.96Telecom - Equipment & Accessories 0.70Astra Microwave Products Limited 0.70Textile Products 0.52Page Industries Limited 0.52Other Equity (less than 0.50% of the corpus) 0.44Total Equity 94.81Debt, Cash & Other Receivables 5.19
Net Assets 100%
For Statutory Details & Risk Factors please refer page 25.

Finance 26.40Gruh Finance Limited 7.07Cholamandalam Investment and Finance Company Limited 4.82Multi Commodity Exchange of India Limited 3.99CRISIL Limited 3.79Bajaj Finserv Limited 3.75Sundaram Finance Limited 2.98Auto Ancillaries 14.57Motherson Sumi Systems Limited 6.97WABCO India Limited 2.27Amara Raja Batteries Limited 2.14Igarashi Motors India Limited 1.86Endurance Technologies Limited 1.34Media & Entertainment 7.46PVR Limited 4.14Zee Entertainment Enterprises Limited 3.32Consumer Non Durables 6.44Procter & Gamble Hygiene and Health Care Limited 3.46Berger Paints (I) Limited 2.98Industrial Products 5.46Supreme Industries Limited 1.99Cummins India Limited 1.96AIA Engineering Limited 1.51Banks 4.81City Union Bank Limited 4.81Textile Products 4.63Page Industries Limited 4.63
Company Name % of Assets
Company Name % of Assets
PORTFOLIO
FACTSHEET30th December 2016
Past performance may or may not be sustained in future. Calculations are based on Growth Option NAV. Since inception returns are calculated on ` 10 invested at inception. Since inception returns for Axis Midcap Fund - Growth Option & Direct Plan - Growth Option are calculated from 18th February 2011 & 1st January 2013 respectively. Direct Plan was introduced on 1st January 2013.Shreyash Devalkar manages 2 schemes. Please refer to annexure on Page 19 for performance of all schemes managed by the fund manager.
5
DIVIDENDS
Please note that after the payment of dividend, the NAV falls to the extent of dividend, distribution tax and cess wherever applicable.Past performance may or may not be sustained in future. Face Value of units is ` 10Dividends disclosed above are since the inception of the fund.
Option Record Date
Direct PlanDividend (` Per unit) NAV per
unit (Cum Dividend)
NAV per unit (Ex
Dividend)
Dividend (` Per unit) NAV per unit (Cum Dividend)
NAV per unit (Ex
Dividend) Individu-als/ HUF Others Individu-
als/HUF Others
DividendSep 15, 2016 2.00 2.00 22.64 20.64 2.00 2.00 25.83 23.83Sep 10, 2015 1.75 1.75 23.29 21.54 1.75 - 26.04 24.29July 31, 2014 1.50 1.50 19.91 18.41 - - - -
SECTOR ALLOCATION (%)Finance 26.40Auto Ancillaries 14.57Media & Entertainment 7.46Consumer Non Durables 6.44Industrial Products 5.46Banks 4.81Textile Products 4.63Auto 4.01Power 3.32Pharmaceuticals 2.64Petroleum Products 2.51Industrial Capital Goods 2.34Software 2.28Transportation 1.61Consumer Durables 1.51Construction 1.24Cement 0.49
FUND STYLE
TYPE OF SCHEME / INVESTMENT OBJECTIVEAn Open-ended Equity Scheme.
To achieve long term capital appreciation by investing predominantly in equity & equity related instruments of mid size companies. The focus of the fund would be to invest in relatively larger companies within this category.
DATE OF ALLOTMENT18th February 2011
FUND MANAGER
Shreyash DevalkarWork experience: 13 yearsHe has been managing this fund since 23rd November 2016
LATEST NAV (`) as on 30th December 2016 Regular Plan Direct PlanGrowth 24.27 25.48Dividend 18.91 21.90
BENCHMARK
S&P BSE Midcap
FUND SIZE (`)Monthly Average AUM 1,124.20 Crore Latest AUM 1,118.18 Crore (as on 31st December 2016)
STATISTICAL MEASURES (3 years)
Standard deviation 19.48%Beta 1.06Sharpe Ratio* 0.70
*Risk-free rate assumed to be 6.25% (MIBOR as on 30-12-16) Source: www.fimmda.org
Please note that as per AMFI guidelines for factsheet, the ratios are calculated based on month rolling returns (absolute) for last 3 years.
Data as on 30th December 2016. Source: ACEMF
PORTFOLIO TURNOVER* (1 year)0.85 times* Based on equity, equity derivatives and Fixed Income Securities transactions only. CBLO/Repo/FD/Margin FD/MFU/SLB are not considered.
MINIMUM INVESTMENT AMOUNT (`)5,000/1
MINIMUM ADDITIONAL PURCHASE AMOUNT (`)100/1
MINIMUM SIP INSTALLMENT AMOUNT (`)1,000/1
LOAD STRUCTUREEntry load - Not applicable
Exit load - 1% if redeemed / switched - out within 12 months from the date of allotment (w.e.f. 5th May 2014)
Market CapLarge Mid Small
Value
Inve
stm
ent S
tyle
Blend
Growth
¢¢¢¢¢¢¢¢¢¢¢¢¢¢¢¢¢
SCHEME PERFORMANCE (as on 30th December 2016)
Dec 31, 2013 To Dec 31,
2014
Dec 31, 2014 To Dec 31,
2015
Dec 31, 2015 To Dec 30,
2016
Since Inception
Current Value of Investment if
` 10,000 wasinvested on
inception date
Date of inceptionAbsolute
Return (%)Absolute
Return (%)Absolute
Return (%) CAGR (%)
Axis Midcap Fund - Growth 76.55% 0.85% -3.11% 16.31% 24,27018-Feb-11S&P BSE Midcap (Benchmark) 54.69% 7.43% 7.97% 10.60% 18,061
Nifty 50 (Additional Benchmark) 31.39% -4.06% 3.01% 7.15% 14,995Axis Midcap Fund - Direct Plan - Growth 79.55% 2.04% -1.92% 16.81% 18,612
01-Jan-13S&P BSE Midcap (Benchmark) 54.69% 7.43% 7.97% 13.72% 16,716Nifty 50 (Additional Benchmark) 31.39% -4.06% 3.01% 8.30% 13,756
Auto 4.01V.S.T Tillers Tractors Limited 2.94Eicher Motors Limited 1.07Power 3.32Torrent Power Limited 3.32Pharmaceuticals 2.64Torrent Pharmaceuticals Limited 2.00Cadila Healthcare Limited 0.63Petroleum Products 2.51Gulf Oil Lubricants India Limited 2.51Industrial Capital Goods 2.34V-Guard Industries Limited 2.34Software 2.28Info Edge (India) Limited 1.27Tech Mahindra Limited 1.01Transportation 1.61Blue Dart Express Limited 1.61Consumer Durables 1.51Blue Star Limited 1.51Construction 1.24ITD Cementation India Limited 1.24Other Equity (less than 0.50% of the corpus) 0.49Total Equity 91.72Cash & Other Receivables 8.28
Net Assets 100%
For Statutory Details & Risk Factors please refer page 25.
Rating Rating
TYPE OF SCHEME / INVESTMENT OBJECTIVEAn Open-ended Equity SchemeThe investment objective of the scheme is to provide capital appreciation and income distribution to the investors by using equity and equity related instruments, arbitrage opportunities, and investments in debt and money market instruments. However, there is no assurance or guarantee that the investment objective of the Scheme will be achieved.
DATE OF ALLOTMENT14th August 2015
FUND MANAGERAnupam Tiwari Work experience: 10 years He has been managing this fund since 06th October 2016
R. Sivakumar Work experience: 16 years He has been managing this fund since inception
LATEST NAV (`) as on 30th December 2016 Regular Plan Direct PlanGrowth 10.29 10.47Dividend 9.98 9.74Monthly Dividend 9.98 10.16 Quarterly Dividend 10.10 10.26
BENCHMARK
Crisil MIP Blended Fund Index
FUND SIZE (`)Monthly Average AUM 851.19 Crore Latest AUM 835.99 Crore (as on 31st December 2016)
AVERAGE MATURITY@*4.9 years
MODIFIED DURATION@*3.3 years
PORTFOLIO YIELD (YIELD TO MATURITY &)7.65%
MINIMUM INVESTMENT AMOUNT (`)5000/1
MINIMUM ADDITIONAL PURCHASE AMOUNT (`)100/1
MINIMUM SIP INSTALLMENT AMOUNT (`)1000/1
LOAD STRUCTUREEntry load - NAExit load - If redeemed / switched-out within 12 months from the date of allotment, - For 10% of investments : NIL - For remaining investment : 1% If redeemed / switched - out after 12 months from the date of allotment : NIL
FACTSHEET30th December 2016
AXIS EQUITY SAVER FUND
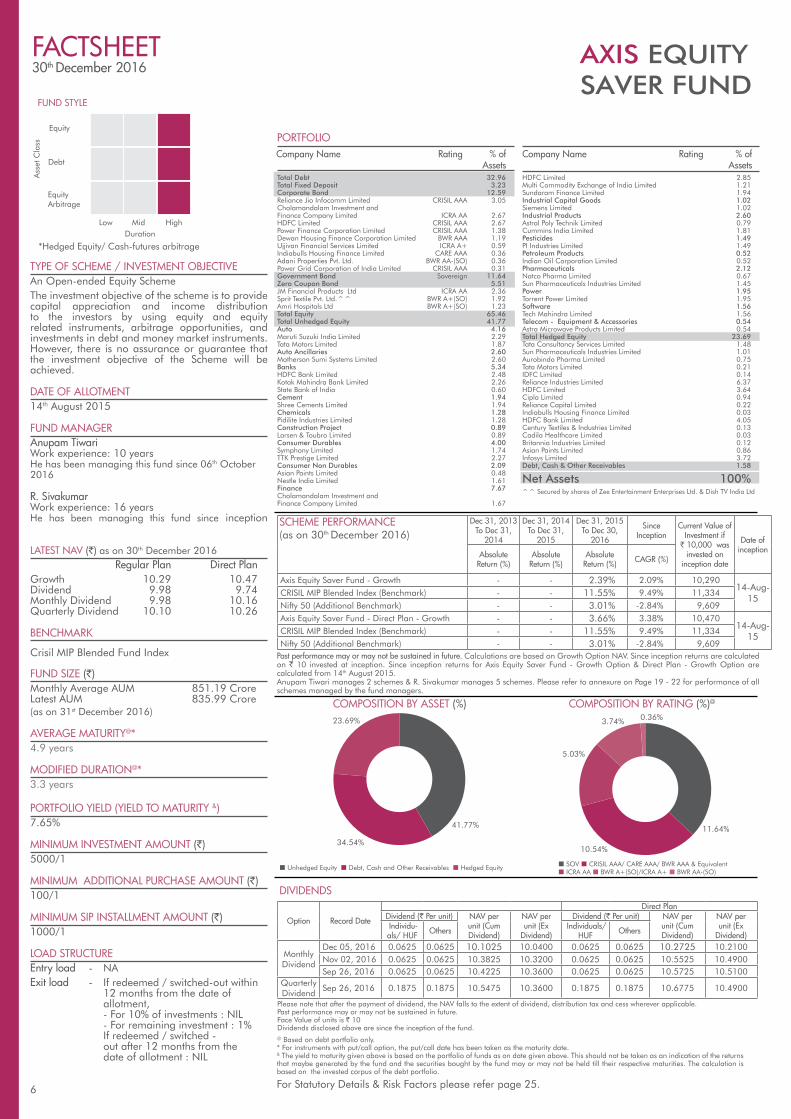
PORTFOLIOCompany Name Rating % of Assets
Company Name Rating % of Assets
6
Ass
et C
lass
FUND STYLE
*Hedged Equity/ Cash-futures arbitrage
For Statutory Details & Risk Factors please refer page 25.
Equity
Duration
Debt
Equity Arbitrage
Low Mid High
HDFC Limited 2.85Multi Commodity Exchange of India Limited 1.21Sundaram Finance Limited 1.94Industrial Capital Goods 1.02Siemens Limited 1.02Industrial Products 2.60Astral Poly Technik Limited 0.79Cummins India Limited 1.81Pesticides 1.49PI Industries Limited 1.49Petroleum Products 0.52Indian Oil Corporation Limited 0.52Pharmaceuticals 2.12Natco Pharma Limited 0.67Sun Pharmaceuticals Industries Limited 1.45Power 1.95Torrent Power Limited 1.95Software 1.56Tech Mahindra Limited 1.56Telecom - Equipment & Accessories 0.54Astra Microwave Products Limited 0.54Total Hedged Equity 23.69Tata Consultancy Services Limited 1.48Sun Pharmaceuticals Industries Limited 1.01Aurobindo Pharma Limited 0.75Tata Motors Limited 0.21IDFC Limited 0.14Reliance Industries Limited 6.37HDFC Limited 3.64Cipla Limited 0.94Reliance Capital Limited 0.22Indiabulls Housing Finance Limited 0.03HDFC Bank Limited 4.05Century Textiles & Industries Limited 0.13Cadila Healthcare Limited 0.03Britannia Industries Limited 0.12Asian Paints Limited 0.86Infosys Limited 3.72Debt, Cash & Other Receivables 1.58
Net Assets 100%^^ Secured by shares of Zee Entertainment Enterprises Ltd. & Dish TV India Ltd
@ Based on debt portfolio only.* For instruments with put/call option, the put/call date has been taken as the maturity date.& The yield to maturity given above is based on the portfolio of funds as on date given above. This should not be taken as an indication of the returns that maybe generated by the fund and the securities bought by the fund may or may not be held till their respective maturities. The calculation is based on the invested corpus of the debt portfolio.
COMPOSITION BY ASSET (%) COMPOSITION BY RATING (%)@
¢ SOV ¢ CRISIL AAA/ CARE AAA/ BWR AAA & Equivalent ¢ ICRA AA ¢ BWR A+(SO)/ICRA A+ ¢ BWR AA-(SO)
¢ Unhedged Equity ¢ Debt, Cash and Other Receivables ¢ Hedged Equity
DIVIDENDS
Please note that after the payment of dividend, the NAV falls to the extent of dividend, distribution tax and cess wherever applicable.Past performance may or may not be sustained in future.Face Value of units is ` 10Dividends disclosed above are since the inception of the fund.
Option Record Date
Direct PlanDividend (` Per unit) NAV per
unit (Cum Dividend)
NAV per unit (Ex
Dividend)
Dividend (` Per unit) NAV per unit (Cum Dividend)
NAV per unit (Ex
Dividend) Individu-als/ HUF Others Individuals/
HUF Others
MonthlyDividend
Dec 05, 2016 0.0625 0.0625 10.1025 10.0400 0.0625 0.0625 10.2725 10.2100Nov 02, 2016 0.0625 0.0625 10.3825 10.3200 0.0625 0.0625 10.5525 10.4900Sep 26, 2016 0.0625 0.0625 10.4225 10.3600 0.0625 0.0625 10.5725 10.5100
Quarterly Dividend
Sep 26, 2016 0.1875 0.1875 10.5475 10.3600 0.1875 0.1875 10.6775 10.4900
SCHEME PERFORMANCE (as on 30th December 2016)
Dec 31, 2013 To Dec 31,
2014
Dec 31, 2014 To Dec 31,
2015
Dec 31, 2015 To Dec 30,
2016
Since Inception
Current Value of Investment if
` 10,000 wasinvested on
inception date
Date of inceptionAbsolute
Return (%)Absolute
Return (%)Absolute
Return (%) CAGR (%)
Axis Equity Saver Fund - Growth - - 2.39% 2.09% 10,29014-Aug-
15CRISIL MIP Blended Index (Benchmark) - - 11.55% 9.49% 11,334Nifty 50 (Additional Benchmark) - - 3.01% -2.84% 9,609Axis Equity Saver Fund - Direct Plan - Growth - - 3.66% 3.38% 10,470
14-Aug-15
CRISIL MIP Blended Index (Benchmark) - - 11.55% 9.49% 11,334Nifty 50 (Additional Benchmark) - - 3.01% -2.84% 9,609
Past performance may or may not be sustained in future. Calculations are based on Growth Option NAV. Since inception returns are calculated on ` 10 invested at inception. Since inception returns for Axis Equity Saver Fund - Growth Option & Direct Plan - Growth Option are calculated from 14th August 2015. Anupam Tiwari manages 2 schemes & R. Sivakumar manages 5 schemes. Please refer to annexure on Page 19 - 22 for performance of all schemes managed by the fund managers.
Total Debt 32.96Total Fixed Deposit 3.23Corporate Bond 12.59Reliance Jio Infocomm Limited CRISIL AAA 3.05Cholamandalam Investment and Finance Company Limited ICRA AA 2.67HDFC Limited CRISIL AAA 2.67Power Finance Corporation Limited CRISIL AAA 1.38Dewan Housing Finance Corporation Limited BWR AAA 1.19Ujjivan Financial Services Limited ICRA A+ 0.59Indiabulls Housing Finance Limited CARE AAA 0.36Adani Properties Pvt. Ltd. BWR AA-(SO) 0.36Power Grid Corporation of India Limited CRISIL AAA 0.31Government Bond Sovereign 11.64Zero Coupon Bond 5.51JM Financial Products Ltd ICRA AA 2.36Sprit Textile Pvt. Ltd.^^ BWR A+(SO) 1.92Amri Hospitals Ltd BWR A+(SO) 1.23Total Equity 65.46Total Unhedged Equity 41.77Auto 4.16Maruti Suzuki India Limited 2.29Tata Motors Limited 1.87Auto Ancillaries 2.60Motherson Sumi Systems Limited 2.60Banks 5.34HDFC Bank Limited 2.48Kotak Mahindra Bank Limited 2.26State Bank of India 0.60Cement 1.94Shree Cements Limited 1.94Chemicals 1.28Pidilite Industries Limited 1.28Construction Project 0.89Larsen & Toubro Limited 0.89Consumer Durables 4.00Symphony Limited 1.74TTK Prestige Limited 2.27Consumer Non Durables 2.09Asian Paints Limited 0.48Nestle India Limited 1.61Finance 7.67Cholamandalam Investment and Finance Company Limited 1.67
41.77%
34.54%
23.69%
11.64%
10.54%
5.03%
3.74% 0.36%

FUND STYLE
TYPE OF SCHEME / INVESTMENT OBJECTIVEAn Open-ended Hybrid Fund
To generate long term capital appreciation by investing in a diversified portfolio of equity and equity related instruments, fixed income instruments & gold exchange traded funds.
DATE OF ALLOTMENT23rd August 2010
FUND MANAGERR. Sivakumar Work experience: 16 yearsHe has been managing the fund since 14th September 2010
Ashish Naik
Work experience: 10 yearsHe has been managing this fund since 22nd June 2016
LATEST NAV (`) as on 30th December 2016
Regular Plan Direct PlanGrowth 15.7881 16.4182Dividend 12.8769 14.1334
BENCHMARK
35% of Nifty 50 + 35% of Crisil Composite Bond Fund Index + 30% Of INR Price of Gold
FUND SIZE (`) Monthly Average AUM 340.09 Crore Latest AUM 338.03 Crore (as on 30th December 2016)
AVERAGE MATURITY@*
8.6 years
MODIFIED DURATION@*5.4 years
PORTFOLIO YIELD (YIELD TO MATURITY &)7.70%
MINIMUM INVESTMENT AMOUNT (`)5,000/1
MINIMUM ADDITIONAL PURCHASE AMOUNT (`)100/1
MINIMUM SIP INSTALLMENT AMOUNT (`)1,000/1
LOAD STRUCTUREEntry load - Not applicableExit load - If redeemed/switch out within 12 months from the date of allotment:- For 10% of investment : Nil- For remaining investment : 1%If redeemed/switch out after 12 months from thedate of allotment: Nil(w.e.f. 15th June 2015)
PORTFOLIO
DIVIDENDS
FACTSHEET30th December 2016
Equity
Ass
et C
lass
Debt
Gold
DurationLow Mid High
Past performance may or may not be sustained in future. Calculations are based on Growth Option NAV. Since inception returns are calculated on ` 10 invested at inception. Since inception returns for Axis Triple Advantage Fund - Growth Option & Direct Plan - Growth Option are calculated from 23rd August 2010 & 1st January 2013 respectively. Direct Plan was introduced on 1st January 2013.R. Sivakumar manages 5 schemes & Ashish Naik manages 3 schemes. Please refer to annexure on Page 19 for performance of all schemes managed by the fund managers. Scheme Performance may not be strictly comparable with that of its additional benchmark in view of hybrid nature of the scheme.
Please note that after the payment of dividend, the NAV falls to the extent of dividend, distribution tax and cess wherever applicable. Past performance may or may not be sustained in future. Face Value of units is ̀ 10. Dividends disclosed above are since the inception of the fund. @ Based on debt portfolio only.* For instruments with put/call option, the put/call date has been taken as the maturity date.& The yield to maturity given above is based on the portfolio of funds as on date given above. This should not be taken as an indication of the returns that maybe generated by the fund and the securities bought by the fund may or may not be held till their respective maturities. The calculation is based on the invested corpus of the debt portfolio.
Option Record Date Dividend (` Per unit) NAV per unit (Cum Dividend) NAV per unit (Ex Dividend) Individuals/HUF Others
DividendApril 17, 2014 0.4676 0.4478 11.3222 10.7222 September 17, 2012 0.7047 0.6040 11.2694 10.4694 September 21, 2011 0.7047 0.6040 10.9561 10.1561
Company Name Rating % of Assets
Company Name Rating % of Assets
7
COMPOSITION BY ASSET (%) COMPOSITION BY RATING (%)@
¢ CRISIL AAA & Equivalent ¢ SOV ¢ CRISIL AA- ¢ Debt^¢ Equity ¢ ETFs ^ Includes Net Current Assets
SCHEME PERFORMANCE (as on 30th December 2016)
Dec 31, 2013 To Dec 31,
2014
Dec 31, 2014 To Dec 31,
2015
Dec 31, 2015 To Dec 30,
2016
Since Inception
Current Value of Investment if
` 10,000 wasinvested on
inception date
Date of inceptionAbsolute
Return (%)Absolute
Return (%)Absolute
Return (%) CAGR (%)
Axis Triple Advantage Fund - Growth 17.16% -0.51% 7.12% 7.45% 15,78823-Aug-
1035% of Nifty 50 + 35% of Crisil Composite Bond Fund Index + 30% Of INR Price of Gold (Benchmark)
16.49% -0.32% 9.66% 7.58% 15,917
Crisil 10 Year Gilt Index (Additional Benchmark) 14.14% 7.39% 14.97% 8.02% 16,328Axis Triple Advantage Fund - Direct Plan Growth 18.81% 0.37% 8.05% 6.66% 12,940
01-Jan-13
35% of Nifty 50 + 35% of Crisil Composite Bond Fund Index + 30% Of INR Price of Gold (Benchmark)
16.49% -0.32% 9.66% 5.73% 12,495
Crisil 10 Year Gilt Index (Additional Benchmark) 14.14% 7.39% 14.97% 8.67% 13,944
Auto 2.38Eicher Motors Limited 1.26Maruti Suzuki India Limited 1.12Consumer Non Durables 2.11ITC Limited 1.07Asian Paints Limited 1.04Construction Project 1.68Larsen & Toubro Limited 1.68Consumer Durables 1.53Blue Star Limited 1.53Pharmaceuticals 1.46Sun Pharmaceuticals Industries Limited 0.84Cadila Healthcare Limited 0.62Transportation 1.41Blue Dart Express Limited 0.75Container Corporation of India Limited 0.66Industrial Products 1.41Cummins India Limited 1.41Cement 1.17Shree Cements Limited 1.17Pesticides 1.17PI Industries Limited 1.17Power 0.81Torrent Power Limited 0.81Industrial Capital Goods 0.77Siemens Limited 0.77Other Equity (less than 0.50% of the corpus) 0.47Exchange Traded Funds 27.63Axis Gold ETF 27.63Net Current Assets 2.89
Net Assets 100%
Total Debt 33.69Corporate Bond 23.27Reliance Gas Transportation Infrastructure Ltd CRISIL AAA 7.59Rural Electrification Corporation Limited CRISIL AAA 6.54Tata Power Company Limited CRISIL AA- 3.81Hindalco Industries Limited CRISIL AA- 3.30Power Finance Corporation Limited CRISIL AAA 1.15India Infrastructure Fin Co Ltd CRISIL AAA 0.89Government Bond Sovereign 10.42Total Equity 35.79Banks 7.17Kotak Mahindra Bank Limited 2.61HDFC Bank Limited 2.55ICICI Bank Limited 2.00Finance 5.00HDFC Limited 2.24Gruh Finance Limited 0.96Max Financial Services Limited 0.73Bajaj Holdings & Investment Limited 0.57Cholamandalam Investment and Finance Company Limited 0.50Software 4.07Info Edge (India) Limited 1.07Tech Mahindra Limited 1.02Infosys Limited 0.99Tata Consultancy Services Limited 0.98Auto Ancillaries 3.19Motherson Sumi Systems Limited 0.93WABCO India Limited 0.92Amara Raja Batteries Limited 0.78Endurance Technologies Limited 0.55
For Statutory Details & Risk Factors please refer page 25.
36.58%
35.79%
27.63% 19.06%
10.42%
7.11%

FUND STYLE
TYPE OF SCHEME / INVESTMENT OBJECTIVEAn Open-ended Income FundTo generate regular income through investments in debt & money market instruments, along with capital appreciation through limited exposure to equity and equity related instruments. It also aims to manage risk through active asset allocation.
DATE OF ALLOTMENT16th July 2010
FUND MANAGER
Devang ShahWork experience: 11 yearsHe has been managing this fund since 07th June 2016
Jinesh GopaniWork experience: 14 yearsHe has been managing this fund since 2nd September 2013
Ashish NaikWork experience: 10 yearsHe has been managing this fund since 22nd June 2016
LATEST NAV (`) as on 30th December 2016
Regular Plan Direct PlanGrowth 16.4996 17.4312Quarterly Dividend 10.6765 12.6387Half yearly Dividend 11.1972 11.6392Annual Dividend 12.1122 12.3014
BENCHMARK
Crisil MIP Blended Fund Index
FUND SIZE (`)
Monthly Average AUM 702.41 Crore Latest AUM 694.79 Crore (as on 31st December 2016)
AVERAGE MATURITY@*
1.2 yearsMODIFIED DURATION@*
1 year
PORTFOLIO YIELD (YIELD TO MATURITY &)
7.35%MINIMUM INVESTMENT AMOUNT (`)
5,000/1MINIMUM ADDITIONAL PURCHASE AMOUNT (`)
100/1MINIMUM SIP INSTALLMENT AMOUNT (`)
1,000/1LOAD STRUCTURE
Entry load - Not applicableExit load - If redeemed/switch out within 12 months from the date of allotment:- For 10% of investment : Nil- For remaining investment : 1%If redeemed/switch out after 12 months from thedate of allotment: Nil(w.e.f. 15th June 2015)
PORTFOLIO
DIVIDENDS
FACTSHEET30th December 2016
Please note that after the payment of dividend, the NAV falls to the extent of dividend, distribution tax and cess wherever applicable.Past performance may or may not be sustained in future.Face Value of units is ` 10Annual Dividends disclosed above are since inception. Half Yearly Dividends disclosed above are for the last 2 Years. Quarterly Dividends disclosed above are for the last 3 quarters.@ Based on debt portfolio only.* For instruments with put/call option, the put/call date has been taken as the maturity date.& The yield to maturity given above is based on the portfolio of funds as on date given above. This should not be taken as an indication of the returns that maybe generated by the fund and the securities bought by the fund may or may not be held till their respective maturities. The calculation is based on the invested corpus of the debt portfolio.For Statutory Details & Risk Factors please refer page 25.
Company Name Rating % of Assets
Company Name Rating % of Assets
Option Record Date
Direct PlanDividend (` Per unit) NAV per
unit (Cum Dividend)
NAV per unit (Ex
Dividend)
Dividend (` Per unit) NAV per unit (Cum Dividend)
NAV per unit (Ex
Dividend) Individuals/
HUF Others Individuals/HUF Others
Annual Dividend
March 28, 2016 0.7222 0.6691 12.5739 11.5739 0.7222 0.6691 12.6583 11.6583March 25, 2015 0.3629 0.3365 12.6035 12.1035 0.3629 0.3365 12.5849 12.0849March 25, 2014 0.3117 0.2985 10.9526 10.5526 - - - -March 25, 2013 0.7928 0.6795 10.9668 10.0668 - - - -
Half Yearly
Dividend
September 26, 2016 0.3611 0.3346 11.9394 11.4394 0.3611 0.3346 12.3576 11.8576March 28, 2016 0.3611 0.3345 11.6671 11.1671 0.3611 0.3345 11.9950 11.4950September 28, 2015 0.3611 0.3345 12.0570 11.5570 0.3611 0.3345 12.3170 11.8170March 25, 2015 0.3629 0.3365 12.2152 11.7152 0.3629 0.3365 12.4039 11.9039
QuarterlyDividend
December 26, 2016 0.1805 0.1672 10.8652 10.6152 0.1805 0.1672 12.8150 12.5650September 26, 2016 0.1806 0.1673 11.4144 11.1644 0.1806 0.1673 13.3820 13.1320June 27, 2016 0.1805 0.1672 11.2342 10.9842 0.1805 0.1672 13.0924 12.8424
Past performance may or may not be sustained in future. Calculations are based on Growth Option NAV. Since inception returns are calculated on ` 10 invested at inception. Since inception returns for Axis Income Saver - Growth Option & Direct Plan - Growth Option are calculated from 16th July 2010 & 4th January 2013 respectively. Direct Plan was introduced on 1st January 2013.Jinesh Gopani manages 3 schemes, Devang Shah manages 46 schemes & Ashish Naik manages 3 schemes. Please refer to annexure on Page 19 & 20 for performance of all schemes managed by the fund managers. Scheme Performance may not be strictly comparable with that of its additional benchmark in view of hybrid nature of the scheme.
Equity
Ass
et C
lass
Debt
8
COMPOSITION BY ASSET (%) COMPOSITION BY RATING (%)@
¢ Debt^ ¢ Equity^ Includes Net Current Assets
SCHEME PERFORMANCE (as on 30th December 2016)
Dec 31, 2013 To Dec 31,
2014
Dec 31, 2014 To Dec 31,
2015
Dec 31, 2015 To Dec 30,
2016
Since Inception
Current Value of Investment if
` 10,000 wasinvested on
inception date
Date of inceptionAbsolute
Return (%)Absolute
Return (%)Absolute
Return (%) CAGR (%)
Axis Income Saver - Growth 20.68% 6.27% 4.19% 8.06% 16,50016-Jul-10Crisil MIP Blended Fund Index (Benchmark) 16.83% 6.79% 11.55% 8.72% 17,166
CRISIL 10 year Gilt Index (Additional Benchmark) 14.14% 7.39% 14.97% 7.60% 16,059Axis Income Saver - Direct Plan - Growth 22.88% 7.76% 5.77% 10.34% 14,808
04-Jan-13Crisil MIP Blended Fund Index (Benchmark) 16.83% 6.79% 11.55% 9.63% 14,431CRISIL 10 year Gilt Index (Additional Benchmark) 14.14% 7.39% 14.97% 8.56% 13,878
¢ ICRA A1+/ CRISIL A1+/ CRISIL AAA/ CARE AAA/ ICRA AAA/ IND AAA & Equivalent ¢ ICRA AA/ CRISIL AA/ ICRA AA(SO)/ IND AA ¢ CARE AA-/ IND AA-(SO) ¢ BWR A+(SO) ¢ ICRA AA+/ IND AA+
Tata Motors Limited 0.65Finance 2.76HDFC Limited 1.27Multi Commodity Exchange of India Limited 0.79Cholamandalam Investment and Finance Company Limited 0.70Banks 2.44HDFC Bank Limited 1.43Kotak Mahindra Bank Limited 1.00Auto Ancillaries 2.20Motherson Sumi Systems Limited 1.01Endurance Technologies Limited 0.61Amara Raja Batteries Limited 0.58Software 1.56Tata Consultancy Services Limited 1.02Info Edge (India) Limited 0.54Transportation 1.34Blue Dart Express Limited 0.81Container Corporation of India Limited 0.53Pharmaceuticals 1.28Sun Pharmaceuticals Industries Limited 0.72Lupin Limited 0.56Pesticides 0.83PI Industries Limited 0.83Consumer Non Durables 0.80Nestle India Limited 0.80Cement 0.74Shree Cements Limited 0.74Industrial Products 0.71Cummins India Limited 0.71Chemicals 0.70Pidilite Industries Limited 0.70Textile Products 0.59Page Industries Limited 0.59Other Equity (less than 0.50% of the corpus) 0.95Net Current Assets 6.97
Net Assets 100%
DurationLow Mid High
Equity Arbitrage
Total Debt 57.66Corporate Bond 42.76Power Finance Corporation Limited CRISIL AAA 11.19Rural Electrification Corporation Limited CRISIL AAA 5.82Tata Sons Ltd CRISIL AAA 5.42IDFC Bank Limited ICRA AAA 3.63Mahindra & Mahindra Financial Services Limited IND AAA 3.59Nirchem Cement Limited CRISIL AA 2.92Indiabulls Housing Finance Limited CARE AAA 2.75SRF Limited IND AA 1.57Reliance Jio Infocomm Limited CRISIL AAA 1.47Cholamandalam Investment and Finance Company Limited ICRA AA 1.45Export Import Bank of India CRISIL AAA 1.44HDFC Limited CRISIL AAA 0.82LIC Housing Finance Limited CRISIL AAA 0.43Adani Ports and Special Economic Zone Limited ICRA AA+ 0.25Blue Dart Express Limited ICRA AA 0.02Zero Coupon Bond 14.90SVL Ltd. ICRA AA(SO) 4.38JM Financial Products Ltd ICRA AA 2.37Dev Infracity Pvt Ltd** IND AA-(SO) 2.36Sprit Textile Pvt. Ltd.^^ BWR A+(SO) 2.13India Infoline Finance Ltd ICRA AA 1.82Magma Fincorp Limited CARE AA- 1.64Dewan Housing Finance Corporation Limited CARE AAA 0.17Shriram Transport Finance Company Limited IND AA+ 0.03Total Money Market Instruments^ 15.54Banks 12.13Canara Bank CRISIL A1+ 7.12ICICI Bank Limited ICRA A1+ 2.80IDBI Bank Limited CRISIL A1+ 1.35Punjab & Sind Bank ICRA A1+ 0.86Others 3.41HDFC Limited ICRA A1+ 3.41Total Equity 19.83Auto 2.92Maruti Suzuki India Limited 1.26Eicher Motors Limited 1.02
^Certificate of Deposit/Commercial Paper ** Secured by shares of Emami Ltd ^^ Secured by shares of Zee Entertainment Enterprises Ltd. & Dish TV India Ltd
80.17%
19.83%
59.24%
14.53%
3.99%2.13%
0.28%

FUND STYLE
TYPE OF SCHEME / INVESTMENT OBJECTIVEAn Open-ended Gilt Scheme
To generate returns similar to that of 10 year government bonds.
DATE OF ALLOTMENT23rd January 2012
FUND MANAGERDevang ShahWork experience: 11 years
He has been managing this fund since 5th November 2012.
LATEST NAV (`) as on 30th December 2016
Regular Plan Direct PlanGrowth 14.7081 15.0145Regular Dividend 10.1304 10.1340Half yearly Dividend 12.0282 -Bonus - -
BENCHMARK
Crisil 10 Year Gilt Index
FUND SIZE (`)Monthly Average AUM 161.01 Crore Latest AUM 159.85 Crore (as on 31st December 2016)
AVERAGE MATURITY10.8 years
MODIFIED DURATION6.8 years
PORTFOLIO YIELD (YIELD TO MATURITY &)6.80%
MINIMUM INVESTMENT AMOUNT (`)5,000/1
MINIMUM ADDITIONAL PURCHASE AMOUNT (`)100/1
MINIMUM SIP INSTALLMENT AMOUNT (`)1000/1
LOAD STRUCTUREEntry load - Not applicable
Exit load - Nil
PORTFOLIO
FACTSHEET30th December 2016
High
Inte
rnal
Rat
e Se
nsiti
vity
Credit Quality
Med
Low
High Mid Low
& The yield to maturity given above is based on the portfolio of funds as on date given above. This should not be taken as an indication of the returns that maybe generated by the fund and the securities bought by the fund may or may not be held till their respective maturities. The calculation is based on the invested corpus.
Company Name Rating % of Assets
DIVIDENDS
Please note that after the payment of dividend, the NAV falls to the extent of dividend, distribution tax and cess wherever applicable.Past performance may or may not be sustained in future.Face Value of units is ` 10Half yearly dividend disclosed above are since the inception of the fund. Regular dividends disclosed above are for the last 3 months.
Option Record Date
Direct PlanDividend (` Per unit) NAV per
unit (Cum Dividend)
NAV per unit (Ex
Dividend)
Dividend (` Per unit) NAV per unit (Cum Dividend)
NAV per unit (Ex
Dividend) Individu-als/ HUF Others Individu-
als/HUF Others
Half Yearly Dividend
September 26, 2016 0.1806 0.1673 11.9880 11.7380 - - - -March 28, 2016 0.3611 0.3345 11.5547 11.0547 0.3611 0.3345 11.7019 11.2019September 28, 2015 0.1805 0.1672 11.5626 11.1994 0.1805 0.1672 11.4494 11.3126
RegularDividend
December 26, 2016 0.0632 0.0883 10.1460 10.0584 0.0666 - 10.1537 10.0615November 25, 2016 0.2295 0.3169 10.8078 10.4900 0.2329 - 10.8159 10.4934October 25, 2016 0.0759 0.1045 10.4384 10.3333 0.0792 - 10.4461 10.3365
Past performance may or may not be sustained in future. Calculations are based on Growth Option NAV. Since inception returns are calculated on ̀ 10 invested at inception. Since inception returns for Axis Constant Maturity 10 Year Fund - Growth Option & Direct Plan - Growth Option are calculated from 23rd January 2012 & 1st January 2013 respectively. Direct Plan was introduced on 1st January 2013.Devang Shah manages 46 schemes. Please refer to annexure on Page 19 & 20 for performance of all schemes managed by the fund manager.
9
COMPOSITION BY ASSET (%) COMPOSITION BY RATING (%)@
¢ Government Bond ¢ Total Money Market Instruments^ ^ Includes Net Current Assets
SCHEME PERFORMANCE (as on 30th December 2016)
Dec 31, 2013 To Dec 31,
2014
Dec 31, 2014 To Dec 31,
2015
Dec 31, 2015 To Dec 30,
2016
Since Inception
Current Value of Investment if `
10,000 was invested on inception date
Date of inceptionAbsolute
Return (%)Absolute
Return (%)Absolute
Return (%) CAGR (%)
Axis Constant Maturity 10 Year Fund - Growth 14.97% 6.33% 13.74% 8.12% 14,70823-Jan-12
Crisil 10 Year Gilt Index (Benchmark) 14.14% 7.39% 14.97% 8.59% 15,027Axis Constant Maturity 10 Year Fund - Direct Plan - Growth
15.53% 6.86% 14.33% 8.88% 14,05101-Jan-13
Crisil 10 Year Gilt Index (Benchmark) 14.14% 7.39% 14.97% 8.67% 13,944
Total Debt 94.06Government Bond 94.067.61% GOI Sovereign 56.497.68% GOI Sovereign 20.518.60% GOI Sovereign 4.857.35% GOI Sovereign 3.258.20% GOI Sovereign 2.047.88% GOI Sovereign 2.028.28% GOI Sovereign 1.728.83% GOI Sovereign 1.398.40% GOI Sovereign 1.108.17% GOI Sovereign 0.70Net Current Assets 5.94
Net Assets 100%
¢ SOV & Equivalent
For Statutory Details & Risk Factors please refer page 25.
100.00%94.06%
5.94%

FUND STYLE
TYPE OF SCHEME / INVESTMENT OBJECTIVEAn Open-ended Debt Scheme
To generate optimal returns while maintaining liquidity through active management of a portfolio of debt and money market instruments.
DATE OF ALLOTMENT27th April 2011
FUND MANAGER
R. SivakumarWork experience: 16 yearsHe has been managing this fund since inception
Devang ShahWork experience: 11 yearsHe has been managing this fund since 5th November 2012.
LATEST NAV (`) as on 30th December 2016
Regular Plan Direct PlanGrowth 16.8367 17.6759Quarterly Dividend 10.7590 11.3587Half Yearly Dividend 11.2093 11.7579
BENCHMARK
Crisil Composite Bond Fund Index
FUND SIZE (`) Monthly Average AUM 359.97 Crore Latest AUM 355.29 Crore (as on 31st December 2016)
AVERAGE MATURITY*9.7 years
MODIFIED DURATION*5.7 years
PORTFOLIO YIELD (YIELD TO MATURITY &)7.15%
MINIMUM INVESTMENT AMOUNT (`)5,000/1
MINIMUM ADDITIONAL PURCHASE AMOUNT (`)100/1
MINIMUM SIP INSTALLMENT AMOUNT (`)1000/1
LOAD STRUCTUREEntry load - Not applicable
Exit load - If redeemed/switched out within 12 months from the date of allotment:- For 10% of investment : Nil- For remaining investment : 1% If redeemed/switched out after 12 months from the date of allotment: Nil (w.e.f. 22nd June 2015)
FACTSHEET30th December 2016
High
Inte
rnal
Rat
e Se
nsiti
vity
Credit Quality
Med
Low
High Mid Low
& The yield to maturity given above is based on the portfolio of funds as on date given above. This should not be taken as an indication of the returns that maybe generated by the fund and the securities bought by the fund may or may not be held till their respective maturities. The calculation is based on the invested corpus.
DIVIDENDS
Please note that after the payment of dividend, the NAV falls to the extent of dividend, distribution tax and cess wherever applicable.Past performance may or may not be sustained in future.Face Value of units is ` 10Half Yearly Dividends disclosed above are for the last 2 Years. Quarterly Dividends disclosed above are for the last 3 quarters.* For instruments with put/call option, the put/call date has been taken as the maturity date.
Option Record Date
Direct PlanDividend (` Per unit) NAV per
unit (Cum Dividend)
NAV per unit (Ex
Dividend)
Dividend (` Per unit) NAV per unit (Cum Dividend)
NAV per unit (Ex
Dividend) Individuals/
HUF Others Individuals/HUF Others
Half Yearly
Dividend
September 26, 2016 0.3611 0.3346 11.3942 10.8942 0.3611 0.3346 11.9017 11.4017March 28, 2016 0.3611 0.3345 11.0764 10.5764 0.3611 0.3345 11.4947 10.9947September 28, 2015 0.2889 0.2676 11.1709 10.7709 0.2889 0.2676 11.5136 11.1136March 25, 2015 0.3629 0.3365 11.2365 10.7365 0.3629 0.3365 11.4928 10.9928
QuarterlyDividend
December 26, 2016 0.1805 0.1672 10.9387 10.6887 0.1805 0.1672 11.5337 11.2837September 26, 2016 0.1806 0.1673 10.9510 10.7010 0.1806 0.1673 11.5087 11.2587June 27, 2016 0.1805 0.1672 10.6589 10.4089 0.1805 0.1672 11.1621 10.9121
Past performance may or may not be sustained in future. Calculations are based on Growth Option NAV. Since inception returns are calculated on ` 10 invested at inception. Since inception returns for Axis Dynamic Bond Fund - Growth Option & Direct Plan - Growth Option are calculated from 27th April 2011 & 1st January 2013 respectively. Direct Plan was introduced on 1st January 2013.R. Sivakumar manages 5 schemes & Devang Shah manages 46 schemes. Please refer to annexure on Page 19 & 20 for performance of all schemes managed by the fund managers.
10
COMPOSITION BY ASSET (%) COMPOSITION BY RATING (%)
¢ SOV ¢ CRISIL AAA/ BWR AAA & Equivalent ¢ ICRA AA ¢ CRISIL AA-/ BWR AA-(SO)
¢ Government Bond ¢ Corporate Bond ¢ Total Money Market Instruments^
¢ Zero Coupon Bond ¢ State Government Bond^ Includes Net Current Assets
SCHEME PERFORMANCE (as on 30th December 2016)
Dec 31, 2013 To Dec 31,
2014
Dec 31, 2014 To Dec 31,
2015
Dec 31, 2015 To Dec 30,
2016
Since Inception
Current Value of Investment if
` 10,000 wasinvested on
inception date
Date of inceptionAbsolute
Return (%)Absolute
Return (%)Absolute
Return (%) CAGR (%)
Axis Dynamic Bond Fund - Growth 14.06% 6.75% 13.40% 9.60% 16,83727-Apr-
11Crisil Composite Bond Fund Index (Benchmark) 14.31% 8.63% 12.93% 9.48% 16,730CRISIL 10 year Gilt Index (Additional Benchmark) 14.14% 7.39% 14.97% 8.27% 15,711Axis Dynamic Bond Fund - Direct Plan -Growth 15.76% 8.14% 14.49% 10.98% 15,167
01-Jan-13
Crisil Composite Bond Fund Index (Benchmark) 14.31% 8.63% 12.93% 9.79% 14,526CRISIL 10 year Gilt Index (Additional Benchmark) 14.14% 7.39% 14.97% 8.67% 13,944
PORTFOLIOCompany Name Rating % of Assets
Company Name Rating % of Assets
Total Debt 87.09Government Bond Sovereign 57.48Corporate Bond 27.94National Highways Auth Of Ind CRISIL AAA 7.04Reliance Gas Transportation Infrastructure Ltd CRISIL AAA 5.11NTPC Limited CRISIL AAA 4.20Cholamandalam Investment and Finance Company Limited ICRA AA 2.86Rural Electrification Corporation Limited CRISIL AAA 1.50Power Grid Corporation of India Limited CRISIL AAA 1.50Vedanta Limited CRISIL AA- 1.42
For Statutory Details & Risk Factors please refer page 25.
Dewan Housing Finance Corporation Limited BWR AAA 1.40Tata Power Company Limited CRISIL AA- 1.21Adani Properties Pvt. Ltd. BWR AA-(SO) 0.85India Infrastructure Fin Co Ltd CRISIL AAA 0.85Zero Coupon Bond 0.93JM Financial Products Ltd ICRA AA 0.93State Government Bond Sovereign 0.74Total Money Market Instruments^ 0.15Treasury Bill 0.1528 Days CMB Sovereign 0.15Net Current Assets 12.76
Net Assets 100%^Treasury Bill
57.48%27.94%
12.91%0.93% 0.74%
58.38%
34.36%
3.79% 3.48%

FUND STYLE
TYPE OF SCHEME / INVESTMENT OBJECTIVEAn Open-ended Debt Scheme
To generate optimal returns in the medium term while maintaining liquidity of the portfolio by investing in debt and money market instruments.
DATE OF ALLOTMENT28th March 2012
FUND MANAGER
Devang ShahWork experience: 11 yearsHe has been managing this fund since 5th November 2012.
LATEST NAV (`) as on 30th December 2016
Regular Plan Direct PlanGrowth 15.4761 16.0587Quarterly Dividend 10.5880 11.0790Half yearly Dividend 11.1985 11.3767
BENCHMARK
Crisil Composite Bond Fund Index
FUND SIZE (`)Monthly Average AUM 222.66 Crore Latest AUM 222.33 Crore (as on 31st December 2016)
AVERAGE MATURITY*5.8 years
MODIFIED DURATION*3.5 years
PORTFOLIO YIELD (YIELD TO MATURITY &)8.41%
MINIMUM INVESTMENT AMOUNT (`)5,000/1
MINIMUM ADDITIONAL PURCHASE AMOUNT (`)100/1
MINIMUM SIP INSTALLMENT AMOUNT (`)1,000/1
LOAD STRUCTUREEntry load - Not applicable
Exit load - If redeemed / switched-out within 12 months from the date of allotmentFor 10% of investment : NilFor remaining investment : 1%If redeemed/switched out after 12 months from the date of allotment : Nil (w.e.f. 30th June 2016)
DIVIDENDS
FACTSHEET30th December 2016
& The yield to maturity given above is based on the portfolio of funds as on date given above. This should not be taken as an indication of the returns that maybe generated by the fund and the securities bought by the fund may or may not be held till their respective maturities. The calculation is based on the invested corpus.
Option Record Date
Direct PlanDividend (` Per unit) NAV per
unit (Cum Dividend)
NAV per unit (Ex
Dividend)
Dividend (` Per unit) NAV per unit (Cum Dividend)
NAV per unit (Ex
Dividend) Individuals/
HUF Others Individuals/HUF Others
Half Yearly
Dividend
September 26, 2016 0.3611 0.3346 11.4980 10.9980 0.3611 0.3346 11.6564 11.1564March 28, 2016 0.3611 0.3345 11.2292 10.7292 0.3611 0.3345 11.3351 10.8351September 28, 2015 0.2889 0.2676 11.3054 10.9054 0.2889 0.2676 11.3459 10.9459March 25, 2015 0.3629 0.3365 11.3899 10.8899 - - - -
QuarterlyDividend
December 26, 2016 0.1805 0.1672 10.8011 10.5511 0.1805 0.1672 11.2898 11.0398September 26, 2016 0.1806 0.1673 10.8953 10.6453 0.1806 0.1673 11.3606 11.1106June 27, 2016 0.1805 0.1672 10.6469 10.3969 0.1805 0.1672 11.0754 10.8254
Past performance may or may not be sustained in future. Calculations are based on Growth Option NAV. Since inception returns are calculated on ` 10 invested at inception. Since inception returns for Axis Income Fund - Growth Option & Direct Plan - Growth Option are calculated from 28th March 2012 & 7th January 2013 respectively. Direct Plan was introduced on 1st January 2013.Devang Shah manages 46 schemes. Please refer to annexure on Page 19 & 20 for performance of all schemes managed by the fund managers.
Credit Risk Rating[ICRA]AAAmfs$
Please note that after the payment of dividend, the NAV falls to the extent of dividend, distribution tax and cess wherever applicable.Past performance may or may not be sustained in future.Face Value of units is ` 10Half yearly dividend disclosed above are since the inception of the fund. Quarterly dividends disclosed above are for the last 3 Quarters.* For instruments with put/call option, the put/call date has been taken as the maturity date.
11
COMPOSITION BY ASSET (%) COMPOSITION BY RATING (%)
¢ ICRA A1+/ CRISIL AAA/ BWR AAA & Equivalent ¢ ICRA AA/CARE AA/CARE AA(SO) ¢ SOV ¢ CRISIL AA-/ BWR AA-(SO)/ CARE AA- ¢ BWR A+(SO)/ CARE A+/ ICRA A+ ¢ IND AA+
¢ Corporate Bond ¢ Government Bond ¢ Total Money Market Instruments^ ¢ Zero Coupon Bond ¢ State Government Bond^ Includes Net Current Assets
SCHEME PERFORMANCE (as on 30th December 2016)
Dec 31, 2013 To Dec 31,
2014
Dec 31, 2014 To Dec 31,
2015
Dec 31, 2015 To Dec 30,
2016
Since Inception
Current Value of Investment if
` 10,000 wasinvested on
inception date
Date of inceptionAbsolute
Return (%)Absolute
Return (%)Absolute
Return (%) CAGR (%)
Axis Income Fund - Growth 15.01% 6.76% 11.62% 9.61% 15,47628-Mar-
12Crisil Composite Bond Fund Index (Benchmark) 14.31% 8.63% 12.93% 9.78% 15,596Crisil 10 Year Gilt Index (Additional Benchmark) 14.14% 7.39% 14.97% 9.24% 15,233Axis Income Fund - Direct Plan - Growth 16.26% 7.95% 12.55% 10.33% 14,788
07-Jan-13
Crisil Composite Bond Fund Index (Benchmark) 14.31% 8.63% 12.93% 9.72% 14,464Crisil 10 Year Gilt Index (Additional Benchmark) 14.14% 7.39% 14.97% 8.51% 13,841
High
Inte
rnal
Rat
e Se
nsiti
vity
Credit Quality
Med
Low
High Mid Low
PORTFOLIOCompany Name Rating % of Assets
Company Name Rating % of Assets
Total Debt 87.25Corporate Bond 63.73Reliance Gas Transportation Infrastructure Ltd CRISIL AAA 5.43Hansdeep Industries & Trading Co. Ltd. CARE AA(SO) 4.60Reliance Jio Infocomm Limited CRISIL AAA 4.59Birla Corporation Limited ICRA AA 4.54Indiabulls Housing Finance Limited BWR AAA 4.48NTPC Limited CRISIL AAA 4.47Dewan Housing Finance Corporation Limited BWR AAA 4.47Tata Power Company Limited CRISIL AA- 4.34Cholamandalam Investment and Finance Company Limited ICRA AA 3.66Hindalco Industries Limited CRISIL AA- 3.36PVR Limited CRISIL AA- 2.42Power Grid Corporation of India Limited CRISIL AAA 2.39Equitas Small Finance Bank Limited CARE A+ 2.28India Infoline Finance Ltd ICRA AA 2.25Ujjivan Financial Services Limited ICRA A+ 2.25
For Statutory Details & Risk Factors please refer page 25.
Rural Electrification Corporation Limited CRISIL AAA 1.92IndoStar Capital Finance Ltd CARE AA- 1.89Adani Transmission Limited IND AA+ 1.81Adani Properties Pvt. Ltd. BWR AA-(SO) 1.35Power Finance Corporation Limited CRISIL AAA 1.24Government Bond Sovereign 13.30Zero Coupon Bond 8.33Edelweiss Commodities Services Ltd CARE AA 2.32Amri Hospitals Ltd BWR A+(SO) 2.31Sprit Textile Pvt. Ltd. BWR A+(SO) 2.22JM Financial Products Ltd ICRA AA 1.48State Government Bond Sovereign 1.90Total Money Market Instruments^ 2.16Others 2.16IFMR Capital Finance Pvt Ltd ICRA A1+ 2.16Net Current Assets 10.59
Net Assets 100%^Commercial Paper
63.73%
13.30%
12.75%
8.33%1.90%
41.73%
18.85%
15.20%
13.36%
9.05% 1.81%

FUND STYLE
TYPE OF SCHEME / INVESTMENT OBJECTIVEAn Open-ended Debt Scheme
To generate stable returns by investing in debt & money market instruments across the yield curve & credit spectrum. However, there is no assurance or guarantee that the investment objective of the Scheme will be achieved. The Scheme does not assure or guarantee any returns.
DATE OF ALLOTMENT15th July 2014
FUND MANAGERDevang ShahWork experience: 11 years
He has been managing this fund since inception.
LATEST NAV (`) as on 30th December 2016
Regular Plan Direct PlanGrowth 12.6189 12.9406Weekly Dividend 10.1101 10.1993Monthly Dividend 10.1278 10.0563
BENCHMARK
Crisil Short Term Bond Fund Index
FUND SIZE (`)Monthly Average AUM 1,497.68 Crore Latest AUM 1,528.33 Crore (as on 31st December 2016)
AVERAGE MATURITY*3.5 years
MODIFIED DURATION*2.6 years
PORTFOLIO YIELD (YIELD TO MATURITY &)7.84%
MINIMUM INVESTMENT AMOUNT (`)5,000/1
MINIMUM ADDITIONAL PURCHASE AMOUNT (`)100/1
MINIMUM SIP INSTALLMENT AMOUNT (`)1000/1
LOAD STRUCTUREEntry load - NA
Exit load - For 30% of investment: Nil For remaining investment: 1.5% if redeemed/switched out within 1 year, 1% if redeemed/switched out after 1 year and upto 2 years, 0.5% if redeemed/switched out after 2 years and upto 3 years from the date of allotment (w.e.f. 14th December 2015)
FACTSHEET30th December 2016
& The yield to maturity given above is based on the portfolio of funds as on date given above. This should not be taken as an indication of the returns that maybe generated by the fund and the securities bought by the fund may or may not be held till their respective maturities. The calculation is based on the invested corpus of the debt portfolio.
* For instruments with put/call option, the put/call date has been taken as the maturity date.
12
AXIS FIXED INCOME
OPPORTUNIT I ES
FUND
PORTFOLIOCompany Name Rating % of Assets
DIVIDENDS
Option Record Date
Direct PlanDividend (` Per unit) NAV per
unit (Cum Dividend)
NAV per unit (Ex
Dividend)
Dividend (` Per unit) NAV per unit (Cum Dividend)
NAV per unit (Ex
Dividend) Individuals/
HUF Others Individuals/HUF Others
Monthly Dividend
Dec 26, 2016 0.0530 0.0491 10.1806 10.1071 0.0741 - 10.1369 10.0342Nov 25, 2016 0.0699 0.0648 10.3568 10.2599 0.0848 - 10.3217 10.2041Oct 25, 2016 0.0564 0.0522 10.2275 10.1493 0.0788 - 10.2123 10.1032
Company Name Rating % of Assets
Please note that after the payment of dividend, the NAV falls to the extent of dividend, distribution tax and cess wherever applicable.Past performance may or may not be sustained in future. Face Value of units is ` 10Dividends disclosed above are since the inception of the fund.
COMPOSITION BY ASSET (%) COMPOSITION BY RATING (%)
¢ ICRA A1+/CRISIL AAA/CARE AAA/BWR AAA/ICRA AAA & Equivalent ¢ ICRA AA/CRISIL AA/CARE AA/ICRA AA(SO)/CARE AA(SO) ¢ SOV¢ BWR A+(SO)/ ICRA A+(SO)/ ICRA A+¢ IND AA-/ CARE AA-/BWR AA-(SO) ¢CRISIL AA+/ CARE AA+/ IND AA+
¢ Corporate Bond ¢ Government Bond ¢ Zero Coupon Bond¢ Total Money Market Instruments^ ¢ State Government Bond^ Includes Net Current Assets
SCHEME PERFORMANCE (as on 30th December 2016)
Dec 31, 2013 To Dec 31,
2014
Dec 31, 2014 To Dec 31,
2015
Dec 31, 2015 To Dec 30,
2016
Since Inception
Current Value of Investment if
` 10,000 wasinvested on
inception date
Date of inceptionAbsolute
Return (%)Absolute
Return (%)Absolute
Return (%) CAGR (%)
Axis Fixed Income Opportunities Fund - Growth - 8.70% 9.79% 9.90% 12,61915-Jul-
14CRISIL Short-Term Bond Fund Index (Benchmark) - 8.66% 9.83% 9.53% 12,513CRISIL 1 Year T-Bill (Additional Benchmark) - 8.22% 7.27% 7.93% 12,068Axis Fixed Income Opportunities Fund - Direct Plan - Growth
- 9.77% 11.16% 11.03% 12,94115-Jul-
14CRISIL Short-Term Bond Fund Index (Benchmark) - 8.66% 9.83% 9.53% 12,513CRISIL 1 Year T-Bill (Additional Benchmark) - 8.22% 7.27% 7.93% 12,068
Past performance may or may not be sustained in future. Calculations are based on Growth Option NAV. Since inception returns are calculated on ` 10 invested at inception. Since inception returns for Axis Fixed Income Opportunities Fund - Growth Option & Direct Plan - Growth Option are calculated from 15th July 2014. Devang Shah manages 46 schemes. Please refer to annexure on Page 19 & 20 for performance of all schemes managed by the fund manager.
High
Inte
rnal
Rat
e Se
nsiti
vity
Credit Quality
Med
Low
High Mid Low
For Statutory Details & Risk Factors please refer page 25.
Total Debt 91.55Corporate Bond 65.25Power Finance Corporation Limited CRISIL AAA 9.25LIC Housing Finance Limited CRISIL AAA 7.42Reliance Jio Infocomm Limited CRISIL AAA 6.30Rural Electrification Corporation Limited CRISIL AAA 5.53Power Grid Corporation of India Limited CRISIL AAA 3.73Nirchem Cement Limited CRISIL AA 3.32Cholamandalam Investment and Finance Company Limited ICRA AA 2.64Birla Corporation Limited ICRA AA 2.64Nirma Ltd CRISIL AA 1.97Ujjivan Financial Services Limited ICRA A+ 1.96Dewan Housing Finance Corporation Limited BWR AAA 1.95IndoStar Capital Finance Ltd CARE AA- 1.66Indiabulls Housing Finance Limited CARE AAA 1.64National Highways Auth Of Ind CRISIL AAA 1.64Shriram Transport Finance Company Limited CRISIL AA+ 1.52India Infoline Finance Ltd ICRA AA 1.48Indiabulls Housing Finance Limited BWR AAA 1.43Small Industries Dev Bank of India CARE AAA 1.34Hansdeep Industries & Trading Co. Ltd. CARE AA(SO) 1.34HDFC Limited CRISIL AAA 0.99Adani Transmission Limited IND AA+ 0.99Adani Properties Pvt. Ltd. BWR AA-(SO) 0.98Tata Motors Limited CARE AA+ 0.82ECL Finance Ltd ICRA AA 0.66ICICI Bank Limited ICRA AAA 0.65Tata Power Company Limited ICRA AA 0.60NABARD CRISIL AAA 0.54Tata Sons Ltd CRISIL AAA 0.20IDFC Bank Limited ICRA AAA 0.07
^Certificate of Deposit/Commercial Paper * Backed by credit enhancement of Reliance Capital Ltd. and IFMR Capital Pvt. Ltd. ** Secured by shares of Emami Ltd ^^ Secured by shares of Zee Entertainment Enterprises Ltd. & Dish TV India Ltd
Government Bond Sovereign 12.60Zero Coupon Bond 11.40Amri Hospitals Ltd BWR A+(SO) 2.35SVL Ltd. ICRA AA(SO) 1.75Dewan Housing Finance Corporation Limited CARE AAA 1.68Magma Fincorp Limited CARE AA- 1.12JM Financial Products Ltd ICRA AA 1.08Sprit Textile Pvt. Ltd.^^ BWR A+(SO) 0.97Edelweiss Commodities Services Ltd CARE AA 0.84Dev Infracity Pvt Ltd** IND AA- 0.69Cholamandalam Investment and Finance Company Limited ICRA AA 0.47India Infoline Finance Ltd ICRA AA 0.39Asirvad Microfinance Pvt Ltd ICRA A+(SO) 0.03Arohan Financial Services Pvt Ltd* ICRA A+(SO) 0.02Sonata Finance Pvt Ltd ICRA A+(SO) 0.01State Government Bond Sovereign 2.29Total Money Market Instruments^ 3.13Others 3.13Barclays Invest & Loans India Ltd ICRA A1+ 1.54IFMR Capital Finance Pvt Ltd ICRA A1+ 1.25Tata Capital Financial Services Ltd ICRA A1+ 0.33Net Current Assets 5.33
Net Assets 100%
65.25%
12.60%
11.40%
8.45%2.29%
52.80%19.18%
14.89%
5.34%4.45% 3.33%

FUND STYLE
TYPE OF SCHEME / INVESTMENT OBJECTIVEAn Open-ended Debt Scheme
To generate stable returns with a low risk strategy while maintaining liquidity through a portfolio comprising of debt and money market instruments. However, there can be no assurance that the investment objective of the scheme will be achieved.
DATE OF ALLOTMENT22nd January 2010
FUND MANAGER
Devang ShahWork experience: 11 years
He has been managing this fund since 5th November 2012.
LATEST NAV (`) as on 30th December 2016
Regular Plan Direct Plan Retail PlanGrowth 17.5100 18.0906 17.3125Regular Dividend 11.7138 11.0202 - Monthly Dividend 10.2174 10.0682 10.0656Bonus 17.6103 - -Weekly Dividend 10.2011 10.2057 10.1099
BENCHMARK
Crisil Short Term Bond Fund Index
FUND SIZE (`)Monthly Average AUM 6,348.17 Crore Latest AUM 5,642.29 Crore (as on 31st December 2016)
AVERAGE MATURITY*3 years
MODIFIED DURATION*2.3 years
PORTFOLIO YIELD (YIELD TO MATURITY &)7.47%
MINIMUM INVESTMENT AMOUNT (`)5,000/1
MINIMUM ADDITIONAL PURCHASE AMOUNT (`)1,000/1
MINIMUM SIP INSTALLMENT AMOUNT (`)1000/1
LOAD STRUCTUREEntry load - Not applicable
Exit load - NIL (w.e.f. 28th August 2015)
PORTFOLIO
DIVIDENDS
FACTSHEET30th December 2016
High
Inte
rnal
Rat
e Se
nsiti
vity
Credit Quality
Med
Low
High Mid Low
& The yield to maturity given above is based on the portfolio of funds as on date given above. This should not be taken as an indication of the returns that maybe generated by the fund and the securities bought by the fund may or may not be held till their respective maturities. The calculation is based on the invested corpus.
Company Name Rating % of Assets
Company Name Rating % of Assets
Past performance may or may not be sustained in future. Calculations are based on Growth Option NAV. Since inception returns are calculated on ` 10 invested at inception. Since inception returns for Axis Short Term Fund - Growth Option, Direct Plan & Retail Plan - Growth Option are calculated from 22nd January 2010, 1st January 2013 & 2nd March 2010 respectively. Retail Plan was introduced on 2nd March 2010. and has been discontinued from 1st October 2012. Direct Plan was introduced on 1st January 2013.Devang Shah manages 46 schemes. Please refer to annexure on Page 19 & 20 for performance of all schemes managed by the fund manager.
Credit Risk Rating[ICRA]AAAmfs$
Option Record Date
Retail Plan Direct PlanDividend (` Per unit) NAV per
unit (Cum Dividend
NAV per unit (Ex
Dividend)
Dividend (` Per unit) NAV per unit (Cum Dividend)
NAV per unit (Ex
Dividend)
Dividend (` Per unit) NAV per unit (Cum Dividend)
NAV per unit (Ex
Dividend)Individuals/
HUF Others Individuals/ HUF Others Individuals/
HUF Others
MonthlyDividend
Dec 26, 2016 0.0547 0.0507 10.2775 10.2016 0.0572 0.0530 10.1293 10.0501 0.0624 0.0578 10.1384 10.0519Nov 25, 2016 0.0724 0.0671 10.4364 10.3361 0.0742 0.0688 10.2899 10.1870 0.0830 0.0769 10.3053 10.1903Oct 25, 2016 0.0571 0.0529 10.3190 10.2399 0.0581 0.0539 10.1767 10.0962 0.0839 0.0777 10.2216 10.1054
^Certificate of Deposit/Commercial Paper
Please note that after the payment of dividend, the NAV falls to the extent of dividend, distribution tax and cess wherever applicable.Past performance may or may not be sustained in future.Face Value of units is ` 10Dividends disclosed above are for the past 3 months. * For instruments with put/call option, the put/call date has been taken as the maturity date.
13
COMPOSITION BY ASSET (%) COMPOSITION BY RATING (%)
¢ Corporate Bond ¢ Government Bond ¢ Total Money Market Instruments^ ¢ State Government Bond ¢ Zero Coupon Bond ^ Includes Net Current Assets
SCHEME PERFORMANCE (as on 30th December 2016)
Dec 31, 2013 To Dec 31,
2014
Dec 31, 2014 To Dec 31,
2015
Dec 31, 2015 To Dec 30,
2016
Since Inception
Current Value of Investment if
` 10,000 wasinvested on
inception date
Date of inceptionAbsolute
Return (%)Absolute
Return (%)Absolute
Return (%) CAGR (%)
Axis Short Term Fund - Growth 10.04% 8.11% 9.64% 8.40% 17,51022-Jan-
10Crisil Short Term Bond Fund Index (Benchmark) 10.47% 8.66% 9.83% 8.41% 17,518Crisil 1 Year T-Bill Index (Additional Benchmark) 8.56% 8.22% 7.27% 6.77% 15,753Axis Short Term Fund - Direct Plan - Growth 11.03% 9.04% 10.40% 9.64% 14,445
01-Jan-13
Crisil Short Term Bond Fund Index (Benchmark) 10.47% 8.66% 9.83% 9.30% 14,267Crisil 1 Year T-Bill Index (Additional Benchmark) 8.56% 8.22% 7.27% 7.47% 13,336Axis Short Term Fund - Retail Plan - Growth 10.08% 8.10% 9.64% 8.36% 17,313
02-Mar-10
Crisil Short Term Bond Fund Index (Benchmark) 10.47% 8.66% 9.83% 8.51% 17,482Crisil 1 Year T-Bill Index (Additional Benchmark) 8.56% 8.22% 7.27% 6.84% 15,716
¢ ICRA A1+/ CRISIL A1+/ CARE A1+/ CRISIL AAA/ CARE AAA/ ICRA AAA/IND AAA/ BWR AAA & Equivalent ¢ SOV ¢ CRISIL AA+/ CARE AA+/ ICRA AA+/ BWR AA+ ¢ICRA AA/ CRISIL AA
Total Debt 93.69Corporate Bond 77.05Power Finance Corporation Limited CRISIL AAA 11.33Reliance Jio Infocomm Limited CRISIL AAA 8.74LIC Housing Finance Limited CRISIL AAA 6.46HDFC Limited CRISIL AAA 6.30NABARD CRISIL AAA 5.60Rural Electrification Corporation Limited CRISIL AAA 3.15Power Grid Corporation of India Limited CRISIL AAA 2.97Indiabulls Housing Finance Limited BWR AAA 2.67Tata Capital Financial Services Ltd CRISIL AA+ 2.58Dewan Housing Finance Corporation Limited BWR AAA 2.34Small Industries Dev Bank of India CARE AAA 2.23HDB Financial Services Ltd CRISIL AAA 2.23Shriram Transport Finance Company Limited CRISIL AA+ 1.91Vodafone Mobile Services Ltd IND AAA 1.80Tata Sons Ltd CRISIL AAA 1.71Mahindra & Mahindra Financial Services Limited IND AAA 1.60Gruh Finance Limited ICRA AAA 1.34Nirma Ltd CRISIL AA 1.25UPL Limited BWR AA+ 1.02National Housing Bank CRISIL AAA 0.98Export Import Bank of India CRISIL AAA 0.91Tata Capital Financial Services Ltd ICRA AA+ 0.90Cholamandalam Investment and Finance Company Limited ICRA AA 0.88IDFC Bank Limited ICRA AAA 0.73L&T Infrastructure Finance Co Ltd CARE AA+ 0.71Indiabulls Housing Finance Limited CARE AAA 0.56Dewan Housing Finance Corporation Limited CARE AAA 0.53ICICI Bank Limited ICRA AAA 0.53Emami Limited CRISIL AA+ 0.52Tata Motors Limited CARE AA+ 0.47National Highways Auth Of Ind CRISIL AAA 0.44Tata Power Company Limited ICRA AA 0.44Rural Electrification Corporation Limited CARE AAA 0.37UltraTech Cement Limited CRISIL AAA 0.33
For Statutory Details & Risk Factors please refer page 25.
Bajaj Finance Limited CARE AAA 0.19Daimler Financial Services India Pvt Ltd IND AAA 0.18LIC Housing Finance Limited CARE AAA 0.09Indian Railway Finance Corp Ltd CRISIL AAA 0.07Mahindra Vehicle Mfg Ltd ICRA AAA 0.02Government Bond Sovereign 8.98State Government Bond Sovereign 5.34Zero Coupon Bond 2.32Dewan Housing Finance Corporation Limited CARE AAA 1.79Indiabulls Housing Finance Limited CARE AAA 0.24Mahindra & Mahindra Financial Services Limited IND AAA 0.19HDFC Limited ICRA AAA 0.08Axis Finance Limited IND AAA 0.02HDB Financial Services Ltd CRISIL AAA 0.004Total Money Market Instruments^ 3.41Banks 1.87Corporation Bank CRISIL A1+ 0.44IndusInd Bank Limited CRISIL A1+ 0.42Andhra Bank CARE A1+ 0.33Dena Bank CRISIL A1+ 0.26Vijaya Bank CARE A1+ 0.21Kotak Mahindra Bank Limited CRISIL A1+ 0.07Punjab & Sind Bank ICRA A1+ 0.07IDBI Bank Limited CRISIL A1+ 0.05ICICI Bank Limited ICRA A1+ 0.03Others 1.53L&T Fincorp Limited CARE A1+ 1.45Reliance Jio Infocomm Limited CARE A1+ 0.09Net Current Assets 2.90
Net Assets 100%
77.05%
8.98%
6.31%
5.34% 2.32%
75.02%
14.32%
8.09% 2.57%

FUND STYLE
TYPE OF SCHEME / INVESTMENT OBJECTIVEAn Open-ended Debt Scheme
To generate stable returns by investing predominantly in debt & money market instruments issued by Banks, Public Sector Units (PSUs) & Public Financial Institutions (PFIs).The scheme shall endeavor to generate optimum returns with low credit risk.
DATE OF ALLOTMENT8th June 2012
FUND MANAGER
Aditya PagariaWork experience: 9 years
He has been managing this fund since 13th August 2016.
LATEST NAV (`) as on 30th December 2016
Regular Plan Direct PlanGrowth 1468.8409 1479.4110Daily Dividend 1008.0388 1008.0388Weekly Dividend 1008.0979 1008.2165Monthly Dividend 1008.8539 1008.8744Bonus - 1479.8187
BENCHMARK
Crisil Short Term Bond Fund Index
FUND SIZE (`)Monthly Average AUM 607.00 Crore Latest AUM 611.39 Crore
(as on 31st December 2016)
AVERAGE MATURITY1.7 years
MODIFIED DURATION1.5 years
PORTFOLIO YIELD (YIELD TO MATURITY &)6.94%
MINIMUM INVESTMENT AMOUNT (`)5,000/1
MINIMUM ADDITIONAL PURCHASE AMOUNT (`)1,000/1
MINIMUM SIP INSTALLMENT AMOUNT (`)1000/1
LOAD STRUCTUREEntry load - Not applicable
Exit load - Nil (w.e.f. 14th July 2014)
PORTFOLIO
FACTSHEET30th December 2016
High
Inte
rnal
Rat
e Se
nsiti
vity
Credit Quality
Med
Low
High Mid Low
Company Name Rating % of Assets
DIVIDENDS
Please note that after the payment of dividend, the NAV falls to the extent of dividend, distribution tax and cess wherever applicable.Past performance may or may not be sustained in future.Face Value of units is ` 1000Dividends disclosed above are for the past 3 months.
Option Record Date
Direct PlanDividend (` Per unit) NAV per
unit (Cum Dividend)
NAV per unit (Ex
Dividend)
Dividend (` Per unit) NAV per unit (Cum Dividend)
NAV per unit (Ex
Dividend) Individu-als/ HUF Others Individuals/
HUF Others
MonthlyDividend
Dec 26, 2016 0.1263 - 1,007.6360 1,007.4611 0.2321 - 1,007.7839 1,007.4622Nov 25, 2016 7.0845 - 1,017.2700 1,007.4611 7.1922 - 1,017.4198 1,007.4622Oct 25, 2016 4.4917 - 1,011.0839 1,004.8649 4.5911 - 1,011.2222 1,004.8656
Credit Risk Rating[ICRA]AAAmfs$
^ Certificate of Deposit
& The yield to maturity given above is based on the portfolio of funds as on date given above. This should not be taken as an indication of the returns that maybe generated by the fund and the securities bought by the fund may or may not be held till their respective maturities. The calculation is based on the invested corpus.
14
COMPOSITION BY ASSET (%) COMPOSITION BY RATING (%)
¢ ICRA A1+/CRISIL A1+/CARE A1+/CRISIL AAA/CARE AAA/BWR AAA & Equivalent ¢ IND AA+ ¢ SOV
¢ Corporate Bond ¢ Total Money Market Instruments^ ¢ Government Bond¢ Zero Coupon Bond^ Includes Net Current Assets
SCHEME PERFORMANCE (as on 30th December 2016)
Dec 31, 2013 To Dec 31,
2014
Dec 31, 2014 To Dec 31,
2015
Dec 31, 2015 To Dec 30,
2016
Since Inception
Current Value of Investment if
` 10,000 wasinvested on
inception date
Date of inceptionAbsolute
Return (%)Absolute
Return (%)Absolute
Return (%)CAGR
(%)
Axis Banking & PSU Debt Fund - Growth 9.27% 8.50% 8.37% 8.79% 14,68808-Jun-
12Crisil Short Term Bond Fund Index (Benchmark) 10.47% 8.66% 9.83% 9.29% 14,999Crisil 1 Year T-Bill Index (Additional Benchmark) 8.56% 8.22% 7.27% 7.49% 13,908Axis Banking & PSU Debt Fund - Direct Plan - Growth
9.50% 8.68% 8.56% 8.88% 14,05201-Jan-
13Crisil Short Term Bond Fund Index (Benchmark) 10.47% 8.66% 9.83% 9.30% 14,267Crisil 1 Year T-Bill Index (Additional Benchmark) 8.56% 8.22% 7.27% 7.47% 13,336
For Statutory Details & Risk Factors please refer page 25.
Past performance may or may not be sustained in future. Calculations are based on Growth Option NAV. Since inception returns are calculated on ` 1,000 invested at inception. Since inception returns for Axis Banking & PSU Debt Fund - Growth Option & Direct Plan - Growth Option are calculated from 8th June 2012 & 1st January 2013 respectively. Direct Plan was introduced on 1st January 2013.Aditya Pagaria manages 3 schemes. Please refer to annexure on Page 19 & 20 for performance of all schemes managed by the fund manager.
Company Name Rating % of Assets
Total Debt 57.73Corporate Bond 54.18Power Finance Corporation Limited CRISIL AAA 10.09Rural Electrification Corporation Limited CRISIL AAA 8.49NABARD CRISIL AAA 8.45Export Import Bank of India CRISIL AAA 5.67LIC Housing Finance Limited CRISIL AAA 4.13National Highways Auth Of Ind CRISIL AAA 4.09Indiabulls Housing Finance Limited BWR AAA 4.07Mahindra Rural Housing Finance IND AA+ 4.06Dewan Housing Finance Corporation Limited BWR AAA 2.61Small Industries Dev Bank of India CARE AAA 2.51Government Bond Sovereign 2.13Zero Coupon Bond 1.42NABARD CRISIL AAA 1.42Total Money Market Instruments^ 38.74Banks 38.74Kotak Mahindra Bank Limited CRISIL A1+ 9.72
Punjab & Sind Bank ICRA A1+ 9.54Corporation Bank CRISIL A1+ 4.05HDFC Bank Limited CARE A1+ 4.04IndusInd Bank Limited CRISIL A1+ 3.86Andhra Bank CARE A1+ 3.40Vijaya Bank CARE A1+ 2.10IDBI Bank Limited CRISIL A1+ 2.03Net Current Assets 3.54
Net Assets 100%
42.27%54.18%
2.13% 1.42%
93.81%
4.06% 2.13%

FUND STYLE
TYPE OF SCHEME / INVESTMENT OBJECTIVEAn Open-ended Debt Scheme
To provide optimal returns and liquidity to the investors by investing primarily in a mix of money market and short term debt instruments which results in a portfolio having marginally higher maturity as compared to a liquid fund at the same time maintaining a balance between safety and liquidity. However, there can be no assurance that the investment objective of the Scheme will be achieved.
DATE OF ALLOTMENT9th October 2009
FUND MANAGER
Devang ShahWork experience: 11 yearsHe has been managing this fund since 07th June 2016.
Aditya PagariaWork experience: 9 yearsHe has been managing this fund since 13th August 2016.
LATEST NAV (`) as on 30th December 2016
Regular Plan Direct Plan Retail PlanGrowth 1783.6686 1811.0847 1679.2650Daily Dividend 1006.2334 1007.2893 1005.4758Weekly Dividend 1006.7262 1005.3628 1005.2488Monthly Dividend 1006.1731 1006.2125 1006.0938Bonus - 1809.5507 -
BENCHMARK
Crisil Liquid Fund Index
FUND SIZE (`)Monthly Average AUM 2,561.42 Crore Latest AUM 2,351.11 Crore (as on 31st December 2016)
AVERAGE MATURITY*186 days
MODIFIED DURATION*165 days
PORTFOLIO YIELD (YIELD TO MATURITY &)7.06%
MINIMUM INVESTMENT AMOUNT (`)5,000/1
MINIMUM ADDITIONAL PURCHASE AMOUNT (`)1,000/1
MINIMUM SIP INSTALLMENT AMOUNT (`)1000/1
LOAD STRUCTUREEntry load - Not applicable
Exit load - Nil
PORTFOLIO
FACTSHEET30th December 2016
High
Inte
rnal
Rat
e Se
nsiti
vity
Credit Quality
Med
Low
High Mid Low
Please note that after the payment of dividend, the NAV falls to the extent of dividend, distribution tax and cess wherever applicable.Past performance may or may not be sustained in future. Face Value of units is ` 1000Dividends disclosed above are for the past 3 months. * For instruments with put/call option, the put/call date has been taken as the maturity date.
For Statutory Details & Risk Factors please refer page 25.
Company Name Rating % of Assets
Company Name Rating % of Assets
Credit Risk Rating[ICRA]A1+mfs^
DIVIDENDS
Past performance may or may not be sustained in future. Calculations are based on Growth Option NAV. Since inception returns are calculated on ` 1,000 invested at inception. Since inception returns for Axis Treasury Advantage Fund – Growth, Direct Plan - Growth & Retail Plan - Growth Option are calculated from 9th October 2009, 1st January 2013 & 3rd March 2010 respectively. Retail Plan was introduced on 3rd March 2010 and has been discontinued from 1st October 2012. Direct Plan was introduced on 1st January 2013.Devang Shah manages 46 schemes & Aditya Pagaria manages 3 schemes &. Please refer to annexure on 19 & 20 for performance of all schemes managed by the fund manager.
Option Record Date
Retail Plan Direct PlanDividend (` Per unit) NAV per
unit (Cum Dividend
NAV per unit (Ex
Dividend)
Dividend (` Per unit) NAV per unit (Cum Dividend)
NAV per unit (Ex
Dividend)
Dividend (` Per unit) NAV per unit (Cum Dividend)
NAV per unit (Ex
Dividend)Individuals/
HUF Others Individuals/ HUF Others Individuals/
HUF Others
MonthlyDividend
Dec 26, 2016 1.6571 1.5353 1,007.7458 1,005.4514 1.2371 - 1,007.1613 1,005.4482 1.8680 1.7383 1,008.0392 1,005.4530Nov 25, 2016 4.3173 3.9999 1,011.4289 1,005.4514 3.8944 - 1,010.8405 1,005.4482 4.5296 4.2037 1,011.7243 1,005.4530
Oct 25, 2016 4.4325 4.1066 1,008.8497 1,002.7127 4.0380 - 1,008.3024 1,002.7117 4.5209 4.1830 1,008.9731 1,002.7138
& The yield to maturity given above is based on the portfolio of funds as on date given above. This should not be taken as an indication of the returns that maybe generated by the fund and the securities bought by the fund may or may not be held till their respective maturities. The calculation is based on the invested corpus.
15
COMPOSITION BY ASSET (%) COMPOSITION BY RATING (%)
¢ Corporate Bond ¢ Total Money Market Instruments^ ¢ Zero Coupon Bond ^ Includes Net Current Assets
SCHEME PERFORMANCE (as on 30th December 2016)
Dec 31, 2013 To Dec 31,
2014
Dec 31, 2014 To Dec 31,
2015
Dec 31, 2015 To Dec 30,
2016
Since Inception
Current Value of Investment if
` 10,000 wasinvested on
inception date
Date of inceptionAbsolute
Return (%)Absolute
Return (%)Absolute
Return (%) CAGR (%)
Axis Treasury Advantage Fund - Growth 8.72% 8.53% 8.16% 8.33% 17,83709-Oct-
09Crisil Liquid Fund Index (Benchmark) 9.21% 8.23% 7.48% 7.79% 17,198
Crisil 1 Year T-Bill Index (Additional Benchmark) 8.56% 8.22% 7.27% 6.60% 15,876
Axis Treasury Advantage Fund - Direct Plan - Growth 9.28% 8.90% 8.59% 9.12% 14,17401-Jan-
13Crisil Liquid Fund Index (Benchmark) 9.21% 8.23% 7.48% 8.49% 13,850
Crisil 1 Year T-Bill Index (Additional Benchmark) 8.56% 8.22% 7.27% 7.47% 13,336
Axis Treasury Advantage Fund - Retail Plan - Growth 7.98% 7.84% 7.46% 7.88% 16,79303-Mar-
10Crisil Liquid Fund Index (Benchmark) 9.21% 8.23% 7.48% 8.07% 16,995
Crisil 1 Year T-Bill Index (Additional Benchmark) 8.56% 8.22% 7.27% 6.84% 15,716
¢ ICRA A1+/ CRISIL A1+/ CARE A1+/IND A1+/ CRISIL AAA/CARE AAA/ICRA AAA/BWR AAA/IND AAA & Equivalent ¢ CRISIL AA+/CARE AA+/IND AA+¢ ICRA AA ¢ SOV
Total Money Market Instruments^ 27.34Banks 11.39Corporation Bank CRISIL A1+ 3.15Punjab & Sind Bank ICRA A1+ 2.10IDBI Bank Limited CRISIL A1+ 1.27Small Industries Dev Bank of India CARE A1+ 1.05ICICI Bank Limited ICRA A1+ 1.04Export Import Bank of India CRISIL A1+ 1.01Andhra Bank CARE A1+ 0.84Dena Bank CRISIL A1+ 0.42IndusInd Bank Limited CRISIL A1+ 0.21The South Indian Bank Limited CARE A1+ 0.21Kotak Mahindra Bank Limited CRISIL A1+ 0.08Others 12.34Piramal Finance Private Limited ICRA A1+ 4.41Adani Transmission Limited IND A1+ 2.11Adani Ports and Special Economic Zone Limited ICRA A1+ 2.10L&T Fincorp Limited CARE A1+ 2.04Family Credit Ltd CARE A1+ 1.05Steel Authority of India Limited CARE A1+ 0.21Rural Electrification Corporation Limited CARE A1+ 0.21Birla Corporation Limited CRISIL A1+ 0.21Treasury Bill 3.6135 Days CMB Sovereign 3.1891 Days Tbill Sovereign 0.42Total Debt 52.77Corporate Bond 47.65NABARD CRISIL AAA 6.92Power Finance Corporation Limited CRISIL AAA 6.18
Tata Capital Financial Services Ltd CRISIL AA+ 4.28Export Import Bank of India CRISIL AAA 3.20Citicorp Finance India Ltd ICRA AAA 3.19Indiabulls Housing Finance Limited BWR AAA 3.19LIC Housing Finance Limited CRISIL AAA 2.17Reliance Jio Infocomm Limited CRISIL AAA 2.16National Housing Bank CRISIL AAA 2.13Piramal Finance Private Limited ICRA AA 2.13HDFC Limited CRISIL AAA 1.81Daimler Financial Services India Pvt Ltd IND AAA 1.70Small Industries Dev Bank of India CARE AAA 1.40L&T Infrastructure Finance Co Ltd CARE AA+ 1.07HDB Financial Services Ltd CRISIL AAA 1.07Indiabulls Housing Finance Limited CARE AAA 1.06Tata Power Company Limited ICRA AA 1.06Mahindra Rural Housing Finance IND AA+ 1.06Shriram Transport Finance Company Limited CRISIL AA+ 0.81Cholamandalam Investment and Finance Company Limited ICRA AA 0.64India Infoline Finance Ltd ICRA AA 0.43Zero Coupon Bond 5.12Dewan Housing Finance Corporation Limited CARE AAA 3.39JM Financial Products Ltd ICRA AA 1.17India Infoline Finance Ltd ICRA AA 0.56Net Current Assets 19.90
Net Assets 100%^Certificate of Deposit/Commercial Paper/Treasury Bill
47.65%
47.23%
5.12%
83.19%
7.21%
5.99%3.61%

FUND STYLE
TYPE OF SCHEME / INVESTMENT OBJECTIVEAn Open-ended Liquid Scheme
To provide a high level of liquidity with reasonable returns commensurating with low risk through a portfolio of money market and debt securities. However, there can be no assurance that the investment objective of the Scheme will be achieved.
DATE OF ALLOTMENT9th October 2009
FUND MANAGER
Devang ShahWork experience: 11 years
He has been managing this fund since 5th November 2012.
Aditya PagariaWork experience: 9 years
He has been managing this fund since 13th August 2016.
LATEST NAV (`) as on 31st December 2016
Regular Plan Direct Plan Retail PlanGrowth 1768.7541 1773.5086 1691.1491Daily Dividend 1000.8759 1000.6413 1000.6413Weekly Dividend 1002.9996 1003.0106 1001.3588Monthly Dividend 1001.4964 1001.1368 1001.0554Bonus - 1773.4082 -
BENCHMARK
Crisil Liquid Fund Index
FUND SIZE (`)Monthly Average AUM 12,791.48 Crore Latest AUM 9,380.28 Crore (as on 31st December 2016)
AVERAGE MATURITY57 days
MODIFIED DURATION54 days
PORTFOLIO YIELD (YIELD TO MATURITY &)6.45%
MINIMUM INVESTMENT AMOUNT (`)5,000/1
MINIMUM ADDITIONAL PURCHASE AMOUNT (`)1,000/1
LOAD STRUCTUREEntry load - Not applicable
Exit load - Nil
PORTFOLIO
FACTSHEET31st December 2016
High
Inte
rnal
Rat
e Se
nsiti
vity
Credit Quality
Med
Low
High Mid Low
Please note that after the payment of dividend, the NAV falls to the extent of dividend, distribution tax and cess wherever applicable.Past performance may or may not be sustained in future. Face Value of units is ` 1000Dividends disclosed above are for the past 3 months.& The yield to maturity given above is based on the portfolio of funds as on date given above. This should not be taken as an indication of the returns that maybe generated by the fund and the securities bought by the fund may or may not be held till their respective maturities. The calculation is based on the invested corpus.
Company Name Rating % of Assets
Company Name Rating % of Assets
Credit Risk Rating[ICRA]A1+mfs^ CARE AAA mfs^
DIVIDENDS
Past performance may or may not be sustained in future. Calculations are based on Growth Option NAV. Since inception returns are calculated on ` 1,000 invested at inception.Since inception returns for Axis Liquid Fund Plan - Growth Option, Retail Plan - Growth Option & Direct Plan - Growth Option are calculated from 9th October 2009, 1st March 2010 & 31st December 2012 respectively. Retail Plan was introduced on 1st March 2010 and has been discontinued from 1st October 2012. Direct Plan was introduced on 31st December 2012.Devang Shah manages 46 schemes & Aditya Pagaria 3 schemes. Please refer to annexure on Page 19 & 20 for performance of all schemes managed by the fund manager.
Option Record Date
Retail Plan Direct PlanDividend (` Per unit) NAV per
unit (Cum Dividend
NAV per unit (Ex
Dividend)
Dividend (` Per unit) NAV per unit (Cum Dividend)
NAV per unit (Ex
Dividend)
Dividend (` Per unit) NAV per unit (Cum Dividend)
NAV per unit (Ex
Dividend)Individuals/
HUF Others Individuals/ HUF Others Individuals/
HUF Others
MonthlyDividend
Dec 26, 2016 3.9033 3.6163 1,005.9939 1,000.5896 3.5681 - 1,005.1604 1,000.2195 3.9515 - 1,005.6902 1,000.2192Nov 25, 2016 4.2074 3.8980 1,006.4149 1,000.5896 3.8851 - 1,005.5978 1,000.2195 4.2562 - 1,006.1121 1,000.2192Oct 25, 2016 3.9256 3.6369 1,006.0247 1,000.5896 3.6290 - 1,005.2430 1,000.2195 3.9704 - 1,005.7164 1,000.2192
16
COMPOSITION BY ASSET (%)
¢ Total Money Market Instruments^ ¢ Corporate Bond ^ Includes Net Current Assets
SCHEME PERFORMANCE (as on 31st December 2016) 7 Days 15 Days 30 Days
Dec 31, 2013 To Dec 31, 2014
Dec 31, 2014 To Dec 31, 2015
Dec 31, 2015 To Dec 31, 2016
SinceInception
Current Value of Investment if ` 10,000 was invested on inception
date
Date of incep-tion
Annualised Return (%) Absolute Return (%)
Absolute Return (%)
Absolute Return (%)
CAGR (%)
Axis Liquid Fund - Growth 6.81% 6.69% 6.57% 9.10% 8.35% 7.64% 8.20% 17,688 09-Oct-09
Crisil Liquid Fund Index (Benchmark) 6.98% 6.52% 6.03% 9.21% 8.23% 7.50% 7.79% 17,201Crisil 1 Year T-Bill Index (Additional Benchmark) 3.99% 4.18% 2.82% 8.56% 8.22% 7.29% 6.60% 15,878Axis Liquid Fund - Direct Plan - Growth 6.90% 6.77% 6.66% 9.16% 8.42% 7.73% 8.64% 13,932 31-
Dec-12
Crisil Liquid Fund Index (Benchmark) 6.98% 6.52% 6.03% 9.21% 8.23% 7.50% 8.49% 13,855Crisil 1 Year T-Bill Index (Additional Benchmark) 3.99% 4.18% 2.82% 8.56% 8.22% 7.29% 7.47% 13,344Axis Liquid Fund - Retail Plan - Growth 6.25% 6.11% 5.99% 8.55% 7.79% 7.08% 7.98% 16,911 01-
Mar-10
Crisil Liquid Fund Index (Benchmark) 6.98% 6.52% 6.03% 9.21% 8.23% 7.50% 8.07% 17,008Crisil 1 Year T-Bill Index (Additional Benchmark) 3.99% 4.18% 2.82% 8.56% 8.22% 7.29% 6.84% 15,720
Total Money Market Instruments^ 118.56Banks 22.46IDFC Bank Limited ICRA A1+ 9.44Punjab & Sind Bank ICRA A1+ 4.25RBL Bank Limited ICRA A1+ 3.77The South Indian Bank Limited CARE A1+ 2.11Yes Bank Limited ICRA A1+ 1.06Small Industries Dev Bank of India CARE A1+ 1.06Andhra Bank CARE A1+ 0.26Corporation Bank CRISIL A1+ 0.26NABARD CRISIL A1+ 0.26Others 67.71Piramal Finance Private Limited ICRA A1+ 4.71Indiabulls Housing Finance Limited CRISIL A1+ 4.30IIFL Wealth Finance Limited ICRA A1+ 3.97Small Industries Dev Bank of India CARE A1+ 3.71Bharti Airtel Limited ICRA A1+ 3.43Edelweiss Commodities Services Ltd CRISIL A1+ 3.18UPL Limited CRISIL A1+ 3.16Vedanta Limited CRISIL A1+ 3.16Steel Authority of India Limited IND A1+ 3.02Adani Ports and Special Economic Zone Limited ICRA A1+ 2.97JSW Steel Limited CARE A1+ 2.63HDFC Limited ICRA A1+ 2.12Tata Capital Financial Services Ltd ICRA A1+ 2.12Tata Capital Housing Finance Ltd CRISIL A1+ 2.02Reliance Jio Infocomm Limited CARE A1+ 1.96Aditya Birla Fashion and Retail Limited CRISIL A1+ 1.85Gruh Finance Limited CRISIL A1+ 1.57Hinduja Leyland Finance Ltd CARE A1+ 1.57JM Financial Products Ltd ICRA A1+ 1.33JM Financial Limited ICRA A1+ 1.33TGS Investment & Trade Pvt Ltd ICRA A1+ 1.06Kotak Mahindra Prime Ltd ICRA A1+ 1.06
Kotak Mahindra Prime Ltd CRISIL A1+ 1.06Tata Motors Finance Ltd ICRA A1+ 1.06Adani Gas Ltd. CARE A1+ 1.06TVS Credit Services Ltd CRISIL A1+ 1.06Turquoise Invest & Finance Pvt Ltd CRISIL A1+ 1.05TVS Credit Services Ltd ICRA A1+ 1.05Hero Fincorp Limited CRISIL A1+ 0.96Mahindra & Mahindra Financial Services Limited CRISIL A1+ 0.95Trapti Trading & Invest Pvt Ltd ICRA A1+ 0.80Adani Transmission Limited IND A1+ 0.80Ujjivan Financial Services Limited CRISIL A1+ 0.53IFMR Capital Finance Pvt Ltd ICRA A1+ 0.53Power Finance Corporation Limited CRISIL A1+ 0.27Vodafone India Ltd CRISIL A1+ 0.26India Infoline Finance Ltd ICRA A1+ 0.05Treasury Bill 28.3891 Days Tbill Sovereign 12.1528 Days CMB Sovereign 10.89182 Days Tbill Sovereign 3.28364 Days Tbill Sovereign 2.06Total Debt 0.48Corporate Bond 0.48HDFC Limited CRISIL AAA 0.48Net Current Assets -19.04
Net Assets 100%
COMPOSITION BY RATING (%)
¢ ICRA A1+/CRISIL A1+/CARE A1+/IND A1+/ CRISIL AAA & Equivalent ¢ SOV
^Certificate of Deposit/Commercial Paper/Treasury Bill
For Statutory Details & Risk Factors please refer page 25.
99.52%
0.48%
71.62%
28.38%

TYPE OF SCHEME / INVESTMENT OBJECTIVEAn Open-ended arbitrage fund
To generate income through low volatility absolute return strategies that take advantage of opportunities in the cash and the derivative segments of the equity markets including the arbitrage opportunities available within the derivative segment, by using other derivative based strategies and by investing the balance in debt and money market instruments. However, there is no assurance or guarantee that the investment objective of the Scheme will be achieved. The Scheme does not assure or guarantee any returns.
DATE OF ALLOTMENT14th August 2014
FUND MANAGER
Ashwin Patni Work experience: 13 years He has been managing the fund since 27th April 2015
Devang ShahWork experience: 11 years
He has been managing this fund since inception.
LATEST NAV (`) as on 30th December 2016
Regular Plan Direct PlanGrowth 11.8070 12.0469Dividend 10.5248 10.8493
BENCHMARK
Crisil Liquid Fund Index
FUND SIZE (`)Monthly Average AUM 361.66 Crore Latest AUM 413.30 Crore (as on 31st December 2016)
MINIMUM INVESTMENT AMOUNT (`)5,000/1
MINIMUM ADDITIONAL PURCHASE AMOUNT (`)100/1
MINIMUM SIP INSTALLMENT AMOUNT (`)1000/1
LOAD STRUCTUREEntry load - NA
Exit load - 0.25% if redeemed / switched out within 7 days from the date of allotment. (w.e.f. 15th May 2015)
FACTSHEET30th December 2016
17
AXIS ENHANCED
ARBITRAGE FUND
PORTFOLIOCompany Name % of Assets
Company Name % of Assets
Please note that after the payment of dividend, the NAV falls to the extent of dividend, distribution tax and cess wherever applicable.Past performance may or may not be sustained in future. Face Value of units is ` 10Dividends disclosed above are since the inception of the fund.
Option Record Date /Ex NAV Date
Direct PlanDividend (` Per unit) NAV per
unit (Cum Dividend)
NAV per unit (Ex
Dividend)
Dividend (` Per unit) NAV per unit (Cum Dividend)
NAV per unit (Ex
Dividend) Individu-als/ HUF Others Individu-
als/HUF Others
Dividend
Dec 26, 2016 0.05 0.05 10.5506 10.5006 0.05 0.05 10.8737 10.8237
Nov 25, 2016 0.05 0.05 10.5377 10.4877 0.05 0.05 10.8530 10.8030
Nov 08, 2016 0.05 0.05 10.5241 10.4741 0.05 0.05 10.8334 10.7834
DIVIDENDS
SCHEME PERFORMANCE (as on 30th December 2016)
Dec 31, 2013 To Dec 31,
2014
Dec 31, 2014 To Dec 31,
2015
Dec 31, 2015 To Dec 30,
2016
Since Inception
Current Value of Investment if
` 10,000 wasinvested on
inception date
Date of inceptionAbsolute
Return (%)Absolute
Return (%)Absolute
Return (%) CAGR (%)
Axis Enhanced Arbitrage Fund - Growth - 7.30% 6.95% 7.23% 11,80714-Aug-
14CRISIL Liquid Fund Index (Benchmark) - 8.23% 7.48% 8.02% 12,016CRISIL 1 Year T-Bill (Additional Benchmark) - 8.22% 7.27% 7.94% 11,994Axis Enhanced Arbitrage - Direct Plan - Growth - 8.22% 7.84% 8.14% 12,047
14-Aug-14
CRISIL Liquid Fund Index (Benchmark) - 8.23% 7.48% 8.02% 12,016CRISIL 1 Year T-Bill (Additional Benchmark) - 8.22% 7.27% 7.94% 11,994
Past performance may or may not be sustained in future. Calculations are based on Growth Option NAV. Since inception returns are calculated on ` 10 invested at inception. Since inception returns for Axis Enhanced Arbitrage Fund - Growth Option & Direct Plan - Growth Option are calculated from 14th August 2014. Devang Shah manages 46 schemes & Ashwin Patni manages 21 schemes. Please refer to annexure on Page 19 - 21 for performance of all schemes managed by the fund managers.
Total Hedged Equity 68.75
Divi’s Laboratories Limited 9.58
Reliance Industries Limited 7.75
Sun Pharmaceuticals Industries Limited 7.62
HDFC Bank Limited 7.28
HDFC Limited 7.09
Tata Consultancy Services Limited 4.94
Eicher Motors Limited 4.64
Aurobindo Pharma Limited 4.58
Cipla Limited 4.11
Siemens Limited 2.26
Mahindra & Mahindra Limited 1.99
Century Textiles & Industries Limited 1.30
Tata Motors Limited 1.26
Britannia Industries Limited 1.20
Asian Paints Limited 0.83
Oracle Financial Services Software Limited 0.73
Indiabulls Housing Finance Limited 0.57
Cadila Healthcare Limited 0.41
Cummins India Limited 0.38
DCB Bank Limited 0.20
NIIT Technologies Limited 0.03
Debt, Cash & Other Receivables 31.25
Net Assets 100%
For Statutory Details & Risk Factors please refer page 25.

TYPE OF SCHEME / INVESTMENT OBJECTIVEAn Open Ended Balanced SchemeThe investment objective of the scheme is to generate income by investing in debt & money market instruments along with long-term capital appreciation through investments in equity & equity related instruments. However, there is no assurance or guarantee that the investment objective of the Scheme will be achieved. The Scheme does not assure or guarantee any returns.
DATE OF ALLOTMENT08th December 2015
FUND MANAGERAshish NaikWork experience: 10 yearsHe has been managing this fund since 6th July 2016
R. Sivakumar Work experience: 16 years He has been managing this fund 07th June 2016.
LATEST NAV (`) as on 30th December 2016 No Lock-In Direct No Lock-InGrowth 10.3487 10.5760Dividend 10.3537 10.5277 Compulsory Direct Compulsory Lock-In Lock-In Growth 10.3500 10.5284 Dividend 10.3544 10.5277
BENCHMARK50% Nifty 50 + 50% Crisil Composite Bond Fund Index
FUND SIZE (`)Monthly Average AUM 257.89 Crore Latest AUM 259.64 Crore (as on 31st December 2016)
AVERAGE MATURITY@*7.3 years
MODIFIED DURATION@*4.8 years
PORTFOLIO YIELD (YIELD TO MATURITY &)7.01%
MINIMUM INVESTMENT AMOUNT (`)5000/1
MINIMUM ADDITIONAL PURCHASE AMOUNT (`)100/1
MINIMUM SIP INSTALLMENT AMOUNT (`)1000/1
LOAD STRUCTUREEntry load - NAExit load - 3% is payable if Units are redeemed / switched out upto 1 year from the date of allotment, - 2% is payable if Units are redeemed / switched - out after 1 year and upto 2 years from the date of allotment - 1% is payable if are redeemed / switched-out after 2 years and upto 3 years from the date of allotment - NIL if Units are redeemed / switched-out after 3 years from the date of allotment
FACTSHEET30th December 2016
PORTFOLIOCompany Name Rating % of Assets
Company Name Rating % of Assets
@ Based on debt portfolio only.* For instruments with put/call option, the put/call date has been taken as the maturity date.& The yield to maturity given above is based on the portfolio of funds as on date given above. This should not be taken as an indication of the returns that maybe generated by the fund and the securities bought by the fund may or may not be held till their respective maturities. The calculation is based on the invested corpus of the debt portfolio.
18
Ass
et C
lass
FUND STYLE
*Hedged Equity/ Cash-futures arbitrage
COMPOSITION BY ASSET (%)
¢ Unhedged Equity ¢ Debt, Cash and Other Receivables ¢ Hedged Equity
Industrial Capital Goods 0.86Siemens Limited 0.86Industrial Products 2.74Carborundum Universal Limited 0.95Cummins India Limited 1.78Media & Entertainment 1.74Zee Entertainment Enterprises Limited 1.74Petroleum Products 1.25Gulf Oil Lubricants India Limited 1.25Pharmaceuticals 8.25Cadila Healthcare Limited 1.63Divi’s Laboratories Limited 1.06Sanofi India Limited 1.73Sun Pharmaceuticals Industries Limited 3.32Torrent Pharmaceuticals Limited 0.51Power 0.90Torrent Power Limited 0.90Software 6.25Info Edge (India) Limited 1.14Infosys Limited 2.49Tata Consultancy Services Limited 1.11Tech Mahindra Limited 1.51Textile Products 2.74Page Industries Limited 1.34SRF Limited 1.40Transportation 0.51Gujarat Pipavav Port Limited 0.51Total Hedged Equity 7.27IDFC Limited 0.49Aurobindo Pharma Limited 1.55Dish TV India Limited 0.59The South Indian Bank Limited 0.43Mahindra & Mahindra Limited 0.32HDFC Limited 2.04HDFC Bank Limited 1.74Tata Motors Limited 0.10Debt, Cash & Other Receivables 0.82
Net Assets 100%
Total Debt 33.52Total Fixed Deposit 1.16Government Bond Sovereign 21.43Corporate Bond 10.52Power Finance Corporation Limited CRISIL AAA 6.23HDFC Limited CRISIL AAA 3.12Cholamandalam Investment and Finance Company Limited ICRA AA 0.77Adani Properties Pvt. Ltd. BWR AA-(SO) 0.39Zero Coupon Bond 0.42JM Financial Products Ltd ICRA AA 0.42Total Equity 65.65Total Unhedged Equity 58.38Auto 5.75Mahindra & Mahindra Limited 1.10Maruti Suzuki India Limited 2.84Tata Motors Limited 1.82Auto Ancillaries 2.86Motherson Sumi Systems Limited 2.86Banks 9.95City Union Bank Limited 0.96HDFC Bank Limited 4.23ICICI Bank Limited 1.76Kotak Mahindra Bank Limited 3.01Chemicals 1.01Pidilite Industries Limited 1.01Construction Project 2.08Larsen & Toubro Limited 2.08Consumer Non Durables 2.36Asian Paints Limited 1.19ITC Limited 1.17Finance 8.08Bajaj Finance Limited 1.63Cholamandalam Investment andFinance Company Limited 1.50CRISIL Limited 1.02HDFC Limited 3.40Sundaram Finance Limited 0.53Gas 1.06Indraprastha Gas Limited 1.06
COMPOSITION BY RATING (%)
¢ SOV ¢ CRISIL AAA & Equivalent ¢ ICRA AA ¢ BWR AA-(SO)
Equity
Debt
DurationLow Mid High
Equity Arbitrage
For Statutory Details & Risk Factors please refer page 25.
SCHEME PERFORMANCE (as on 30th December 2016)
Dec 31 2013 To Dec 31,
2014
Dec 31, 2014 To Dec 31,
2015
Dec 31, 2015 To Dec 30,
2016
Since Inception
Current Value of Investment if
` 10,000 wasinvested on
inception date
Date of inceptionAbsolute
Return (%)Absolute
Return (%)Absolute
Return (%) CAGR (%)
Axis Childrens Gift Fund - Compulsory Lock-in - Regular Plan - Growth - - 2.16% 3.29% 10,350
08-Dec-1550% Nifty 50 + 50% Crisil Composite Bond Fund
Index (Benchmark) - - 8.17% 9.46% 11,008
Nifty 50 (Additional Benchmark) - - 3.01% 5.90% 10,629Axis Childrens Gift Fund - Compulsory Lock-in - Direct Plan - Growth - - 3.82% 4.96% 10,528
08-Dec-1550% Nifty 50 + 50% Crisil Composite Bond Fund
Index (Benchmark) - - 8.17% 9.46% 11,008
Nifty 50 (Additional Benchmark) - - 3.01% 5.90% 10,629Axis Childrens Gift Fund - No Lock-in - Regular Plan - Growth - - 2.14% 3.28% 10,349
08-Dec-1550% Nifty 50 + 50% Crisil Composite Bond Fund
Index (Benchmark) - - 8.17% 9.46% 11,008
Nifty 50 (Additional Benchmark) - - 3.01% 5.90% 10,629Axis Childrens Gift Fund - No Lock-in - Direct Plan - Growth - - 4.24% 5.41% 10,576
08-Dec-1550% Nifty 50 + 50% Crisil Composite Bond Fund
Index (Benchmark) - - 8.17% 9.46% 11,008
Nifty 50 (Additional Benchmark) - - 3.01% 5.90% 10,629Past performance may or may not be sustained in future. Calculations are based on Growth Option NAV. Since inception returns are calculated on ` 10 invested at inception. Since inception returns for Axis Childrens Gift Fund - Compulsory Lock-in & No Lock-in - Growth Option & Direct Plan - Growth Option are calculated from 08th December 2015. Ashish Naik manages 3 schemes & R. Sivakumar manages 5 schemes. Please refer to annexure on Page 19 - 21 for performance of all schemes managed by the fund managers.
58.38%
34.35%
7.27%
21.43%
10.18%
1.20% 0.39%

ANNEXURE FOR RETURNS OF ALL THE SCHEMES (as on 30th December 2016)Dec 31, 2013 to Dec 31, 2014
Absolute Return (%)
Dec 31, 2014 to Dec 31, 2015
Absolute Return (%)
Dec 31, 2015 to Dec 30, 2016
Absolute Return (%)
Since Inception CAGR (%)
Current Value of Investment if ` 10,000 was invested on inception
date
Date of inception
Funds managed by Shreyash DevalkarAxis Equity Fund - Growth 40.85% -1.24% -3.62% 9.10% 18,380
05-Jan-10Nifty 50 (Benchmark) 31.39% -4.06% 3.01% 6.48% 15,510S&P BSE Sensex (Additional Benchmark) 29.89% -5.03% 1.95% 6.03% 15,055Axis Equity Fund - Direct Plan - Growth 42.67% -0.25% -2.64% 12.04% 15,755
01-Jan-13Nifty 50 (Benchmark) 31.39% -4.06% 3.01% 8.30% 13,756S&P BSE Sensex (Additional Benchmark) 29.89% -5.03% 1.95% 7.99% 13,598Axis Midcap Fund - Growth 76.55% 0.85% -3.11% 16.31% 24,270
18-Feb-11S&P BSE Midcap (Benchmark) 54.69% 7.43% 7.97% 10.60% 18,061Nifty 50 (Additional Benchmark) 31.39% -4.06% 3.01% 7.15% 14,995Axis Midcap Fund - Direct Plan - Growth 79.55% 2.04% -1.92% 16.81% 18,612
01-Jan-13S&P BSE Midcap (Benchmark) 54.69% 7.43% 7.97% 13.72% 16,716Nifty 50 (Additional Benchmark) 31.39% -4.06% 3.01% 8.30% 13,756
Funds managed by Jinesh GopaniAxis Long Term Equity Fund - Growth* 66.18% 6.70% -0.69% 17.19% 30,400
29-Dec-09S&P BSE 200 (Benchmark) 35.47% -1.48% 3.95% 7.08% 16,149Nifty 50 (Additional Benchmark) 31.39% -4.06% 3.01% 6.72% 15,778Axis Long Term Equity Fund - Direct Plan - Growth* 68.85% 7.87% 0.40% 20.92% 21,368
01-Jan-13S&P BSE 200 (Benchmark) 35.47% -1.48% 3.95% 9.46% 14,353Nifty 50 (Additional Benchmark) 31.39% -4.06% 3.01% 8.30% 13,756Axis Income Saver - Growth # 20.68% 6.27% 4.19% 8.06% 16,500
16-Jul-10Crisil MIP Blended Fund Index (Benchmark) 16.83% 6.79% 11.55% 8.72% 17,166CRISIL 10 year Gilt Index (Additional Benchmark) 14.14% 7.39% 14.97% 7.60% 16,059Axis Income Saver - Direct Plan - Growth # 22.88% 7.76% 5.77% 10.34% 14,808
04-Jan-13Crisil MIP Blended Fund Index (Benchmark) 16.83% 6.79% 11.55% 9.63% 14,431CRISIL 10 year Gilt Index (Additional Benchmark) 14.14% 7.39% 14.97% 8.56% 13,878Axis Focused 25 Fund - Growth 38.75% 3.91% 4.56% 14.43% 18,360
29-Jun-12Nifty 50 (Benchmark) 31.39% -4.06% 3.01% 10.22% 15,507S&P BSE 200 (Additional Benchmark) 35.47% -1.48% 3.95% 11.63% 16,421Axis Focused 25 Fund - Direct Plan - Growth 40.37% 5.38% 5.82% 13.39% 16,527
01-Jan-13Nifty 50 (Benchmark) 31.39% -4.06% 3.01% 8.30% 13,756S&P BSE 200 (Additional Benchmark) 35.47% -1.48% 3.95% 9.46% 14,353
Funds managed by R.SivakumarAxis Equity Saver Fund - Growth - - 2.39% 2.09% 10,290
14-Aug-15CRISIL MIP Blended Index (Benchmark) - - 11.55% 9.49% 11,334Nifty 50 (Additional Benchmark) - - 3.01% -2.84% 9,609Axis Equity Saver Fund - Direct Plan - Growth - - 3.66% 3.38% 10,470
14-Aug-15CRISIL MIP Blended Index (Benchmark) - - 11.55% 9.49% 11,334Nifty 50 (Additional Benchmark) - - 3.01% -2.84% 9,609Axis Triple Advantage Fund - Growth 17.16% -0.51% 7.12% 7.45% 15,788
23-Aug-1035% of Nifty 50 + 35% of Crisil Composite Bond Fund Index + 30% Of INR Price of Gold (Benchmark)
16.49% -0.32% 9.66% 7.58% 15,917
Crisil 10 Year Gilt Index (Additional Benchmark) 14.14% 7.39% 14.97% 8.02% 16,328Axis Triple Advantage Fund - Direct Plan Growth 18.81% 0.37% 8.05% 6.66% 12,940
01-Jan-1335% of Nifty 50 + 35% of Crisil Composite Bond Fund Index + 30% Of INR Price of Gold (Benchmark)
16.49% -0.32% 9.66% 5.73% 12,495
Crisil 10 Year Gilt Index (Additional Benchmark) 14.14% 7.39% 14.97% 8.67% 13,944 Axis Dynamic Bond Fund - Growth 14.06% 6.75% 13.40% 9.60% 16,837
27-Apr-11Crisil Composite Bond Fund Index (Benchmark) 14.31% 8.63% 12.93% 9.48% 16,730Crisil 10 Year Gilt Index (Additional Benchmark) 14.14% 7.39% 14.97% 8.27% 15,711Axis Dynamic Bond Fund - Direct Plan - Growth 15.76% 8.14% 14.49% 10.98% 15,167
01-Jan-13Crisil Composite Bond Fund Index (Benchmark) 14.31% 8.63% 12.93% 9.79% 14,526Crisil 10 Year Gilt Index (Additional Benchmark) 14.14% 7.39% 14.97% 8.67% 13,944Axis Capital Protection Oriented Fund - Series 5 # 23.56% -4.20% 3.43% 7.13% 13,322
02-Nov-12Crisil MIP Blended Fund Index (Benchmark) 16.83% 6.79% 11.55% 9.87% 14,797Crisil 1 Year T-Bill Index (Additional Benchmark) 8.56% 8.22% 7.27% 7.50% 13,511Axis Childrens Gift Fund - Compulsory Lock-in - Regular Plan - Growth - - 2.16% 3.29% 10,350
08-Dec-1550% Nifty 50 + 50% Crisil Composite Bond Fund Index (Benchmark) - - 8.17% 9.46% 11,008Nifty 50 (Additional Benchmark) - - 3.01% 5.90% 10,629Axis Childrens Gift Fund - Compulsory Lock-in - Direct Plan - Growth - - 3.82% 4.96% 10,528
08-Dec-1550% Nifty 50 + 50% Crisil Composite Bond Fund Index (Benchmark) - - 8.17% 9.46% 11,008Nifty 50 (Additional Benchmark) - - 3.01% 5.90% 10,629Axis Childrens Gift Fund - No Lock-in - Regular Plan - Growth - - 2.14% 3.28% 10,349
08-Dec-1550% Nifty 50 + 50% Crisil Composite Bond Fund Index (Benchmark) - - 8.17% 9.46% 11,008Nifty 50 (Additional Benchmark) - - 3.01% 5.90% 10,629Axis Childrens Gift Fund - No Lock-in - Direct Plan - Growth - - 4.24% 5.41% 10,576
08-Dec-1550% Nifty 50 + 50% Crisil Composite Bond Fund Index (Benchmark) - - 8.17% 9.46% 11,008Nifty 50 (Additional Benchmark) - - 3.01% 5.90% 10,629
Funds managed by Devang ShahAxis Income Saver - Growth # 20.68% 6.27% 4.19% 8.06% 16,500
16-Jul-10Crisil MIP Blended Fund Index (Benchmark) 16.83% 6.79% 11.55% 8.72% 17,166Crisil 10 Year Gilt Index (Additional Benchmark) 14.14% 7.39% 14.97% 7.60% 16,059Axis Income Saver - Direct Plan - Growth # 22.88% 7.76% 5.77% 10.34% 14,808
04-Jan-13Crisil MIP Blended Fund Index (Benchmark) 16.83% 6.79% 11.55% 9.63% 14,431Crisil 10 Year Gilt Index (Additional Benchmark) 14.14% 7.39% 14.97% 8.56% 13,878Axis Dynamic Bond Fund - Growth 14.06% 6.75% 13.40% 9.60% 16,837
27-Apr-11Crisil Composite Bond Fund Index (Benchmark) 14.31% 8.63% 12.93% 9.48% 16,730Crisil 10 Year Gilt Index (Additional Benchmark) 14.14% 7.39% 14.97% 8.27% 15,711Axis Dynamic Bond Fund - Direct Plan - Growth 15.76% 8.14% 14.49% 10.98% 15,167
01-Jan-13Crisil Composite Bond Fund Index (Benchmark) 14.31% 8.63% 12.93% 9.79% 14,526Crisil 10 Year Gilt Index (Additional Benchmark) 14.14% 7.39% 14.97% 8.67% 13,944Axis Fixed Income Opportunities Fund - 8.70% 9.79% 9.90% 12,619
15-July-14CRISIL Short-Term Bond Fund Index (Benchmark) - 8.66% 9.83% 9.53% 12,513CRISIL 1 Year T-Bill (Additional Benchmark) - 8.22% 7.27% 7.93% 12,068Axis Fixed Income Opportunities Fund - Direct Plan - Growth - 9.77% 11.16% 11.03% 12,941
15-July-14CRISIL Short-Term Bond Fund Index (Benchmark) - 8.66% 9.83% 9.53% 12,513CRISIL 1 Year T-Bill (Additional Benchmark) - 8.22% 7.27% 7.93% 12,068Axis Income Fund - Growth 15.01% 6.76% 11.62% 9.61% 15,476
28-Mar-12Crisil Composite Bond Fund Index (Benchmark) 14.31% 8.63% 12.93% 9.78% 15,596Crisil 10 Year Gilt Index (Additional Benchmark) 14.14% 7.39% 14.97% 9.24% 15,233Axis Income Fund - Direct Plan - Growth 16.26% 7.95% 12.55% 10.33% 14,788
07-Jan-13Crisil Composite Bond Fund Index (Benchmark) 14.31% 8.63% 12.93% 9.72% 14,464Crisil 10 Year Gilt Index (Additional Benchmark) 14.14% 7.39% 14.97% 8.51% 13,841Axis Short Term Fund - Growth 10.04% 8.11% 9.64% 8.40% 17,510
22-Jan-10Crisil Short Term Bond Fund Index (Benchmark) 10.47% 8.66% 9.83% 8.41% 17,518Crisil 1 Year T-Bill Index (Additional Benchmark) 8.56% 8.22% 7.27% 6.77% 15,753Axis Short Term Fund - Direct Plan - Growth 11.03% 9.04% 10.40% 9.64% 14,445
01-Jan-13Crisil Short Term Bond Fund Index (Benchmark) 10.47% 8.66% 9.83% 9.30% 14,267Crisil 1 Year T-Bill Index (Additional Benchmark) 8.56% 8.22% 7.27% 7.47% 13,336Axis Short Term Fund - Retail Plan - Growth 10.08% 8.10% 9.64% 8.36% 17,313
02-Mar-10Crisil Short Term Bond Fund Index (Benchmark) 10.47% 8.66% 9.83% 8.51% 17,482Crisil 1 Year T-Bill Index (Additional Benchmark) 8.56% 8.22% 7.27% 6.84% 15,716Axis Liquid Fund - Growth 9.10% 8.35% 7.64% 8.20% 17,688
09-Oct-09Crisil Liquid Fund Index (Benchmark) 9.21% 8.23% 7.50% 7.79% 17,201Crisil 1 Year T-Bill Index (Additional Benchmark) 8.56% 8.22% 7.29% 6.60% 15,878Axis Liquid Fund - Direct Plan - Growth 9.16% 8.42% 7.73% 8.64% 13,932
31-Dec-12Crisil Liquid Fund Index (Benchmark) 9.21% 8.23% 7.50% 8.49% 13,855Crisil 1 Year T-Bill Index (Additional Benchmark) 8.56% 8.22% 7.29% 7.47% 13,344Axis Liquid Fund - Retail Plan - Growth 8.55% 7.79% 7.08% 7.98% 16,911
01-Mar-10Crisil Liquid Fund Index (Benchmark) 9.21% 8.23% 7.50% 8.07% 17,008Crisil 1 Year T-Bill Index (Additional Benchmark) 8.56% 8.22% 7.29% 6.84% 15,720
Past performance may or may not be sustained in future. Calculations are based on Growth Option NAV. Above data excludes schemes which have not completed a year. W.e.f January 1st, 2013, Axis Short Term Fund – Institutional Plan, Axis Treasury Advantage Fund – Institutional Plan & Axis Liquid Fund – Institutional Plan have been renamed Axis Short Term Fund, Axis Treasury Advantage Fund & Axis Liquid Fund respectively. The above data excludes performance of direct plans of schemes which have not completed a year.
19

Dec 31, 2013 to Dec 31, 2014
Absolute Return (%)
Dec 31, 2014 to Dec 31, 2015
Absolute Return (%)
Dec 31, 2015 to Dec 30, 2016
Absolute Return (%)
Since Inception CAGR (%)
Current Value of Investment if ` 10,000 was invested on inception
date
Date of inception
Axis Treasury Advantage Fund - Growth 8.72% 8.53% 8.16% 8.33% 17,83709-Oct-09Crisil Liquid Fund Index (Benchmark) 9.21% 8.23% 7.48% 7.79% 17,198
Crisil 1 Year T-Bill Index (Additional Benchmark) 8.56% 8.22% 7.27% 6.60% 15,876Axis Treasury Advantage Fund - Direct Plan - Growth 9.28% 8.90% 8.59% 9.12% 14,174
01-Jan-13Crisil Liquid Fund Index (Benchmark) 9.21% 8.23% 7.48% 8.49% 13,850Crisil 1 Year T-Bill Index (Additional Benchmark) 8.56% 8.22% 7.27% 7.47% 13,336Axis Treasury Advantage Fund - Retail Plan - Growth 7.98% 7.84% 7.46% 7.88% 16,793
03-Mar-10Crisil Liquid Fund Index (Benchmark) 9.21% 8.23% 7.48% 8.07% 16,995Crisil 1 Year T-Bill Index (Additional Benchmark) 8.56% 8.22% 7.27% 6.84% 15,716Axis Gold ETF 0.74% -8.02% 9.88% 4.12% 12,818
10-Nov-10Domestic Price of Gold 2.13% -7.24% 11.80% 3.91% 12,656Additional Benchmark Not ApplicableAxis Gold Fund -11.42% -11.86% 10.70% -1.83% 9,082
20-Oct-11Domestic Price of Gold 2.13% -7.24% 11.80% -0.53% 9,727Additional Benchmark Not ApplicableAxis Gold Fund - Direct Plan -10.08% -10.48% 11.98% -4.33% 8,379
01-Jan-13Domestic Price of Gold 2.13% -7.24% 11.80% -3.59% 8,641Additional Benchmark Not ApplicableAxis Enhanced Arbitrage Fund - Growth - 7.30% 6.95% 7.23% 11,807
14-Aug-14CRISIL Liquid Fund Index (Benchmark) - 8.23% 7.48% 8.02% 12,016CRISIL 1 Year T-Bill (Additional Benchmark) - 8.22% 7.27% 7.94% 11,994Axis Enhanced Arbitrage Fund - Direct Plan - Growth - 8.22% 7.84% 8.14% 12,047
14-Aug-14CRISIL Liquid Fund Index (Benchmark) - 8.23% 7.48% 8.02% 12,016CRISIL 1 Year T-Bill (Additional Benchmark) - 8.22% 7.27% 7.94% 11,994Axis Constant Maturity 10 Year Fund - Growth 14.97% 6.33% 13.74% 8.12% 14,708 23-Jan-12Crisil 10 Year Gilt Index (Benchmark) 14.14% 7.39% 14.97% 8.59% 15,027Axis Constant Maturity 10 Year Fund - Direct Plan - Growth 15.53% 6.86% 14.33% 8.88% 14,051 01-Jan-13Crisil 10 Year Gilt Index (Benchmark) 14.14% 7.39% 14.97% 8.67% 13,944Axis Hybrid Fund - Series 5 - Growth # 21.61% -2.13% 0.19% 6.19% 12,292
25-Jul-13Crisil MIP Blended Fund Index (Benchmark) 16.83% 6.79% 11.55% 11.07% 14,343Crisil 1 Year T-Bill Index (Additional Benchmark) 8.56% 8.22% 7.27% 8.09% 13,062Axis Hybrid Fund - Series 5 - Direct Plan - Growth # 22.73% -1.18% 1.18% 7.21% 12,703
25-Jul-13Crisil MIP Blended Fund Index (Benchmark) 16.83% 6.79% 11.55% 11.07% 14,343Crisil 1 Year T-Bill Index (Additional Benchmark) 8.56% 8.22% 7.27% 8.09% 13,062Axis Hybrid Fund - Series 6 - Growth # 23.03% -4.56% 0.78% 6.90% 12,527
16-Aug-13Crisil MIP Blended Fund Index (Benchmark) 16.83% 6.79% 11.55% 12.27% 14,781Crisil 1 Year T-Bill Index (Additional Benchmark) 8.56% 8.22% 7.27% 8.17% 13,035Axis Hybrid Fund - Series 6 - Direct Plan - Growth # 24.20% -3.64% 1.76% 7.94% 12,943
16-Aug-13Crisil MIP Blended Fund Index (Benchmark) 16.83% 6.79% 11.55% 12.27% 14,781Crisil 1 Year T-Bill Index (Additional Benchmark) 8.56% 8.22% 7.27% 8.17% 13,035Axis Hybrid Fund - Series 7 - Growth # 22.89% -4.20% 0.62% 6.84% 12,456
05-Sep-13Crisil MIP Blended Fund Index (Benchmark) 16.83% 6.79% 11.55% 11.66% 14,421Crisil 1 Year T-Bill Index (Additional Benchmark) 8.56% 8.22% 7.27% 8.06% 12,934Axis Hybrid Fund - Series 7 - Direct Plan - Growth # 24.11% -3.27% 1.63% 7.90% 12,871
05-Sep-13Crisil MIP Blended Fund Index (Benchmark) 16.83% 6.79% 11.55% 11.66% 14,421Crisil 1 Year T-Bill Index (Additional Benchmark) 8.56% 8.22% 7.27% 8.06% 12,934Axis Hybrid Fund - Series 8 - Growth # - -4.32% 1.54% 4.74% 11,455
24-Jan-14Crisil MIP Blended Fund Index (Benchmark) - 6.79% 11.55% 11.59% 13,795Crisil 1 yr Tbill Index (Additional Benchmark) - 8.22% 7.27% 7.98% 12,525Axis Hybrid Fund - Series 8 - Direct Plan - Growth # - -3.49% 2.53% 5.74% 11,779
24-Jan-14Crisil MIP Blended Fund Index (Benchmark) - 6.79% 11.55% 11.59% 13,795Crisil 1 yr Tbill Index (Additional Benchmark) - 8.22% 7.27% 7.98% 12,525Axis Hybrid Fund - Series 9 - Growth # - -4.18% 1.54% 4.87% 11,466
13-Feb-14Crisil MIP Blended Fund Index (Benchmark) - 6.79% 11.55% 12.20% 13,932Crisil 1 yr Tbill Index (Additional Benchmark) - 8.22% 7.27% 8.08% 12,507Axis Hybrid Fund - Series 9 - Direct Plan - Growth # - -3.35% 2.52% 5.86% 11,782
13-Feb-14Crisil MIP Blended Fund Index (Benchmark) - 6.79% 11.55% 12.20% 13,932Crisil 1 yr Tbill Index (Additional Benchmark) - 8.22% 7.27% 8.08% 12,507Axis Hybrid Fund - Series 11 - Growth # - -3.62% 1.81% 3.25% 10,884
9-May-14CRISIL MIP Blended Index (Benchmark) - 6.79% 11.55% 11.26% 13,264CRISIL 1 Year T-Bill (Additional Benchmark) - 8.22% 7.27% 7.98% 12,253Axis Hybrid Fund - Series 11 - Direct Plan - Growth # - -2.72% 2.80% 4.31% 11,182
9-May-14CRISIL MIP Blended Index (Benchmark) - 6.79% 11.55% 11.26% 13,264CRISIL 1 Year T-Bill (Additional Benchmark) - 8.22% 7.27% 7.98% 12,253Axis Hybrid Fund - Series 12 - Growth # - -3.36% 1.81% 3.04% 10,809
27-May-14CRISIL MIP Blended Index (Benchmark) - 6.79% 11.55% 10.69% 13,019CRISIL 1 Year T-Bill (Additional Benchmark) - 8.22% 7.27% 7.94% 12,194Axis Hybrid Fund - Series 12 - Direct Plan - Growth # - -2.45% 2.80% 4.10% 11,101
27-May-14CRISIL MIP Blended Index (Benchmark) - 6.79% 11.55% 10.69% 13,019CRISIL 1 Year T-Bill (Additional Benchmark) - 8.22% 7.27% 7.94% 12,194Axis Hybrid Fund - Series 13 - Growth # - -3.54% 1.94% 2.86% 10,741
18-Jun-14CRISIL MIP Blended Index (Benchmark) - 6.79% 11.55% 10.34% 12,835CRISIL 1 Year T-Bill (Additional Benchmark) - 8.22% 7.27% 7.92% 12,133Axis Hybrid Fund - Series 13 - Direct Plan - Growth # - -2.63% 2.93% 3.90% 11,021
18-Jun-14CRISIL MIP Blended Index (Benchmark) - 6.79% 11.55% 10.34% 12,835CRISIL 1 Year T-Bill (Additional Benchmark) - 8.22% 7.27% 7.92% 12,133Axis Hybrid Fund - Series 14 - Growth # - -0.39% 1.67% 1.53% 10,360
2-Sep-14CRISIL MIP Blended Index (Benchmark) - 6.79% 11.55% 10.27% 12,556CRISIL 1 Year T-Bill (Additional Benchmark) - 8.22% 7.27% 7.94% 11,947Axis Hybrid Fund - Series 14 - Direct Plan - Growth # - 0.45% 2.69% 2.88% 10,684
2-Sep-14CRISIL MIP Blended Index (Benchmark) - 6.79% 11.55% 10.27% 12,556CRISIL 1 Year T-Bill (Additional Benchmark) - 8.22% 7.27% 7.94% 11,947Axis Hybrid Fund - Series 15 - Growth # - -0.54% 1.58% 1.25% 10,289
17-Sep-14CRISIL MIP Blended Index (Benchmark) - 6.79% 11.55% 10.35% 12,528CRISIL 1 Year T-Bill (Additional Benchmark) - 8.22% 7.27% 7.92% 11,906Axis Hybrid Fund - Series 15 - Direct Plan - Growth # - 0.41% 2.60% 2.32% 10,539
17-Sep-14CRISIL MIP Blended Index (Benchmark) - 6.79% 11.55% 10.35% 12,528CRISIL 1 Year T-Bill (Additional Benchmark) - 8.22% 7.27% 7.92% 11,906Axis Hybrid Fund - Series 18 - Growth # - - 3.52% 0.32% 10,063
19-Jan-15CRISIL MIP Blended Index (Benchmark) - - 11.55% 8.49% 11,719CRISIL 1 Year T-Bill (Additional Benchmark) - - 7.27% 7.65% 11,544Axis Hybrid Fund - Series 18 - Direct Plan - Growth # - - 4.59% 1.26% 10,247
19-Jan-15CRISIL MIP Blended Index (Benchmark) - - 11.55% 8.49% 11,719CRISIL 1 Year T-Bill (Additional Benchmark) - - 7.27% 7.65% 11,544Axis Hybrid Fund - Series 19 - Growth # - - 3.76% -0.12% 9,976
04-Feb-15CRISIL MIP Blended Index (Benchmark) - - 11.55% 8.37% 11,655CRISIL 1 Year T-Bill (Additional Benchmark) - - 7.27% 7.71% 11,518Axis Hybrid Fund - Series 19 - Direct Plan - Growth # - - 4.83% 0.83% 10,158
04-Feb-15CRISIL MIP Blended Index (Benchmark) - - 11.55% 8.37% 11,655CRISIL 1 Year T-Bill (Additional Benchmark) - - 7.27% 7.71% 11,518Axis Hybrid Fund - Series 22 - Growth # - - 3.68% -0.70% 9,885
11-May-15CRISIL MIP Blended Index (Benchmark) - - 11.55% 9.52% 11,610CRISIL 1 Year T-Bill (Additional Benchmark) - - 7.27% 7.63% 11,283Axis Hybrid Fund - Series 22 - Direct Plan - Growth # - - 4.93% 0.45% 10,075
11-May-15CRISIL MIP Blended Index (Benchmark) - - 11.55% 9.52% 11,610CRISIL 1 Year T-Bill (Additional Benchmark) - - 7.27% 7.63% 11,283Axis Hybrid Fund - Series 23 - Growth # - - 3.40% -0.60% 9,905
28-May-15CRISIL MIP Blended Index (Benchmark) - - 11.55% 9.41% 11,541CRISIL 1 Year T-Bill (Additional Benchmark) - - 7.27% 7.57% 11,233Axis Hybrid Fund - Series 23 - Direct Plan - Growth # - - 4.65% 0.56% 10,090
28-May-15CRISIL MIP Blended Index (Benchmark) - - 11.55% 9.41% 11,541CRISIL 1 Year T-Bill (Additional Benchmark) - - 7.27% 7.57% 11,233Axis Hybrid Fund - Series 24 - Growth # - - 3.65% -0.08% 9,988
17-Jun-15CRISIL MIP Blended Index (Benchmark) - - 11.55% 10.31% 11,631CRISIL 1 Year T-Bill (Additional Benchmark) - - 7.27% 7.55% 11,185
20
ANNEXURE FOR RETURNS OF ALL THE SCHEMES (as on 30th December 2016)
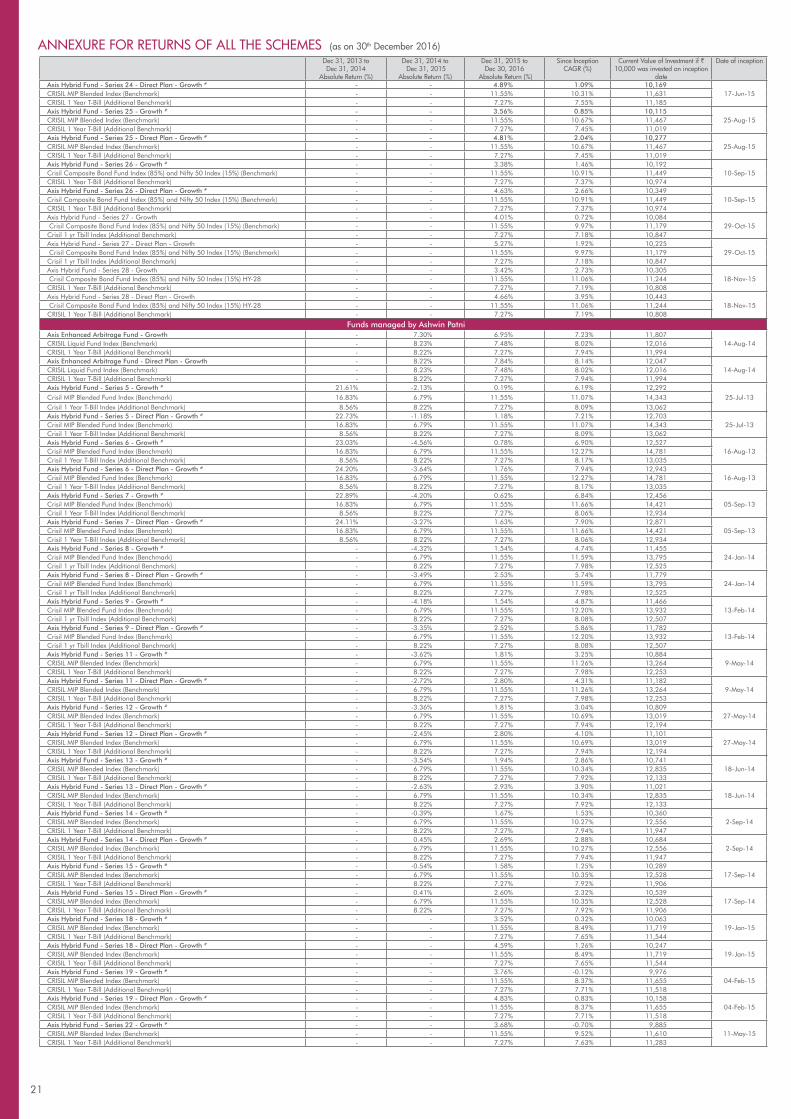
21
Dec 31, 2013 to Dec 31, 2014
Absolute Return (%)
Dec 31, 2014 to Dec 31, 2015
Absolute Return (%)
Dec 31, 2015 to Dec 30, 2016
Absolute Return (%)
Since Inception CAGR (%)
Current Value of Investment if ` 10,000 was invested on inception
date
Date of inception
Axis Hybrid Fund - Series 24 - Direct Plan - Growth # - - 4.89% 1.09% 10,16917-Jun-15CRISIL MIP Blended Index (Benchmark) - - 11.55% 10.31% 11,631
CRISIL 1 Year T-Bill (Additional Benchmark) - - 7.27% 7.55% 11,185Axis Hybrid Fund - Series 25 - Growth # - - 3.56% 0.85% 10,115
25-Aug-15CRISIL MIP Blended Index (Benchmark) - - 11.55% 10.67% 11,467CRISIL 1 Year T-Bill (Additional Benchmark) - - 7.27% 7.45% 11,019Axis Hybrid Fund - Series 25 - Direct Plan - Growth # - - 4.81% 2.04% 10,277
25-Aug-15CRISIL MIP Blended Index (Benchmark) - - 11.55% 10.67% 11,467CRISIL 1 Year T-Bill (Additional Benchmark) - - 7.27% 7.45% 11,019Axis Hybrid Fund - Series 26 - Growth # - - 3.38% 1.46% 10,192
10-Sep-15Crisil Composite Bond Fund Index (85%) and Nifty 50 Index (15%) (Benchmark) - - 11.55% 10.91% 11,449CRISIL 1 Year T-Bill (Additional Benchmark) - - 7.27% 7.37% 10,974Axis Hybrid Fund - Series 26 - Direct Plan - Growth # - - 4.63% 2.66% 10,349
10-Sep-15Crisil Composite Bond Fund Index (85%) and Nifty 50 Index (15%) (Benchmark) - - 11.55% 10.91% 11,449CRISIL 1 Year T-Bill (Additional Benchmark) - - 7.27% 7.37% 10,974Axis Hybrid Fund - Series 27 - Growth - - 4.01% 0.72% 10,084
29-Oct-15 Crisil Composite Bond Fund Index (85%) and Nifty 50 Index (15%) (Benchmark) - - 11.55% 9.97% 11,179Crisil 1 yr Tbill Index (Additional Benchmark) - - 7.27% 7.18% 10,847Axis Hybrid Fund - Series 27 - Direct Plan - Growth - - 5.27% 1.92% 10,225
29-Oct-15 Crisil Composite Bond Fund Index (85%) and Nifty 50 Index (15%) (Benchmark) - - 11.55% 9.97% 11,179Crisil 1 yr Tbill Index (Additional Benchmark) - - 7.27% 7.18% 10,847Axis Hybrid Fund - Series 28 - Growth - - 3.42% 2.73% 10,305
18-Nov-15 Crisil Composite Bond Fund Index (85%) and Nifty 50 Index (15%) HY-28 - - 11.55% 11.06% 11,244CRISIL 1 Year T-Bill (Additional Benchmark) - - 7.27% 7.19% 10,808Axis Hybrid Fund - Series 28 - Direct Plan - Growth - - 4.66% 3.95% 10,443
18-Nov-15 Crisil Composite Bond Fund Index (85%) and Nifty 50 Index (15%) HY-28 - - 11.55% 11.06% 11,244CRISIL 1 Year T-Bill (Additional Benchmark) - - 7.27% 7.19% 10,808
Funds managed by Ashwin PatniAxis Enhanced Arbitrage Fund - Growth - 7.30% 6.95% 7.23% 11,807
14-Aug-14CRISIL Liquid Fund Index (Benchmark) - 8.23% 7.48% 8.02% 12,016CRISIL 1 Year T-Bill (Additional Benchmark) - 8.22% 7.27% 7.94% 11,994Axis Enhanced Arbitrage Fund - Direct Plan - Growth - 8.22% 7.84% 8.14% 12,047
14-Aug-14CRISIL Liquid Fund Index (Benchmark) - 8.23% 7.48% 8.02% 12,016CRISIL 1 Year T-Bill (Additional Benchmark) - 8.22% 7.27% 7.94% 11,994Axis Hybrid Fund - Series 5 - Growth # 21.61% -2.13% 0.19% 6.19% 12,292
25-Jul-13Crisil MIP Blended Fund Index (Benchmark) 16.83% 6.79% 11.55% 11.07% 14,343Crisil 1 Year T-Bill Index (Additional Benchmark) 8.56% 8.22% 7.27% 8.09% 13,062Axis Hybrid Fund - Series 5 - Direct Plan - Growth # 22.73% -1.18% 1.18% 7.21% 12,703
25-Jul-13Crisil MIP Blended Fund Index (Benchmark) 16.83% 6.79% 11.55% 11.07% 14,343Crisil 1 Year T-Bill Index (Additional Benchmark) 8.56% 8.22% 7.27% 8.09% 13,062Axis Hybrid Fund - Series 6 - Growth # 23.03% -4.56% 0.78% 6.90% 12,527
16-Aug-13Crisil MIP Blended Fund Index (Benchmark) 16.83% 6.79% 11.55% 12.27% 14,781Crisil 1 Year T-Bill Index (Additional Benchmark) 8.56% 8.22% 7.27% 8.17% 13,035Axis Hybrid Fund - Series 6 - Direct Plan - Growth # 24.20% -3.64% 1.76% 7.94% 12,943
16-Aug-13Crisil MIP Blended Fund Index (Benchmark) 16.83% 6.79% 11.55% 12.27% 14,781Crisil 1 Year T-Bill Index (Additional Benchmark) 8.56% 8.22% 7.27% 8.17% 13,035Axis Hybrid Fund - Series 7 - Growth # 22.89% -4.20% 0.62% 6.84% 12,456
05-Sep-13Crisil MIP Blended Fund Index (Benchmark) 16.83% 6.79% 11.55% 11.66% 14,421Crisil 1 Year T-Bill Index (Additional Benchmark) 8.56% 8.22% 7.27% 8.06% 12,934Axis Hybrid Fund - Series 7 - Direct Plan - Growth # 24.11% -3.27% 1.63% 7.90% 12,871
05-Sep-13Crisil MIP Blended Fund Index (Benchmark) 16.83% 6.79% 11.55% 11.66% 14,421Crisil 1 Year T-Bill Index (Additional Benchmark) 8.56% 8.22% 7.27% 8.06% 12,934Axis Hybrid Fund - Series 8 - Growth # - -4.32% 1.54% 4.74% 11,455
24-Jan-14Crisil MIP Blended Fund Index (Benchmark) - 6.79% 11.55% 11.59% 13,795Crisil 1 yr Tbill Index (Additional Benchmark) - 8.22% 7.27% 7.98% 12,525Axis Hybrid Fund - Series 8 - Direct Plan - Growth # - -3.49% 2.53% 5.74% 11,779
24-Jan-14Crisil MIP Blended Fund Index (Benchmark) - 6.79% 11.55% 11.59% 13,795Crisil 1 yr Tbill Index (Additional Benchmark) - 8.22% 7.27% 7.98% 12,525Axis Hybrid Fund - Series 9 - Growth # - -4.18% 1.54% 4.87% 11,466
13-Feb-14Crisil MIP Blended Fund Index (Benchmark) - 6.79% 11.55% 12.20% 13,932Crisil 1 yr Tbill Index (Additional Benchmark) - 8.22% 7.27% 8.08% 12,507Axis Hybrid Fund - Series 9 - Direct Plan - Growth # - -3.35% 2.52% 5.86% 11,782
13-Feb-14Crisil MIP Blended Fund Index (Benchmark) - 6.79% 11.55% 12.20% 13,932Crisil 1 yr Tbill Index (Additional Benchmark) - 8.22% 7.27% 8.08% 12,507Axis Hybrid Fund - Series 11 - Growth # - -3.62% 1.81% 3.25% 10,884
9-May-14CRISIL MIP Blended Index (Benchmark) - 6.79% 11.55% 11.26% 13,264CRISIL 1 Year T-Bill (Additional Benchmark) - 8.22% 7.27% 7.98% 12,253Axis Hybrid Fund - Series 11 - Direct Plan - Growth # - -2.72% 2.80% 4.31% 11,182
9-May-14CRISIL MIP Blended Index (Benchmark) - 6.79% 11.55% 11.26% 13,264CRISIL 1 Year T-Bill (Additional Benchmark) - 8.22% 7.27% 7.98% 12,253Axis Hybrid Fund - Series 12 - Growth # - -3.36% 1.81% 3.04% 10,809
27-May-14CRISIL MIP Blended Index (Benchmark) - 6.79% 11.55% 10.69% 13,019CRISIL 1 Year T-Bill (Additional Benchmark) - 8.22% 7.27% 7.94% 12,194Axis Hybrid Fund - Series 12 - Direct Plan - Growth # - -2.45% 2.80% 4.10% 11,101
27-May-14CRISIL MIP Blended Index (Benchmark) - 6.79% 11.55% 10.69% 13,019CRISIL 1 Year T-Bill (Additional Benchmark) - 8.22% 7.27% 7.94% 12,194Axis Hybrid Fund - Series 13 - Growth # - -3.54% 1.94% 2.86% 10,741
18-Jun-14CRISIL MIP Blended Index (Benchmark) - 6.79% 11.55% 10.34% 12,835CRISIL 1 Year T-Bill (Additional Benchmark) - 8.22% 7.27% 7.92% 12,133Axis Hybrid Fund - Series 13 - Direct Plan - Growth # - -2.63% 2.93% 3.90% 11,021
18-Jun-14CRISIL MIP Blended Index (Benchmark) - 6.79% 11.55% 10.34% 12,835CRISIL 1 Year T-Bill (Additional Benchmark) - 8.22% 7.27% 7.92% 12,133Axis Hybrid Fund - Series 14 - Growth # - -0.39% 1.67% 1.53% 10,360
2-Sep-14CRISIL MIP Blended Index (Benchmark) - 6.79% 11.55% 10.27% 12,556CRISIL 1 Year T-Bill (Additional Benchmark) - 8.22% 7.27% 7.94% 11,947Axis Hybrid Fund - Series 14 - Direct Plan - Growth # - 0.45% 2.69% 2.88% 10,684
2-Sep-14CRISIL MIP Blended Index (Benchmark) - 6.79% 11.55% 10.27% 12,556CRISIL 1 Year T-Bill (Additional Benchmark) - 8.22% 7.27% 7.94% 11,947Axis Hybrid Fund - Series 15 - Growth # - -0.54% 1.58% 1.25% 10,289
17-Sep-14CRISIL MIP Blended Index (Benchmark) - 6.79% 11.55% 10.35% 12,528CRISIL 1 Year T-Bill (Additional Benchmark) - 8.22% 7.27% 7.92% 11,906Axis Hybrid Fund - Series 15 - Direct Plan - Growth # - 0.41% 2.60% 2.32% 10,539
17-Sep-14CRISIL MIP Blended Index (Benchmark) - 6.79% 11.55% 10.35% 12,528CRISIL 1 Year T-Bill (Additional Benchmark) - 8.22% 7.27% 7.92% 11,906Axis Hybrid Fund - Series 18 - Growth # - - 3.52% 0.32% 10,063
19-Jan-15CRISIL MIP Blended Index (Benchmark) - - 11.55% 8.49% 11,719CRISIL 1 Year T-Bill (Additional Benchmark) - - 7.27% 7.65% 11,544Axis Hybrid Fund - Series 18 - Direct Plan - Growth # - - 4.59% 1.26% 10,247
19-Jan-15CRISIL MIP Blended Index (Benchmark) - - 11.55% 8.49% 11,719CRISIL 1 Year T-Bill (Additional Benchmark) - - 7.27% 7.65% 11,544Axis Hybrid Fund - Series 19 - Growth # - - 3.76% -0.12% 9,976
04-Feb-15CRISIL MIP Blended Index (Benchmark) - - 11.55% 8.37% 11,655CRISIL 1 Year T-Bill (Additional Benchmark) - - 7.27% 7.71% 11,518Axis Hybrid Fund - Series 19 - Direct Plan - Growth # - - 4.83% 0.83% 10,158
04-Feb-15CRISIL MIP Blended Index (Benchmark) - - 11.55% 8.37% 11,655CRISIL 1 Year T-Bill (Additional Benchmark) - - 7.27% 7.71% 11,518Axis Hybrid Fund - Series 22 - Growth # - - 3.68% -0.70% 9,885
11-May-15CRISIL MIP Blended Index (Benchmark) - - 11.55% 9.52% 11,610CRISIL 1 Year T-Bill (Additional Benchmark) - - 7.27% 7.63% 11,283
ANNEXURE FOR RETURNS OF ALL THE SCHEMES (as on 30th December 2016)

22
Dec 31, 2013 to Dec 31, 2014
Absolute Return (%)
Dec 31, 2014 to Dec 31, 2015
Absolute Return (%)
Dec 31, 2015 to Dec 30, 2016
Absolute Return (%)
Since Inception CAGR (%)
Current Value of Investment if ` 10,000 was invested on inception
date
Date of inception
Axis Hybrid Fund - Series 22 - Direct Plan - Growth # - - 4.93% 0.45% 10,07511-May-15CRISIL MIP Blended Index (Benchmark) - - 11.55% 9.52% 11,610
CRISIL 1 Year T-Bill (Additional Benchmark) - - 7.27% 7.63% 11,283Axis Hybrid Fund - Series 23 - Growth # - - 3.40% -0.60% 9,905
28-May-15CRISIL MIP Blended Index (Benchmark) - - 11.55% 9.41% 11,541CRISIL 1 Year T-Bill (Additional Benchmark) - - 7.27% 7.57% 11,233Axis Hybrid Fund - Series 23 - Direct Plan - Growth # - - 4.65% 0.56% 10,090
28-May-15CRISIL MIP Blended Index (Benchmark) - - 11.55% 9.41% 11,541CRISIL 1 Year T-Bill (Additional Benchmark) - - 7.27% 7.57% 11,233Axis Hybrid Fund - Series 24 - Growth # - - 3.65% -0.08% 9,988
17-Jun-15CRISIL MIP Blended Index (Benchmark) - - 11.55% 10.31% 11,631CRISIL 1 Year T-Bill (Additional Benchmark) - - 7.27% 7.55% 11,185Axis Hybrid Fund - Series 24 - Direct Plan - Growth # - - 4.89% 1.09% 10,169
17-Jun-15CRISIL MIP Blended Index (Benchmark) - - 11.55% 10.31% 11,631CRISIL 1 Year T-Bill (Additional Benchmark) - - 7.27% 7.55% 11,185Axis Hybrid Fund - Series 25 - Growth # - - 3.56% 0.85% 10,115
25-Aug-15CRISIL MIP Blended Index (Benchmark) - - 11.55% 10.67% 11,467CRISIL 1 Year T-Bill (Additional Benchmark) - - 7.27% 7.45% 11,019Axis Hybrid Fund - Series 25 - Direct Plan - Growth # - - 4.81% 2.04% 10,277
25-Aug-15CRISIL MIP Blended Index (Benchmark) - - 11.55% 10.67% 11,467CRISIL 1 Year T-Bill (Additional Benchmark) - - 7.27% 7.45% 11,019Axis Hybrid Fund - Series 26 - Growth # - - 3.38% 1.46% 10,192
10-Sep-15Crisil Composite Bond Fund Index (85%) and Nifty 50 Index (15%) (Benchmark) - - 11.55% 10.91% 11,449CRISIL 1 Year T-Bill (Additional Benchmark) - - 7.27% 7.37% 10,974Axis Hybrid Fund - Series 26 - Direct Plan - Growth # - - 4.63% 2.66% 10,349
10-Sep-15Crisil Composite Bond Fund Index (85%) and Nifty 50 Index (15%) (Benchmark) - - 11.55% 10.91% 11,449CRISIL 1 Year T-Bill (Additional Benchmark) - - 7.27% 7.37% 10,974Axis Hybrid Fund - Series 27 - Growth - - 4.01% 0.72% 10,084
29-Oct-15 Crisil Composite Bond Fund Index (85%) and Nifty 50 Index (15%) (Benchmark) - - 11.55% 9.97% 11,179Crisil 1 yr Tbill Index (Additional Benchmark) - - 7.27% 7.18% 10,847Axis Hybrid Fund - Series 27 - Direct Plan - Growth - - 5.27% 1.92% 10,225
29-Oct-15 Crisil Composite Bond Fund Index (85%) and Nifty 50 Index (15%) (Benchmark) - - 11.55% 9.97% 11,179Crisil 1 yr Tbill Index (Additional Benchmark) - - 7.27% 7.18% 10,847Axis Hybrid Fund - Series 28 - Growth - - 3.42% 2.73% 10,305
18-Nov-15 Crisil Composite Bond Fund Index (85%) and Nifty 50 Index (15%) HY-28 - - 11.55% 11.06% 11,244CRISIL 1 Year T-Bill (Additional Benchmark) - - 7.27% 7.19% 10,808Axis Hybrid Fund - Series 28 - Direct Plan - Growth - - 4.66% 3.95% 10,443
18-Nov-15 Crisil Composite Bond Fund Index (85%) and Nifty 50 Index (15%) HY-28 - - 11.55% 11.06% 11,244CRISIL 1 Year T-Bill (Additional Benchmark) - - 7.27% 7.19% 10,808Axis Capital Protection Oriented Fund - Series 5 # 23.56% -4.20% 3.43% 7.13% 13,322
02-Nov-12Crisil MIP Blended Fund Index (Benchmark) 16.83% 6.79% 11.55% 9.87% 14,797Crisil 1 Year T-Bill Index (Additional Benchmark) 8.56% 8.22% 7.27% 7.50% 13,511
Funds managed by Ashish NaikAxis Triple Advantage Fund - Growth 17.16% -0.51% 7.12% 7.45% 15,788
23-Aug-1035% of Nifty 50 + 35% of Crisil Composite Bond Fund Index + 30% Of INR Price of Gold (Benchmark) 16.49% -0.32% 9.66% 7.58% 15,917
Crisil 10 Year Gilt Index (Additional Benchmark) 14.14% 7.39% 14.97% 8.02% 16,328Axis Triple Advantage Fund - Direct Plan Growth 18.81% 0.37% 8.05% 6.66% 12,940
01-Jan-1335% of Nifty 50 + 35% of Crisil Composite Bond Fund Index + 30% Of INR Price of Gold (Benchmark) 16.49% -0.32% 9.66% 5.73% 12,495
Crisil 10 Year Gilt Index (Additional Benchmark) 14.14% 7.39% 14.97% 8.67% 13,944Axis Income Saver - Growth # 20.68% 6.27% 4.19% 8.06% 16,500
16-Jul-10Crisil MIP Blended Fund Index (Benchmark) 16.83% 6.79% 11.55% 8.72% 17,166CRISIL 10 year Gilt Index (Additional Benchmark) 14.14% 7.39% 14.97% 7.60% 16,059Axis Income Saver - Direct Plan - Growth # 22.88% 7.76% 5.77% 10.34% 14,808
04-Jan-13Crisil MIP Blended Fund Index (Benchmark) 16.83% 6.79% 11.55% 9.63% 14,431CRISIL 10 year Gilt Index (Additional Benchmark) 14.14% 7.39% 14.97% 8.56% 13,878Axis Childrens Gift Fund - Compulsory Lock-in - Regular Plan - Growth - - 2.16% 3.29% 10,350
08-Dec-1550% Nifty 50 + 50% Crisil Composite Bond Fund Index (Benchmark) - - 8.17% 9.46% 11,008Nifty 50 (Additional Benchmark) - - 3.01% 5.90% 10,629Axis Childrens Gift Fund - Compulsory Lock-in - Direct Plan - Growth - - 3.82% 4.96% 10,528
08-Dec-1550% Nifty 50 + 50% Crisil Composite Bond Fund Index (Benchmark) - - 8.17% 9.46% 11,008Nifty 50 (Additional Benchmark) - - 3.01% 5.90% 10,629Axis Childrens Gift Fund - No Lock-in - Regular Plan - Growth - - 2.14% 3.28% 10,349
08-Dec-1550% Nifty 50 + 50% Crisil Composite Bond Fund Index (Benchmark) - - 8.17% 9.46% 11,008Nifty 50 (Additional Benchmark) - - 3.01% 5.90% 10,629Axis Childrens Gift Fund - No Lock-in - Direct Plan - Growth - - 4.24% 5.41% 10,576
08-Dec-1550% Nifty 50 + 50% Crisil Composite Bond Fund Index (Benchmark) - - 8.17% 9.46% 11,008Nifty 50 (Additional Benchmark) - - 3.01% 5.90% 10,629
Funds managed by Aditya PagariaAxis Liquid Fund - Growth 9.10% 8.35% 7.64% 8.20% 17,688
09-Oct-09Crisil Liquid Fund Index (Benchmark) 9.21% 8.23% 7.50% 7.79% 17,201Crisil 1 Year T-Bill Index (Additional Benchmark) 8.56% 8.22% 7.29% 6.60% 15,878Axis Liquid Fund - Direct Plan - Growth 9.16% 8.42% 7.73% 8.64% 13,932
31-Dec-12Crisil Liquid Fund Index (Benchmark) 9.21% 8.23% 7.50% 8.49% 13,855Crisil 1 Year T-Bill Index (Additional Benchmark) 8.56% 8.22% 7.29% 7.47% 13,344Axis Liquid Fund - Retail Plan - Growth 8.55% 7.79% 7.08% 7.98% 16,911
01-Mar-10Crisil Liquid Fund Index (Benchmark) 9.21% 8.23% 7.50% 8.07% 17,008Crisil 1 Year T-Bill Index (Additional Benchmark) 8.56% 8.22% 7.29% 6.84% 15,720Axis Treasury Advantage Fund - Growth 8.72% 8.53% 8.16% 8.33% 17,837
09-Oct-09Crisil Liquid Fund Index (Benchmark) 9.21% 8.23% 7.48% 7.79% 17,198Crisil 1 Year T-Bill Index (Additional Benchmark) 8.56% 8.22% 7.27% 6.60% 15,876Axis Treasury Advantage Fund - Direct Plan - Growth 9.28% 8.90% 8.59% 9.12% 14,174
01-Jan-13Crisil Liquid Fund Index (Benchmark) 9.21% 8.23% 7.48% 8.49% 13,850Crisil 1 Year T-Bill Index (Additional Benchmark) 8.56% 8.22% 7.27% 7.47% 13,336Axis Treasury Advantage Fund - Retail Plan - Growth 7.98% 7.84% 7.46% 7.88% 16,793
03-Mar-10Crisil Liquid Fund Index (Benchmark) 9.21% 8.23% 7.48% 8.07% 16,995Crisil 1 Year T-Bill Index (Additional Benchmark) 8.56% 8.22% 7.27% 6.84% 15,716Axis Banking & PSU Debt Fund - Growth 9.27% 8.50% 8.37% 8.79% 14,688
08-Jun-12Crisil Short Term Bond Fund Index (Benchmark) 10.47% 8.66% 9.83% 9.29% 14,999Crisil 1 Year T-Bill Index (Additional Benchmark) 8.56% 8.22% 7.27% 7.49% 13,908Axis Banking & PSU Debt Fund - Direct Plan - Growth 9.50% 8.68% 8.56% 8.88% 14,052
01-Jan-13Crisil Short Term Bond Fund Index (Benchmark) 10.47% 8.66% 9.83% 9.30% 14,267Crisil 1 Year T-Bill Index (Additional Benchmark) 8.56% 8.22% 7.27% 7.47% 13,336
Funds managed by Anupam Tiwari Axis Equity Saver Fund - Growth - - 2.39% 2.09% 10,290
14-Aug-15CRISIL MIP Blended Index (Benchmark) - - 11.55% 9.49% 11,334Nifty 50 (Additional Benchmark) - - 3.01% -2.84% 9,609Axis Equity Saver Fund - Direct Plan - Growth - - 3.66% 3.38% 10,470
14-Aug-15CRISIL MIP Blended Index (Benchmark) - - 11.55% 9.49% 11,334Nifty 50 (Additional Benchmark) - - 3.01% -2.84% 9,609Axis Small Cap Fund - Growth 84.33% 9.73% 3.99% 27.84% 21,350
29-Nov-13Nifty Free Float Smallcap 100 (Benchmark) 54.95% 7.21% 2.26% 21.31% 18,157Nifty 50 (Additional Benchmark) 31.39% -4.06% 3.01% 9.55% 13,254Axis Small Cap Fund - Direct Plan - Growth 86.52% 10.92% 5.14% 29.28% 22,100
29-Nov-13Nifty Free Float Smallcap 100 (Benchmark) 54.95% 7.21% 2.26% 21.31% 18,157Nifty 50 (Additional Benchmark) 31.39% -4.06% 3.01% 9.55% 13,254
ANNEXURE FOR RETURNS OF ALL THE SCHEMES (as on 30th December 2016)

Past performance may or may not be sustained in future. Calculations are based of Growth Option NAV. Since inception returns are calculated on Rs. 1,000/- invested at inception for Axis Liquid Fund, Axis Treasury Advantage Fund and Axis Banking & PSU Debt Fund, on Rs. 2,026.8434/- invested at inception for Axis Gold Exchange Traded Fund and on Rs. 10/- invested at inception for all other schemes. Above data excludes returns of Fixed Maturity Plans and schemes which have not completed a year.W.e.f January 1st, 2013, Axis Short Term Fund – Institutional Plan, Axis Treasury Advantage Fund – Institutional Plan & Axis Liquid Fund – Institutional Plan have been renamed Axis Short Term Fund, Axis Treasury Advantage Fund & Axis Liquid Fund respectively. * An open ended equity linked savings scheme with a 3 year lock-in.# Scheme Performance may not be strictly comparable with that of its additional benchmark in view of hybrid nature of the scheme.$ Rating Details (Axis Income Fund, Axis Short Term Fund & Axis Banking & PSU Debt Fund)Schemes with this rating are considered to have the highest degree of safety regarding timely receipt of payments from the investments that they have made. This rating should however, not be construed as an indication of the performance of the Mutual Fund scheme or of volatility in its returns. The rating should not be treated as a recommendation to buy, sell or hold units issued by the Mutual Fund.^ Rating Details (Axis Treasury Advantage Fund and Axis Liquid Fund)Schemes with this rating are considered to have very strong degree of safety regarding timely receipt of payments from the investments that they have made. This rating should however, not be construed as an indication of the performance of the Mutual Fund scheme or of volatility in its returns. The rating should not be treated as a recommendation to buy, sell or hold units issued by the Mutual Fund.
23

HOW TO READ FACTSHEET
24
Fund Manager : An employee of the asset management company such as a mutual fund or life insurer, who manages investments of the scheme. He is usually part of a larger team of fund managers and research analysts.
Application Amount for Fresh Subscription : This is the minimum investment amount for a new investor in a mutual fund scheme.
Minimum Additional Amount : This is the minimum investment amount for an existing investor in a mutual fund scheme.
Yield to Maturity : The Yield to Maturity or the YTM is the rate of return anticipated on a bond if held until maturity. YTM is expressed as an annual rate. The YTM factors in the bond’s current market price, par value, coupon interest rate and time to maturity.
SIP : SIP or systematic investment plan works on the principle of making periodic investments of a fixed sum. It works similar to a recurring bank deposit. For instance, an investor may opt for an SIP that invests Rs 500 every 15th of the month in an equity fund for a period of three years.
NAV : The NAV or the net asset value is the total asset value per unit of the mutual fund after deducting all related and permissible expenses. The NAV is calculated at the end of every business day. It is the value at which the investor enters or exits the mutual fund.
Benchmark : A group of securities, usually a market index, whose performance is used as a standard or benchmark to measure investment performance of mutual funds, among other investments. Some typical benchmarks include the Nifty, Sensex, BSE200, BSE500, 10-Year Gsec.
Entry Load : A mutual fund may have a sales charge or load at the time of entry and/or exit to compensate the distributor/agent.
Entry load is charged at the time an investor purchases the units of a mutual fund. The entry load is added to the prevailing NAV at the time of investment. For instance, if the NAV is Rs. 100 and the entry load is 1%, the investor will enter the fund at Rs 101.
Note: SEBI, vide circular dated June 30, 2009 has abolished entry load and mandated that the upfront commission to distributors will be paid by the investor directly to the distributor, based on his assessment of various factors including the service rendered by the distributor
Exit Load : Exit load is charged at the time an investor redeems the units of a mutual fund. The exit load is deducted from the prevailing NAV at the time of redemption. For instance, if the NAV is Rs 100 and the exit load is 1%, the redemption price would be Rs 99 Per Unit.
Modified Duration : Modified duration is the price sensitivity and the percentage change in price for a unit change in yield
Standard Deviation : Standard deviation is a statistical measure of the range of an investment’s performance. When a mutual fund has a high standard deviation, its means its range of performance is wide, implying greater volatility.
Sharpe Ratio : The Sharpe Ratio, named after its founder, the Nobel Laureate William Sharpe, is a measure of risk-adjusted returns. It is calculated using standard deviation and excess return to determine reward per unit of risk.
Beta : Beta is a measure of an investment’s volatility vis-à-vis the market. Beta of less than 1 means that the security will be less volatile than the market. A beta of greater than 1 implies that the security’s price will be more volatile than the market.
AUM : AUM or assets under management refers to the recent / updated cumulative market value of investments managed by a mutual fund or any investment firm.
Holdings : The holdings or the portfolio is a mutual fund’s latest or updated reported statement of investments/securities. These are usually displayed in terms of percentage to net assets or the rupee value or both. The objective is to give investors an idea of where their money is being invested by the fund manager.
Nature of Scheme : The investment objective and underlying investments determine the nature of the mutual fund scheme. For instance, a mutual fund that aims at generating capital appreciation by investing in stock markets is an equity fund or growth fund. Likewise, a mutual fund that aims at capital preservation by investing in debt markets is a debt fund or income fund. Each of these categories may have sub-categories.
Rating Profile : Mutual funds invest in securities after evaluating their creditworthiness as disclosed by the ratings. A depiction of the mutual fund in various investments based on their ratings becomes the rating profile of the fund. Typically, this is a feature of debt funds.
Tracking Error: Tracking error is a measure of how closely a portfolio follows the index to which it is benchmarked. It is calculated as the standard deviation of the difference between the portfolio and index returns.
Weighted Average Expense Ratio for the MonthScheme - Regular Plan / Direct Plan : Axis Hybrid Fund - Series 5: 2.27% / 1.42%, Axis Hybrid Fund - Series 6: 2.28% / 1.43%, Axis Hybrid Fund - Series 7: 2.28% / 1.43%, Axis Hybrid Fund - Series 8: 2.27% / 1.32%, Axis Hybrid Fund - Series 9: 2.28% / 1.33%, Axis Hybrid Fund - Series 11: 2.32% / 1.37%, Axis Hybrid Fund - Series 12: 2.29% / 1.34%, Axis Hybrid Fund - Series 13 : 2.20% / 1.25%, Axis Hybrid Fund - Series 14 : 2.21% / 1.21%, Axis Hybrid Fund - Series 15 : 2.27% / 1.27%, Axis Hybrid Fund - Series 18 : 2.20% / 1.15%, Axis Hybrid Fund - Series 19 : 2.28% / 1.23%, Axis Hybrid Fund - Series 22 : 2.06% / 0.87%, Axis Hybrid Fund - Series 23 : 2.07% /0.88%, Axis Hybrid Fund - Series 24 : 2.04% / 0.85%, Axis Hybrid Fund - Series 25 : 2.15% / 0.96%, Axis Hybrid Fund - Series 26 : 2.13% / 0.94%, Axis Hybrid Fund - Series 27 : 2.09% /0.90%, Axis Hybrid Fund - Series 28 : 2.11% / 0.92%, Axis Hybrid Fund - Series 29 : 2.25% / 1.06%, Axis Hybrid Fund - Series 30 : 2.21% / 1.02%, Axis Hybrid Fund - Series 31* : 2.11% / 0.81%, Axis Hybrid Fund - Series 32* : 2.08% / 1.08%, Axis Hybrid Fund - Series 33* : 2.08% / 0.78%, Axis Hybrid Fund - Series 35* : 2.14% / 0.84%, Axis Liquid Fund : 0.11% / 0.03%, Axis Treasury Advantage Fund : 0.55% / 0.25%, Axis Banking & PSU Debt Fund : 0.35% / 0.20%, Axis Short Term Fund : 0.85% / 0.25%, Axis Dynamic Bond Fund : 1.30% / 0.55%, Axis Constant Maturity 10 Year Fund : 0.65% / 0.20%, Axis Income Fund : 1.00% / 0.49%, Axis Gold ETF : 1.00% / -, Axis Gold Fund :1.00% / 0.15%, Axis Fixed Income Opportunities Fund* : 1.25% / 0.20%, Axis Enhanced Arbitrage Fund : 0.85% / 0.25%, Axis Income Saver* : 2.13% / 1.26%, Axis Long Term Equity Fund*: 1.98% / 1.28%, Axis Focused 25 Fund* : 2.30% / 1.57%, Axis Equity Fund* : 2.11% / 1.41%, Axis Triple Advantage Fund : 1.75% / 0.85%, Axis Midcap Fund* : 2.22% / 1.41%, Axis Equity Saver Fund* : 2.30% / 1.51%, Axis Small Cap Fund : 2.52% / 1.57%, Axis Children’s Gift Fund* : 2.55% / 1.10%, Axis Capital Protection Oriented Fund -Series 5: 2.45% / -, Axis Emerging Opportunities Fund* - Series 1: 2.26 / 0.96, Axis Fixed Maturity Plan - Series 42 : 0.52% / 0.18%, Axis Fixed Maturity Plan - Series 43 : 0.41% / 0.05%, Axis Fixed Maturity Plan - Series 47 : 0.48% / 0.08%, Axis Fixed Maturity Plan - Series 48 : 0.45% / 0.05%, Axis Fixed Maturity Plan - Series 49 : 0.23% / 0.05%, Axis Fixed Maturity Plan - Series 52 : 0.23% / 0.05%, Axis Fixed Maturity Plan - Series 53 : 0.52% / 0.08%, Axis Fixed Maturity Plan - Series 61 : 0.49% / 0.05%, Axis Fixed Maturity Plan - Series 64 : 0.49% / 0.05%, Axis Fixed Maturity Plan - Series 67 : 0.66% / 0.02%, Axis Fixed Maturity Plan - Series 69 : 0.58% / 0.05%, Axis Fixed Maturity Plan - Series 74 : 0.23% / 0.10%Service Tax on Management fees to the above mentioned schemes will be charged over and above Total Expense Ratio *In addition to the rates mentioned a proportionate charge in respect sales beyond T-15 cities subject to maximum of 30 bps on daily net assets has been charged in these schemes.

AXIS EQUITY FUND This product is suitable for investors who are seeking*l Capital appreciation over long terml Investment in a diversified portfolio predominantly consisting of equity and equity related instruments
AXIS FOCUSED 25 FUND This product is suitable for investors who are seeking*l Capital appreciation over long terml Investment in a concentrated portfolio of equity & equity related instruments of up to 25 companies
AXIS LONG TERM EQUITY FUND This product is suitable for investors who are seeking*l Capital appreciation & generating income over long terml Investment in a diversified portfolio predominantly consisting of equity and equity related instruments
AXIS MIDCAP FUND This product is suitable for investors who are seeking*l Capital appreciation over long terml Investment predominantly in equity and equity related instruments of mid size companies with focus on relatively larger companies within this category
AXIS TRIPLE ADVANTAGE FUND This product is suitable for investors who are seeking*l Capital appreciation & generating income over long term l Investment in a diversified portfolio of equity and equity related instruments, fixed income instruments & gold exchange traded funds
AXIS INCOME SAVER This product is suitable for investors who are seeking*l Capital appreciation while generating income over medium to long term l Investment in debt and money market instruments as well as equity and equity related instruments while managing risk through active asset allocation
AXIS GOLD ETF This product is suitable for investors who are seeking*l Capital Appreciation over medium to long terml Invests predominantly in gold in order to generate returns similar to the performance of gold, subject to tracking error
AXIS GOLD FUND This product is suitable for investors who are seeking*l Capital Appreciation over medium to long terml Invests predominantly in Axis Gold ETF in order to generate returns similar to the underlying fund, subject to tracking error
AXIS EQUITY SAVER FUND This product is suitable for investors who are seeking*l Capital Appreciation while generating income over medium to long terml Provide capiltal appreciation and income distribution to the investors by using equity and equity related instruments, arbitrage opportunities and investments in debt and money market instruments
AXIS CHILDREN’S GIFT FUND This product is suitable for investors who are seeking*l Capital appreciation & generating income over medium to long terml Investment in debt and money market instruments as well as equity and equity related instruments
AXIS CONSTANT MATURITY 10 YEAR FUND This product is suitable for investors who are seeking*l Credit risk free returns over medium to long terml Investment mainly in Government securities to generate returns similar to that of 10 year government bonds
AXIS DYNAMIC BOND FUND This product is suitable for investors who are seeking*l Optimal returns over medium to long terml To generate stable returns while maintaining liquidity through active management of a portfolio of debt and money market instruments
AXIS INCOME FUND This product is suitable for investors who are seeking*l Optimal returns over medium terml Investment in diversified portfolio of high quality debt and money market securities to generate optimal risk adjusted returns while maintaining liquidity
AXIS ENHANCED ARBITRAGE FUND This product is suitable for investors who are seeking*l Income over short to medium terml Investment in arbitrage opportunities in the cash & derivatives segment of the equity market
AXIS FIXED INCOME OPPORTUNITIES FUND This product is suitable for investors who are seeking*l Stable returns in the short to medium terml Investment in debt and money market instruments across the yield curve and credit spectrum
AXIS SHORT TERM FUND This product is suitable for investors who are seeking*l Regular income while maintaining liquidity over short to medium term l Investment in debt and money market instruments
AXIS BANKING & PSU DEBT FUND This product is suitable for investors who are seeking* l Regular income over short to medium terml Investment in debt and money market instruments issued by banks, PFIs & PSUs
AXIS TREASURY ADVANTAGE FUND This product is suitable for investors who are seeking*l Regular income over short terml Investment in debt and money market instruments
AXIS LIQUID FUND This product is suitable for investors who are seeking*l Regular income over short terml Investment in debt and money market instruments
PRODUCT LABELLING
25
*Investors should consult their financial advisers if in doubt about whether the product is suitable for them
Riskometer
Investors understand that their principal will be
at moderately high risk
LOW HIGH
Moderate ModeratelyHighM
oderate
ly
Low
HighLo
w
Riskometer
Investors understand that their principal will be
at moderate risk
LOW HIGH
Moderate ModeratelyHighM
oderate
ly
Low
HighLo
w
Riskometer
Investors understand that their principal will be
at moderately low risk
LOW HIGH
Moderate ModeratelyHighM
oderate
ly
Low
HighLo
w
Riskometer
Investors understand that their principal will be
at low risk
LOW HIGH
Moderate ModeratelyHighM
oderate
ly
Low
HighLo
w
Statutory Details & Disclaimers :Axis Mutual Fund has been established as a Trust under the Indian Trusts Act, 1882, sponsored by Axis Bank Ltd. (liability restricted to ` 1 Lakh). Trustee: Axis Mutual Fund Trustee Limited. Investment Manager: Axis Asset Management Company Limited (the AMC). Risk Factors: Axis Bank Limited is not liable or responsible for any loss or shortfall resulting from the operation of any of the mutual fund schemes launched by the AMC. Mutual Fund Investments are subject to market risks, read all scheme related documents carefully.

To know more, visit www.axismf.com