singlet oxygen triplet energy transfer-based imaging ...shulab.ucsf.edu/pub_to natcomm2014.pdf ·...
TRANSCRIPT

ARTICLE
Received 15 Mar 2014 | Accepted 8 May 2014 | Published 6 Jun 2014
Singlet oxygen triplet energy transfer-basedimaging technology for mapping protein–proteinproximity in intact cellsTsz-Leung To1, Michael J. Fadul1 & Xiaokun Shu1
Many cellular processes are carried out by large protein complexes that can span several tens
of nanometres. Whereas forster resonance energy transfer has a detection range of o10 nm,
here we report the theoretical development and experimental demonstration of a new
fluorescence-imaging technology with a detection range of up to several tens of nanometres:
singlet oxygen triplet energy transfer. We demonstrate that our method confirms the
topology of a large protein complex in intact cells, which spans from the endoplasmic
reticulum to the outer mitochondrial membrane and the matrix. This new method is thus
suited for mapping protein proximity in large protein complexes.
DOI: 10.1038/ncomms5072
1 Department of Pharmaceutical Chemistry, Cardiovascular Research Institute, University of California, San Francisco, California 94158, USA. Correspondenceand requests for materials should be addressed to X.S. (email: [email protected]).
NATURE COMMUNICATIONS | 5:4072 | DOI: 10.1038/ncomms5072 | www.nature.com/naturecommunications 1
& 2014 Macmillan Publishers Limited. All rights reserved.

Protein machines carry out almost every major biologicalprocess, including DNA replication, gene transcription,protein translation and degradation of RNA and protein1.
Recently, with the use of global proteomic methods, the numberof identified stable protein associations has increased2–4. To gaininsight into molecular mechanisms, forster resonance energytransfer (FRET) has been widely used to characterize protein–protein interactions5,6. FRET is based on the interaction betweena donor’s emission and an acceptor’s absorption dipole moments.Because the dipole–dipole interaction decays rapidly overdistance, FRET has a detection range of o10 nm, which limitsits application in multi-protein complexes that span several tensof nanometres (nm) in diameter. To overcome FRET’s distancelimitation, we have developed a new method of molecularimaging: singlet oxygen triplet energy transfer (STET).
STET is based on a photosensitizing singlet oxygen generator(SOG) and a fluorescent singlet oxygen sensor (SOS). Theproximity of protein X to protein Y can be assayed by fusing X toSOG and Y to SOS. Upon illumination, SOG is excited to thefirst-excited-singlet-state (S1), which crosses to the first-excited-triplet-state (T1) via intersystem crossing. Intersystem crossing ismade possible through a spin–orbit interaction that flips the spinof the excited electron, resulting in the non-radiative S1-T1
transition7. The SOG at the T1 state can then convert tripletoxygen (3O2) into singlet oxygen (1O2) through triplet energytransfer8,9. Reactive 1O2 reaching SOS through diffusion reactswith the sensor to alter its fluorescence intensity. Whether or notthis reaction is limited by singlet oxygen diffusion depends on thereaction rate of the specific SOS with singlet oxygen. Regardless ofthis, the fluorescence-intensity change rate of SOS is dependenton the amount of 1O2 it senses per time (that is, the flux of 1O2),which is a function of distance: the closer the two proteins are, thefaster the fluorescence intensity of SOS changes.
Here, we define the fluorescence-intensity change rate of SOSas a STET signal, which reports protein proximity. Because 1O2
has been estimated to diffuse at least several tens of nanometres incells within its half-life10,11, STET is expected to function over agreater distance (430 nm) than FRET. We use a previouslyengineered infrared fluorescent protein (IFP1.4) as SOS12, and asmall singlet oxygen photosensitizer (miniSOG) as a SOG13. Wefirst demonstrate that IFP1.4 specifically senses singlet oxygen,but not other reactive oxygen species (ROS), including hydrogenperoxide (H2O2), superoxide and a hydroxyl radical. We alsoshow that this specific sensitivity of IFP1.4 to singlet oxygen ismainly owing to its chromophore, biliverdin (BV). Next, weconfirmed that singlet oxygen is involved in STET, while otherROS are not. We then demonstrate that STET signal is dependenton the distance between the sensor and the generator, by using
linkers of different lengths between SOG and SOS. Todemonstrate STET in intact cells, we choose a large proteincomplex that spans from the endoplasmic reticulum (ER) to themitochondrial outer membrane (MOM) and the matrix. Weshow that the STET signal confirms the topology of the complex.Finally, our STET experiment suggests that a mitochondrial innermembrane (MIM) protein that has previously been shown togenetically interact with other components of the machinery islikely to be part of the complex.
ResultsConcept of STET. To realize the concept of STET (Fig. 1a), wemade use of two genetically encoded protein tags, miniSOG andIFP1.4, which require no exogenous cofactors. miniSOG is greenfluorescent and generates 1O2 when illuminated with blue light(450–490 nm)13. IFP1.4 absorbs maximally at 684 nm and emitsat 710 nm12. Thus, there is little spectral overlap between SOGand SOS. Both SOG and SOS are monomeric, making it unlikelyfor them to alter the stoichiometry of tagged proteins, which isnecessary for the correct assembly of complexes.
To demonstrate the dependence of STET on protein proximity,we compared the STET signals of a purified fusion protein ofSOG and SOS with that of a mixture of individually purified SOGand SOS. Constant blue-light illumination (488 nm) of the fusionprotein, which produces 1O2 from SOG, caused a decrease in theinfrared fluorescence intensity of SOS (Fig. 1b). The naturallogarithm of normalized SOS fluorescence intensity at differenttime points fits the linear equation y¼ � at, suggesting that SOSsenses a constant flux of 1O2. In other words, constantillumination of SOG creates a steady state of concentrationgradient of 1O2. We calculated the STET signal from the slope (a)of the fitted equation (details in Methods). Importantly, the SOG/SOS fusion protein has a significantly larger STET signal than themixture (Fig. 1b), demonstrating that STET reflects proteinproximity (see further characterizations in the following sections).
Reaction of IFP1.4 with ROS. To demonstrate that IFP1.4 is aSOS, we reacted IFP1.4 with various ROS (Fig. 2). For the reac-tion with superoxide, we used two different sources of superoxide:potassium superoxide (KO2) (Fig. 2b); and superoxide generatedby the reaction of xanthine oxidase and xanthine (Fig. 2c)14. Onaddition of superoxide from each source, the fluorescence ofIFP1.4 did not change (Fig. 2b,c, Methods). On the other hand,the fluorescence of hydrocyanine 3 (a fluorogenic probe forsuperoxide) increased significantly upon reaction with KO2
(Supplementary Fig. 1a). Next, we reacted IFP1.4 with H2O2,which also had no effect on the fluorescence of IFP1.4 (Fig. 2d).
SOG/SOS fusion
STET
SOS
SOG
XY
ISCS1(↑↓)
T1(↑↑)1O2(↑↓)
3O2(↑↑)S0(↑↓)
SOSSOG
SOG+SOS mixture y = –0.0353×
y = –0.0056×
R2 = 0.9798
R2 = 0.95777
0 1 2 3 4 5Time (s)
0
–0.05
–0.1
–0.15
–0.2Ln (
norm
. SO
S fl
uore
scen
ce)
Figure 1 | Development of singlet oxygen triplet energy transfer-based technology. (a) Schematic diagram showing physical principles of STET.
(b) Natural logarithm of normalized fluorescence intensity of SOS over time under blue-light illumination in the fusion (1 mM) versus mixture of SOG and
SOS (1 mM each).
ARTICLE NATURE COMMUNICATIONS | DOI: 10.1038/ncomms5072
2 NATURE COMMUNICATIONS | 5:4072 | DOI: 10.1038/ncomms5072 | www.nature.com/naturecommunications
& 2014 Macmillan Publishers Limited. All rights reserved.

To test whether the hydroxyl radical could affect the IFP1.4’sfluorescence, we used Fenton’s reaction to generate the hydroxylradical by reacting H2O2 with Fe2þ . However, the fluorescence ofIFP1.4 did not change (Fig. 2e). Finally, we reacted IFP1.4 withsinglet oxygen. We used two sources of singlet oxygen: (1)reacting H2O2 with sodium hypochlorite (NaClO) (Fig. 2g); (2)perinaphthenone, an efficient singlet oxygen photosensitizer,which generates singlet oxygen upon blue-light excitation(Fig. 2h)15. IFP1.4 reacted strongly with both sources of singletoxygen, based on the significant change of its fluorescence(Fig. 2g,h). As a control, sodium chlorite has no effect on IFP1.4’sfluorescence (Fig. 2f). These results demonstrate that IFP1.4senses singlet oxygen but not other ROS including superoxide,H2O2 and hydroxyl radical. We therefore conclude that IFP1.4 isa specific SOS.
We then tried to explain why IFP1.4 specifically senses singletoxygen. It is known that ROS including H2O2, superoxide,hydroxyl radical and singlet oxygen can generally react withproteins. Our data showing that IFP1.4 only senses singlet oxygenthus suggest that the specificity may come from the chromophoreof IFP1.4, BV. To test this hypothesis, we reacted BV with variousROS and monitored its absorbance over time (Fig. 3). First, therewas no change in the absorbance spectra of BV when we addedKO2 (Fig. 3b), similar to the no-ROS control (Fig. 3a). Thissuggests that BV did not react with superoxide. Similarly, weobserved no absorbance change in BV when it was mixed withH2O2 solution (Fig. 3c) or the Fenton’s reagent (Fig. 3d), suggesting
that BV did not react with H2O2 or hydroxyl radical. Finally, wereacted BV with perinaphthenone under blue-light excitation anddetected a significant decrease in the absorbance spectra (Fig. 3e),indicating that BV reacted readily with singlet oxygen. Interestinglyreaction of BV with singlet oxygen has been previously reported16.Our results demonstrate that BV reacts specifically with singletoxygen but not any other ROS examined here.
Furthermore, reaction of IFP1.4 with singlet oxygen resulted indecrease of the absorbance peak (684 nm) of IFP1.4(Supplementary Fig. 1b). Since the absorbance peak of free BVis 660 nm, and we did not observe a blue shift of the IFP1.4’sabsorbance peak, our data suggest that reaction of IFP1.4 withsinglet oxygen does not cause release of bound BV from theprotein. Thus the loss of IFP1.4’s fluorescence upon reaction withsinglet oxygen is caused by reaction of singlet oxygen with BV.On the basis of these results, we conclude that the specificsensitivity of IFP1.4 towards singlet oxygen is mainly due to thereaction of its chromophore with singlet oxygen. Althoughreaction of other ROS with the protein has no apparent effect onthe fluorescence of IFP1.4, we cannot exclude the possibility,despite its unlikelihood, that reaction of singlet oxygen withresidues in the protein may also contribute to the change ofIFP1.4’s fluorescence.
Effect of various ROS quenchers on STET. The demonstrationof IFP1.4 as a specific SOS strongly suggests that singlet oxygen is
Untreated Superoxide (KO2)
H2O2
Superoxide (xanthine + xanthineoxidase)
Hydroxyl (H2O2 + FeSO4)
1O2 (Perinaphthenone + bluelight)
1O2 (H2O2 + NaCIO)
NaCIO
IFP1.4
Emission wavelength (nm)
650 700 750 800Emission wavelength (nm)
650 700 750 800
Emission wavelength (nm)650 700 750 800
Emission wavelength (nm)650 700 750 800
Emission wavelength (nm)650 700 750 800
Emission wavelength (nm)650 700 750 800
Emission wavelength (nm)650 700 750 800
Emission wavelength (nm)650 700 750 800
IFP
fluo
resc
ence
(a.
u.) 80,000
60,000
40,000
20,000
0 IFP
fluo
resc
ence
(a.
u.) 80,000
60,000
40,000
20,000
0
IFP
fluo
resc
ence
(a.
u.) 80,000
60,000
40,000
20,000
0 IFP
fluo
resc
ence
(a.
u.) 80,000
60,000
40,000
20,000
0IFP
fluo
resc
ence
(a.
u.) 80,000
60,000
40,000
20,000
0
IFP
fluo
resc
ence
(a.
u.) 80,000
60,000
40,000
20,000
0 IFP
fluo
resc
ence
(a.
u.) 80,000
60,000
40,000
20,000
0
IFP
fluo
resc
ence
(a.
u.) 80,000
60,000
40,000
20,000
0
Figure 2 | Reaction of IFP1.4 with reactive oxygen species. Fluorescence spectra of IFP1.4 reacted: (a) without ROS; (b) with superoxide from KO2;
(c) with superoxide generated by xanthine and xanthine oxidase; (d) with hydrogen peroxide; (e) with hydroxyl radical; (f) with sodium hypo-
chlorite; (g) with singlet oxygen generated from hydrogen peroxide and sodium hypochlorite; and (h) with singlet oxygen photo-generated from
perinaphthenone. Different colours of the lines refer to time after reaction (a–g) or exposure time (h): blue (0 min); red (5 min); green (10 min); purple
(15 min); cyan (20 min).
NATURE COMMUNICATIONS | DOI: 10.1038/ncomms5072 ARTICLE
NATURE COMMUNICATIONS | 5:4072 | DOI: 10.1038/ncomms5072 | www.nature.com/naturecommunications 3
& 2014 Macmillan Publishers Limited. All rights reserved.

involved in producing the STET signal. To further confirm this,we tried to quench STET using various ROS quenchers (Fig. 4).On addition of superoxide dismutase (SOD), a superoxidequencher, to the solution of IFP1.4 and miniSOG, we did notobserve any effect on STET (Fig. 4c,f). The STET signal in thepresence of SOD is similar to the control without any quencher(Fig. 4b,f). Addition of catalase, a H2O2 quencher, did not affectSTET either (Fig. 4d,f). Finally, we tested whether a singlet oxy-gen quencher would quench STET. Because sodium azide isknown to quench the triplet-excited state of flavin mononucleo-tide17 (the chromophore of miniSOG), we decided to useglutathione (GSH). GSH has been shown to react and quench
singlet oxygen efficiently, forming various products includingGSH disulphide, GSH sulphoxide, GSH sulphonate and GSHsulphinate18. On addition of GSH, STET is completely quenched(Fig. 4e,f) to a level similar to the control without SOG (Fig. 4a,f).These results confirm that singlet oxygen is involved in STET,whereas other ROS including superoxide, H2O2 and hydroxylradical are not.
Dependence of STET on distance. To further demonstrate thatSTET is dependent on the distance between SOG and SOS, wemade three constructs that connect SOG and SOS with linkers of
Untreated Superoxide (KO2)
Hydroxyl (H2O2 + FeSO4)H2O2 1O2 (perinaphthenone + bluelight)
BV
Abs
orba
nce
(OD
) 0.6
0.5
0.4
0.3
0.2
0.1
0
Abs
orba
nce
(OD
)
Abs
orba
nce
(OD
)
0.6
0.5
0.4
0.3
0.2
0.1
0
0.6
0.8
0.4
0.2
0
Wavelength (nm)
Abs
orba
nce
(OD
)
0.6
0.5
0.4
0.3
0.2
0.1
0
Abs
orba
nce
(OD
)
0.6
0.5
0.4
0.3
0.2
0.1
0
Wavelength (nm)200 400 600 800 200 400 600 800
Wavelength (nm)200 400 600 800
Wavelength (nm)200 400 600 800
Wavelength (nm)200 400 600 800
Figure 3 | Reaction of biliverdin with reactive oxygen species. Absorbance spectra of biliverdin reacted: (a) without ROS; (b) with superoxide from KO2;
(c) with hydrogen peroxide; (d) with hydroxyl radical; and (e) with singlet oxygen photo-generated from perinaphthenone. Different colours of the lines
refer to time after reaction (a–d) or exposure time (e): blue (0 min); red (5 min); green (10 min); purple (15 min); cyan (20 min).
IFP
fluo
resc
ence
(a.u
.)
Emission wavelength (nm)
No SOG
IFP1.4
660 680 700 720 740 760 780
40,000
30,000
20,000
10,000
0 IFP
fluo
resc
ence
(a.u
.)
Emission wavelength (nm)
SOG
660 680 700 720 740 760 780
40,000
30,000
20,000
10,000
0
IFP
fluo
resc
ence
(a.u
.)
Emission wavelength (nm)
No SOG
SOG
SOG+GSH
SOG + GSH
SOG+SOD
SOG + SOD
SOG+catalase
SOG + catalase
660 680 700 720 740 760 780
40,000
30,000
20,000
10,000
0
IFP
fluo
resc
ence
(a.u
.)
Emission wavelength (nm)
660 680 700 720 740 760 780
40,000
30,000
20,000
10,000
0
Ln (
Nor
m. I
FP
fluor
esce
nce)
0 5 10 15Time (min)
0.1
–0.1–0.2–0.3–0.4–0.5–0.6
0
IFP
fluo
resc
ence
(a.u
.)
Emission wavelength (nm)660 680 700 720 740 760 780
40,000
30,000
20,000
10,000
0
Figure 4 | Quenching of STET with various ROS quenchers. (a) Fluorescence spectra of IFP1.4 without SOG. (b) Fluorescence spectra of IFP1.4 in the
presence of SOG. (c–e) Fluorescence spectra of IFP1.4 in the presence of SOG and (c) superoxide quencher SOD; (d) hydrogen peroxide quencher catalase; and
(e) singlet oxygen quencher glutathione (GSH). (f) Natural logarithm of normalized fluorescence intensity of IFP1.4 over time under blue-light illumination.
Different colours of the lines refer to time after reaction (a–e): blue (0 min); red (5 min); green (10 min); purple (15 min); cyan (20 min, panel e only).
ARTICLE NATURE COMMUNICATIONS | DOI: 10.1038/ncomms5072
4 NATURE COMMUNICATIONS | 5:4072 | DOI: 10.1038/ncomms5072 | www.nature.com/naturecommunications
& 2014 Macmillan Publishers Limited. All rights reserved.
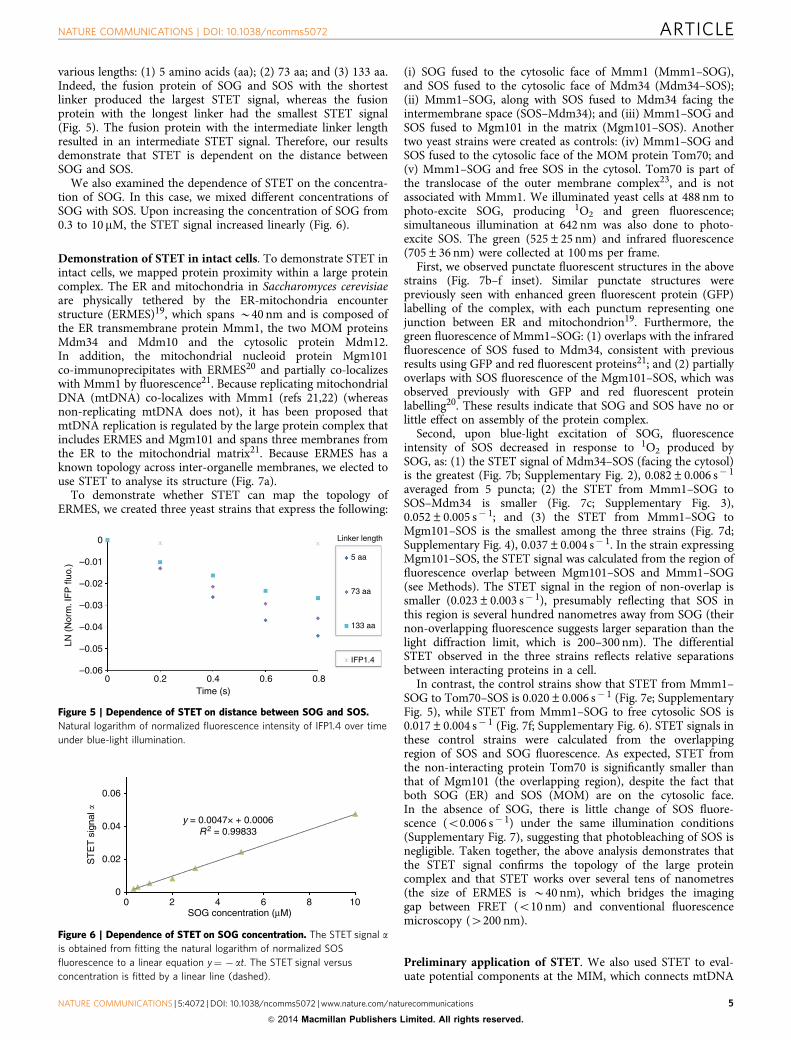
various lengths: (1) 5 amino acids (aa); (2) 73 aa; and (3) 133 aa.Indeed, the fusion protein of SOG and SOS with the shortestlinker produced the largest STET signal, whereas the fusionprotein with the longest linker had the smallest STET signal(Fig. 5). The fusion protein with the intermediate linker lengthresulted in an intermediate STET signal. Therefore, our resultsdemonstrate that STET is dependent on the distance betweenSOG and SOS.
We also examined the dependence of STET on the concentra-tion of SOG. In this case, we mixed different concentrations ofSOG with SOS. Upon increasing the concentration of SOG from0.3 to 10 mM, the STET signal increased linearly (Fig. 6).
Demonstration of STET in intact cells. To demonstrate STET inintact cells, we mapped protein proximity within a large proteincomplex. The ER and mitochondria in Saccharomyces cerevisiaeare physically tethered by the ER-mitochondria encounterstructure (ERMES)19, which spans B40 nm and is composed ofthe ER transmembrane protein Mmm1, the two MOM proteinsMdm34 and Mdm10 and the cytosolic protein Mdm12.In addition, the mitochondrial nucleoid protein Mgm101co-immunoprecipitates with ERMES20 and partially co-localizeswith Mmm1 by fluorescence21. Because replicating mitochondrialDNA (mtDNA) co-localizes with Mmm1 (refs 21,22) (whereasnon-replicating mtDNA does not), it has been proposed thatmtDNA replication is regulated by the large protein complex thatincludes ERMES and Mgm101 and spans three membranes fromthe ER to the mitochondrial matrix21. Because ERMES has aknown topology across inter-organelle membranes, we elected touse STET to analyse its structure (Fig. 7a).
To demonstrate whether STET can map the topology ofERMES, we created three yeast strains that express the following:
(i) SOG fused to the cytosolic face of Mmm1 (Mmm1–SOG),and SOS fused to the cytosolic face of Mdm34 (Mdm34–SOS);(ii) Mmm1–SOG, along with SOS fused to Mdm34 facing theintermembrane space (SOS–Mdm34); and (iii) Mmm1–SOG andSOS fused to Mgm101 in the matrix (Mgm101–SOS). Anothertwo yeast strains were created as controls: (iv) Mmm1–SOG andSOS fused to the cytosolic face of the MOM protein Tom70; and(v) Mmm1–SOG and free SOS in the cytosol. Tom70 is part ofthe translocase of the outer membrane complex23, and is notassociated with Mmm1. We illuminated yeast cells at 488 nm tophoto-excite SOG, producing 1O2 and green fluorescence;simultaneous illumination at 642 nm was also done to photo-excite SOS. The green (525±25 nm) and infrared fluorescence(705±36 nm) were collected at 100 ms per frame.
First, we observed punctate fluorescent structures in the abovestrains (Fig. 7b–f inset). Similar punctate structures werepreviously seen with enhanced green fluorescent protein (GFP)labelling of the complex, with each punctum representing onejunction between ER and mitochondrion19. Furthermore, thegreen fluorescence of Mmm1–SOG: (1) overlaps with the infraredfluorescence of SOS fused to Mdm34, consistent with previousresults using GFP and red fluorescent proteins21; and (2) partiallyoverlaps with SOS fluorescence of the Mgm101–SOS, which wasobserved previously with GFP and red fluorescent proteinlabelling20. These results indicate that SOG and SOS have no orlittle effect on assembly of the protein complex.
Second, upon blue-light excitation of SOG, fluorescenceintensity of SOS decreased in response to 1O2 produced bySOG, as: (1) the STET signal of Mdm34–SOS (facing the cytosol)is the greatest (Fig. 7b; Supplementary Fig. 2), 0.082±0.006 s� 1
averaged from 5 puncta; (2) the STET from Mmm1–SOG toSOS–Mdm34 is smaller (Fig. 7c; Supplementary Fig. 3),0.052±0.005 s� 1; and (3) the STET from Mmm1–SOG toMgm101–SOS is the smallest among the three strains (Fig. 7d;Supplementary Fig. 4), 0.037±0.004 s� 1. In the strain expressingMgm101–SOS, the STET signal was calculated from the region offluorescence overlap between Mgm101–SOS and Mmm1–SOG(see Methods). The STET signal in the region of non-overlap issmaller (0.023±0.003 s� 1), presumably reflecting that SOS inthis region is several hundred nanometres away from SOG (theirnon-overlapping fluorescence suggests larger separation than thelight diffraction limit, which is 200–300 nm). The differentialSTET observed in the three strains reflects relative separationsbetween interacting proteins in a cell.
In contrast, the control strains show that STET from Mmm1–SOG to Tom70–SOS is 0.020±0.006 s� 1 (Fig. 7e; SupplementaryFig. 5), while STET from Mmm1–SOG to free cytosolic SOS is0.017±0.004 s� 1 (Fig. 7f; Supplementary Fig. 6). STET signals inthese control strains were calculated from the overlappingregion of SOS and SOG fluorescence. As expected, STET fromthe non-interacting protein Tom70 is significantly smaller thanthat of Mgm101 (the overlapping region), despite the fact thatboth SOG (ER) and SOS (MOM) are on the cytosolic face.In the absence of SOG, there is little change of SOS fluore-scence (o0.006 s� 1) under the same illumination conditions(Supplementary Fig. 7), suggesting that photobleaching of SOS isnegligible. Taken together, the above analysis demonstrates thatthe STET signal confirms the topology of the large proteincomplex and that STET works over several tens of nanometres(the size of ERMES is B40 nm), which bridges the imaginggap between FRET (o10 nm) and conventional fluorescencemicroscopy (4200 nm).
Preliminary application of STET. We also used STET to eval-uate potential components at the MIM, which connects mtDNA
LN (
Nor
m. I
FP
fluo
.)
0
–0.01
–0.02
–0.03
–0.05
–0.06
–0.04
Time (s)0 0.2 0.4 0.6 0.8
IFP1.4
133 aa
73 aa
5 aa
Linker length
Figure 5 | Dependence of STET on distance between SOG and SOS.
Natural logarithm of normalized fluorescence intensity of IFP1.4 over time
under blue-light illumination.
SOG concentration (μM)
y = 0.0047× + 0.0006R2 = 0.99833
ST
ET
sig
nal �
0.06
0.04
0.02
00 2 4 6 8 10
Figure 6 | Dependence of STET on SOG concentration. The STET signal ais obtained from fitting the natural logarithm of normalized SOS
fluorescence to a linear equation y¼ � at. The STET signal versus
concentration is fitted by a linear line (dashed).
NATURE COMMUNICATIONS | DOI: 10.1038/ncomms5072 ARTICLE
NATURE COMMUNICATIONS | 5:4072 | DOI: 10.1038/ncomms5072 | www.nature.com/naturecommunications 5
& 2014 Macmillan Publishers Limited. All rights reserved.

to ERMES. Two transmembrane proteins in the MIM, Mdm31and Mdm32, were previously shown to be functionally importantin maintaining mtDNA24. However, it is unknown whether theyphysically link ERMES to Mgm101 and/or mtDNA. Ourpreliminary results suggest that the MIM protein Mdm32 couldbe a physical linker, as evidenced by a strong STET signal of0.054±0.003 s� 1 (Fig. 8; Supplementary Fig. 8). Nevertheless,further interrogations using genetic and biochemical methods arenecessary to confirm our result.
DiscussionTo overcome the distance limitation of FRET, we have developedand demonstrated a new imaging method, STET, based on thelong diffusion distance of singlet oxygen over at least several tensof nanometres in cells. Measuring the exact diffusion distance ofsinglet oxygen in cells is challenging, though. The diffusiondistance depends on the singlet oxygen lifetime and the diffusioncoefficient of singlet oxygen in the specific part of the cell. It ischallenging to measure both values accurately, although signi-ficant advancement has been achieved recently25. Although the
exact diffusion distance may require further investigation, itseems clear that singlet oxygen can diffuse at least several tens ofnanometres in cells within its half-life. Therefore, STET is able todetect protein proximity over much longer distances (430 nm)than FRET (o10 nm).
We have demonstrated that IFP1.4 is a specific SOS byreacting IFP1.4 with different ROS and monitoring its infraredfluorescence. We have further shown that this specificity is due tothe specific reactivity of BV, the chromophore of IFP1.4, withsinglet oxygen. Although H2O2, superoxide, and hydroxyl radicalare all known to react with proteins—which would change thelocal environment of the chromophore—it seems that such apotential change does not perturb the electronic structure of BVin IFP1.4.
We have also verified that singlet oxygen, but not other ROS, isinvolved in STET by using different ROS quenchers. This isconsistent with the original work of miniSOG13, in whichminiSOG is designed and shown to efficiently polymerizediaminobenzidine (DAB) to generate electron microscopic(EM) contrast in order to locate proteins of interest in cells atnanometre resolution. It is well known through decades of work
MIM
SOS
SOS
SOSSOSSOSSOS
d1
d2d3
MOMCytosol
IMS
Mgm101
Mdm10
mtDNA
Ln (
norm
. SO
S fl
uore
scen
ce)
Mdm34–SOS (d1)
Mdm101–SOS (d3)
SOS (cytosol)Tom70–SOS (MOM)
SOS–Mdm34 (d2)
y = –0.075×R 2 = 0.977
y = –0.033×R 2 = 0.900y = –0.050×
R 2 = 0.959
y = –0.020×R2 = 0.855
y = –0.013×R 2 = 0.506
MergeSOS SOG
MergeSOS SOGMergeSOS SOG
MergeSOS SOGMergeSOS SOG
Time (s)0 1 2 3 4 5 6
Time (s)0 1 2 3 4 5 6
Time (s)0 1 2 3 4 5 6
Time (s)0 1 2 3 4 5 6
Time (s)0 1 2 3 4 5 6
0.1
–0.1
–0.2
–0.3
–0.4
–0.5
–0.6
0
Ln (
norm
. SO
S fl
uore
scen
ce) 0.1
–0.1
–0.2
–0.3
–0.4
–0.5
–0.6
0
Ln (
norm
. SO
S fl
uore
scen
ce) 0.1
–0.1
–0.2
–0.3
–0.4
–0.5
–0.6
0
Ln (
norm
. SO
S fl
uore
scen
ce) 0.1
–0.1
–0.2
–0.3
–0.4
–0.5
–0.6
0
Ln (
norm
. SO
S fl
uore
scen
ce) 0.1
–0.1
–0.2
–0.3
–0.4
–0.5
–0.6
0
Mdm
12
Mdm
34Mmm1
ER
Figure 7 | STET reports protein proximity in intact cells. (a) Schematic diagram showing topology of the ERMES complex. (b–f) Natural logarithm
of normalized fluorescence intensity of SOS (region within white circle in the inset) over time under blue-light illumination (488 nm) with SOG
attached to the cytosolic face of Mmm1 and SOS to: the cytosolic face of Mdm34 (b); the IMS face of Mdm34 (c); the Mgm101 in the matrix (d); the
cytosolic face of Tom70 (e); and the cytosol (that is, free SOS) (f). IMS: intermembrane space. (MOM, mitochondrial outer membrane. Blue diamond
indicates measured data point. Solid line indicates linear fit of the data. Insets show fluorescence images at time¼0 s).
ARTICLE NATURE COMMUNICATIONS | DOI: 10.1038/ncomms5072
6 NATURE COMMUNICATIONS | 5:4072 | DOI: 10.1038/ncomms5072 | www.nature.com/naturecommunications
& 2014 Macmillan Publishers Limited. All rights reserved.

that efficient singlet oxygen photosensitizers, such as Eosin, canpolymerize DAB26.
After the publication of miniSOG, two groups have reportedthat singlet oxygen generation by miniSOG is complicated. Bothgroups have observed that initially miniSOG photo-producessinglet oxygen inefficiently, with a quantum yield of 0.03±0.01(ref. 27) or 0.030±0.002 (ref. 28). Under prolonged irradiation,however, the singlet oxygen generation quantum yield increasessignificantly (up to 10-fold). To explain the initial small singletoxygen quantum yield of miniSOG, the two groups haveproposed different mechanisms though.
On the one hand, Ruiz-Gonzalez et al.27 attributed the smallsinglet oxygen quantum yield to ‘a substantial fraction of thenascent 1O2 molecules being quenched on their way off theprotein’. These authors have proposed that initially, certainresidues in the protein quench a significant amount of 1O2, whichaccounts for the small 1O2 quantum yield. After inactivation ofthose residues, 1O2 molecules can efficiently diffuse out of theprotein, which explains the irradiation-dependent increase of 1O2
quantum yield. On the other hand, Pimenta et al.28 haveproposed a different mechanism and hypothesized that type Ichemistry is involved, at the expense of singlet oxygen generationby type II chemistry. These authors have proposed that miniSOGphoto-generates H2O2 and superoxide ion. The authors arecautious about this hypothesis and have mentioned caveats intheir data, though.
Regardless of the disagreement on the possible mechanism forthe initially small 1O2 quantum yield of miniSOG, both groupsagreed and observed that 1O2 quantum yield increased signi-ficantly over time upon irradiation. As noted by Ruiz-Gonzalezet al.27, such irradiation-dependent increase of the quantumyield ‘y may be the reason why miniSOG outperforms otherfluorescent proteins reported to date as SOGs’. It is also consistentwith the previous observations, as mentioned in the miniSOGpaper13, that miniSOG can polymerize DAB significantly moreefficiently than ReAsH (1O2 quantum yield 0.024). It seems to usthat under the experimental settings for STET and EMapplications, miniSOG photo-generates 1O2 efficiently.Interestingly, Pimenta et al.28 observed that even afterprolonged irradiation when the 1O2 quantum yield increasedsignificantly, photobleaching of miniSOG was not observed,supporting such a notion that miniSOG is ‘activated’ under theEM and STET settings, with no photo-damage during such‘activation’.
We have shown that STET is dependent on distance betweenSOG and SOS. We have further demonstrated that STET is able
to confirm the topology of a large protein complex that spansfrom the ER to the mitochondrial matrix. For future applicationsof STET in comparing relative proximity between proteins in aprotein complex, we suggest fusing SOG to the same protein andfusing SOS to various interacting partners in order to obtaincomparable signals. This is because, as we have demonstrated, theSTET signal is linearly proportional to SOG concentration. Usingthe same SOG fusion will more likely assure similar SOGconcentration and thus comparable STET signals among differentprotein pairs. Furthermore, if SOG expression varies amongdifferent samples, we suggest to normalize the STET signal by theSOG fluorescence, which is linearly proportional to the SOGconcentration. We also suggest fixing cells to preserve the proteincomplex since oxidation of residues by singlet oxygen mightperturb the topology of a protein complex. Finally, we suggestusing constant irradiation so that a steady state of singlet oxygenconcentration gradient can be established in cells, which willdecrease the heterogeneity of cellular environment since the mainquenchers of singlet oxygen in cells have been previouslysuggested to be certain residues in proteins10,11,29 and oncethose residues are oxidized, a homogenous environment may beestablished.
In summary, we have developed the STET-imaging method,which can be used to detect protein–protein proximity overdistances spanning several tens of nanometres. The green andinfrared fluorescence of miniSOG and IFP1.4 can first be used toreveal whether potentially interacting proteins of interest arecolocalized. If they are colocalized under conventional micro-scopy, which would suggest that they are within B200 nm range,the users can then easily carry out the STET experiment toestimate the relative distance. The STET method is an alternativebut it is not intended to replace other imaging methods such assuper-resolution microscopy or electron microscopy.
MethodsProtein purification. SOG (miniSOG in this study), SOS (IFP1.4 in this study) andSOG/SOS fusion proteins were expressed with a C-terminal polyhistidine-tag on apBAD expression vector (Invitrogen), using TOP10 Escherichia coli (Invitrogen) asthe host. Three flexible polypeptide linkers of various lengths in amino acids (aa)were used in the SOG/SOS fusion proteins: 5 aa (50-GSSGG-30); 73 aa (50-GSGSAGGSAGGSAGGSAGGSAGGSAGGSADGSAGGSAGGSAGGSAGGSAGGSAGGSAGGSAGGSAGGSAGGSR-30); and 133 aa (50-GSGSAGGSAGGSAGGSAGGSAGGSAGGSAGGSAGGSAGGSAGGSAGGSAGGSAGGSAGGSAGGSAGGSAGGSAGGSAGGSAGGSAGGSAGGSAGGSAGGSAGGSAGGSAGGSAGGSAGGSAGGSAGGSAGGSR-30). Constructs are listed in Supplementary Table 1. Proteins werepurified with the Ni-NTA purification system (Qiagen). Sample concentrationswere quantified using the absorbance measurements of SOG and SOS and theirextinction coefficients12,13. STET experiments were performed with fluorescence
Ln (
Nor
m. S
OS
fluo
resc
ence
)
SOS SOG Merge
Time (s)
y = –0.050×R2 = 0.923
0 1 2 3 4 5 6
Mdm32–SOS
mtD
NA
(repli
catin
g)
0.1
0
–0.1
–0.2
–0.3
–0.4
–0.5
–0.6
MIM
MOMCytosol
ER
SOGSOS
Mmm1
Mdm12M
dm10 M
gm10
1
Mdm
34 Mdm
32
Figure 8 | STET identifies a potential interacting partner. (a) Proposed schematic diagram showing Mdm32 as the MIM component of the ERMES
complex. (b) Natural logarithm of normalized fluorescence intensity of SOS (region within white circle in the inset) over time under blue-light illumination
(488 nm) with SOG attached to the cytosolic face of Mmm1 and SOS to Mdm32. (MIM: mitochondrial inner membrane. Blue diamond indicates
measured data point. Solid line indicates linear fit of the data. Insets show fluorescence images at time¼0 s).
NATURE COMMUNICATIONS | DOI: 10.1038/ncomms5072 ARTICLE
NATURE COMMUNICATIONS | 5:4072 | DOI: 10.1038/ncomms5072 | www.nature.com/naturecommunications 7
& 2014 Macmillan Publishers Limited. All rights reserved.

microscopy (see the Imaging section for details) or a 450±20-nm blue LEDfollowed by fluorescence spectroscopy (see STET specificity section for details).Under the illumination conditions used, the photobleaching of SOS is negligible inthe absence of SOG (Fig. 4a; Supplementary Fig. 9).
STET specificity. To demonstrate the specificity of IFP SOS and its cofactor BV,various ROS were added to 1 mM of SOS (Fig. 2) or 50mM of BV (Fig. 3) in areaction volume of 100 ml. Superoxide (O2�� ) was generated either with 1 mM ofKO2 or by reacting 1 mM of xanthine with 10 mU of xanthine oxidase. H2O2 orsodium hypochlorite (NaClO) was added directly to the IFP or BV solution at afinal concentration of 1 mM. To generate hydroxyl radical (�HO) via the Fentonreaction, 0.1 mM of Fe2þ (from FeSO4) was mixed with 1 mM of H2O2. To gen-erate singlet oxygen (1O2) chemically, 1 mM of H2O2 and 1mM of NaClO weremixed and added to the IFP or BV solution. To generate 1O2 photochemically,10mM of perinaphthenone was added to the IFP or BV solution. The reactionmixture was then illuminated with a 450±20-nm blue LED (Innovations in Optics,Woburn, MA) at an intensity ofB50 mW cm� 2. The fluorescence emission (forSOS) and absorbance (for BV) spectra were measured at 25 �C at different timepoints. To further demonstrate specificity towards 1O2, STET experiments using amixture of 1 mM of SOG and 1 mM of SOS in a final volume of 100 ml wereperformed in the presence of various ROS quenchers (Fig. 4). Three ROSquenchers were used: 1 U of SOD, 100 mU of catalase and 1 mM of GSH. Thereaction mixture was illuminated with the 450±20-nm blue LED atB50 mW cm� 2. Fluorescence emission spectra of SOS were obtained at differenttime points. All reactions and spectroscopic measurements were performed inphosphate-buffered saline buffer at pH 7.4. The absorbance and fluorescenceemission spectra were obtained using the Tecan Infinite M1000 microplate reader.All chemicals were purchased from Sigma-Aldrich, except for xanthine (Calbio-chem) and xanthine oxidase (Roche).
Yeast strains and plasmids. S. cerevisiae BY4741 (Mata his3D1 leu2D0 met15D0ura3D0) was used as the parent strain. A haem oxygenase-1 (HO1) human gene,flanked by the yeast TEF1 promoter and CYC1 terminator, was integrated into thehis3 locus of BY4741 by homologous recombination to generate yTLT027. Het-erologous expression of haem oxygenase-1 produces IFP’s cofactor, BV. AllS. cerevisiae strains used in this study were derived from yTLT027. For expressionof SOG and SOS fusion proteins, the high-copy episomal vectors p424TEF andp426TEF (from ATCC) were used. Both vectors carry the yeast TEF1 promoter andCYC1 terminator. DNA sequences encoding a miniSOG (miniSOG, 0.33 kb) andIFP1.4 (0.96 kb) were amplified from pcDNA3.1 vectors that carried the mam-malian codon-optimized genes. The yeast genes MDM34 (1.4 kb), MMM1 (1.3 kb),MDM32 (1.9 kb), MGM101 (0.8 kb) and the pre-sequence of TOM70 (first 31N-terminal residues) were individually PCR-amplified from the genomic DNAisolated from BY4741. An oligonucleotide-mediated recombination method wasused to create fusion proteins of miniSOG or IFP1.4 (at the C terminus) with theabove yeast genes directly in yeast cells to give Mmm1–SOG, Mdm34–SOS,Mgm101–SOS and Tom70–SOS. An additional fusion protein, SOS–Mdm34, wascreated by fusing IFP to the N terminus of Mdm34. All fusion proteins wereflanked by BamHI and XhoI restriction sites on the vectors. An eight-residuepeptide spacer (GDGAGLIN) was inserted between the fusion partners. Thenucleotide sequence of the peptide spacer contains a PacI restriction site(50-ggtgacggtgctggtttaattaac-30), allowing the swapping of fusion partners. Thefusion proteins containing SOG were expressed with p426TEF, whereas thosecontaining SOS were expressed with p424TEF. The constructs used in this studyare listed in Supplementary Table 1.
Yeast growth. Yeast YPD medium containing 1% Bacto-yeast extract, 2% Bacto-peptone and 2% dextrose was used to grow BY4741 and yTLT027. Syntheticdextrose medium containing 0.67% yeast nitrogen base, 2% dextrose and amino-acid dropout mix lacking tryptophan (for p424TEF selection) and uracil (forp426TEF selection) was used to select for transformants containing the fusion proteinconstructs. Yeast cultures were grown at 30 �C with constant shaking at 220 r.p.m.The yeast cells were harvested at the exponential growth phase (OD 0.5–1), fixed with4% formaldehyde at room temperature for 45 min and washed twice. The cellswere then concentrated by centrifugation and attached to the surface of an imagingcover glass coated with Concanavalin A. The edges of the cover glass were sealed withnail polish to prevent drying.
Imaging. Imaging of purified protein solutions and fixed yeast cells were per-formed with a Nikon Eclipse Ti inverted microscope with the Perfect Focus System.All instrument control and image acquisition were performed with home-writtensoftware in Python. Two diode lasers (488 nm at B1 W cm� 2 from Stradus, 488-50 and 642 nm at B3 W cm� 2 from Stradus 642-110; Vortran) were directlyshuttered by the computer. A filter wheel was used to control the power of eachlaser. The two lasers were collimated into a telescopic optical path and focused tothe back focal plane of the oil-immersion objective (Olympus � 100 UPlanSApoNA 1.4) on the microscope. A quad-band beam splitter zt405/488/561/640rpc(Chroma) and band-pass filters (ET525/50 for SOG, ET705/72 for SOS, Chroma)were used to separate the fluorescence signal. A two-colour split-view setup was
used to simultaneously acquire SOG and SOS channels within a single- imageframe. The emitted light was divided by a dichroic mirror (beam splitter 645DCXR, Chroma), allowing the reflected light path to pass through the ET525/50 forSOG fluorescence and the transmitted light path to pass through the ET705/72 forSOS fluorescence. Both channels were projected on a single camera to produce asplit image. The images were recorded with an electron multiplying CCD camera(Ixon DV897DCS-BV, Andor) at a frame rate of 1 Hz (1 s exposure time) forpurified protein samples and 10 Hz (100 ms exposure time) for fixed yeast cells.
Image analysis. The images were analysed using ImageJ 1.42q (NIH http://rsbweb.nih.gov/ij/) and MATLAB (Mathworks). For each acquired image stack, theSOG and SOS channels were extracted from the split-view images and alignedusing their corresponding bright-field images. After alignment, we identified can-didate Mmm1 puncta from the SOG channel. For each punctum, we defined thecorresponding overlapping SOS signal. For each pixel within the overlapping SOSsignals, we analysed the loss in fluorescence over the experiment’s time course(typically 5 s). The pixel with the highest loss in SOS fluorescence was defined asthe center. Drifting, and hence displacement of the center, was uncommon over thetime course. As such, pixel-by-pixel alignment was usually not necessary. Thesignal loss of the immediate neighbour pixels was similar to that of the center(Supplementary Fig. 10), rendering pixel-by-pixel calculation of STET signalsunnecessary as well. Besides, pixel-by-pixel characterization of STET is subject tolarge fluctuations in fluorescence intensities. Hence, the signal loss of the centerpixel and that of the surrounding 8 pixels (that is, a 3� 3 region) were averaged foreach Mmm1 punctum candidate. This average signal loss was used to determinethe STET for the punctum. Only puncta with comparable area and SOG fluores-cence intensity were analysed for their corresponding SOS intensity loss. At leastfive Mmm1 puncta were analysed per sample.
Derivation of STET signal. In our system, SOS is irreversibly bleached by singletoxygen, that is,
1O2 þ SOS! SOSbleached ð1ÞThe mass action kinetics of the above reaction is described as:
d SOSbleached½ �dt
¼ k 1O2� �
SOS½ � ð2Þ
The mass balance of SOS is given by:
SOSbleached½ � ¼ SOS½ �t¼0 � SOS½ � ð3ÞSubstitute (3) into (2):
� d SOS½ �dt
¼ k 1O2� �
SOS½ � ð4Þ
Here, [1O2] is the concentration of singlet oxygen at the site of SOS. In ourSTET results, the natural logarithm of normalized fluorescence intensity of SOS atdifferent times can be well-fitted by a linear equation: y¼ � at. The first-orderkinetics in STET with respect to SOS implies constant singlet oxygen generationover the time course of experiments (that is, [1O2] is constant over time). Undersuch conditions, the solution of (4) is:
SOS½ � ¼ SOS½ �t¼0e� kct ð5Þ
where c¼ [1O2]. Taking the natural logarithm:
InSOS½ �
SOS½ �t¼0¼ � kct ð6Þ
The STET signal in this study is obtained from fitting the natural logarithm ofnormalized SOS fluorescence to a linear equation y¼ � at. Comparing this to (6),a¼ kc, where c is governed by diffusion of 1O2 and is therefore dependent on thedistance between SOG and SOS. The quantitative relationship between the STETsignal and intermolecular distance should be the subject of future studies.
References1. Alberts, B. The cell as a collection of protein machines: preparing the next
generation of molecular biologists. Cell 92, 291–294 (1998).2. Havugimana, P. C. et al. A census of human soluble protein complexes. Cell
150, 1068–1081 (2012).3. Guruharsha, K. G. et al. A protein complex network of Drosophila
melanogaster. Cell 147, 690–703 (2011).4. Babu, M. et al. Interaction landscape of membrane–protein complexes in
Saccharomyces cerevisiae. Nature 489, 585–589 (2012).5. Fairclough, R. H. & Cantor, C. R. The use of singlet-singlet energy transfer to
study macromolecular assemblies. Methods Enzymol. 48, 347–379 (2009).6. Jares-Erijman, E. A. & Jovin, T. M. FRET imaging. Nat. Biotechnol. 21,
1387–1395 (2003).7. Tatchen, J., Gilka, N. & Marian, C. M. Intersystem crossing driven by vibronic
spin–orbit coupling: a case study on psoralen. Phys. Chem. Chem. Phys. 9, 5209(2007).
ARTICLE NATURE COMMUNICATIONS | DOI: 10.1038/ncomms5072
8 NATURE COMMUNICATIONS | 5:4072 | DOI: 10.1038/ncomms5072 | www.nature.com/naturecommunications
& 2014 Macmillan Publishers Limited. All rights reserved.

8. Climent, T., Gonzalez-Luque, R., Merchan, M. & Serrano-Andres, L.Theoretical Insight into the spectroscopy and photochemistry of isoalloxazine,the flavin core ring. J. Phys. Chem. A 110, 13584–13590 (2006).
9. Schweitzer, C. & Schmidt, R. Physical mechanisms of generation anddeactivation of singlet oxygen. Chem. Rev. 103, 1685–1758 (2003).
10. Hatz, S., Lambert, J. D. C. & Ogilby, P. R. Measuring the lifetime of singletoxygen in a single cell: addressing the issue of cell viability. Photochem.Photobiol. Sci. 6, 1106 (2007).
11. Baker, A. & Kanofsky, J. R. Quenching of singlet oxygen by biomolecules fromL1210 leukemia cells. Photochem. Photobiol. 55, 523–528 (1992).
12. Shu, X. et al. Mammalian expression of infrared fluorescent proteins engineeredfrom a bacterial phytochrome. Science 324, 804–807 (2009).
13. Shu, X. et al. A genetically encoded tag for correlated light and electronmicroscopy of intact cells, tissues, and organisms. PLoS Biol. 9, e1001041(2011).
14. McCord, J. M. & Fridovich, I. The reduction of cytochrome c by milk xanthineoxidase. J. Biol. Chem. 243, 5753–5760 (1968).
15. Oliveros, E. et al. Photochemistry of the singlet oxygen [O2(1Dg)] sensitizerperinaphthenone (phenalenone) in N,N0-dimethylacetamide and 1,4-dioxane.New J. Chem. 23, 85–93 (1999).
16. Matheson, I. B. & Toledo, M. M. The singlet oxygen reactivity of biliverdin.Photochem. Photobiol. 25, 243–248 (1977).
17. Spikes, J. D., Shen, H. R., Kopeckova, P. & Kopecek, J. Photodynamiccrosslinking of proteins. III. Kinetics of the FMN- and rose bengal-sensitizedphotooxidation and intermolecular crosslinking of model tyrosine-containingN-(2-hydroxypropyl)methacrylamide copolymers. Photochem. Photobiol. 70,130–137 (1999).
18. Devasagayam, T., Sundquist, A. R., Di Mascio, P., Kaiser, S. & Sies, H. Activityof thiols as singlet molecular oxygen quenchers. J. Photochem. Photobiol. B 9,105–116 (1991).
19. Kornmann, B. et al. An ER-mitochondria tethering complex revealed by asynthetic biology screen. Science 325, 477–481 (2009).
20. Kornmann, B., Osman, C. & Walter, P. The conserved GTPase Gem1 regulatesendoplasmic reticulum-mitochondria connections. Proc. Natl Acad. Sci. USA108, 14151–14156 (2011).
21. Meeusen, S. & Nunnari, J. Evidence for a two membrane-spanningautonomous mitochondrial DNA replisome. J. Cell Biol. 163, 503–510(2003).
22. Youngman, M. J., Hobbs, A. E. A., Burgess, S. M., Srinivasan, M. & Jensen, R. E.Mmm2p, a mitochondrial outer membrane protein required for yeastmitochondrial shape and maintenance of mtDNA nucleoids. J. Cell Biol. 164,677–688 (2004).
23. Wu, Y. & Sha, B. Crystal structure of yeast mitochondrial outer membranetranslocon member Tom70p. Nat. Struct. Mol. Biol. 13, 589–593 (2006).
24. Dimmer, K. S., Jakobs, S., Vogel, F., Altmann, K. & Westermann, B. Mdm31and Mdm32 are inner membrane proteins required for maintenance ofmitochondrial shape and stability of mitochondrial DNA nucleoids in yeast. J.Cell Biol. 168, 103–115 (2005).
25. Ogilby, P. R. Singlet oxygen: there is indeed something new under the sun.Chem. Soc. Rev. 39, 3181 (2010).
26. Deerinck, T. J. et al. Fluorescence photooxidation with eosin: a method for highresolution immunolocalization and in situ hybridization detection for light andelectron microscopy. J. Cell Biol. 126, 901–910 (1994).
27. Ruiz-Gonzalez, R. et al. Singlet oxygen generation by the genetically encodedtag miniSOG. J. Am. Chem. Soc. 135, 9564–9567 (2013).
28. Pimenta, F. M., Jensen, R. L., Breitenbach, T., Etzerodt, M. & Ogilby, P. R.Oxygen-dependent photochemistry and photophysics of ‘MiniSOG,’ a protein-encased flavin. Photochem. Photobiol. 89, 1116–1126 (2013).
29. Davies, M. J. Singlet oxygen-mediated damage to proteins and its consequences.Biochem. Biophys. Res. Commun. 305, 761–770 (2003).
AcknowledgementsWe thank B. Huang, W. Zheng and R. McGorty for assistance in microscopy; P. Walterand C. Osman for yeast strains and constructs; R.Y. Tsien for constructive comments.This work was supported by a NIH Director’s New Innovator Award 1DP2GM105446(to X.S.), a postdoctoral fellowship from the Croucher Foundation of Hong Kong and aNIH T32 training grant (to T.-L.T.).
Author contributionsX.S. conceived the project. T.-L.T. and X.S. designed the experiments, performed theanalyses and wrote the paper. T.-L.T. and M.J.F. performed the experiments.
Additional informationSupplementary Information accompanies this paper at http://www.nature.com/naturecommunications
Competing financial interests: The authors declare no competing financial interests.
Reprints and permission information is available online at http://npg.nature.com/reprintsandpermissions/
How to cite this article: To, T.-L. et al. Singlet oxygen triplet energy transfer-basedimaging technology for mapping protein–protein proximity in intact cells.Nat. Commun. 5:4072 doi: 10.1038/ncomms5072 (2014).
NATURE COMMUNICATIONS | DOI: 10.1038/ncomms5072 ARTICLE
NATURE COMMUNICATIONS | 5:4072 | DOI: 10.1038/ncomms5072 | www.nature.com/naturecommunications 9
& 2014 Macmillan Publishers Limited. All rights reserved.

Supplementary Figures.
Supplementary Figure 1. Reaction of hydro-cyanine 3 with superoxide and reaction
of IFP1.4 with singlet oxygen. (a) Blue line: fluorescence spectra of 50 uM
hydrocyanine 3; Orange line: fluorescence spectra of 50 uM hydrocyanine 3 upon
reaction with 1mM KO2. (b) Absorbance spectra of 5uM IFP1.4 reacted with 10uM
Perinaththenone upon blue light excitation.
0"
2000"
4000"
6000"
550" 600" 650"
Fluo
rescen
ce"(a
.u.)"
Emission"wavelength"(nm)"
1mM$KO2$+$HydroCy3$(orange)$
0"
0.05"
0.1"
200" 400" 600" 800"
Absorban
ce"(O
D)"
Wavelength"(nm)"
1O2"(Perinaphthenone"+"Blue"light)"
0"min"5"min"10"min"15"min"20"min"
b
a Supp.$Fig.10$

Supplementary Figure 2. STET from Mmm1 to the cytosolic face of Mdm34.
Schematic diagram showing topology of the ERMES complex with SOG and SOS
attached to the cytosolic face of Mmm1 and Mdm34, respectively. SOS is fused to the C-
terminus of Mdm34. Natural logarithm of normalized SOS fluorescence intensity (white
circle) versus illumination time of blue light is plotted for 5 individual loci. [Blue
diamond: measured data point. Solid line: linear fit of the data.]

Supplementary Figure 3. STET from Mmm1 to the IMS face of Mdm34. Schematic
diagram showing topology of the ERMES complex with SOG attached to cytosolic face
of Mmm1 and SOS attached to the IMS face of Mdm34. SOS is fused to the N-terminus
of Mdm34. Natural logarithm of normalized SOS fluorescence intensity (white circle)
versus illumination time of blue light is plotted for 5 individual loci. [Blue diamond:
measured data point. Solid line: linear fit of the data.]

Supplementary Figure 4. STET from Mmm1 to Mgm101. Schematic diagram
showing topology of the ERMES complex with SOG attached to the cytosolic face of
Mmm1 and SOS to Mgm101 in the mitochondrial matrix. Natural logarithm of
normalized SOS fluorescence intensity (overlapped region, indicated by the white circle)
versus illumination time of blue light is plotted for 5 individual loci. [Blue diamond:
measured data point. Solid line: linear fit of the data.]

Supplementary Figure 5. STET from Mmm1 to the cytosolic face of Tom70 (non-
interacting). STET experiment was performed with SOG attached to the cytosolic face
of Mmm1 and SOS to the cytosolic face of Tom70. Natural logarithm of normalized SOS
fluorescence intensity (overlapped region, indicated by the white circle) versus
illumination time of blue light is plotted for 5 individual loci. [Blue diamond: measured
data point. Solid line: linear fit of the data.]

Supplementary Figure 6. STET from Mmm1 to free cytosolic protein (non-
interacting). STET experiment was performed with SOG attached to the cytosolic face
of Mmm1 and free SOS. Natural logarithm of normalized SOS fluorescence intensity
(overlapped region, indicated by the white circle) versus illumination time of blue light is
plotted for 5 individual loci. [Blue diamond: measured data point. Solid line: linear fit of
the data.]

Supplementary Figure 7. Negligible change of SOS fluorescence in the absence of
SOG. (A) Free SOS and SOS attached to the (B) cytosolic face of Mdm34; (C) IMS face
of Mdm34; and (D) Mgm101 in the matrix were illuminated under the same conditions as
in Supplementary Figures 2-6. In (A–D), the natural logarithm of normalized SOS
fluorescence is plotted against the illumination time of blue light. [Blue diamond:
measured data point. Solid line: linear fit of the data.]

Supplementary Figure 8. STET from Mmm1 to Mdm32. Schematic diagram showing
topology of the ERMES complex with SOG attached to cytosolic face of Mmm1 and
SOS attached to the IMS face of Mdm32. SOS is fused to the C-terminus of Mdm32.
Natural logarithm of normalized SOS fluorescence intensity (white circle) versus
illumination time of blue light is plotted for 5 individual loci. [Blue diamond: measured
data point. Solid line: linear fit of the data.]

Supplementary Figure 9. Negligible change of SOS fluorescence in the absence of
SOG. The natural logarithm of normalized SOS fluorescence is plotted against the
illumination time of blue light. The same illumination condition as in Figure 1b was
used. [Blue diamond: measured data point. Solid line: linear fit of the data.]

Supplementary Figure 10. Pixel-to-pixel variation in STET signals within a
punctum is small. The two punctate structures analyzed are identical to locus 4 and
locus 5 in Figure S1 (Mmm1-SOG and Mdm34-SOS). Natural logarithm of normalized
SOS fluorescence intensity versus illumination time of blue light is plotted for 9
individual pixels (center and its 8 immediate neighbors in a 3x3 region) in a single
punctum. The center (2, 2) is the pixel with the largest fluorescence loss. The STET
signals are determined for individual pixels and the standard deviation in STET is ~15%
over the 3x3 region.

Supplementary Tables.
Supplementary Table 1. List of plasmids used in the study
Vector ID Description pTLT049 p426 TEF MMM1-miniSOG pTLT120 p424 TEF MDM34-IFP1.4 pTLT124 p424 TEF IFP1.4 pTLT126 p424 TEF TOM70-IFP1.4 pTLT141 p414 TEF MGM101-IFP1.4 pTLT153 p424 TEF IFP1.4-MDM34 pTLT155 p424 TEF MDM32-IFP1.4 pTLT178 pBAD IFP1.4-HO1 pTLT181 PBAD IFP1.4-5aa-miniSOG-HO1 pTLT182 pBAD miniSOG pTLT184 pRS303 TEF HO1 pTLT390 pBAD IFP1.4-73aa-miniSOG-HO1 pTLT393 pBAD IFP1.4-133aa-miniSOG-HO1