single-phase and two-phase anaerobic digestion of fruit and vegetable waste: comparison of start-up,...
TRANSCRIPT

Waste Management 34 (2014) 875–885
Contents lists available at ScienceDirect
Waste Management
journal homepage: www.elsevier .com/locate /wasman
Single-phase and two-phase anaerobic digestion of fruitand vegetable waste: Comparison of start-up, reactor stabilityand process performance
http://dx.doi.org/10.1016/j.wasman.2014.02.0230956-053X/� 2014 Elsevier Ltd. All rights reserved.
⇑ Corresponding author. Tel.: +33468425185; fax: +33468425160.E-mail address: [email protected] (M. Torrijos).
Rangaraj Ganesh a, Michel Torrijos a,⇑, Philippe Sousbie a, Aurelien Lugardon b, Jean Philippe Steyer a,Jean Philippe Delgenes a
a INRA, UR50, Laboratoire de Biotechnologie de l’Environnement, Avenue des Etangs, Narbonne F-11100, Franceb Naskeo Environnment, 52 rue Paul Vaillant Couturier, F-92240 Malakoff, France
a r t i c l e i n f o a b s t r a c t
Article history:Received 19 November 2013Accepted 21 February 2014Available online 26 March 2014
Keywords:Fruit and vegetable wasteSingle-phase processTwo-phase processSolids recirculationProcess stabilityEnergy yield
Single-phase and two-phase digestion of fruit and vegetable waste were studied to compare reactor start-up, reactor stability and performance (methane yield, volatile solids reduction and energy yield). Thesingle-phase reactor (SPR) was a conventional reactor operated at a low loading rate (maximum of3.5 kg VS/m3 d), while the two-phase system consisted of an acidification reactor (TPAR) and a methano-genic reactor (TPMR). The TPAR was inoculated with methanogenic sludge similar to the SPR, but wasoperated with step-wise increase in the loading rate and with total recirculation of reactor solids to con-vert it into acidification sludge. Before each feeding, part of the sludge from TPAR was centrifuged, thecentrifuge liquid (solubilized products) was fed to the TPMR and centrifuged solids were recycled backto the reactor. Single-phase digestion produced a methane yield of 0.45 m3 CH4/kg VS fed and VS removalof 83%. The TPAR shifted to acidification mode at an OLR of 10.0 kg VS/m3 d and then achieved stable per-formance at 7.0 kg VS/m3 d and pH 5.5–6.2, with very high substrate solubilization rate and a methaneyield of 0.30 m3 CH4/kg COD fed. The two-phase process was capable of high VS reduction, but materialand energy balance showed that the single-phase process was superior in terms of volumetric methaneproduction and energy yield by 33%. The lower energy yield of the two-phase system was due to the lossof energy during hydrolysis in the TPAR and the deficit in methane production in the TPMR attributed toCOD loss due to biomass synthesis and adsorption of hard COD onto the flocs. These results including thecomplicated operational procedure of the two-phase process and the economic factors suggested that thesingle-phase process could be the preferred system for FVW.
� 2014 Elsevier Ltd. All rights reserved.
1. Introduction
High-rate anaerobic reactors for wastewater treatment havebeen in use for quite some time yet there is a need for further re-search into reactor design and new avenues for the treatment ofsolid wastes. Given the growing demand for energy recovery andefficient disposal of solid waste, such research is vital.
Single-phase anaerobic systems, in which all three reactions ofhydrolysis, acetogenesis and methanogenesis take place simulta-neously in a single reactor have been the preferred reactor designfor the majority of waste (Lissens et al., 2001; Bouallagui et al.,2005). However, the operation of such systems at a high OLR andfor waste with large biodegradable organic content such as fruit
and vegetable waste (FVW) becomes difficult as this type of wasteundergoes rapid acidification resulting in the inhibition of metha-nogenic activity (Mata-Alvarez et al., 1992; Callaghan et al., 2002;Bouallagui et al., 2009). The maximum loading rate reported forsingle-phase digestion of FVW was within 3.6 kg VS/m3 d (Verrieret al., 1987; Mata-Alvarez et al., 1992; Bouallagui et al., 2003; Linet al., 2011). Two-phase systems, in contrast, have the advantageof buffering the OLR in the first stage, allowing a more constantfeeding rate to the methanogenic second stage (Bouallagui et al.,2005; Koutrouli et al., 2009; Ghosh et al., 2000). Higher loadingrates in the range 5.7–7.7 kg VS/m3 d were reported for the two-phase digestion of FVW (Verrier et al., 1987; Mtz.-Viturtia et al.,1995; Dinsdale et al., 2000; Rajeshwari et al., 2001; Bouallaguiet al., 2004). The different types of oxido-reductive activities, pHoptima and growth rates of acidogens and methanogens have beencapitalized by phase separation to increase process efficiency

Table 1Composition of fruit and vegetable waste (FVW).
Parameters Value
TS (%) 12.7 ± 0.9VS (%) 11.0 ± 0.8VS/TS (%) 86.8 ± 3.7COD (g/g) 0.136COD/VS (g/g) 1.16Soluble fraction (%) 75.9Cellulose fraction (%) 3.9Hemi cellulose fraction (%) 19.2Lignin fraction (%) 1.0
876 R. Ganesh et al. / Waste Management 34 (2014) 875–885
(Mata-Alvarez, 1987; Shin et al., 2001; Parawira et al., 2008;Salomoni et al., 2011). In two-phase systems, simultaneous lique-faction along with acidification helps in handling waste with highsolid content (Salomoni et al., 2011). For easily fermentable waste,the overall retention time in a two-phase reactor can be lower thanthat in a single-phase reactor (Gunaseelan, 1997). However, theprocess can often be slow, primarily because of the long start-upperiod (Hai-Lou et al., 2002).
Different configurations and combinations of acidification andmethanogenic reactors for two-phase anaerobic systems have beenused by several authors for treating FVW and allied wastes. Someof the systems studied for FVW have been CSTR – upflow filterbed (Zhu et al., 2009), coupled anaerobic SBRs (Bouallagui et al.,2004), tubular reactor (Bouallagui et al., 2003), solid bed hydroly-ser – UASB methaniser (Rajeshwari et al., 2001), hydrolyser withraschig rings – inclined tubular digester (Dinsdale et al., 2000),ASBR hydrolyser – anaerobic filter methaniser (Raynal et al.,1998) and CSTR hydrolyser – anaerobic filter methaniser (Verrieret al., 1987), CSTR reactors for municipal solid waste (MSW) (DeGioannis et al., 2008); cascade process for organic waste (Chenet al., 2007) and hybrid anaerobic solid–liquid bioreactor for foodwaste (Hai-Lou et al., 2002; Stabnikova et al., 2008). These pro-cesses differed mainly in the way microorganisms were retainedin the bioreactor and in the phase separation of acidogenic processfrom the methanogenic process (Bouallagui et al., 2005).
In the present investigation, a two-phase system was used inwhich the first-stage acidification reactor worked on the principleof decoupling the solids retention time (SRT) and the hydraulicretention time (HRT). Solid–liquid separation of digestate by cen-trifugation was followed by 100% recirculation of solids back tothe reactor and the liquid extracted was fed to the methanogenicreactor for methane production. Solids recirculation was intendedto increase the SRT and enhance microbial activity and thereby en-hance the degradation of organic matter, while methanogeniceffluent recirculation was to provide alkalinity and to maintain aconstant solids concentration in the reactor and also for possibleenhancement of solids hydrolysis. The uniqueness of this systemwas the solid–liquid separation technique by centrifugationcompared to the mostly adopted method of leachate removal bypercolation. Centrifugation was included to aid in efficient solid–liquid separation and better recirculation control. Recirculationtechniques have been adopted by many authors for food wasteand MSW (Hai-Lou et al., 2002; Chen et al., 2007; Bhattacharyyaet al., 2008). The concept of recirculation was apparently intro-duced from landfill management where the recirculation of landfillleachate was found to enhance microbial activity and waste stabil-ization (Reinhart and Al-Yousfi, 1996; Stabnikova et al., 2008).Recirculation of leachate and methanogenic effluent to the acidifi-cation reactor was found to improve pH buffering (Chugh et al.,1998; Gomec and Speece, 2003).
The purpose of the present work was to assess the start-up,reactor stability and process performance of the two-phase anaer-obic system and to compare it with a conventional single-phasesystem using fruit and vegetable waste as the feed substrate.Start-up of the acidification reactor of the two-phase system byevaluating the appropriate loading rate at which the methanogenicinoculum sludge could be converted to acidifying sludge, followedby operating in acidification condition was part of the objective.Application of a high loading rate coupled with recirculation of dig-estate after centrifugation was expected to meet the objective ofacidification. Bibliographic survey showed that there are studieswhich have dealt with the single-phase or two-phase digestion ofFVW and other organic solid waste (Shen et al., 2013), but compar-ison study of the two-processes using the same waste are scarce. Inthis study, the two processes were also compared by assessing thematerial and energetic balances.
2. Materials and methods
2.1. Feed substrates
Fruit and vegetable waste (FVW) was used as the feed substratefor the experiments. For the preparation of FVW feed, equal quan-tities of apple, banana, carrot, potato and lettuce (Bouallagui et al.,2004) were reduced to approximately 1 cm size in a Blik BB 230crusher equipped with stainless steel rotating blades, mixed thor-oughly and then stored at �20 �C. The composition of FVW is pre-sented in Table 1. Pre-weighed and stored batches of the feedsubstrate were brought to room temperature and then fed intothe reactors. The average total solids (TS) and volatile solids (VS)of the feed mixture were 12.7 ± 0.9% and 11.0 ± 0.8% respectively.
2.2. Reactor set-up
Three reactors were used in this study. The first reactor was asingle-phase reactor (SPR) and was run in conventional mode.The two-phase system was made up of two reactors: the two-phase acidification reactor (TPAR) and the two-phase methanogen-ic reactor (TPMR). Two identical reactors as shown in Fig. 1(a) wereused as the SPR and TPAR. They were double-walled reactors madeof stainless steel and maintained at 35 �C by a regulated waterbath. The total volume of the reactors was 15 l with an effectivesludge weight of 10 kg. Feeding and draining were carried outmanually by opening the top cover of the reactors. The reactorswere equipped with paddle-shaped stirrers powered by a 1 HP mo-tor and the mixing times were programmed through a process con-troller. For the TPMR, a double-walled glass reactor of 6 l volumewas used and was maintained in mesophilic conditions at 35 �C.Biogas produced in the reactors passed through a moisture trapand then to a milligas counter fitted with a 4–20 mA output(MGC-1 gas flow meters, Ritter); the data was recorded anddisplayed online. Software (Modular SPC) developed at the INRAlaboratory was used to log this data.
The SPR and TPAR were placed on weighing scales and theweight of the reactor before the addition of inoculum was mea-sured and noted down. During reactor operation, the total weightof the reactor was measured once a week using the weighing scalesand digestate withdrawal was adjusted accordingly to maintainthe weight of the digestate in the reactor constant at 10 kg. Thisprocedure was followed to minimize the error in solids destructioncalculations. Since the weight depends on the concentration of thesludge, the specific gravity of sludge was used to make the correc-tions for the working volume. For the range of TS concentration(2.4–3.5%) in the SPR, specific gravity of the sludge varied between1.002 and 1.003. And for the TPAR, TS varied over a wide rangebetween 3.5% and 10.3% and specific gravity of the sludge variedbetween 1.003 and 1.020. From the specific gravity of the sludge,the working volume of the reactor was calculated and OLRcorrected accordingly.

Fig. 1. (a) Schematic diagram of the single-phase reactor (SPR) and two-phase acidification reactor (TPAR) used for the experiments; and (b) schematic diagram of thematerial flows of the two-phase system.
R. Ganesh et al. / Waste Management 34 (2014) 875–885 877
The operation of the TPAR was based on working at a high load-ing rate and decoupling the solids retention time (SRT) from thehydraulic retention time (HRT) in order to attain acidification con-ditions. The working principle is presented schematically inFig. 1(b). Part of the digestate was subjected to centrifugation at12,300g for 15 min) which was followed by 100% recirculation ofdigestate back into the reactor while the liquid extracted was fedto the methanogenic reactor. The system was designed with recir-culation of the effluent from the TPMR to the TPAR. However, theoperating volume of TPMR did not permit treatment of all theliquid obtained by centrifugation: only a part of it was treated,the remaining volume was discarded. Recirculation flow to theTPAR was made up of TPMR effluent along with buffer (tap waterwith sodium bicarbonate). The TPMR served as the biodegradabil-ity testing reactor for the centrifuged liquid from the TPAR, oper-ated at a HRT of 30 days for which only a part of the centrifugedliquid was used (0.200 l/d or approximately 1/10 of the dailyextracted liquid volume from the TPAR). The results obtained(methane yield) were used to estimate the methane productionpossible for the actual volume of liquid extracted daily. At theindustrial scale, other types of reactor run at a high OLR such asUASB, fixed-bed or anaerobic filter could be used as the methano-genic reactor with recirculation of effluent back to the acidificationreactor.
Both the SPR and TPAR were inoculated with 4.0 kg of granularsludge (after breaking up the granules in glass reactors bymagnetic mixing continuously for few days) obtained from a UASBreactor treating sugar industry wastewater. The granular sludgehad the following characteristics: TS = 14.2%, VS = 11.7%,
VS/TS = 82.3%. The reactors were made up to 10 kg by the additionof treated effluent from a pilot plant in the laboratory and the ini-tial TS and VS in both the reactors were 3.5% and 3.0% respectively.The TPMR was inoculated with 2 kg of broken granular sludge andmade up to 6 l with treated effluent from the pilot plant. The initialTSS and VSS were 1.9% and 1.6% respectively.
2.3. Sampling and analysis
Soluble COD was measured by a colorimetric method usingHach 0–1500 mg/l vials. Other parameters (TS, VS, alkalinity) weremeasured following Standard Methods, APHA (2005). Volatile fattyacid (VFA) concentration was measured using a gas chromatograph(GC-8000, Fisons Instruments) equipped with a flame ionizationdetector and an automatic sampler (AS 800, Fisons Instruments).The column used was a semi-capillar Econocap FFAP (Alltech) col-umn 15 m in length, 0.53 cm in diameter and 1.2 lm Phase ECTM
1000 film. The temperature of the spitless injector was 250 �C, thatof the detector 275 �C. The temperature increased from 80 �C to120 �C in 3 min. The carrier gas was nitrogen (25 kPa). The volumeof sample injected was 1 ll. The calibration was made from a mix-ture of 6 acids (standard solution): acetic (C2), propionic (C3), bu-tyric (C4), isobutyric (iC4), valeric (C5) and iso-valeric (iC5) acids at1 g/l each. The calibration range was 0.25–1 g/l by dilution of thestandard solution. The internal standard method (1 g of ethyl-2-butyric acid in 1 l of water acidified with 50 ml of H3PO4) was usedto measure total VFA concentration by mixing 1/1 a volume of theinternal standard solution and the sample or the standard solution.

878 R. Ganesh et al. / Waste Management 34 (2014) 875–885
The margin for error for this measurement was 2–5% with a quan-tification threshold of 0.1 g/l.
Biogas composition was determined using a gas chromatograph(Shimadzu GC-8A) connected to a C-R8A integrator and equippedwith a CTRI Alltech column. The following gases were measured:CO2, H2, O2, N2 and CH4. The column was made up of 2 concentriccolumns. The 3.175 mm-diameter inner column was filled with Sil-licagel. It allowed the separation of CO2 from the other gases. Theother gases were separated in the 6.350 mm-diameter outer col-umn filled with a molecular sieve. The carrier gas was argon at2.8 bars. The temperatures were 30 �C for the oven and 100 �Cfor the injector and the detector. The detection of gaseous com-pounds was done using a thermal conductivity detector and theintensity of current was 80 mA. The volume of injected biogaswas 1 ml. The calibration was done with a standard gas composedof 25% CO2, 5% H2, 2% O2, 10% N2 and 58% CH4. The margin for errorfor this measurement was 5%. Feed samples were periodically ana-lysed for total and volatile solids to maintain constant the OLR inthe reactors. Drained-off samples were analyzed for pH, total alka-linity, soluble COD, VFA and total and volatile solids (Ganesh et al.,2013).
Concentrations of non-VFA metabolic end products (lactate andethanol), residual sugar monomers (glucose and xylose) and otherhydrolyzate byproducts (furfural and 5-hydroxylmethylfurfural)were measured by High Performance Liquid Chromatography(HPLC) coupled to refractometric detection (Waters R410). Thecomponents were separated by HPLC in an Aminex HPX-87Hcolumn (Biorad). The eluting solution corresponded to 0.005 MH2SO4 and the flow-rate was 0.4 mL min�1. The column tempera-ture was maintained at 35 �C.
2.4. Operating procedure of the reactors
The SPR was run at a low OLR of 2 kg VS/m3 d during the firstten weeks followed by operation at 3.5 kg VS/m3 d between weeks10 and 15. There was no feeding during the 11th week. The 15thweek had only four feeding days but the overall VS fed during thisweek was maintained at the level of the other weeks. The averageHRT, corresponding to the OLR of 2 kg VS/m3 d and 3.5 kg VS/m3 d,were 80 and 45 days respectively.
For the TPAR, OLR was increased stepwise from an initial5 kg VS/m3 d during first two weeks followed by 7.5 kg VS/m3 dduring the weeks 3–6 and 10 kg VS/m3 d during the weeks 7–10.There was no feeding during the weeks 11 and 12 due to a dropin pH in the reactor. Between the weeks 13 and 15, the reactorwas run at a reduced OLR of 7.0 kg VS/m3 d. The daily operatingprocedure of TPAR with respect to the amount of sludge centri-fuged, the volume of liquid withdrawn and the amount of bufferadded at different OLR are tabulated in Table 2. The liquid HRT inthe TPAR varied between 5 and 10 days, while the SRT was keptvery high by sludge recirculation. All three reactors (SPR, TPARand TPMR) were fed for five days a week (Monday to Friday) andthere was no feeding over the weekend.
Table 2Daily operating procedure of the two-phase acidification reactor (TPAR) during the variou
Weeks OLR(kg VS/m3 d)
Quantity of reactor sludgewithdrawn for centrifugation(kg/d)
Volume ofcentrifuge liquiddrained out (l/d)
Quantityback to thcentrifuga
1–2 5.0 2.1 1.5 0.63–6 7.5 2.0 1.1 0.97–10 10.0 3.4 1.6 0.812 – 2.8 1.5 0.713–15 7.0 3.1 2.0 0.9
The TPMR was operated as an anaerobic sequencing batch reac-tor in semi-continuous mode with continuous mixing provided bymagnetic stirring. The reactor was started on the 15th day of oper-ation of the TPAR. It was fed with the centrifuged liquid from theTPAR and was operated with a batch time (react time) of 24 h dur-ing the week days (corresponding to the feeding days of the TPARreactor) and 72 h over the weekend (non-feeding days of the TPARreactor). In total, 58 batches were studied in the TPMR: 1–19, 20–39 and 40–58 batches, corresponding to the period of operation ofthe TPAR at the OLR of 7.5 kg VS/m3 d, 10.0 kg VS/m3 d and7.0 kg VS/m3 d respectively. OLR in the TPMR was very low(0.06 ± 0.03 kg COD/m3 d) for batches 1–19 since the solubilizedCOD was low when the TPAR was operated at 7.5 kg VS/m3 d.The average OLR in the TPMR corresponding to batches 20–39and 40–58 were 1.2 ± 0.4 kg COD/m3 d and 1.4 ± 0.2 kg COD/m3 drespectively.
3. Results and discussion
3.1. Comparison of reactor stability between the single-phase and two-phase processes
Reactor stability was evaluated from the variation of pH, VFAconcentration and soluble COD. The pH in the SPR was between7.0 and 7.2 during the entire study period and at the OLR of2.0 kg VS/m3 d and 3.5 kg VS/m3 d, as shown in Fig. 2(a). Therewas a well-balanced alkalinity in the reactor, with an average con-centration of 5 g CaCO3/l. Thus optimal performance in terms of pHwas maintained by conventional operation of the SPR at both theseloading rates. OLR was not increased further, taking into accountthe loading rate limit for single-phase operation for FVW as per lit-erature (Verrier et al., 1987; Mata-Alvarez et al., 1992; Bouallaguiet al., 2003).
In the TPAR, at the OLR of 5.0 kg VS/m3 d and 7.5 kg VS/m3 d, pHwas around 7.0 and no acidification was observed (Fig. 2a). Whenthe OLR was increased to 10 kg VS/m3 d (day 43), pH dropped to5.3 and maintained between 5.1 and 5.6 during the three weeksof operation at this loading rate. pH dropped further to 4.5 duringthe fourth week. The OLR of 10 kg VS/m3 d led to an overload forc-ing a halt to the feeding for two weeks (11th and 12th week). Dur-ing the 12th week, withdrawal of centrifuge liquid and addition ofbuffer helped to restore the reactor pH to 5.8. Feeding was resumedat a reduced loading rate of 7.0 kg VS/m3 d, during the weeks 13–15 (days 85–105). The average pH during this period was5.6 ± 0.3. Thus, applying a loading rate of 10 kg VS/m3 d and con-tinuous recirculation of the sludge solids back to the reactorproved to be a successful strategy for converting methanogenicsludge into acidification sludge.
The concentration of VFA was negligible and soluble COD(SCOD) was less than 1 g/l during the whole operating period inthe SPR. Hydrolysis of FVW in the conventional one-stage processresulted in intermediates which were immediately converted tomethane, leaving very low recalcitrant soluble COD. The appliedloading rates of 2.0 kg VS/m3 d and 3.5 kg VS/m3 d were optimum
s phases.
of reactor sludge recyclede reactor aftertion (kg/d)
Quantity of feedmaterial fed into thereactor (kg/d)
Volume of buffer + tapwater added to thereactor (l/d)
0.44 1.060.66 0.440.88 0.72– 1.500.66 1.54

Fig. 2. (a) Daily variation of pH in the single phase reactor (-o-) and in the two-phase acidification reactor (-x-); (b) daily variation of acetic acid (-o-), propionic acid (-D-),butyric acid (-x-) and total volatile fatty acid (-j-) in the two-phase acidification reactor; (c) daily variations of soluble COD (-�-), VFA-COD (-o-) and VFA/SCOD ratio (dashedlines) in the two phase acidification reactor; and (d) weekly quantity of solubilized COD extracted through the centrifuge liquid (-�-) with respect to the applied loading rates( ) in the two-phase acidification reactor.
Table 3Concentration and calculated COD equivalent of intermediate compounds detected byHPLC and GC for the sample taken from the two-phase acidification reactor (TPAR) onthe 78th day.
Method Compound Concentration (g/l) Calculated COD (gCOD/l)
HPLC Glucose 1.07 1.14Fructose 0.33 0.35Lactate 0.59 0.63Acetate 3.57 3.82Ethanol 5.67 11.83
GC Acetic acid 3.72 3.98Propionic acid 0.58 0.88Iso-butyric acid 1.07 1.95Butyric acid 3.03 5.51Valeric acid 0.64 1.31Caproic acid 1.48 3.26
R. Ganesh et al. / Waste Management 34 (2014) 875–885 879
in providing the right balance for subsequent hydrolysis, acetogen-esis and methanogenesis.
During start-up at the OLR of 5 kg VS/m3 d, VFA concentrationin the TPAR increased briefly to 4.4 g/l during the first week anddropped thereafter to almost negligible values (Fig. 2b). As theOLR was increased to 10 kg VS/m3 d on the 7th week, VFA in-creased rapidly to 24.6 g/l and SCOD to 44 g/l (Fig. 2c), generatinga drop in reactor pH to 5.3. The calculated VFA-COD represented83% of the SCOD as shown in Fig. 2(c). With continuous operationat this loading rate, VFA started to decrease to 9.7 g/l and pHdropped to 4.6. However, SCOD continued to increase, indicatingthat other organic intermediates were produced. Soluble COD dur-ing this corresponding period increased to 54 g/l, while VFA-CODrepresented only 27% of the SCOD. To identify the types of interme-diate produced during this phase, HPLC analysis was carried out forthe sample taken on the 12th week (day 78). Intermediates such asglucose, fructose, lactate and ethanol were detected in the ana-lyzed sample. The results of HPLC along with the VFA measure-ments by gas chromatography and the calculated COD equivalentfor each compound are given in Table 3. Thus, the reactor pH of4.5 was conducive to the production of the above intermediatecompounds rather than VFA. Production of these intermediates isnot favored as acetic and butyric acids are the preferred com-pounds for subsequent methanogenesis (Horiuchi et al., 2002;Zhu et al., 2009). The combined calculated COD of the above mea-sured compounds was 31 g/l, which represented only 60% of theSCOD of the sample. The remaining 40% of the SCOD was unknownand remained undetected.
During the 12th week, when the feeding was stopped andcentrifuged liquid was removed and replaced with buffer, VFA
increased from 9.7 g/l to 28.5 g/l. Feeding was resumed again at areduced OLR of 7 kg VS/m3 d between the weeks 13 and 15 (days85 and 105). The average VFA in the reactor during this periodwas 24 ± 4 g/l and average SCOD was 42 ± 7 g/l. Acetic and butyricacids were the dominant acids present at the OLR of 7 kg VS/m3 d(Fig. 2b), representing 47% and 26% of total VFA. The proportionof propionic, iso-butyric, valeric, iso-valeric and caproic acids were7%, 10%, 5%, 1% and 5% respectively. Similar observations weremade by Bouallagui et al. (2004), where acetic and butyric acids(40% each) were the main acids formed.
The quantity of COD solubilized and thus extractable through thecentrifuge liquid from the TPAR was vital for methane generation in
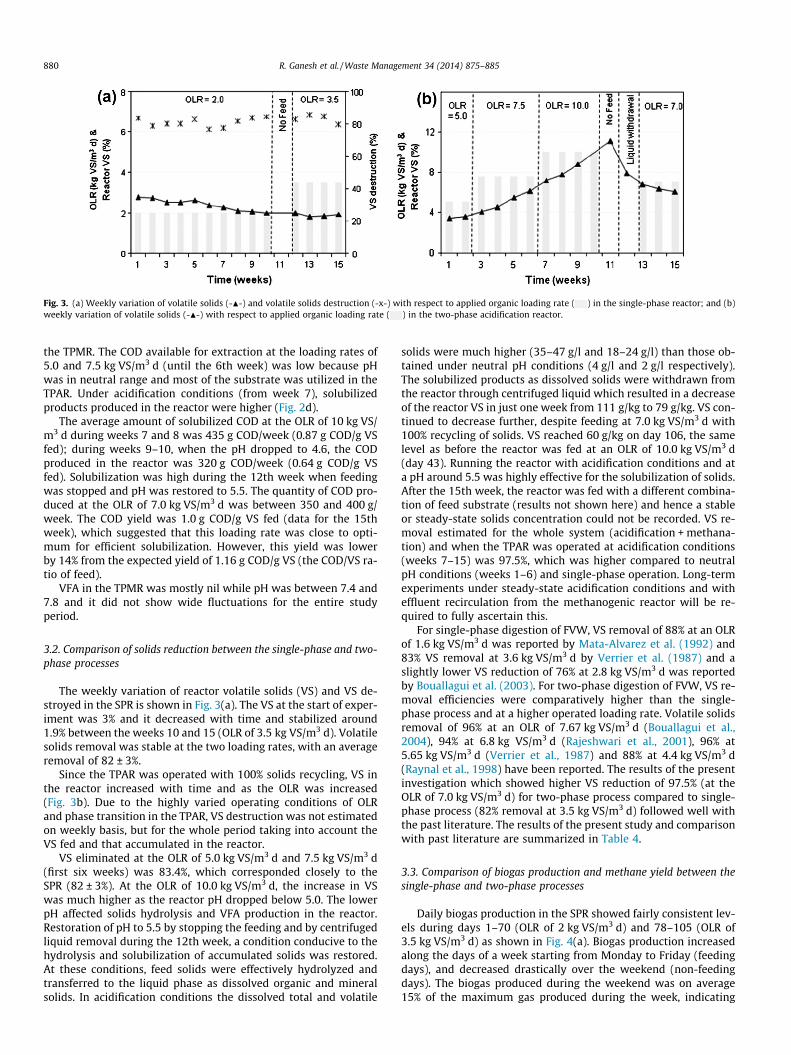
Fig. 3. (a) Weekly variation of volatile solids (-N-) and volatile solids destruction (-x-) with respect to applied organic loading rate ( ) in the single-phase reactor; and (b)weekly variation of volatile solids (-N-) with respect to applied organic loading rate ( ) in the two-phase acidification reactor.
880 R. Ganesh et al. / Waste Management 34 (2014) 875–885
the TPMR. The COD available for extraction at the loading rates of5.0 and 7.5 kg VS/m3 d (until the 6th week) was low because pHwas in neutral range and most of the substrate was utilized in theTPAR. Under acidification conditions (from week 7), solubilizedproducts produced in the reactor were higher (Fig. 2d).
The average amount of solubilized COD at the OLR of 10 kg VS/m3 d during weeks 7 and 8 was 435 g COD/week (0.87 g COD/g VSfed); during weeks 9–10, when the pH dropped to 4.6, the CODproduced in the reactor was 320 g COD/week (0.64 g COD/g VSfed). Solubilization was high during the 12th week when feedingwas stopped and pH was restored to 5.5. The quantity of COD pro-duced at the OLR of 7.0 kg VS/m3 d was between 350 and 400 g/week. The COD yield was 1.0 g COD/g VS fed (data for the 15thweek), which suggested that this loading rate was close to opti-mum for efficient solubilization. However, this yield was lowerby 14% from the expected yield of 1.16 g COD/g VS (the COD/VS ra-tio of feed).
VFA in the TPMR was mostly nil while pH was between 7.4 and7.8 and it did not show wide fluctuations for the entire studyperiod.
3.2. Comparison of solids reduction between the single-phase and two-phase processes
The weekly variation of reactor volatile solids (VS) and VS de-stroyed in the SPR is shown in Fig. 3(a). The VS at the start of exper-iment was 3% and it decreased with time and stabilized around1.9% between the weeks 10 and 15 (OLR of 3.5 kg VS/m3 d). Volatilesolids removal was stable at the two loading rates, with an averageremoval of 82 ± 3%.
Since the TPAR was operated with 100% solids recycling, VS inthe reactor increased with time and as the OLR was increased(Fig. 3b). Due to the highly varied operating conditions of OLRand phase transition in the TPAR, VS destruction was not estimatedon weekly basis, but for the whole period taking into account theVS fed and that accumulated in the reactor.
VS eliminated at the OLR of 5.0 kg VS/m3 d and 7.5 kg VS/m3 d(first six weeks) was 83.4%, which corresponded closely to theSPR (82 ± 3%). At the OLR of 10.0 kg VS/m3 d, the increase in VSwas much higher as the reactor pH dropped below 5.0. The lowerpH affected solids hydrolysis and VFA production in the reactor.Restoration of pH to 5.5 by stopping the feeding and by centrifugedliquid removal during the 12th week, a condition conducive to thehydrolysis and solubilization of accumulated solids was restored.At these conditions, feed solids were effectively hydrolyzed andtransferred to the liquid phase as dissolved organic and mineralsolids. In acidification conditions the dissolved total and volatile
solids were much higher (35–47 g/l and 18–24 g/l) than those ob-tained under neutral pH conditions (4 g/l and 2 g/l respectively).The solubilized products as dissolved solids were withdrawn fromthe reactor through centrifuged liquid which resulted in a decreaseof the reactor VS in just one week from 111 g/kg to 79 g/kg. VS con-tinued to decrease further, despite feeding at 7.0 kg VS/m3 d with100% recycling of solids. VS reached 60 g/kg on day 106, the samelevel as before the reactor was fed at an OLR of 10.0 kg VS/m3 d(day 43). Running the reactor with acidification conditions and ata pH around 5.5 was highly effective for the solubilization of solids.After the 15th week, the reactor was fed with a different combina-tion of feed substrate (results not shown here) and hence a stableor steady-state solids concentration could not be recorded. VS re-moval estimated for the whole system (acidification + methana-tion) and when the TPAR was operated at acidification conditions(weeks 7–15) was 97.5%, which was higher compared to neutralpH conditions (weeks 1–6) and single-phase operation. Long-termexperiments under steady-state acidification conditions and witheffluent recirculation from the methanogenic reactor will be re-quired to fully ascertain this.
For single-phase digestion of FVW, VS removal of 88% at an OLRof 1.6 kg VS/m3 d was reported by Mata-Alvarez et al. (1992) and83% VS removal at 3.6 kg VS/m3 d by Verrier et al. (1987) and aslightly lower VS reduction of 76% at 2.8 kg VS/m3 d was reportedby Bouallagui et al. (2003). For two-phase digestion of FVW, VS re-moval efficiencies were comparatively higher than the single-phase process and at a higher operated loading rate. Volatile solidsremoval of 96% at an OLR of 7.67 kg VS/m3 d (Bouallagui et al.,2004), 94% at 6.8 kg VS/m3 d (Rajeshwari et al., 2001), 96% at5.65 kg VS/m3 d (Verrier et al., 1987) and 88% at 4.4 kg VS/m3 d(Raynal et al., 1998) have been reported. The results of the presentinvestigation which showed higher VS reduction of 97.5% (at theOLR of 7.0 kg VS/m3 d) for two-phase process compared to single-phase process (82% removal at 3.5 kg VS/m3 d) followed well withthe past literature. The results of the present study and comparisonwith past literature are summarized in Table 4.
3.3. Comparison of biogas production and methane yield between thesingle-phase and two-phase processes
Daily biogas production in the SPR showed fairly consistent lev-els during days 1–70 (OLR of 2 kg VS/m3 d) and 78–105 (OLR of3.5 kg VS/m3 d) as shown in Fig. 4(a). Biogas production increasedalong the days of a week starting from Monday to Friday (feedingdays), and decreased drastically over the weekend (non-feedingdays). The biogas produced during the weekend was on average15% of the maximum gas produced during the week, indicating

Table 4Summary of the results of single-phase and two-phase digestion of fruit and vegetable and related wastes obtained from literature.
Solid waste/substrate
Process OLR (kgVS/m3 d)
HRT (d) Methane yield(m3 CH4/kg VSfed)
Solids/CODremoval (%)
Salient features References
FVW Single-phase 2.0 80 0.45 ± 0.03 81 ± 3% VSremoval
– This study
3.5 45 0.47 ± 0.04 83 ± 2% VSremoval
FVW Single-phase 3.0 – 0.42 96.3% CODremoval
– Lin et al.(2011)
FVW Single-phase 2.8 20 0.45 76% VSremoval
– Bouallaguiet al. (2003)
FVW Single-phase 1.6 20 0.47 88% VSremoval
– Mata-Alvarezet al. (1992)
FVW Single-phase 3.6 23 0.37 83% VSremoval
– Verrier et al.(1987)
FVW Two-phase 7.0 – 0.30 97.5% VSremoval
– This study
Vegetable andflowerwaste
Two-phase: CSTR and upflow filterbed
– – – 89%Acidogenesisefficiency
(i) Sufficient micro-aerationpromoted the hydrolysis
Zhu et al.(2009)
Recirculation of hydrolysis andmethanogenic effluent
56%Hydrolysisefficiency
(ii) Liquid recirculation resultedin a higher hydrolysis efficiency
FVW Two-phase Anaerobic SBR 7.67 3 + 10 0.32* 96% CODremoval
Phase separation resulted in highprocess stability
Bouallaguiet al. (2004)
(*m3 CH4/kg COD) 81%Hydrolysisyield
FVW Two-stage system: solid bedhydrolyser and UASB methaniser
6.8 2.5 0.35 94% VSremoval
– Rajeshwariet al. (2001)
WAS/FVW(75:25 VSbasis)
Two-phase: hydrolyser withraschig rings for leachatepercolation
5.7 3 + 10 0.25 40% VSremoval
Two-phase system was designedfor a full-scale plant
Dinsdaleet al. (2000)
Methaniser: inclined tubulardigester
4 + 13 44% VSremoval
FVW Two-stage system: ASBRhydrolyser and anaerobic filtermethaniser
4.4 7 + 10 0.34 87% VSremoval
– Raynal et al.(1998)
FVW Two-phase: Hydrolyser withraschig rings for leachatepercolation
3.1 13 + 5 0.40 72% VSremoval
Hydrolysis affected at high OLRs Mtz.-Viturtiaet al. (1995)
Methaniser: UASB – anaerobic filter 6.3 6.5 + 2.5 0.29 53% VSremoval
Phase separation was noteffective
9.4 4.3 + 1.7 0.18 38% VSremoval
12.6 3.2 + 1.2 0.10 27% VSremoval
FVW Two-stage system: CSTR hydrolyserand anaerobic filter methaniser
5.65 2 + 2.3 0.42 96% VSremoval
– Verrier et al.(1987)
Fig. 4. (a) Daily variation of biogas volume (-D-) and applied organic loading rate ( ) in the single phase reactor; and (b) daily variation of biogas volume (-D-) and appliedorganic loading rate ( ) in the two-phase acidification reactor.
R. Ganesh et al. / Waste Management 34 (2014) 875–885 881

882 R. Ganesh et al. / Waste Management 34 (2014) 875–885
that most of the substrate was degraded within 24 h. The averageweekly biogas production, corresponding to the OLR of 2.0 kg VS/m3 d and 3.5 kg VS/m3 d were 77 ± 7 and 153 ± 12 l/week respec-tively, with an average weekly methane production of 43 ± 4 and87 ± 11 l/week respectively. The specific methane yield were0.45 ± 0.03 m3 CH4/kg VS fed and 0.55 ± 0.05 m3 CH4/kg VS re-moved at the OLR of 2.0 kg VS/m3 d and 0.47 ± 0.04 m3 CH4/kg VSfed and 0.56 ± 0.07 m3 CH4/kg VS removed at the OLR of 3.5 kgVS/m3 d. The average values of weekly specific methane yield esti-mated for the entire study period were 0.45 ± 0.03 m3 CH4/kg VSfed and 0.56 ± 0.05 m3 CH4/kg VS removed. The observed methaneyields with respect to VS fed were in close agreement to those re-ported for single-stage systems treating FVW (Lin et al., 2011;Mata-Alvarez et al., 1992; Bouallagui et al., 2003, 2009).
Daily biogas production in the TPAR fluctuated largely at theloading rates of 5.0 kg VS/m3 d and 7.5 kg VS/m3 d (days 1–42) asshown in Fig. 4(b). Biogas production decreased significantly (aver-age of 121 l/week) when the OLR was increased to 10 kg VS/m3 d,attributable to the drop in pH and acidification of the reactor. Bio-gas composed mostly of CO2 (80–85%) which was further proof ofacidification of the reactor. Phase separation was inefficient be-tween the TPAR and TPMR until the 6th week of operation and atthe OLR of 7.5 kg VS/m3 d in the TPAR. At the OLR of 10 kg VS/m3 d, the TPAR shifted to acidification mode. Biogas compositionafter the 7th week showed that phase separation between theTPAR and TPMR was efficient. Biogas production dropped to thevery low levels as the pH dropped to 4.5 during the 10th and11th week. Restoration of reactor pH to around 5.6 led to biogas in-crease with some methane and hydrogen production. At the OLR of7.0 kg VS/m3 d, average biogas production in the TPAR was 115 l/week with an average methane and hydrogen content of 6% and13%, respectively.
The volume of biogas produced from the centrifuged liquid andthe expected or theoretical volume of biogas in the TPMR duringthe various batches is shown in Fig. 5(a). The expected biogaswas calculated from the quantity of COD fed into the reactor takinginto account the factor of 0.38 l CH4/g COD after correcting the fac-tor 0.35 l CH4/g COD at STP (Grady et al., 1999) to room tempera-ture (25 �C) as follows.
Expected methane ¼ CODliquidðg=lÞ � Feed volumeliquidðlÞ� 0:38 l CH4=gCOD
Expected biogas ¼ Expected methane=methane content
The volume of biogas produced was low until the 19th batch (cor-responding to the OLR of 7.5 kg VS/m3 d in the TPAR) due to the
Fig. 5. (a) Variation of expected biogas (-o-) and observed biogas (-x-) production in thesoluble COD removal efficiency (-o-) corresponding to the batch-runs in the methanoge
low input COD. Higher biogas volume of 2.5 ± 1.2 l/batch was ob-tained through batches 20–39, and 3.1 ± 0.5 l/batch during batches40–58. The average methane content in biogas was 65% during thebatches 1–19 (neutral pH conditions in the TPAR) and 75%(range = 73–80%) for the batches 20–58 (acidification conditionsin the TPAR). The methane volume produced in the TPMR, understable operation of the TPAR at the OLR of 7.0 kg VS/m3 d, repre-sented about 72 ± 5% of the theoretical methane production, withan average methane yield of 0.27 m3 CH4/kg COD.
The biodegradability of centrifuged liquid estimated by com-paring the actual and the theoretical methane produced in theTPMR was 72% on average, corresponding to the OLR of 7.0 kgVS/m3 d in the TPAR. The variation of outlet SCOD and SCOD re-moval in the TPMR is shown in Fig. 5(b). Outlet SCOD reached stea-dy-state with stable values of around 0.6 g/l and high SCODremoval (average of 98%), when the TPAR was operated at stableacidification conditions. The biodegradability of the centrifuged li-quid based on SCOD removal was found to be higher compared toits biodegradability of 72% based on methane production. Theremaining 28% can be attributed to COD utilized in the TPMR forcell growth and adsorption of hard COD on the cellular biomass.Thus, in terms of methane production, the two-phase operation re-sulted in a net loss of 28% due to the above-mentioned phenomena.De Gioannis et al. (2008) made similar observation in the two-phase digestion of MSW, wherein the actual biogas produced inthe methanogenic reactor was between 73% and 85% of the ex-pected gas production, calculated on the basis of the organic car-bon removed in the methanogenic reactor.
3.4. Comparison of energy yields between single-phase and two-phaseprocesses
The solubilized products (measured as COD) produced in theacidification reactor were fed into the methanogenic reactor,where its methane yield (as m3 CH4/kg COD) was determined.
Small quantities of hydrogen and methane were also producedin the acidification reactor. Hence to make a comparative evalua-tion between the single and two-phase processes, energy yieldswere estimated as shown in Fig. 6. Energy yields were estimatedfor the same quantity of volatile solids fed (350 g VS/week) andbased on the weekly volume of methane produced in the SPRand the combined volumes of hydrogen and methane producedweekly in the TPAR and TPMR of the two-phase system. Energyyields were calculated according to the procedures followed bySiddiqui et al. (2011) and Murphy and McKeogh (2004) and usingenergy values for methane and hydrogen of 35.8 kJ/l and 10.8 kJ/lrespectively.
two phase methanogenic reactor; and (b) variation of outlet soluble COD (-x-) andnic reactor.

Fig. 6. (a) Flow diagram of the energy yield estimation for the single-phase process; and (b) flow diagram for the estimation of energy yield for the two-phase process.
R. Ganesh et al. / Waste Management 34 (2014) 875–885 883
As can be seen in Fig. 6, for the single-phase system, the volumeof methane produced would be 157.5 l/week, taking into accountthe experimentally observed methane yield of 0.45 m3 CH4/kg VSfed. The energy yield from the single-phase system would be5639 kJ (1780 kJ/kg of FVW). For the two-phase system, the acidi-fication reactor would produce 14 l of H2/week (energy yield of151 kJ/week) and 7 l of CH4/week (energy yield of 251 kJ/week).For the quantity of COD solubilized and extracted through the cen-trifuged liquid and fed to the methanogenic reactor (350 g COD/week), methane volume produced would be 94.5 l/week (esti-mated based on the experimental methane yield of 0.27 m3 CH4/kg COD) generating an energy yield of 3383 kJ/week. The combinedenergy yield from the two-phase system would then be 3785 kJ/week (1195 kJ/kg of FVW). The energy yield from the two-phaseprocess was lower by 33% compared to the one-phase process.For a two-phase system co-digesting food waste and sewagesludge (Siddiqui et al., 2011), 13.4% less energy was obtained com-pared to the single-phase system. This shortfall in energy was dueto a low hydrogen yield and the loss of energy through carbondioxide formation in the acidification reactor. Higher hydrolysisefficiency can result in lower organics being available for methano-genesis due to the loss of carbon through carbon dioxide or micro-bial biomass (Johansen and Bakke, 2006). The low energy yield inthe two-phase system in the present study was also a result ofthe low methane yield in the second-phase TPMR where about28% less methane was obtained due to poor biodegradability ofthe non VFA-COD.
The methane yield equivalent of the energy yield of the two-phase system (3785 kJ/week) was 0.30 m3 CH4/kg VS. Methaneyields reported in the literature for the two-phase digestion ofFVW ranged between 0.25 and 0.35 m3 CH4/kg VS for OLRs in therange 4.4–7.67 kg VS/m3 d (Table 4). These values are lower thanthe single-phase process, similar to the observations made in thepresent investigation. Additionally, it has to be noted that the esti-mation of energy yield for the single-phase system was made tak-ing into account the experimental methane yield value of 0.45 m3
CH4/kg fed at the OLR of 3.5 kg VS/m3 d. For a valid comparison ofthe two processes, the quantity of waste to be treated had to be the
same, which thus means that the volume of reactors for the twoprocesses will be different. For the single-phase process, the reac-tor volume will be higher by a factor of two if the same methaneyield of 0.45 m3 CH4/kg VS fed as obtained in the experiment is de-sired (in the experiments, the waste treated per week was 175 g).
To make a rational comparison between the two processes,material balance involving solids fed, solids drained and gas pro-duced was worked out for the single-phase and two-phase sys-tems. Two assumptions were made in creating the materialbalance; (i) the quantity of feed was assumed as 1 tonne/day and(ii) the volume of the methanogenic reactor (TPMR) was calculatedbased on a HRT of 5 days. According to literature, the HRT of meth-anogenic reactor for FVW varied between 1 and 10 days (Shenet al., 2013; Bouallagui et al., 2004; Dinsdale et al., 2000; Raynalet al., 1998; Mtz.-Viturtia et al., 1995; Verrier et al., 1987), hencean average HRT of 5 days was chosen. Material balances for thesingle-phase and two-phase systems are shown in Fig. 7. It canbe seen that the single-phase process (Fig. 7a) is a simple andstraight-forward system with a volumetric biogas production(VBP) of 2.01 m3/m3 d and volumetric methane production (VMP)of 1.13 m3/m3 d. On the other hand the two-phase system involvessolids and liquid recirculation between the acidification and meth-anogenic reactor involving a centrifugation process for solid–liquidseperation. The VBP of the two-phase process was 1.72 m3/m3 dand the volumetric methane plus hydrogen production was0.83 m3/m3 d. The VMP of the two-phase system (estimated fromthe energy value of methane and hydrogen) was 0.75 m3/m3 d,which was lower by 33% compared to the VMP of single-phase pro-cess, similar to the energy yield as explained in Fig. 6. The compli-cated operation procedure and the lower VMP and energy yieldsshowed that two-phase process would not be economically viableand the single-phase process is more advantageous.
Several authors have studied the two-phase anaerobic processfor FVW, some of which are tabulated in Table 4. Bouallagui et al.(2004) studied the two-phase anaerobic digestion of FVW in twocoupled anaerobic sequencing batch reactors (ASBR). The authorsconcluded that phase separation resulted in high process stability,significant biogas productivity and better effluent quality. A
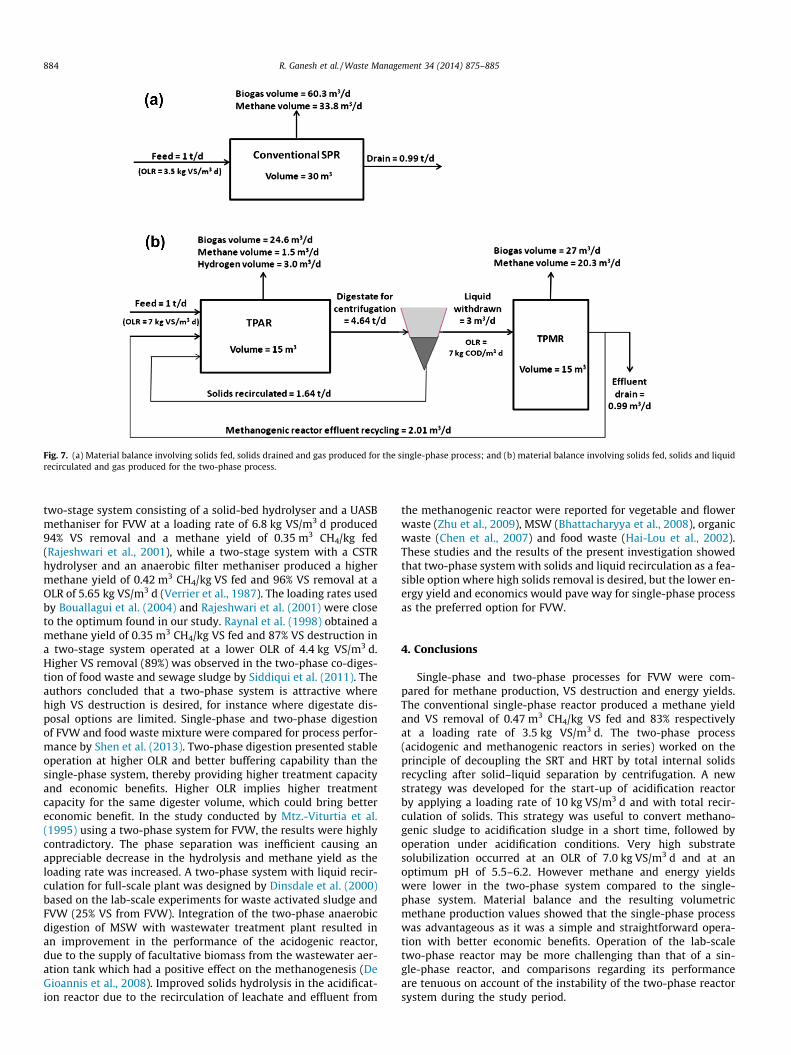
Fig. 7. (a) Material balance involving solids fed, solids drained and gas produced for the single-phase process; and (b) material balance involving solids fed, solids and liquidrecirculated and gas produced for the two-phase process.
884 R. Ganesh et al. / Waste Management 34 (2014) 875–885
two-stage system consisting of a solid-bed hydrolyser and a UASBmethaniser for FVW at a loading rate of 6.8 kg VS/m3 d produced94% VS removal and a methane yield of 0.35 m3 CH4/kg fed(Rajeshwari et al., 2001), while a two-stage system with a CSTRhydrolyser and an anaerobic filter methaniser produced a highermethane yield of 0.42 m3 CH4/kg VS fed and 96% VS removal at aOLR of 5.65 kg VS/m3 d (Verrier et al., 1987). The loading rates usedby Bouallagui et al. (2004) and Rajeshwari et al. (2001) were closeto the optimum found in our study. Raynal et al. (1998) obtained amethane yield of 0.35 m3 CH4/kg VS fed and 87% VS destruction ina two-stage system operated at a lower OLR of 4.4 kg VS/m3 d.Higher VS removal (89%) was observed in the two-phase co-diges-tion of food waste and sewage sludge by Siddiqui et al. (2011). Theauthors concluded that a two-phase system is attractive wherehigh VS destruction is desired, for instance where digestate dis-posal options are limited. Single-phase and two-phase digestionof FVW and food waste mixture were compared for process perfor-mance by Shen et al. (2013). Two-phase digestion presented stableoperation at higher OLR and better buffering capability than thesingle-phase system, thereby providing higher treatment capacityand economic benefits. Higher OLR implies higher treatmentcapacity for the same digester volume, which could bring bettereconomic benefit. In the study conducted by Mtz.-Viturtia et al.(1995) using a two-phase system for FVW, the results were highlycontradictory. The phase separation was inefficient causing anappreciable decrease in the hydrolysis and methane yield as theloading rate was increased. A two-phase system with liquid recir-culation for full-scale plant was designed by Dinsdale et al. (2000)based on the lab-scale experiments for waste activated sludge andFVW (25% VS from FVW). Integration of the two-phase anaerobicdigestion of MSW with wastewater treatment plant resulted inan improvement in the performance of the acidogenic reactor,due to the supply of facultative biomass from the wastewater aer-ation tank which had a positive effect on the methanogenesis (DeGioannis et al., 2008). Improved solids hydrolysis in the acidificat-ion reactor due to the recirculation of leachate and effluent from
the methanogenic reactor were reported for vegetable and flowerwaste (Zhu et al., 2009), MSW (Bhattacharyya et al., 2008), organicwaste (Chen et al., 2007) and food waste (Hai-Lou et al., 2002).These studies and the results of the present investigation showedthat two-phase system with solids and liquid recirculation as a fea-sible option where high solids removal is desired, but the lower en-ergy yield and economics would pave way for single-phase processas the preferred option for FVW.
4. Conclusions
Single-phase and two-phase processes for FVW were com-pared for methane production, VS destruction and energy yields.The conventional single-phase reactor produced a methane yieldand VS removal of 0.47 m3 CH4/kg VS fed and 83% respectivelyat a loading rate of 3.5 kg VS/m3 d. The two-phase process(acidogenic and methanogenic reactors in series) worked on theprinciple of decoupling the SRT and HRT by total internal solidsrecycling after solid–liquid separation by centrifugation. A newstrategy was developed for the start-up of acidification reactorby applying a loading rate of 10 kg VS/m3 d and with total recir-culation of solids. This strategy was useful to convert methano-genic sludge to acidification sludge in a short time, followed byoperation under acidification conditions. Very high substratesolubilization occurred at an OLR of 7.0 kg VS/m3 d and at anoptimum pH of 5.5–6.2. However methane and energy yieldswere lower in the two-phase system compared to the single-phase system. Material balance and the resulting volumetricmethane production values showed that the single-phase processwas advantageous as it was a simple and straightforward opera-tion with better economic benefits. Operation of the lab-scaletwo-phase reactor may be more challenging than that of a sin-gle-phase reactor, and comparisons regarding its performanceare tenuous on account of the instability of the two-phase reactorsystem during the study period.

R. Ganesh et al. / Waste Management 34 (2014) 875–885 885
References
APHA, 2005. Standard Methods for the Examination of Water and Wastewater, 21sted., Washington DC, USA.
Bhattacharyya, J.K., Kumar, Sunil, Devotta, S., 2008. Studies on acidification in two-phase biomethanation process of municipal solid waste. Waste Manage. 28,164–169.
Bouallagui, H., Ben Cheikh, R., Marouani, L., Hamdi, M., 2003. Mesophilic biogasproduction from fruit and vegetable waste in tubular digester. Bioresour.Technol. 86, 85–89.
Bouallagui, H., Lahdheb, H., Ben Romdan, E., Rachdi, B., Hamdi, M., 2009.Improvement of fruit and vegetable waste anaerobic digestion performanceand stability with co-substrates addition. J. Environ. Manage. 90, 1844–1849.
Bouallagui, H., Torrijos, M., Godon, J.J., Moletta, R., Ben Cheikh, R., Touhami, Y.,Delgenes, J.P., Hamdi, M., 2004. Two-phase anaerobic digestion of fruit andvegetable wastes: bioreactors performance. Biochem. Eng. J. 21, 193–197.
Bouallagui, H., Touhami, Y., Ben Cheikh, R., Hamdi, M., 2005. Bioreactor performancein anaerobic digestion of fruit and vegetable wastes. Process. Biochem. 40, 989–995.
Callaghan, F.J., Wase, D.A.J., Thayanithy, K., Forster, C.F., 2002. Continuous co-digestion of cattle slurry with fruit and vegetable wastes and chicken manure.Biomass Bioenerg. 27, 71–77.
Chen, L., Jiang, W.Z., Kitamura, Y., Li, B., 2007. Enhancement of hydrolysis andacidification of solid organic waste by a rotational drum fermentation systemwith methanogenic leachate recirculation. Bioresour. Technol. 98, 2194–2200.
Chugh, S., Clarke, W., Pullammanappallil, P., Rudolph, V., 1998. Effect of recirculatedleachate volume on MSW degradation. Waste Manage. Res. 16, 564–573.
De Gioannis, G., Diaz, L.F., Muntoni, A., Pisanu, A., 2008. Two-phase anaerobicdigestion within a solid waste/wastewater integrated management system.Waste Manage. 28, 1801–1808.
Dinsdale, R.M., Premier, G.C., Hawkes, F.R., Hawkes, D.L., 2000. Two-stage anaerobicco-digestion of waste activated sludge and fruit/vegetable waste using inclinedtubular digesters. Bioresour. Technol. 72, 159–168.
Ganesh, R., Torrijos, M., Sousbie, P., Steyer, J.P., Lugardon, A., Delgenes, J.P., 2013.Anaerobic co-digestion of solid waste: effect of increasing organic loading ratesand characterization of the solubilised organic matter. Bioresour. Technol. 130,559–569.
Ghosh, S., Henry, M.P., Sajjad, A., Mensinger, M.C., Arora, J.L., 2000. Pilot-scalegasification of municipal solid wastes by high-rate and two-phase anaerobicdigestion (TPAD). Water Sci. Technol. 41, 101–110.
Gomec, C.Y., Speece, R.E., 2003. The role of pH in the organic material solubilisationof domestic sludge in anaerobic digestion. Water Sci. Technol. 48, 143–150.
Grady, C.P.L., Daigger, G.T., Lim, H.C., 1999. Biological Wastewater Treatment.Marcel Dekker Inc., New York.
Gunaseelan, V.N., 1997. Anaerobic digestion of biomass for methane production: areview. Biomass Bioenerg. 13, 83–114.
Hai-Lou, X., Jing-Yuan, W., Joo-Hwa, T., 2002. A hybrid anaerobic solid-liquidbioreactor for food waste digestion. Biotechnol. Lett. 24, 757–761.
Horiuchi, J.I., Shimizu, T., Tada, K., Kanno, T., Kobayashi, M., 2002. Selectiveproduction of organic acids in anaerobic acid reactor by pH control. Bioresour.Technol. 82, 209–213.
Johansen, J.E., Bakke, R., 2006. Enhancing hydrolysis with microaeration. Water Sci.Technol. 53, 43–50.
Koutrouli, E.C., Kalfas, H., Gavala, H.N., Skiadas, I.V., Stamatelatou, K., Lyberatos, G.,2009. Hydrogen and methane production through two-stage mesophilicanaerobic digestion of olive pulp. Bioresour. Technol. 42, 3718–3723.
Lin, J., Zuo, J., Gan, L., Li, P., Liu, F., Wang, K., Chen, L., Gan, H., 2011. Effects of mixtureratio on anaerobic co-digestion with fruit and vegetable waste and food wasteof China. J. Environ. Sci. 23, 1403–1408.
Lissens, G., Vandevivere, P., De Baere, L., Biey, E.M., Verstrae, W., 2001. Solid wastedigesters: process performance and practice for municipal solid wastedigestion. Water Sci. Technol. 44, 91–102.
Mata-Alvarez, J., Cecchi, F., Llabrés, P., Pavan, P., 1992. Anaerobic digestion of theBarcelona central food market organic wastes: plant design and feasibilitystudy. Bioresour. Technol. 42, 33–42.
Mata-Alvarez, J.A., 1987. A dynamic simulation of a two-phase anaerobic digestionsystem for solid wastes. Biotechnol. Bioeng. 30, 844–851.
Mtz.-Viturtia, A., Mata-Alvarez, J., Cecchi, F., 1995. Two-phase continuous anaerobicdigestion of fruit and vegetable wastes. Resour. Conserv. Recycl. 13, 257–267.
Murphy, J.D., McKeogh, E., 2004. Technical, economic and environmental analysis ofenergy production from municipal solid waste. Renew. Energ. 9, 1043–1057.
Parawira, W., Read, J.S., Mattiasson, B., Björnsson, L., 2008. Energy production fromagricultural residues: high methane yields in pilot-scale two-stage anaerobicdigestion. Biomass Bioenerg. 32, 44–50.
Rajeshwari, K.V., Panth, D.C., Lata, K., Kishore, V.V.N., 2001. Novel process usingenhanced acidification and a UASB reactor for biomethanation of vegetablemarket waste. Waste Manage. Res. 1, 292–300.
Reinhart, D.R., Al-Yousfi, A.B., 1996. The impact of leachate recirculation onmunicipal solid waste landfill operating characteristics. Waste Manage. Res. 14,337–346.
Raynal, J., Delgenes, J.P., Moletta, R., 1998. Two-phase anaerobic digestion of solidwaste by a multiple liquefaction reactors process. Bioresour. Technol. 65, 97–103.
Salomoni, C., Caputo, A., Bonoli, M., Francioso, O., Rodriguez-Estrada, M.T.,Palenzona, D., 2011. Enhanced methane production in a two-phase anaerobicdigestion plant, after CO2 capture and addition to organic wastes. Bioresour.Technol. 102, 6443–6448.
Shen, F., Yuan, H., Pang, Y., Chen, S., Zhu, B., Zou, D., Liu, Y., Ma, J., Yu, L., Li, X., 2013.Performances of anaerobic co-digestion of fruit and vegetable waste (FVW) andfood waste (FW): single-phase vs. two-phase. Bioresour. Technol. 144, 80–85.
Shin, H.S., Han, S.K., Song, Y.C., Lee, C.Y., 2001. Performance of UASB reactor treatingleachate from acidogenic fermenter in the two phase anaerobic digestion offood waste. Water Res. 35, 3441–3447.
Siddiqui, Z., Horan, N.J., Salter, M., 2011. Energy optimisation from co-digestedwaste using a two-phase process to generate hydrogen and methane. Internat. J.Hyd. Energ. 36, 4792–4799.
Stabnikova, O., Liu, X.Y., Wang, J.Y., 2008. Anaerobic digestion of food waste in ahybrid anaerobic solid–liquid system with leachate recirculation in anacidogenic reactor. Biochem. Eng. J. 41, 198–201.
Verrier, D., Ray, F., Albagnac, G., 1987. Two-phase methanization of solid vegetablewastes. Biol. Wastes 22, 163–177.
Zhu, M., Lü, F., Hao, L.P., He, P.J., Shao, L.M., 2009. Regulating the hydrolysis oforganic wastes by micro-aeration and effluent recirculation. Waste Manage. 29,2042–2050.