sindicato nacional da 2012 -...
TRANSCRIPT

SINDICATO NACIONAL DA INDÚSTRIA DO CIMENTO
2012

ÍNDICEINDEX
SINDICATO NACIONAL DA INDÚSTRIA DO CIMENTO
CONSELHO CONSULTIVO / ADVISORY COUNCIL
EFETIVOS / EFFECTIVE SUPLENTES / SUBSTITUTE Alexis Philippe Jacques Langlois Rogério Aparecido da Silva Sergio Maçães Alberto Mestieri Paulo Procopiak de Aguiar Cláudio Gomes Slaviero Luiz Alberto de Castro Santos Paulo Oliveira Motta Júnior
DIRETORIA / BOARD OF DIRECTORS
Presidente / PresidentJosé Otavio Carneiro de Carvalho
Vice-Presidente / Vice-PresidentMarcílio Jacques Brotherhood
3 Palavras do Presidente A word from the President
4 Fábricas de Cimento no Brasil Cement Plants in Brazil
6 Panorama Econômico Economic Panoram
10 Meio Ambiente The Environment
14 Números Numbers
14 Produção e Despacho Production and Sales
22 Exportação e Importação Export and Import
24 Consumo Aparente Apparent Consumption
30 Dados Internacionais International Data
36 Empresas Associadas Associated Companies

A indústria de cimento brasileira vem acompanhando com aten-ção o comportamento da economia mundial e nacional. O próprio desempenho do setor é um termômetro da conjuntura. Embora o cenário em 2012 tenha sido de fraco crescimento internacional e doméstico, o consumo de cimento no Brasil manteve-se em patamar elevado, aumentando 6,7% em relação ao ano anterior.
Esse número expressivo representa, no entanto, uma desacele-ração no ritmo de crescimento do setor. Se, em 2010, foi observado um salto de 15,6% em relação ao ano anterior – auge da crise mundial -, em 2011 o índice registrado foi de 8,3%.
A desaceleração não significa queda de investimentos. Pelo contrário: em 2012, foram consumidas 69,3 milhões de toneladas de cimento no país. Para atender a essa demanda, a indústria inaugurou novas unidades e aumentou a capacidade de fábricas existentes.
O desempenho mostra que o mercado de cimento está prepa ra do para enfrentar o desafio de investir fortemente na infra estru tura brasileira, cuja construção ainda está no começo.
Esse desafio caminha par e passo com o comprometimento com práticas sustentáveis. Mais uma vez, a indústria cimenteira mostra seu pioneirismo na área estudando o desenvolvimento de uma nova iniciativa: a elaboração de um mapeamento sobre as emissões de CO2 do setor no Brasil, projetadas até 2050, e suas respectivas alternativas de redução.
Fundado em 1953, o Sindicato Nacional da Indústria do Cimento optou por diminuir neste ano, quando comemora seis décadas de existência, a versão impressa de seu relatório anual, mantendo na edição digital disponível no site www.snic.org.br a totalidade dos dados, numa ação em linha com a sustentabilidade das atividades.
As informações disponibilizadas pelo SNIC mostram seu papel fundamental como fornecedor de estatísticas relevantes para o país e que atendem a necessidades de diversos públicos, como governo e entidades acadêmicas, além de serem valiosos indicadores da atividade econômica.
Para facilitar o acesso a todas essas estatísticas, o site do SNIC foi reformulado e o Relatório Anual 2012 ocupa lugar de destaque na nova estrutura.
Boa leitura!
PALAVRAS DO PRESIDENTEA WORD FROM THE PRESIDENT
The Brazilian cement industry has been closely following both Brazil’s and the world’s economy. The performance of the sector itself is a thermometer for the economic climate. Despite little domestic and international growth in 2012, the consumption of cement in Brazil remained at a high level, growing by 6.7% in comparison with the previous year.
This impressive number represents, however, a slowdown in the rhythm of growth in the sector. In 2010 there was a leap of 15.6% in relation to the previous year – the peak of the world crisis – in 2011 the index recorded was 8.3%.
This slowdown does not signify a fall in investments. On the contrary, in 2012, 69 million tons of cement were consumed in the country. To satisfy this demand, the industry inaugurated new units and increased the capacity of existing factories.
The performance shows that the cement market is prepared to face the challenge to invest heavily in Brazilian infrastructure, the construction of which is still in its initial stage.
This challenge goes hand in hand with the commitment to sustainable practices. Once again, the cement industry shows its pioneer spirit in the sector, studying and developing a new initiative: a project for mapping the sector’s CO2 emissions in Brazil, projected up to 2050, and the respective alternatives for reduction.
Founded in 1953, the National Cement Industry Association commemorates this year six decades of existence and opted to reduce the printed version of its annual report, releasing a digital edition on the website www.snic.org.br with all the data, thus acting in line with the sustainable activities of the industry.
The data made available by the SNIC show its fundamental role in providing relevant statistics for the country, which satisfy the needs of various sectors of the public, such as the government and academic entities, besides being valuable indicators of economic activity.
To facilitate access to all these statistics, the SNIC website was reformulated and the 2012 Annual Report occupies a prominent position in the new structure.
Good reading!

5
10
11
13
141516
1718
29
36
37
38
4142 51
44454650
4748
1920 21
22
242325
30
3133
32
34
35
49
67
70 71
72
6966
73
7677
7879
80
8382
8584
54
53
52
58
65 75
5963 6062
68
74
43
40
7
12
26
27
28
8
2
36
4
1
56 5761
55
9
81
RRAP
PAAM
ACRO
MT
MS
GO
DF
TO
MA
PI
CERN
PB
PE
AL
SEBA
MG
RJ
PR
SC
RS
39
64
FÁBRICAS DE CIMENTO NO BRASILCEMENT PLANTS IN BRAZIL
4

Nº Fábrica Município UF Grupo industriaL
REGIÃO NORTE 1 PORTO VELHO PORTO VELHO RO VOTORANTIM 2 ITAUTINGA MANAUS AM JOÃO SANTOS 3 CIBRASA CAPANEMA PA JOÃO SANTOS 4 ITAITUBA ITAITUBA PA JOÃO SANTOS 5 BARCARENA BARCARENA PA VOTORANTIM 6 PRIMAVERA PRIMAVERA PA VOTORANTIM 7 XAMBIOÁ XAMBIOÁ TO VOTORANTIM
REGIÃO NORDESTE 8 ITAPICURU CODÓ MA JOÃO SANTOS 9 SÃO LUÍS SÃO LUÍS MA VOTORANTIM 10 ITAPISSUMA FRONTEIRAS PI JOÃO SANTOS 11 SOBRAL SOBRAL CE VOTORANTIM 12 PECÉM CAUCAIA CE VOTORANTIM 13 ITAPUÍ BARBALHA CE JOÃO SANTOS 14 APODI DIONÍSIO TORRES CE OUTROS 15 ITAPETINGA MOSSORÓ RN JOÃO SANTOS 16 MIZU BARAÚNA RN OUTROS 17 INTERCEMENT JOÃO PESSOA PB INTERCEMENT 18 LAFARGE CAAPORÃ PB LAFARGE 19 ITAPESSOCA GOIANA PE JOÃO SANTOS 20 INTERCEMENT CABO DE STO. AGOSTINHO PE INTERCEMENT 21 POTY PAULISTA PAULISTA PE VOTORANTIM 22 INTERCEMENT SÃO M. DOS CAMPOS AL INTERCEMENT 23 LARANJEIRAS LARANJEIRAS SE VOTORANTIM 24 ITAGUASSU N. Sra. do SOCORRO SE JOÃO SANTOS 25 MIZU PACATUBA SE OUTROS 26 INTERCEMENT CAMPO FORMOSO BA INTERCEMENT 27 INTERCEMENT BRUMADO BA INTERCEMENT 28 LAFARGE CANDEIAS BA LAFARGE
REGIÃO CENTRO-OESTE 29 CIPLAN SOBRADINHO DF CIPLAN 30 SOBRADINHO SOBRADINHO DF VOTORANTIM 31 INTERCEMENT CEZARINA GO INTERCEMENT 32 LAFARGE COCALZINHO GO LAFARGE 33 GOIÁS EDEALINA GO VOTORANTIM 34 NOBRES NOBRES MT VOTORANTIM 35 CUIABÁ CUIABÁ MT VOTORANTIM 36 INTERCEMENT BODOQUENA MS INTERCEMENT 37 CORUMBÁ CORUMBÁ MS VOTORANTIM
REGIÃO SUDESTE 38 LAFARGE MONTES CLAROS MG LAFARGE 39 INTERCEMENT SANTANA DO PARAISO MG INTERCEMENT 40 LAFARGE MATOZINHOS MG LAFARGE 41 LIZ VESPASIANO MG LIZ 42 HOLCIM PEDRO LEOPOLDO MG HOLCIM 43 INTERCEMENT PEDRO LEOPOLDO MG INTERCEMENT 44 LAFARGE ARCOS MG LAFARGE 45 ITAÚ DE MINAS ITAÚ DE MINAS MG VOTORANTIM 46 TUPI CARANDAÍ MG C.P.CIMENTO 47 HOLCIM BARROSO MG HOLCIM 48 INTERCEMENT IJACI MG INTERCEMENT 49 LAFARGE SANTA LUZIA MG LAFARGE 50 CSN ARCOS MG OUTROS 51 BRENNAND SETE LAGOAS MG OUTROS 52 HOLCIM SERRA ES HOLCIM 53 ITABIRA C. de ITAPEMIRIM ES JOÃO SANTOS 54 MIZU VITÓRIA ES OUTROS 55 RIO NEGRO CANTAGALO RJ VOTORANTIM 56 LAFARGE CANTAGALO RJ LAFARGE 57 HOLCIM CANTAGALO RJ HOLCIM 58 TUPI VOLTA REDONDA RJ C.P.CIMENTO 59 VOLTA REDONDA VOLTA REDONDA RJ VOTORANTIM 60 CSN VOLTA REDONDA RJ OUTROS 61 MIZU RIO DE JANEIRO RJ OUTROS 62 SEPETIBA ITAGUAÍ RJ VOTORANTIM 63 HOLCIM SOROCABA SP HOLCIM 64 SANTA HELENA VOTORANTIM SP VOTORANTIM 65 SALTO SALTO DE PIRAPORA SP VOTORANTIM 66 CUBATÃO CUBATÃO SP VOTORANTIM 67 LAFARGE ITAPEVA SP LAFARGE 68 RIBEIRÃO GRANDE RIBEIRÃO GRANDE SP VOTORANTIM 69 TUPI MOGI DAS CRUZES SP C.P.CIMENTO 70 INTERCEMENT APIAÍ SP INTERCEMENT 71 INTERCEMENT CAJATI SP INTERCEMENT 72 INTERCEMENT JACAREÍ SP INTERCEMENT 73 MIZU MOGI DAS CRUZES SP OUTROS 74 SP CIM SUZANO SP OUTROS 75 INTERCEMENT CUBATÃO SP INTERCEMENT
REGIÃO SUL 76 RIO BRANCO RIO BRANCO DO SUL PR VOTORANTIM 77 ITAMBÉ BALSA NOVA PR ITAMBÉ 78 ITAJAÍ ITAJAÍ SC VOTORANTIM 79 VIDAL RAMOS VIDAL RAMOS SC VOTORANTIM 80 IMBITUBA IMBITUBA SC VOTORANTIM 81 SUPREMO POMERODE SC OUTROS 82 INTERCEMENT NOVA SANTA RITA RS INTERCEMENT 83 ESTEIO ESTEIO RS VOTORANTIM 84 INTERCEMENT CANDIOTA RS INTERCEMENT 85 PINHEIRO MACHADO PINHEIRO MACHADO RS VOTORANTIM
5

6
PANORAMA ECONÔMICOECONOMIC PANORAMA
INDICADORES SELECIONADOS / Selected indicators D%
PIB - taxa de crescimento / GDP - rate of growth 0,9%
PIB per capita - taxa de crescimento / GDP per capita - rate of growth 0,1%
PIB indústria - taxa de crescimento / GDP industry - rate of growth - 0,8%
Construção civil - taxa de crescimento / Civil construction - rate of growth 1,4%
FBCF* - taxa de crescimento / GFCF* - rate of growth - 4,0%
Taxa de desemprego - dezembro / Unemployment rate - December 4,6%
Renda real - taxa de crescimento em dezembro / Real Income - rate of growth in December 3,2%
Juros -taxa básica selic - média do ano / Interest - Selic basic rate - average for year 8,5%
Inflação - IPCA - taxa anual em dezembro / Inflation - IPCA - annual rate in December 5,8%
Saldo da balança comercial - US$ bilhões / Balance of trade - US$ bilhões 19,4(*) Formação bruta de capital fixo / Gross fixed capital formationFonte / Source: IBGE, BACEN, MDIC
Economia brasileira em 2012 / Brazilian economy in 2012
Com a economia mundial ainda com um crescimento baixo em 2012, o Brasil, impactado pelo panorama mundial, teve um desempenho econômico abaixo do esperado. Com previsões iniciais maiores de 3%, o PIB brasileiro terminou o ano de 2012 com um crescimento discreto de 0,9%. O PIB per capita praticamente não teve variação, apenas 0,1%. Dentre os setores, somente o de serviços teve aumento, 1,7%. Agropecuária e indústria tiveram queda de 2,3% e 0,8%, respectivamente.
O consumo das famílias e o consumo da administração pública tiveram praticamente o mesmo crescimento, 3,1% e 3,2%, respectivamente. A formação bruta de capital fixo teve uma queda expressiva de 4%, fazendo cair a taxa de investimento do país em relação ao PIB para 18,1%.
A inflação medida pelo IPCA ficou em 5,8%, acima da meta de 4,5% estabelecida pelo Banco Central, porém dentro do limite superior de 6,5%. A taxa de juros Selic teve trajetória de queda durante todo o ano, chegando a 7,25% a.a. em dezembro de 2012.
In 2012 the world economy still showing low growth, and impacted by this panorama, Brazil has shown a lower than expected economic performance. With initial forecasts greater than 3%, the Brazilian GDP ended 2012 with a modest growth of 0.9%. The GDP per capita showed practically no variation, only 0.1%. Among the sectors, only the service industry saw an increase of 1.7%. Agriculture and industry suffered falls of 2.3% and 0.8%, respectively.
Family consumption and public administration had practically the same growth, 3.1% and 3.2%, respectively. Gross fixed capital formation (GFCF) suffered a significant fall of 4%, and with this the country’s rate of investment fell to 18.1% in relation to the GDP.
Inflation measured by the IPCA stayed at 5.8%, above the target of 4.5% established by the Central Bank, but within the higher limit of 6.5%. The Selic interest rate was on the decrease during the whole year, ending at 7.25% p.a. in December 2012.

7
Evolução da construção civil e participação do setor na economiaEvolution of civil construction and participation in the economy
Financiamento imobiliário - FGTS e SBPE (em nº de unidades)Real state financing - FGTS e SBPE
CONSTRUÇÃO CIVIL
CIVIL CONSTRUCTION
A construção civil brasileira teve, em 2012, desempenho um pouco melhor do que a economia como um todo, apresentando crescimento de 1,4%. Assim como nos últimos anos, o setor imobiliário continuou alavancando esse crescimento.
As duas principais fontes de recursos para o financiamento imobiliário (Fundo de Garantia por Tempo de Serviço – FGTS e o Sistema Brasileiro de Poupança e Empréstimo – SBPE) foram responsáveis por financiar R$118,8 bilhões em imóveis (residencial e comercial) em 2012, variação de 4% com relação a 2011. No entanto, refletindo o aumento ocorrido nos preços dos imóveis, o número de unidades financiadas caiu 7% no mesmo período chegando a 968,6 mil.
O financiamento destinado a novas construções e reformas (imóvel novo, construção, material de construção, reforma ou ampliação) somou R$79,3 bilhões em 724 mil unidades em 2012. Isso representou queda de 0,4% no valor financiado e queda de 7,7% no numero de unidades. Esse é um bom indicador para o mercado da construção civil, já que exclui os imóveis já prontos e que não agregariam valor para a atividade.
Fonte / Source: IBGE
Constr. Civil / Civil Construction Participação no PIB / Share in GDP
2005 2006 2007 2008 2009 2010 2011 2012
150
140
130
120
110
100
90
140,4
101,8106,5
111,7
120,6
133,6
138,4
119,7
4,9% 4,9%
Índice/Index 2004 = 100
7,5%
6,5%
5,5%
4,5%
4,7%
4,9%5,3%
5,7%5,8%
5,7%
SBPE Novas construções e reformasFGTS Novas construções e reformasFiananciamento Total (imóveis usados e novos)
Fonte / Source: CBIC
The Brazilian civil construction in 2012 performed slightly better than the economy as a whole, showing growth of 1.4%. Thus as in recent years, the real estate sector continued to lever this growth.
The two main sources for funding for the real estate market (The Redundancy Compensation Fund for Employees (FGTS) and the Brazilian Savings and Loan System (SBPE) were responsible for financing R$118.8 billion in real estate (residential and commercial) in 2012, a variation of 4% in relation to 2011. However, reflecting the increase that occurred in housing prices, the number of units financed fell 7% in the same period, ending at 968,600.
The financing destined for new constructions and restorations (new building, construction, material, restoration and expansion) totaled R$79.3 billion in 724,000 units in 2012. This represented a reduction of 0.4% in the value financed and a fall of 7.7% in the number of units. This is a good indicator for the civil construction market, in that it excludes units already built that do not add value to the activity.
Mil Unidades /1.000 Units
2005 2006 2007 2008 2009 2010 2011 2012
1.200
1.000
800
600
400
200
0
399
522
110,2195,0 181,5
58,1
179,2
585
42,8
247,4
529 567,8 465,6452,1
1.042
277,0
307,5255,0
259,8 319,1272,0
700
974
968

8
O MERCADO DE CIMENTO EM 2012
THE CEMENT MARKET IN 2012
O consumo aparente de cimento, apesar do crescimento de 6,7% em 2012, continuou com a desaceleração apontada no ano anterior. Ao todo, foram 69,3 milhões de toneladas consumidas em todo o território nacional. Isso significou um consumo per capita de 353 kg/hab/ano.
The apparent consumption of cement, despite the growth of 6.7% in 2012, continued the deceleration noted the previous year. In all, 69.3 million tons were consumed in the whole country. This signified consumption per capita of 353/inhab/year.
70
60
50
40
30
20
10
0
575
500
425
350
275
200
125
50
Fonte / Source SNIC
1970 1975 1980 1985 1990 1995 2000 2005 2010 2012
Milagre Econômico
Retomada do crescimento
Estagnação Consolidação do mercado
Consumo aparente no Brasil (em milhões de toneladas)
Apparent consumption in Brazil (millions of tonnes)
Consumo aparente absoluto / Absolut apparent consumptionConsumo aparente per capita / Per capita apparent consumption
kg/hab / kg/inhab

9
O parque industrial nacional continuou crescendo, com inauguração de novas unidades e aumento da capacidade de fábricas já existentes, permitindo a produção atingir um patamar de 68,8 milhões de toneladas. A importação de cimento foi de 977 mil toneladas, ou seja, apenas 1,4% do consumo aparente.
DISCRIMINAÇÃO/CATEGORY 2011 2012 D %
Produção / Production 64.093 68.809 7,3%
Despacho total / Total deliveries 63.925 68.373 7,0%
Venda interna / Domestic sales 63.881 68.347 7,0%
Exportação / Exports 44 26 - 40,9%
Importação / Imports 1.091 977 - 10,4%
Consumo aparente /Apparent consumption 64.972 69.324 6,7%
Consumo per capita /Consump…tion per capita (kg/hab) 333 353 6,0%
Fonte / Source: SNIC
O cimento em 2012 (em 1.000 toneladas)Cement in 2012 (1.000 tonnes)
Distribuição regional do consumo aparente (em 1.000 toneladas)
Regional distribution of apparent consumption (1.000 tonnes)
The industry’s installed capacity continued to grow, with the inauguration of new units and the expansion of existing factories, permitting production to reach a level of 68.8 million tons. Importation of 977,000 tons represents only 1.4% of apparent consumption.
O crescimento do consumo se deu de forma uniforme em quase todas as regiões do país, com exceção do nordeste que apresentou a maior variação com relação ao ano anterior. Em termos absolutos, a região sudeste continua como o maior consumidor, responsável por 45% do consumo nacional.
The growth of consumption was uniform in almost all regions of the country, with the exception of the northeast, which showed a larger variation in relation to the previous year. In absolute terms, the southeastern region continues as the largest consumer, responsible for 45% of national consumption.
REGIÃO / Region CONSUMO APARENTE / Apparent consumption D %
2011 2012
Norte / North 4.728 5.014 6,0%
Nordeste / Northeast 13.160 14.607 11,0%
Centro-Oeste / Middlewest 6.307 6.714 6,5%
Sudeste / Southeast 29.875 31.438 5,2%
Sul / South 10.902 11.551 6,0%
Brasil 64.972 69.324 6,7%
Fonte / Source: SNIC

10
MUDANÇAS CLIMÁTICAS
CLIMATE CHANGE
As mudanças climáticas, suas causas e consequências, tem sido o tema dominante da agenda ambiental nos últimos anos. Para a indústria do cimento constitui também uma questão de máxima relevância, uma vez que a emissão de CO² é intrínseca ao seu processo produtivo, seja com a transformação química da matéria-prima em cimento, seja com a queima de combustíveis utilizados para possibilitar essa transformação.
Estudos internacionais apontam que aproximadamente 5% das emissões de CO² de origem antrópica no mundo provêm da produção de cimento (no Brasil esse valor corresponde a 1,4%, de acordo com o 2º Inventário Nacional de Gases de Efeito Estufa). Por sua vez, a previsão de demanda por cimento, principalmente nas economias emergentes como o Brasil, é de aumentar substancialmente nas próximas décadas, fazendo da gestão de carbono uma questão prioritária para o setor.
Políticas estaduais de mudanças climáticasPolíticas estaduais de mudanças climáticas
Fonte / Source: NESA
Lei sancionada / Law approved
Projeto de Lei / Bill
Nada / Nothing
Climate change, its causes and consequences, have been the dominant environmental theme in recent years. For the cement industry it also constitutes a question of major relevance, since the emission of CO2 is intrinsic to its productive process, either with the chemical transformation of raw material into cement, or with the burning of the fuels used to make this transformation possible.
International studies indicate that approximately 5% of CO2 of anthropogenic origin in the world comes from cement production (in Brazil this value corresponds to 1.4% according to the 2nd National Inventory of Greenhouse Gases). On the other hand, the forecast for demand for cement, principally in the emerging economies such as Brazil, is expected in the coming decades to have a substantial increase, making carbon management a question of priority for the sector.
MEIO AMBIENTETHE ENVIRONMENT
Meta definida / Target set
RJSP
PB

11
O BRASIL NA DISCUSSÃO CLIMÁTICA
BRAZIL AND THE CLIMATE DISCUSSION
O tema também tem ganhado força nos últimos anos no Brasil. No âmbito federal, foi aprovada em 2009 a Política Nacional de Mudanças Climáticas, que estabeleceu compromisso de redução, voluntária, de 36% a 39% das emissões totais brasileiras projetadas para 2020.
A regulamentação desta Política, em 2011, estabeleceu diversos Planos Setoriais, dentre eles o Plano Indústria, com o objetivo de definir diretrizes para a participação do setor industrial na referida política, tendo como meta a redução de 5% das emissões de CO² de todo o setor industrial previstas para 2020.
Foram incluídos neste Plano Indústria os 7 principais setores industriais emissores de gases de efeito estufa: Cimento; Alumínio; Química; Papel e Celulose; Siderurgia; Vidro; Cal.
Com o objetivo de implementar, monitorar e revisar o Plano Indústria, foi criada em 2012 a Comissão Técnica do Plano Indústria, de caráter permanente e cunho técnico-consultivo, composta por representantes do Governo, associações de indústria e academia. O setor de cimento, através do SNIC e ABCP, integra esta comissão, acompanhando de perto todas as movimentações a respeito do assunto.
Nas esferas estaduais, a discussão climática também tem se capilarizado rápida e intensamente. O Governo de São Paulo, por exemplo, sancionou em 2009 sua própria Política Estadual de Mudanças Climáticas, indo além da Política Nacional e estabelecendo meta de redução de 20% das emissões totais do Estado em 2020, com relação a 2005.
O Estado do Rio de Janeiro, da mesma forma, na sua Política Estadual de Mudança do Clima, definiu uma meta geral de redução na sua intensidade de carbono, isto é, as toneladas de CO² por PIB gerado, até 2030, em relação também a 2005, estabelecendo vários compromissos setoriais. Para o setor industrial, criou a obrigatoriedade de apresentação de um Plano de Mitigação de Emissões na ocasião do licenciamento ambiental.
Na Paraíba, a meta ficou igual à nacional, ou seja, redução entre 36 e 39% até 2020.
Conforme ilustra o mapa acima, 14 dos 26 Estados brasileiros já possuem uma Política Estadual de Mudanças Climáticas, sendo três com meta específica de redução (SP, RJ, PB).
The theme has also gained strength in recent years in Brazil. In the federal area, the National Policy for Climate Change was approved in 2009, establishing a commitment to reduce, voluntarily, total Brazilian emissions projected for 2020 by 36% to 39%.
The regulation of this policy, in 2011, established various Sectorial Plans, among which the Industrial Plan, with the objective of defining directives for the participation of the industrial sector in the policy mentioned above, with a target of reduction of 5% of the CO2 emissions for the whole industrial sector until 2020.
Included in this Industrial Plan were the seven main industrial sectors that emit greenhouse gases: Cement; Aluminum; Chemical; Paper and Pulp; Steel; Glass; Lime.
With the objective of implementing, monitoring and reviewing the Industry Plan, the Technical Commission for the Industry Plan was created in 2012, as a permanent technical-consultant body, composed of representatives of the Government, industrial and academic associations. The cement sector, through SNIC and ABCP, are members of this commission, following closely all movements in respect of the subject.
In the state spheres, the climate discussion has also spread rapidly and intensely. In 2009 the Government of São Paulo, for example, sanctioned its own State Policy of Climate Change, going beyond National Policy and establishing a target for reduction of 20% of the total emissions for São Paulo in 2020, in relation to 2005.
In the same way, the State of Rio de Janeiro, in its State Policy for Climate Change, defined a general target for reduction in its carbon intensity, that is, the tons of CO2 per GDP generated, up to 2030, also in relation to 2005, establishing various sectorial commitments. For the industrial sector, it created mandatory presentation of a Mitigation Plan for emission reduction on the occasion of environmental licensing.
In Paraíba, the target was the same as the national target, a reduction of 36 - 39% before 2020.
As the above map illustrates, 14 of the 26 Brazilian States already have a State Policy for Climate Change, three with a specific reduction target (SP, RJ, PB).

12
O GRANDE DESAFIO DA INDÚSTRIA DO CIMENTO
THE CEMENT INDUSTRY’S GREAT CHALLENGE
No caso particular da indústria do cimento brasileira, uma série de características do processo de produção e de medidas adotadas há muitos anos pelo setor posicionaram-no entre os mais eficazes no controle de suas emissões, apresentando os menores níveis de CO² por tonelada de cimento produzida, conforme gráfico abaixo.
Essa condição, por sua vez, reduz o potencial de redução das emissões do setor, em virtude do grau de excelência já alcançado, como já anteviu o gráfico da Agência Internacio-nal de Energia abaixo. Isso, no entanto, representa uma motivação adicional para a indústria do cimento nacional na busca por alternativas que possibilitem intensificar ainda mais a redução das emissões do setor.
Tal posição favorável com relação às suas emissões de gases de efeito estufa, aliada à retomada de produção do setor obser-vada a partir de 2005, bem como à expectativa de manuten ção desse crescimento para os próximos anos, criam um enorme desafio para a indústria do cimento brasileira: atender à crescente demanda por cimento no país, para a construção da infraestrutura necessária ao seu desenvolvimento, mantendo as suas já baixas emissões específicas de CO², que a colocaram como a mais eficiente do mundo.
Emissão média de CO² por Tonelada de Cimento CO² emissions per tonne of cement
Fonte / Source: WBCSD – CSI
1000
800
600
400
200
0 Am. do NorteNorth Am.
Or. MédioMiddle East
Japão, Aus, NZJapan, Aus, NZ
ChinaChina
ÍndiaIndia
Am. do SulSouth Am.
CEICIS
Ásia (ex. China, Índia, CEI e Japão)
Asia (ex. China, India, CIS & Japan)
ÁfricaAfrica
Am. CentralCentral Am.
EuropaEurope
BrasilBrazil
1990 2000 2005 2010 2011
Potencial de redução de CO² em 2006 (Mt CO²/ano)CO² saving potential 2006 (Mt CO² /yr)*
EUAUSA
KoréiaKorea
BrasilBrazil
ÍndiaIndia
EuropaEurope
JapãoJapan
OutrosOthers
MundoWorld
ChinaChina
Rússia Russia
CanadáCanada
600
500
400
300
200
100
0
0.6
0.5
0.4
0.3
0.2
0.1
0.0
Mt CO² /yr t CO² /t cimento
0.3 0.3 0.30.3
0.10.10.2
0.2 0.2 0.20.2
Fonte/Source: IEA- International Energy Agency, 2009
Forno de Alta Explosão / Blast Furnace Slag
Combustíveis Alternativos / Alternative Fuels
Cinzas / Fly Ash
Economia Combustível Fóssil / Fossil Fuel Savings
Economia de Eletricidade / Electricity Savings
Potencial de Redução Específico (tCO2/t cimento) / Specific Savings Potencial (tCO2 / t cement)
In the particular case of the Brazilian cement industry, a series of characteristics of the production process and the measures taken many years ago by the sector, positioned it among the most effective in the control of its emissions, showing lower levels of CO2 per ton of cement produced, as shown in the graph below.
This condition, in turn, reduces the potential for reduction of the sector’s emissions, in virtue of the degree of excellence already achieved, as is already shown in the International Agency for Energy graph below. This however represents an additional motivation for the national cement industry, in the search for alternatives that would make it possible to reduce even further the sector’s emissions.
This favorable position in relation to its emissions of greenhouse gases, allied to the increases in the sector’s production observed as of 2005, as well as the expectation of maintaining this growth in future years, creates an enormous challenge for the Brazilian cement industry: to satisfy the country’s growing demand for cement, for the construction of infrastructure necessary to its development, maintaining its already low specific emissions of CO2 , which made it the most efficient in the world.

13
UMA PERSPECTIVA FUTURA
A FUTURE PERSPECTIVE
Essa revolução climática no Brasil fez surgir uma demanda cada vez maior de estudos e projetos governamentais, acadêmicos ou do setor produtivo, correlacionados ao tema, na busca por uma economia de baixo carbono.
A indústria brasileira do cimento participa e acompanha atentamente todos estes esforços e, novamente, se antecipa a todas essas demandas iniciando uma discussão sobre um novo projeto, a elaboração de um mapeamento sobre as emissões do setor no Brasil, projetadas até 2050, e suas respectivas alternativas de redução.
Este trabalho será a versão brasileira do Cement Technology Roadmap, estudo global elaborado em 2009 pela International Energy Agency – IEA, em parceria com o World Business Council for Sustainable Development – WBCSD, primeiro no mundo a projetar um cenário de redução potencial de emissões de um setor específico em um horizonte até 2050. O projeto brasileiro também contará com a participação destas instituições, a exemplo do que foi feito recentemente na Índia.
This climate revolution in Brazil created an ever greater demand for studies and projects by the government, academics or the productive sector, related to the theme, in the search for a low carbon economy.
The Brazilian cement industry takes part in and closely ac companies all these efforts, and once again anticipates all these demands by initiating a discussion on a new project, the mapping of the sector’s emissions in Brazil, projected up to 2050, and its respective alternatives for reduction.
This task will be the Brazilian version of the Cement Technology Roadmap, a global study undertaken in 2009 by the International Energy Agency – IEA, in partnership with the World Business Council for Sustainable Development – WBCSD, first in the world to project a potential reduction scenario of emissions of a specific sector with a 2050 horizon. The Brazilian project will also have the help of these institutions, following the example of what was done recently in India.

14
Produção anual de cimento portland, segundo os tipos (em 1.000 toneladas)Portland cement annual production, by type (1.000 tonnes)
ANO / YEAR TIPOS DE CIMENTO / CEMENT TYPE SUBTOTAL AJUSTES*/ADJUSTMENTS* TOTAL
CP I CP II CP III CP IV CP V Branco / White
2007 1.034 29.848 7.842 3.876 3.254 115 45.969 582 46.551
2008 346 33.080 8.879 5.714 3.577 86 51.682 288 51.970
2009 84 34.662 7.967 5.097 3.377 - 51.187 560 51.747
2010 88 38.474 8.345 6.686 4.211 - 57.804 1.313 59.117
2011 103 38.659 9.347 8.247 4.973 - 61.329 2.764 64.093
2012 98 39.743 10.000 9.612 5.580 - 65.033 3.776 68.809
(*) Dados estimados. / Estimated data.
Cimento branco: produção e despacho (em 1.000 toneladas)White cement: production and sales (1.000 tonnes)
ANO PRODUÇÃO DESPACHO INTERNO / DOMESTIC SALES EXPORTAÇÃO ESTRUTURAL DESPACHO TOTAL YEAR PRODUCTION Estrutural Não-estrutural Total STRUCTURAL EXPORTS TOTAL SALES Structural Non-structural
2005 96 82 3 85 11 96
2006 93 84 4 88 5 93
2007 115 104 1 105 10 115
2008 86 82 - 82 4 86
NÚMEROSNUMBERS
Ajustes estatísticos – a exemplo dos Relatórios Anuais desde 2006, foi incluída a estimativa da oferta de cimento oriundo de empresas não associadas ao SNIC.
Statistic adjustments - As with the Annual Reports since 2006, e stimates of the cement supplied by companies not associated to the SNIC are included here.
PRO
DU
ÇÃO
E D
ESPA
CHO
PRO
DUCT
ION
AND
SALE
S
1515
PRO
DU
ÇÃO
E D
ESPA
CHO
PRO
DUCT
ION
AND
SALE
S
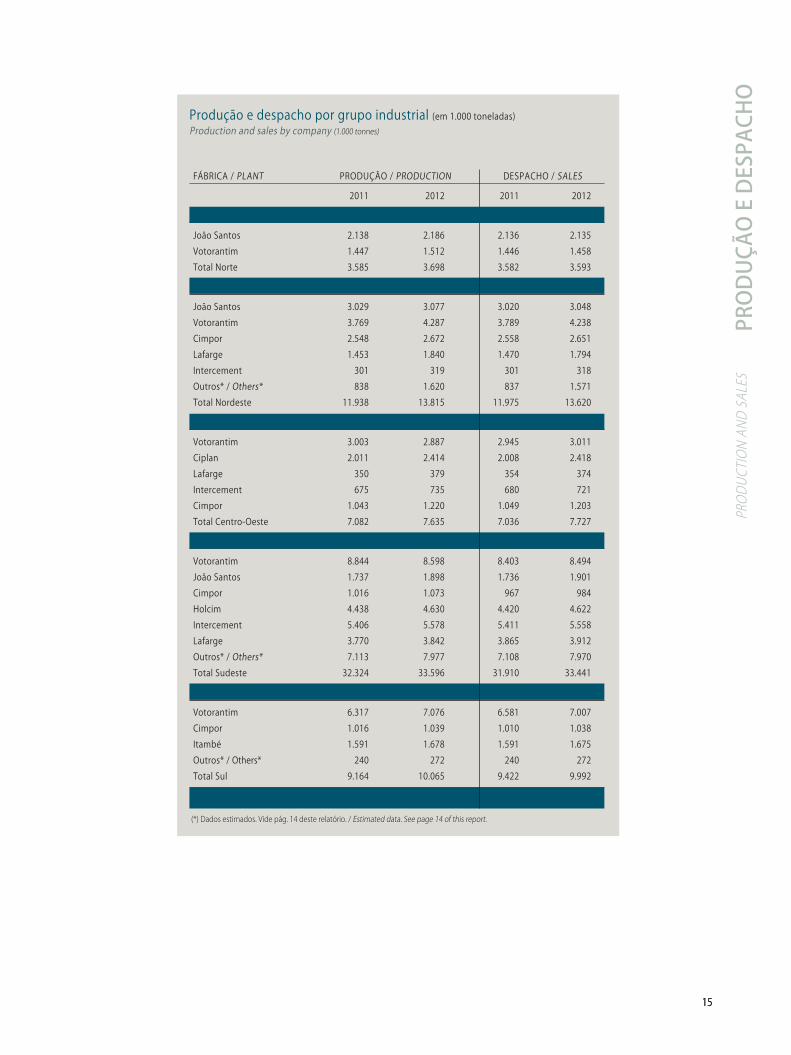
FÁBRICA / PLANT PRODUÇÃO / PRODUCTION DESPACHO / SALES
2011 2012 2011 2012
Região Norte / North
João Santos 2.138 2.186 2.136 2.135
Votorantim 1.447 1.512 1.446 1.458
Total Norte 3.585 3.698 3.582 3.593
Região Nordeste / Northeast
João Santos 3.029 3.077 3.020 3.048
Votorantim 3.769 4.287 3.789 4.238
Cimpor 2.548 2.672 2.558 2.651
Lafarge 1.453 1.840 1.470 1.794
Intercement 301 319 301 318
Outros* / Others* 838 1.620 837 1.571
Total Nordeste 11.938 13.815 11.975 13.620
Região Centro-Oeste / Middlewest
Votorantim 3.003 2.887 2.945 3.011
Ciplan 2.011 2.414 2.008 2.418
Lafarge 350 379 354 374
Intercement 675 735 680 721
Cimpor 1.043 1.220 1.049 1.203
Total Centro-Oeste 7.082 7.635 7.036 7.727
Região Sudeste / Southeast
Votorantim 8.844 8.598 8.403 8.494
João Santos 1.737 1.898 1.736 1.901
Cimpor 1.016 1.073 967 984
Holcim 4.438 4.630 4.420 4.622
Intercement 5.406 5.578 5.411 5.558
Lafarge 3.770 3.842 3.865 3.912
Outros* / Others* 7.113 7.977 7.108 7.970
Total Sudeste 32.324 33.596 31.910 33.441
Região Sul / South
Votorantim 6.317 7.076 6.581 7.007
Cimpor 1.016 1.039 1.010 1.038
Itambé 1.591 1.678 1.591 1.675
Outros* / Others* 240 272 240 272
Total Sul 9.164 10.065 9.422 9.992
Total Brasil 64.093 68.809 63.925 68.373
(*) Dados estimados. Vide pág. 14 deste relatório. / Estimated data. See page 14 of this report.
Produção e despacho por grupo industrial (em 1.000 toneladas)Production and sales by company (1.000 tonnes)

1616
PRO
DU
ÇÃO
E D
ESPA
CHO
PRO
DUCT
ION
AND
SALE
S
2003
17%
3% 10%
2008 2012
19%
15%
4%11%
15%
5% 11%20%
Participação regional na produção de cimentoRegional share in cement production
51% 51%
19%
49%
Norte / North Nordeste / Northeast Sudeste / Southeast Sul / South Centro-Oeste / Middlewest
Produção anual de cimento portland, segundo estados e regiões (em 1.000 toneladas)Portland cement annual production, by state and region (1.000 tonnes)
ESTADOS / REGIÕES 2003 2004 2005 2006 2007 2008 2009 2010 2011 2012STATE / REGION
Rondônia - - - - - - 111 576 696 713
Amazonas 603 628 627 634 683 776 654 725 813 785
Pará 561 621 720 821 935 1.315 1.204 1.502 1.553 1.636
Tocantins - - - - - - 131 470 523 564
Região Norte / North 1.164 1.249 1.347 1.455 1.618 2.091 1.969 3.273 3.585 3.698
Maranhão 254 302 308 316 336 358 358 384 425 883
Piauí 304 284 413 344 411 501 588 627 609 655
Ceará 1.230 1.324 1.443 1.480 1.628 1.714 1.767 1.863 1.985 2.136
Rio Grande do Norte 330 334 365 378 438 450 461 463 658 1.293
Paraíba 1.364 1.477 1.609 1.811 1.919 2.073 1.844 2.162 2.025 2.462
Pernambuco 397 409 512 547 677 781 821 848 1.079 1.257
Alagoas 358 375 437 458 532 556 409 674 706 703
Sergipe 1.771 1.975 2.068 2.366 2.763 2.841 2.691 3.031 3.181 3.080
Bahia 479 469 555 599 695 814 1.021 1.179 1.270 1.346
Região Nordeste / Northeast 6.487 6.949 7.710 8.299 9.399 10.088 9.960 11.231 11.938 13.815
Mato Grosso do Sul 618 653 653 670 746 878 872 890 973 1.031
Mato Grosso 624 602 637 642 819 875 949 997 1.177 1.123
Goiás 647 716 789 766 832 1.052 1.149 1.324 1.392 1.599
Distrito Federal 1.646 2.091 2.322 2.492 2.824 2.660 2.690 3.159 3.540 3.882
Região Centro-Oeste / Middlewest 3.535 4.062 4.401 4.570 5.221 5.465 5.660 6.370 7.082 7.635
Minas Gerais 8.253 8.186 9.454 10.188 11.368 12.654 12.979 14.162 15.240 16.465
Espírito Santo 1.833 1.753 1.664 1.711 1.921 2.344 2.099 2.370 2.546 2.616
Rio de Janeiro 2.402 2.382 2.358 2.618 2.794 3.129 3.160 4.174 4.974 5.087
São Paulo 5.386 5.327 5.837 7.194 7.454 8.180 7.913 9.035 9.564 9.428
Região Sudeste / Southeast 17.874 17.648 19.313 21.711 23.537 26.307 26.151 29.741 32.324 33.596
Paraná 3.944 4.059 4.018 3.923 4.548 5.313 5.332 5.685 5.746 5.589
Santa Catarina 263 229 209 222 282 406 364 455 988 1.979
Rio Grande do Sul 1.683 1.575 1.473 1.511 1.661 2.034 1.940 2.122 2.190 2.225
Ajustes* / Adjustments* 92 126 138 111 170 180 240 240 240 272
Região Sul / South 5.982 5.989 5.838 5.767 6.661 7.933 7.876 8.502 9.164 10.065
Sub-Total Brasil 35.042 35.897 38.609 41.802 46.436 51.884 51.616 59.117 64.093 68.809
Cimento Branco / White Cement 80 87 96 93 115 86 - - - -
Total Brasil 35.122 35.984 38.705 41.895 46.551 51.970 51.616 59.117 64.093 68.809
(*) Dados estimados. Vide pág. 14 deste relatório. / Estimated data. See page 14 of this report.

1717
PRO
DU
ÇÃO
E D
ESPA
CHO
PRO
DUCT
ION
AND
SALE
S
Despacho anual de cimento portland, segundo estados e regiões (em 1.000 toneladas)Portland cement annual sales, by state and region (1.000 tonnes)
Despacho Brasil (em 1.000 toneladas)Brazilian sales (1.000 tonnes)
2003 2004 2005 2006 2007 2008 2009 2010 2011 2012
70.000
60.000
50.000
40.000
30.000
20.000
ESTADOS / REGIÕES 2003 2004 2005 2006 2007 2008 2009 2010 2011 2012STATE / REGION
Rondônia - - - - - - 105 660 725 673
Amazonas 603 628 629 646 680 782 646 725 810 779
Pará 556 610 718 832 912 1.315 1.212 1.524 1.546 1.588
Tocantins - - - - - - 119 379 501 553
Região Norte / North 1.159 1.238 1.347 1.478 1.592 2.097 2.082 3.288 3.582 3.593
Maranhão 252 305 308 314 336 362 356 384 426 869
Piauí 298 287 416 346 410 502 588 632 601 649
Ceará 1.218 1.341 1.412 1.486 1.706 1.728 1.780 2.064 2.085 2.123
Rio Grande do Norte 327 335 368 374 438 456 458 468 654 1.240
Paraíba 1.283 1.401 1.577 1.775 1.768 2.098 1.930 2.232 2.048 2.412
Pernambuco 399 406 517 546 678 785 824 848 1.074 1.250
Alagoas 351 379 432 462 537 552 413 674 705 703
Sergipe 1.821 2.027 2.044 2.381 2.685 2.610 2.546 2.802 3.108 3.044
Bahia 509 477 549 601 693 815 1.026 1.177 1.274 1.330
Região Nordeste / Northeast 6.458 6.958 7.623 8.285 9.251 9.908 9.921 11.281 11.975 13.620
Mato Grosso do Sul 613 654 652 676 744 867 868 884 972 1.017
Mato Grosso 626 605 637 640 758 957 958 963 1.151 1.248
Goiás 663 717 788 766 830 1.034 1.137 1.233 1.403 1.578
Distrito Federal 1.630 2.110 2.303 2.487 2.876 2.637 2.656 3.188 3.510 3.884
Região Centro-Oeste / Middlewest 3.532 4.086 4.380 4.569 5.208 5.495 5.619 6.268 7.036 7.727
Minas Gerais 8.284 8.116 9.234 10.172 11.152 12.695 12.637 14.023 15.223 16.141
Espírito Santo 1.825 1.773 1.667 1.694 1.917 2.352 2.095 2.360 2.534 2.616
Rio de Janeiro 2.417 2.418 2.362 2.659 2.821 3.084 3.285 4.283 4.986 5.202
São Paulo 5.487 5.439 5.964 7.386 7.557 8.228 8.002 8.901 9.167 9.482
Região Sudeste / Southeast 18.013 17.746 19.227 21.911 23.447 26.359 26.019 29.567 31.910 33.441
Paraná 3.822 3.977 3.869 3.684 4.368 5.260 5.339 5.858 6.050 5.607
Santa Catarina 261 226 212 224 261 415 376 452 906 1.909
Rio Grande do Sul 1.675 1.602 1.484 1.516 1.617 2.008 1.951 2.237 2.226 2.204
Ajustes* / Adjustments* 92 126 138 111 170 180 240 240 240 272
Região Sul / South 5.850 5.931 5.703 5.535 6.416 7.863 7.906 8.787 9.422 9.992
Sub-Total Brasil 35.012 35.959 38.280 41.778 45.914 51.722 51.547 59.191 63.925 68.373
Cimento Branco / White Cement 80 87 96 93 115 86 - - - -
Total Brasil 35.092 36.046 38.376 41.871 46.029 51.808 51.547 59.191 63.925 68.373
(*) Dados estimados. Vide pág. 14 deste relatório. / Estimated data. See page 14 of this report.

1818
PRO
DU
ÇÃO
E D
ESPA
CHO
PRO
DUCT
ION
AND
SALE
S
Produção e despacho mensal de cimento portland (em 1.000 toneladas)Portland cement annual production and sales (1.000 tonnes)
CIMENTO BRANCOANO / YEAR PRODUÇÃO* / PRODUCTION* WHITE CEMENT TOTAL
jan fev mar abr mai jun jul ago set out nov dez sub-total jan feb mar apr may jun jul aug sep oct nov dec
2008 3.991 3.707 4.057 3.956 4.238 4.386 4.666 4.828 4.638 4.854 4.449 4.114 51.884 86 51.970
2009 3.948 3.595 4.188 3.881 4.353 4.194 4.549 4.676 4.531 4.723 4.629 4.480 51.747 - 51.747
2010 4.231 4.138 4.899 4.532 5.001 4.836 5.194 5.394 5.306 5.367 5.135 5.084 59.117 - 59.117
2011 4.582 4.722 4.838 4.915 5.501 5.403 5.711 5.828 5.747 5.922 5.576 5.348 64.093 - 64.093
2012 5.024 5.214 5.926 5.513 5.923 5.507 5.993 6.257 5.998 6.066 5.782 5.606 68.809 - 68.809
CIMENTO BRANCOANO / YEAR DESPACHO* / SALES* WHITE CEMENT TOTAL
jan fev mar abr mai jun jul ago set out nov dez sub-total jan feb mar apr may jun jul aug sep oct nov dec
2008 4.043 3.710 3.813 4.258 4.206 4.316 4.876 4.631 4.722 4.860 4.293 3.994 51.722 86 51.808
2009 3.946 3.571 4.242 3.974 4.145 4.259 4.631 4.610 4.638 4.748 4.628 4.155 51.547 - 51.547
2010 4.324 4.172 5.101 4.549 4.874 4.853 5.198 5.449 5.362 5.253 5.204 4.852 59.191 - 59.191
2011 4.710 4.732 5.006 4.778 5.506 5.488 5.524 5.919 5.855 5.668 5.620 5.119 63.925 - 63.925
2012 5.245 5.201 5.996 5.324 5.996 5.371 5.969 6.488 5.693 6.210 5.821 5.059 68.373 - 68.373
(*) Incluídos ajustes / Adjustments included.
6.500
6.000
5.500
5.000
4.500
4.000
3.500
Produção 2011 / Production 2011 Produção 2012 / Production 2012 Despacho 2011 / Sales 2011 Despacho 2012 / Sales 2012
Jan Fev Mar Abr Mai Jun Jul Ago Set Out Nov Dez Jan Feb Mar Apr May Jun Jul Aug Sep Oct Nov Dec

1919
PRO
DU
ÇÃO
E D
ESPA
CHO
PRO
DUCT
ION
AND
SALE
S
Produção mensal de cimento portland, segundo estados e regiões em 2012 (em 1.000 toneladas)Monthly production of portland cement in 2012, by state and region (1.000 tonnes)
ESTADOS / REGIÕES jan fev mar abr mai jun jul ago set out nov dez Total
STATE / REGION jan feb mar apr may jun jul aug sep oct nov dec
Rondônia 53 51 40 46 61 65 67 76 64 63 67 60 713
Amazonas 67 65 67 44 73 57 74 67 68 66 61 76 785
Pará 147 128 134 123 129 126 142 148 133 147 137 142 1.636
Tocantins 47 46 49 54 54 48 36 38 48 50 44 50 564
Região Norte / North 314 290 290 267 317 296 319 329 313 326 309 328 3.698
Maranhão 64 63 60 63 65 67 70 86 86 85 87 87 883
Piauí 61 49 57 31 63 49 59 57 58 55 57 59 655
Ceará 117 168 186 153 179 176 192 189 186 202 192 196 2.136
Rio Grande do Norte 85 82 94 88 96 102 105 114 146 127 137 117 1.293
Paraíba 225 193 219 187 198 155 201 215 211 208 229 221 2.462
Pernambuco 105 101 127 126 116 88 94 98 108 103 98 93 1.257
Alagoas 59 55 70 57 63 61 63 54 52 54 58 57 703
Sergipe 245 236 281 258 269 260 230 216 238 283 281 283 3.080
Bahia 112 106 120 109 110 107 115 116 114 113 113 111 1.346
Região Nordeste / Northeast 1.073 1.053 1.214 1.072 1.159 1.065 1.129 1.145 1.199 1.230 1.252 1.224 13.815
Mato Grosso do Sul 66 84 92 86 95 76 89 94 90 88 86 85 1.031
Mato Grosso 86 84 98 91 93 94 100 106 84 96 97 94 1.123
Goiás 108 114 139 131 142 121 151 155 148 151 118 121 1.599
Distrito Federal 241 246 305 304 326 340 357 389 367 389 302 316 3.882
Região Centro-Oeste / Middlewest 501 528 634 612 656 631 697 744 689 724 603 616 7.635
Minas Gerais 1.164 1.230 1.413 1.394 1.448 1.341 1.452 1.532 1.414 1.456 1.352 1.269 16.465
Espírito Santo 203 205 251 230 213 221 233 209 222 218 199 212 2.616
Rio de Janeiro 377 366 442 389 423 415 482 483 452 456 408 394 5.087
São Paulo 649 735 835 753 812 702 825 920 848 811 784 754 9.428
Região Sudeste / Southeast 2.393 2.536 2.941 2.766 2.896 2.679 2.992 3.144 2.936 2.941 2.743 2.629 33.596
Paraná 427 467 476 441 485 449 484 486 476 472 469 457 5.589
Santa Catarina 127 150 161 154 182 167 159 186 184 178 183 148 1.979
Rio Grande do Sul 167 170 189 179 204 197 189 199 177 171 199 184 2.225
Ajustes* / Adjustments* 22 20 21 22 24 23 24 24 24 24 24 20 272
Região Sul / South 743 807 847 796 895 836 856 895 861 845 875 809 10.065
Total Brasil 5.024 5.214 5.926 5.513 5.923 5.507 5.993 6.257 5.998 6.066 5.782 5.606 68.809
(*) Dados estimados. Vide pág. 14 deste relatório. / Estimated data. See page 14 of this report.
2020
PRO
DU
ÇÃO
E D
ESPA
CHO
PRO
DUCT
ION
AND
SALE
S
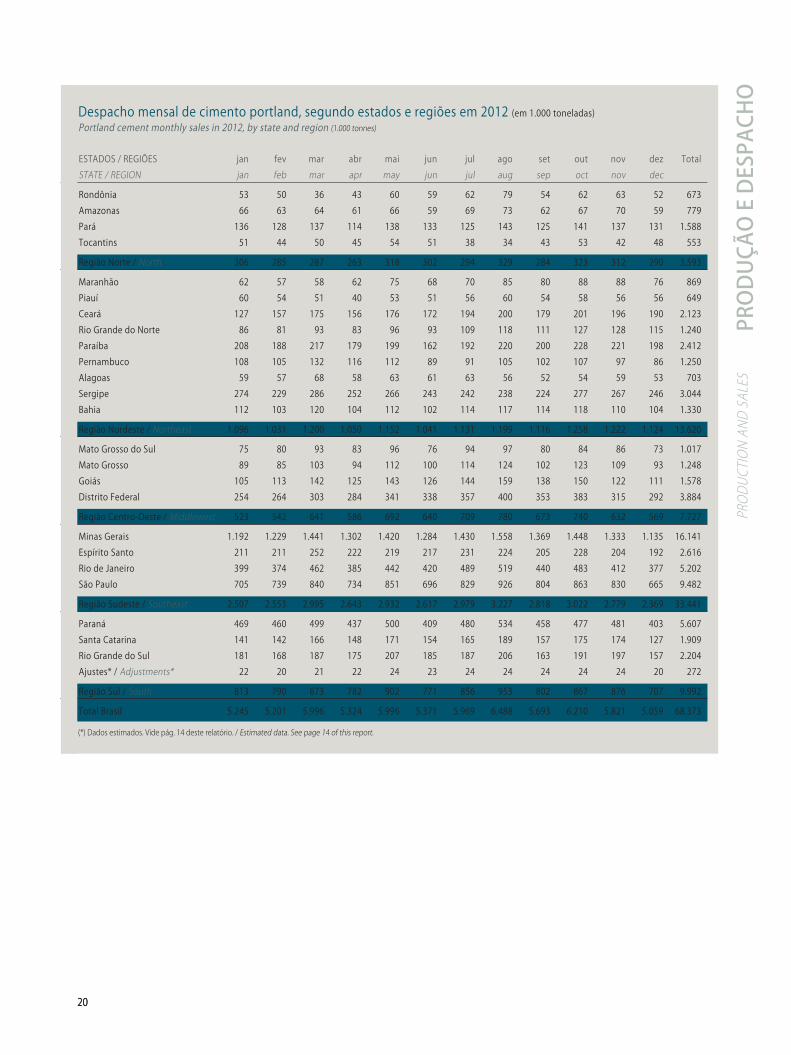
Despacho mensal de cimento portland, segundo estados e regiões em 2012 (em 1.000 toneladas)Portland cement monthly sales in 2012, by state and region (1.000 tonnes)
ESTADOS / REGIÕES jan fev mar abr mai jun jul ago set out nov dez Total
STATE / REGION jan feb mar apr may jun jul aug sep oct nov dec
Rondônia 53 50 36 43 60 59 62 79 54 62 63 52 673
Amazonas 66 63 64 61 66 59 69 73 62 67 70 59 779
Pará 136 128 137 114 138 133 125 143 125 141 137 131 1.588
Tocantins 51 44 50 45 54 51 38 34 43 53 42 48 553
Região Norte / North 306 285 287 263 318 302 294 329 284 323 312 290 3.593
Maranhão 62 57 58 62 75 68 70 85 80 88 88 76 869
Piauí 60 54 51 40 53 51 56 60 54 58 56 56 649
Ceará 127 157 175 156 176 172 194 200 179 201 196 190 2.123
Rio Grande do Norte 86 81 93 83 96 93 109 118 111 127 128 115 1.240
Paraíba 208 188 217 179 199 162 192 220 200 228 221 198 2.412
Pernambuco 108 105 132 116 112 89 91 105 102 107 97 86 1.250
Alagoas 59 57 68 58 63 61 63 56 52 54 59 53 703
Sergipe 274 229 286 252 266 243 242 238 224 277 267 246 3.044
Bahia 112 103 120 104 112 102 114 117 114 118 110 104 1.330
Região Nordeste / Northeast 1.096 1.031 1.200 1.050 1.152 1.041 1.131 1.199 1.116 1.258 1.222 1.124 13.620
Mato Grosso do Sul 75 80 93 83 96 76 94 97 80 84 86 73 1.017
Mato Grosso 89 85 103 94 112 100 114 124 102 123 109 93 1.248
Goiás 105 113 142 125 143 126 144 159 138 150 122 111 1.578
Distrito Federal 254 264 303 284 341 338 357 400 353 383 315 292 3.884
Região Centro-Oeste / Middlewest 523 542 641 586 692 640 709 780 673 740 632 569 7.727
Minas Gerais 1.192 1.229 1.441 1.302 1.420 1.284 1.430 1.558 1.369 1.448 1.333 1.135 16.141
Espírito Santo 211 211 252 222 219 217 231 224 205 228 204 192 2.616
Rio de Janeiro 399 374 462 385 442 420 489 519 440 483 412 377 5.202
São Paulo 705 739 840 734 851 696 829 926 804 863 830 665 9.482
Região Sudeste / Southeast 2.507 2.553 2.995 2.643 2.932 2.617 2.979 3.227 2.818 3.022 2.779 2.369 33.441
Paraná 469 460 499 437 500 409 480 534 458 477 481 403 5.607
Santa Catarina 141 142 166 148 171 154 165 189 157 175 174 127 1.909
Rio Grande do Sul 181 168 187 175 207 185 187 206 163 191 197 157 2.204
Ajustes* / Adjustments* 22 20 21 22 24 23 24 24 24 24 24 20 272
Região Sul / South 813 790 873 782 902 771 856 953 802 867 876 707 9.992
Total Brasil 5.245 5.201 5.996 5.324 5.996 5.371 5.969 6.488 5.693 6.210 5.821 5.059 68.373
(*) Dados estimados. Vide pág. 14 deste relatório. / Estimated data. See page 14 of this report.

2121
PRO
DU
ÇÃO
E D
ESPA
CHO
PRO
DUCT
ION
AND
SALE
S
Despacho por meio de transporte Sales by type of carrier
1% 3%
Rodoviário / Truck
Ferroviário / Rail
Hidroviário / Barge or boat
96%
Despacho por forma de apresentaçãoSales by kind of package
33%
67%
Ensacado / Bagged
Granel / Bulk
Despacho por canal de distribuiçãoCement sales by intermediate cement destination
13%0%11%
55%
21%
Revendedor / Retail sales
Concreteiras / Ready-mixed
Outros cons. ind. / Other prod. manufacturers
Consumidor final / Final consumer
Exportação / Exports
A) POR MEIO DE TRANSPORTE / BY TYPE OF CARRIER
REGIÃO RODOVIÁRIO FERROVIÁRIO HIDROVIÁRIO TOTALREGION TRUCK RAIL BARGE OR BOAT
Norte / North 2.993 - 600 3.593
Nordeste / Northeast 13.161 - - 13.161
Centro-Oeste / Middlewest 7.727 - - 7.727
Sudeste / Southeast 28.432 1.964 - 30.396
Sul / South 9.720 - - 9.720
Sub-Total 62.033 1.964 600 64.597
Ajustes* / Adjustments* 3.776
Total 68.373
(*) Dados estimados. Vide pág. 14 deste relatório. / Estimated data. See page 14 of this report.
B) POR FORMA DE APRESENTAÇÃO / BY KIND OF PACKAGE
REGIÃO / REGION ENSACADO / BAGGED GRANEL / BULK TOTAL
Norte / North 2.653 940 3.593
Nordeste / Northeast 10.319 2.842 13.161
Centro-Oeste / Middlewest 5.629 2.098 7.727
Sudeste / Southeast 19.367 11.029 30.396
Sul / South 5.583 4.137 9.720
Sub -Total 43.551 21.046 64.597
Ajustes * / Adjustments* 3.776
Total 68.373
(*) Dados estimados. Vide pág. 14 deste relatório. / Estimated data. See page 14 of this report.
C) POR CANAL DE DISTRIBUIÇÃO / BY INTERMEDIATE CEMENT DESTINATION
REGIÃO REVENDEDOR CONSUM. INDUSTRIAIS CONSUM. FINAL EXPORTAÇÃO TOTALREGION RETAIL SALES CONCRETE PRODUCT MANUFACTURERS FINAL CONSUMER EXPORTS
Concreteiras Outros Ready-mixed Concrete Other
Norte / North 2.023 174 277 1.119 - 3.593
Nordeste / Northeast 8.441 1.556 802 2.362 - 13.161
C. Oeste / Middlewest 4.498 1.310 574 1.325 20 7.727
Sudeste / Southeast 15.764 7.882 3.921 2.826 3 30.396
Sul / South 4.527 2.520 1.764 906 3 9.720
Sub-Total 35.253 13.442 7.338 8.538 26 64.597
Ajustes* / Adjustments* 3.776
Total 68.373
(*) Dados estimados. Vide pág. 14 deste relatório. / Estimated data. See page 14 of this report.
22
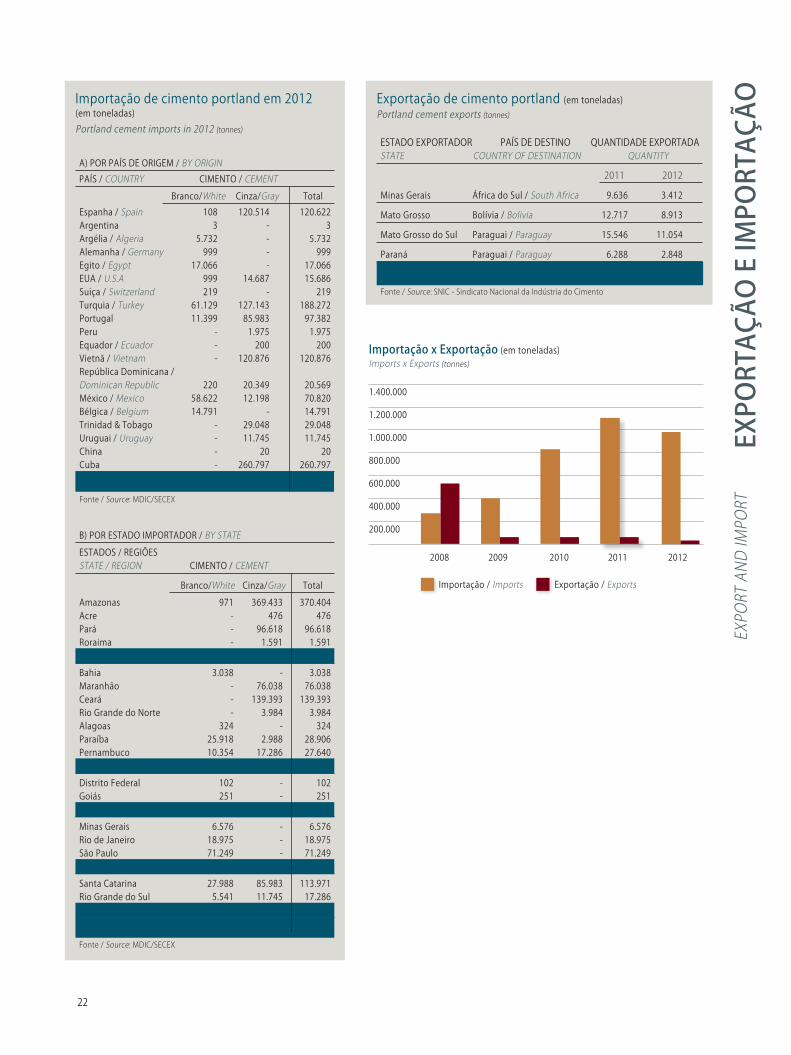
A) POR PAÍS DE ORIGEM / BY ORIGIN
PAÍS / COUNTRY CIMENTO / CEMENT
Branco/White Cinza/Gray Total
Espanha / Spain 108 120.514 120.622Argentina 3 - 3Argélia / Algeria 5.732 - 5.732Alemanha / Germany 999 - 999Egito / Egypt 17.066 - 17.066EUA / U.S.A 999 14.687 15.686Suiça / Switzerland 219 - 219Turquia / Turkey 61.129 127.143 188.272Portugal 11.399 85.983 97.382Peru - 1.975 1.975Equador / Ecuador - 200 200Vietnã / Vietnam - 120.876 120.876 República Dominicana /
Dominican Republic 220 20.349 20.569México / Mexico 58.622 12.198 70.820Bélgica / Belgium 14.791 - 14.791Trinidad & Tobago - 29.048 29.048Uruguai / Uruguay - 11.745 11.745China - 20 20Cuba - 260.797 260.797
Total 171.287 805.535 976.822
Fonte / Source: MDIC/SECEX
B) POR ESTADO IMPORTADOR / BY STATE
ESTADOS / REGIÕES STATE / REGION CIMENTO / CEMENT
Branco/White Cinza/Gray Total
Amazonas 971 369.433 370.404Acre - 476 476Pará - 96.618 96.618Roraima - 1.591 1.591Região Norte / North 971 468.118 469.089
Bahia 3.038 - 3.038Maranhão - 76.038 76.038Ceará - 139.393 139.393Rio Grande do Norte - 3.984 3.984Alagoas 324 - 324Paraíba 25.918 2.988 28.906Pernambuco 10.354 17.286 27.640Região Nordeste / Northeast 39.634 239.689 279.323
Distrito Federal 102 - 102Goiás 251 - 251Região C. Oeste / Middlewest 353 - 353
Minas Gerais 6.576 - 6.576Rio de Janeiro 18.975 - 18.975São Paulo 71.249 - 71.249Região Sudeste / Southeast 96.800 - 96.800
Santa Catarina 27.988 85.983 113.971Rio Grande do Sul 5.541 11.745 17.286Região Sul / South 33.529 97.728 131.257
Total 171.287 805.535 976.822
Fonte / Source: MDIC/SECEX
Importação de cimento portland em 2012 (em toneladas)
Portland cement imports in 2012 (tonnes)
Importação / Imports Exportação / Exports
Importação x Exportação (em toneladas)Imports x Exports (tonnes)
1.400.000
1.200.000
1.000.000
800.000
600.000
400.000
200.000
2008 2009 2010 2011 2012
ESTADO EXPORTADOR PAÍS DE DESTINO QUANTIDADE EXPORTADASTATE COUNTRY OF DESTINATION QUANTITY
2011 2012
Minas Gerais África do Sul / South Africa 9.636 3.412
Mato Grosso Bolívia / Bolivia 12.717 8.913
Mato Grosso do Sul Paraguai / Paraguay 15.546 11.054
Paraná Paraguai / Paraguay 6.288 2.848
Total 44.187 26.227
Fonte / Source: SNIC - Sindicato Nacional da Indústria do Cimento
Exportação de cimento portland (em toneladas)Portland cement exports (tonnes)
EXPO
RTAÇ
ÃO E
IMPO
RTAÇ
ÃOEX
PORT
AN
D IM
PORT

23
B) IMPORTAÇÃO, POR PAÍS DE ORIGEM / IMPORTS, BY COUNTRY OF ORIGIN
QUANTIDADE IMPORTADA / QUANTITY
2008 2009 2010 2011 2012
Argentina - - - 118 3Canadá / Canada 15.940 - - - -Colômbia / Colombia 1.984 1.282 23.061 541 -Equador / Ecuador - - - - 200Cuba 135.089 178.862 161.142 216.319 260.797EUA / U.S.A - 15.417 246 19 15.686México / Mexico 26.651 22.935 37.532 56.998 70.820Peru - - - 3.120 1.975República Dominicana / Dominican Republic 387 988 987 906 20.569Trinidad & Tobago - 3.109 27.019 36.685 29.048Uruguai / Uruguay 60.726 62.948 68.781 62.411 11.745Venezuela 3.711 14.324 18.265 4.550 -Américas / Americas 244.488 299.865 337.033 381.667 410.843
Alemanha / Germany - 319 - - 999 Bélgica / Belgium 2.919 9.558 18.784 15.393 14.791Croácia / Croacia - - - 18.204 -Espanha / Spain 1.253 540 432 15.358 120.622Portugal 3.891 20.808 49.146 186.298 97.382Suiça / Switzerland - 459 382 223 219Turquia / Turkey 18.297 31.937 99.344 239.790 188.272Europa / Europe 26.360 63.621 168.088 475.266 422.285
China - - 53.684 - 20Vietnã / Vietnam - - 260.349 197.812 120.876Ásia / Asia - - 314.033 197.812 120.896
Argélia / Algeria - 7.717 12.057 9.356 5.732Egito / Egypt 6.796 20.173 19.564 24.768 17.066Tunísia / Tunisia - - 2.535 2.175 -África / Africa 6.796 27.890 34.156 36.299 22.798
Total 277.644 391.376 853.310 1.091.044 976.822
Fonte / Source: MDIC/SECEX
A) EXPORTAÇÃO, POR PAÍS DE DESTINO / EXPORTS, BY COUNTRY OF DESTINATION
QUANTIDADE EXPORTADA / QUANTITY
2008 2009 2010 2011 2012
Antilhas Holandesas / Netherlands Antilles 19.740 - - - -
Bolívia / Bolivia 6.326 7.441 9.483 12.717 8.913
Colômbia / Colombia 7.818 - - - -
Paraguai / Paraguay 68.379 39.060 16.744 21.834 13.902
Américas / Americas 102.263 46.501 26.227 34.551 22.815
África do Sul / South Africa - - 5.498 9.636 3.412
Angola - - 4.313 - -
Camarões / Cameroon 80.402 - - - -
Gâmbia / Gambia 132.882 - - - -
Nigéria / Nigeria 18.993 - - - -
África / Africa 232.277 - 9.811 9.636 3.412
Áustria / Austria 85.102 - - - -
Holanda / Netherlands 91.960 - - - -
Europa / Europe 177.062 - - - -
Sub-total 511.602 46.501 36.038 44.187 26.227
Cimento Branco / White Cement 3.634 - - - -
Total 515.236 46.501 36.038 44.187 26.227
Fonte / Source: SNIC - Sindicato Nacional da Indústria do Cimento
Evolução das exportações e importações brasileiras de cimento (em toneladas)
Brazilian cement exports and imports (tonnes)
EXPO
RTAÇ
ÃO E
IMPO
RTAÇ
ÃOEX
PORT
AND
IMPO
RT

24
Consumo aparente de cimento portland no Brasil, total e per capita (em 1.000 toneladas)
Apparent consumption of portland cement in Brazil, total and per capita (1.000 tonnes)
ANO PRODUÇÃO* DESPACHO INTERNO* EXPORTAÇÃO IMPORTAÇÃO CONSUMO APARENTEYEAR PRODUCTION* DOMESTIC SALES* EXPORTS IMPORTS APPARENT CONSUMPTION Total Per capita (kg/hab)1950 1.386 1.386 - 404 1.790 341951 1.456 1.456 - 657 2.113 391952 1.619 1.619 - 820 2.439 441953 2.030 2.030 - 997 3.027 531954 2.441 2.440 - 338 2.778 471955 2.734 2.705 - 243 2.948 491956 3.278 3.250 3 32 3.282 531957 3.376 3.368 5 11 3.379 531958 3.769 3.789 4 1 3.790 571959 3.822 3.812 5 41 3.853 571960 4.447 4.447 3 2 4.449 631961 4.709 4.702 3 - 4.702 651962 5.072 5.033 3 2 5.035 681963 5.188 5.202 3 8 5.210 681964 5.583 5.557 - 29 5.586 711965 5.624 5.630 3 43 5.673 701966 6.046 6.032 3 93 6.125 741967 6.405 6.367 14 125 6.492 761968 7.281 7.249 7 585 7.834 891969 7.823 7.822 1 609 8.431 931970 9.002 8.994 - 334 9.328 1001971 9.803 9.768 - 279 10.047 1051972 11.381 11.345 - 245 11.590 1181973 13.398 13.238 123 235 13.473 1341974 14.920 14.860 113 243 15.103 1471975 16.737 16.648 46 235 16.883 1601976 19.147 19.049 51 338 19.387 1801977 21.123 20.910 28 261 21.171 1911978 23.203 23.026 127 180 23.206 2051979 24.874 24.775 182 101 24.876 2141980 27.193 26.885 204 26 26.911 2271981 26.051 25.951 164 7 25.958 2141982 25.644 25.449 7 21 25.470 2051983 20.870 20.858 19 3 20.861 1641984 19.497 19.309 91 2 19.311 1481985 20.635 20.547 151 2 20.549 1551986 25.257 25.223 72 6 25.229 1861987 25.468 25.284 72 22 25.306 1831988 25.329 25.281 47 46 25.327 1791989 25.920 25.769 65 64 25.833 1791990 25.848 25.916 54 64 25.980 1771991 27.490 27.335 49 8 27.343 1831992 23.903 23.993 60 110 24.103 1591993 24.843 24.811 58 113 24.924 1621994 25.230 25.046 40 274 25.320 1621995 28.256 28.063 59 451 28.514 1791996 34.597 34.505 99 420 34.925 2161997 38.096 37.921 152 517 38.438 2351998 39.942 39.705 162 437 40.142 2411999 40.234 40.045 122 155 40.200 2382000 39.901 39.550 186 160 39.710 2322001 39.453 38.778 127 134 38.912 2242002 38.927 38.728 106 145 38.873 2202003 35.122 34.661 431 223 34.884 1952004 35.984 35.481 565 253 35.734 1972005 38.705 37.443 933 223 37.666 2052006 41.895 40.825 1.046 202 41.027 2212007 46.551 44.785 1.244 277 45.062 2402008 51.970 51.293 515 278 51.571 2722009 51.747 51.501 46 391 51.892 2712010 59.117 59.155 36 853 60.008 3112011 64.093 63.881 44 1.091 64.972 3332012 68.809 68.347 26 977 69.324 353
(*) Incluídos os ajustes. / Adjustments included. Fontes / Sources: IMPORTAÇÃO/ Imports: MDIC/SECEX; - POPULAÇÃO/Population: IBGE.
CON
SUM
O A
PARE
NTE
APPA
REN
T CO
NSU
MPT
ION

CON
SUM
O A
PARE
NTE
APPA
REN
T CO
NSU
MPT
ION
25
ANO / YEAR CONSUMO DE CIMENTO PORTLAND / PORTLAND CEMENT CONSUMPTION
Nacional* / National* Importado / Imports Aparente / Apparent Per capita (kg/hab) / (kg/inhab)
Região Norte / North
2008 3.311 155 3.466 2292009 3.105 212 3.317 2162010 4.009 249 4.258 2742011 4.361 367 4.728 3002012 4.545 469 5.014 314
Nordeste / Northest
2008 9.380 7 9.387 1772009 10.096 12 10.108 1892010 11.949 368 12.317 2282011 12.680 480 13.160 2412012 14.328 279 14.607 266
Centro-Oeste / Middlewest
2008 5.031 - 5.031 3672009 5.018 - 5.018 3612010 5.737 1 5.738 4072011 6.306 1 6.307 4422012 6.713 1 6.714 465
Sudeste / Southest
2008 24.999 52 25.051 3122009 24.678 84 24.762 3062010 27.649 134 27.783 3402011 29.759 116 29.875 3632012 31.341 97 31.438 379
Sul / South
2008 8.490 64 8.554 3112009 8.604 83 8.687 3132010 9.811 101 9.912 3552011 10.775 127 10.902 3882012 11.420 131 11.551 408(*) Incluídos os ajustes. / Adjustments included.
Consumo aparente per capita 2012 (em kg/hab) Per capita apparent consumption 2012 (kg/inhab)
470
420
370
320
270
220
170
120
70
20
353
408
266
465
379
314
Consumo aparente de cimento portland nas regiões geográficas, total e per capita (em 1.000 toneladas)Apparent consumption of portland cement by region, total and per capita (1.000 tonnes)
Norte Nordeste C. Oeste Sudeste Sul Brasil North Northeast Middlewest Southest South Brazil

26
CON
SUM
O A
PARE
NTE
APPA
REN
T CO
NSU
MPT
ION
Consumo aparente anual de cimento portland, segundo estados e regiões (em 1.000 toneladas)Apparent consumption of portland cement by state and region (1.000 tonnes)
Participação regional no consumo aparente de cimentoRegional share in portland cement apparent consumption
2003
9%
18% 6%
2008 2012
16%
10%
18%
7%16%
48 %10%
21%
7%17%
45%49%51%
Norte / North Nordeste / Northeast Sudeste / Southeast Sul / South Centro-Oeste / Middlewest
ESTADOS / REGIÕES 2003 2004 2005 2006 2007 2008 2009 2010 2011 2012STATE / REGION
Rondônia 185 209 234 272 351 391 452 921 1.022 933Acre 44 58 81 114 122 119 121 175 178 173Amazonas 570 587 613 626 667 769 744 796 948 995Roraima 78 40 30 34 36 60 63 86 103 100Pará 1.052 1.193 1.265 1.182 1.273 1.560 1.356 1.641 1.856 2.043Amapá 85 80 104 116 135 116 113 152 162 261Tocantins 240 398 431 312 427 451 468 487 459 509
Região Norte / North 2.254 2.565 2.758 2.656 3.011 3.466 3.317 4.258 4.728 5.014
Maranhão 471 531 579 694 817 963 1.124 1.379 1.282 1.529Piauí 239 277 273 333 386 449 537 640 625 688Ceará 890 917 986 1.055 1.174 1.329 1.437 1.794 1.718 1.904Rio Grande do Norte 408 405 450 527 602 706 694 850 837 961Paraíba 393 354 365 431 523 708 735 834 946 1.103Pernambuco 1.014 951 980 1.193 1.321 1.717 1.879 2.407 2.496 2.728Alagoas 316 305 307 318 364 446 471 584 743 845Sergipe 245 222 222 270 319 391 405 480 579 646Bahia 1.658 1.733 1.668 1.935 2.319 2.678 2.826 3.349 3.616 3.744Ajustes* / Adjustments* - 90 152 291 184 - - - 318 459
Região Nordeste / Northeast 5.634 5.785 5.982 7.047 8.009 9.387 10.108 12.317 13.160 14.607
Mato Grosso do Sul 424 466 479 516 633 815 693 813 923 1.009Mato Grosso 668 717 737 702 841 995 998 1.099 1.204 1.382Goiás 1.312 1.515 1.717 1.730 1.944 2.311 2.336 2.658 2.902 3.061Distrito Federal 636 771 856 747 808 910 991 1.168 1.278 1.262
Região Centro-Oeste / Middlewest 3.040 3.469 3.789 3.695 4.226 5.031 5.018 5.738 6.307 6.714
Minas Gerais 3.664 3.453 4.105 5.076 5.710 5.902 6.032 6.751 7.135 7.144Espírito Santo 635 637 768 673 985 1.264 1.139 1.224 1.272 1.355Rio de Janeiro 3.024 3.092 3.324 3.666 4.100 4.301 3.967 4.200 4.390 4.734São Paulo 9.528 9.148 9.725 10.865 11.769 13.476 13.304 14.535 14.872 15.160Ajustes* / Adjustments* 940 1.268 976 969 228 108 320 1.073 2.206 3.045
Região Sudeste / Southeast 17.791 17.598 18.898 21.249 22.792 25.051 24.762 27.783 29.875 31.438
Paraná 2.173 2.260 2.226 2.204 2.381 3.001 3.092 3.749 4.175 4.523Santa Catarina 1.688 1.740 1.825 1.870 2.087 2.654 2.669 2.853 3.088 3.268Rio Grande do Sul 2.145 2.117 1.965 2.107 2.281 2.719 2.686 3.070 3.399 3.488Ajustes* / Adjustments* 92 126 138 111 170 180 240 240 240 272
Região Sul / South 6.098 6.243 6.154 6.292 6.919 8.554 8.687 9.912 10.902 11.551
Sub-Total Brasil 34.817 35.660 37.581 40.939 44.957 51.489 51.892 60.008 64.972 69.324
Cimento Branco / White Cement 66 67 74 85 88 105 82 - - -
Total Brasil 34.883 35.727 37.655 41.024 45.045 51.594 51.974 60.008 64.972 69.324
(*) Dados estimados. Vide pág. 14 deste relatório. / Estimated data. See page 14 of this report.

CON
SUM
O A
PARE
NTE
APPA
REN
T CO
NSU
MPT
ION
27
Consumo aparente mensal de cimento portland segundo estados e regiões, em 2012 (em 1.000 toneladas)Monthly apparent consumption of portland cement by state and region in 2012 (1.000 tonnes)
ESTADOS / REGIÕES jan fev mar abr mai jun jul ago set out nov dez Total
STATE / REGION jan feb mar apr may jun jul aug sep oct nov dec
Rondônia 77 71 60 59 83 79 87 104 77 82 85 69 933Acre 10 10 10 15 14 14 16 17 17 19 19 12 173Amazonas 82 78 82 61 97 70 98 85 96 87 80 79 995Roraima 10 10 9 8 10 8 7 10 7 7 7 7 100Pará 160 146 167 141 171 173 183 183 183 168 199 169 2.043Amapá 16 17 15 19 17 18 29 25 29 30 22 24 261Tocantins 38 33 42 38 46 46 46 51 44 44 42 39 509
Região Norte / North 393 365 385 341 438 408 466 475 453 437 454 399 5.014
Maranhão 112 102 120 88 116 136 130 143 127 164 140 151 1.529Piauí 49 56 54 45 58 56 59 62 58 69 62 60 688Ceará 142 143 161 117 164 152 180 158 148 203 173 163 1.904Rio Grande do Norte 77 72 85 71 78 71 84 95 80 85 85 78 961Paraíba 88 84 102 87 93 80 90 106 91 98 100 84 1.103Pernambuco 223 202 259 228 244 200 214 242 214 244 238 220 2.728Alagoas 73 71 89 74 76 61 61 64 64 73 74 65 845Sergipe 54 55 61 59 60 55 50 49 50 54 51 48 646Bahia 323 281 347 302 317 291 304 328 304 345 313 289 3.744Ajustes* / Adjustments* 41 34 39 39 38 34 37 36 38 39 42 42 459
Região Nordeste / Northeast 1.182 1.100 1.317 1.110 1.244 1.136 1.209 1.283 1.174 1.374 1.278 1.200 14.607
Mato Grosso do Sul 73 76 86 77 92 75 95 102 85 88 87 73 1.009Mato Grosso 95 92 109 106 126 109 118 139 121 144 116 107 1.382Goiás 201 214 261 240 276 263 285 304 257 298 241 221 3.061Distrito Federal 86 101 111 94 113 106 121 124 116 115 94 81 1.262
Região Centro-Oeste / Middlewest 455 483 567 517 607 553 619 669 579 645 538 482 6.714
Minas Gerais 523 538 630 566 623 587 634 682 614 650 570 527 7.144Espírito Santo 110 109 125 110 100 112 119 114 109 128 114 105 1.355Rio de Janeiro 359 341 413 355 419 385 436 459 393 434 392 348 4.734São Paulo 1.134 1.196 1.396 1.200 1.340 1.122 1.336 1.492 1.272 1.343 1.293 1.036 15.160Ajustes* / Adjustments* 221 206 248 256 269 265 283 292 267 286 246 206 3.045
Região Sudeste / Southeast 2.347 2.390 2.812 2.487 2.751 2.471 2.808 3.039 2.655 2.841 2.615 2.222 31.438
Paraná 357 354 399 349 403 319 394 445 379 397 396 331 4.523Santa Catarina 255 263 291 246 299 256 273 308 265 304 277 231 3.268Rio Grande do Sul 294 272 300 281 324 292 289 326 252 298 313 247 3.488Ajustes* / Adjustments* 22 20 21 22 24 23 24 24 24 24 24 20 272
Região Sul / South 928 909 1.011 898 1.050 890 980 1.103 920 1.023 1.010 829 11.551
Total Brasil 5.305 5.247 6.092 5.353 6.090 5.458 6.082 6.569 5.781 6.320 5.895 5.132 69.324
(*) Dados estimados. Vide pág. 14 deste relatório. / Estimated data. See page 14 of this report.

28
CON
SUM
O A
PARE
NTE
APPA
REN
T CO
NSU
MPT
ION
CANAL DE DISTRIBUIÇÃO E DE CONSUMO QUANTIDADE CONSUMIDA NAS REGIÕES / REGIONAL CONSUMPTION
INTERMEDIATE DESTINATION Norte / North Nordeste/Northeast C. Oeste / Middlewest Sudeste / Southeast Sul / South Brasil / Brazil
1 - Revendedores / Retail Sales 2.743 9.063 3.679 14.483 5.285 35.253
2 - Consumidores Industriais /
Concrete Product Manufacturers 529 2.389 1.860 11.170 4.833 20.781
i - Concreteiras / Ready-Mixed Concrete 185 1.602 1.304 7.586 2.765 13.442
ii - Fibrocimento / Fiber Cement 98 132 155 527 533 1.445
iii - Pré-Moldados / Pre-Cast 159 284 74 953 126 1.596
iv - Artefatos / Cement Masonry Units 53 259 254 1.372 1.280 3.218
v - Argamassas / Mortar 34 112 73 732 129 1.080
3 - Consumidores Finais / Finals Consumers 1.273 2.417 1.174 2.643 1.030 8.537
i - Construtoras e Empreiteiras / Contractors 1.270 2.296 1.050 2.443 995 8.054
ii - Órgãos Públicos e Estatais / Government - 21 5 61 - 87
iii - Prefeituras / City Hall 3 100 119 139 35 396
4 - Importação / Imports 469 279 1 97 131 977
Sub-Total Brasil 5.014 14.148 6.714 28.393 11.279 65.548
Ajustes*/Adjustments* - 459 - 3.045 272 3.776
Total Brasil 69.324
(*) Dados estimados. Vide pág. 14 deste relatório. / Estimated data. See page 14 of this report.
Perfil da distribuição do cimento portland consumido segundo as regiões geográficas em 2012 (em 1.000 toneladas)Consumption of portland cement by intermediate cement destination in 2012 (1.000 tonnes)

CON
SUM
O A
PARE
NTE
APPA
REN
T CO
NSU
MPT
ION
29
Perfil da distribuição do cimento consumido no Brasil em 2012Consumption of portland cement by intermediate cement destination in Brazil in 2012
54%Revendedores
Retail Sales
12%ConstrutorasEmpreiteirasContractors
6%Outros industriaisOther manufacturers
5% ArtefatosCement Mansonry units
21%ConcreteirasReady-mixed
1% Importação
Imports
1%Outros finais
Other finals
REGIÕES / REGION DESPACHO* / SALES* EXPORTAÇÃO RECEBIDO DE IMPORTAÇÃO CONSUMO
Total P/ própria região P/ outras regiões OUTRAS REGIÕES APARENTE For own region For other region Exports Received from other region Imports Apparent comsumption (a)=b+c+d (b) (c) (d) (e) (f ) (g)=b+e+f
Norte / North 3.593 3.516 77 - 1.029 469 5.014
Nordeste / Northeast 13.620 13.347 273 - 981 279 14.607
Centro-Oeste / Middlewest 7.727 6.302 1.405 20 411 1 6.714
Sudeste / Southeast 33.441 31.037 2.401 3 304 97 31.438
Sul / South 9.992 9.957 32 3 1.463 131 11.551
Total Brasil 68.373 - - 26 - 977 69.324
(*) Dados estimados. Vide pág. 14 deste relatório. / Estimated data. See page 14 of this report.
Formação do consumo aparente regional em 2012 (em 1.000 toneladas)
Regional apparent consumption in 2012 (1.000 tonnes)

30
DAD
OS
INTE
RNAC
ION
AIS
INTE
RNAT
ION
AL D
ATA
CONTINENTE PRODUÇÃO CONSUMOCONTINENT PRODUCTION CONSUMPTION
Américas / Americas 258 254
Europa / Europe 368 360Ásia / Asia 2.830 2.786África / Africa 171 171
Oceania 11 12
Total Mundial / World Total 3.638 3.583
Fonte/Source: Cembureau
Participação dos continentes no consumo mundial de cimento Cement consumption - percent distribution by continent
11 %Europa / Europe
7%Américas / Americas
5%África / Africa
77 %Ásia / Asia
0%Oceania
Produção, exportação e percentual do comércio mundial do cimento (em milhões de toneladas)
Production, exports and percent of world cement commerce in the production (millions of tonnes)
2007 2008 2009 2010 2011
3.900
3.600
3.300
3.000
2.700
2.400
2.100
1.800
1.500
1.200
900
600
300
0
Produção / Production
Exportação / Exports
Percentual exportado / Percent of exports
ANO / YEAR PRODUÇÃO / PRODUCTION CONSUMO / CONSUMPTION EXPORTAÇÃO / EXPORTS IMPORTAÇÃO / IMPORTS
2007 2.798 2.779 184 1592008 2.841 2.824 172 1532009 3.033 3.005 153 1282010 3.345 3.294 165 1362011 3.638 3.583 175 147
Fontes/Sources: Cembureau Global Building Materials - Jefferies International Ltd. (ago. 12) The Global Cement Report 10th edition
Produção e consumo mundial de cimento em 2011(em milhões de toneladas)World production and consumption of cement in 2011(millions of tonnes)
Evolução da produção, consumo e comércio mundial do cimento (em milhões de toneladas)Production, consumption and world commerce of cement (millions of tonnes)
10%
9,0%
8,0%
7,0%
6,0%
5,0%
4,0%
6,6%
6,1%
5,0%
4,5% 4,8%
175184 172 153 150
3.638
2.798 2.841
3.033
3.344

31
PAÍSES / COUNTRY 2009 2010 2011
1. Turquia / Turkey 20,4 19,0 14,4
2. Tailândia / Thailand 14,4 14,2 11,2
3. China 15,6 16,6 10,6
4. Irã / Iran 5,5 5,3 10,1
5. Coréia do Sul / Rep. of Korea 4,6 5,8 9,9
6. Japão / Japan 11,0 10,0 9,8
7. Emirados Arábes Unidos / UAE 0,6 5,0 9,5
8. Paquistão / Pakistan 11,3 9,7 9,2
9. Alemanha / Germany 7,0 7,3 8,6
10. Vietnã / Vietnam 0,2 0,7 7,0
11. Taiwan 8,2 7,4 6,0
12. Índia / India 5,8 6,0 4,6
13. Grécia / Greece 3,9 4,1 4,3
14. Espanha / Spain 2,8 3,9 3,9
15. Canadá / Canada 3,0 2,9 3,8
Total Mundial / World Total 161,6 165,1 175,5
Obs.: Classificação pela exportação em 2011 /Classified by 2011 exports Incluída exportações de clinquer / Included clinker exports
Fontes/Sources: The Global Cement Report 10th Edition
PAÍSES / COUNTRY 2009 2010 2011
1. Iraque / Iraq 5,0 5,0 10,0
2. Bangladesh 9,5 12,5 7,9
3. Estados Unidos / U.S.A. 6,2 5,6 6,5
4. Afeganistão / Afghanistan 4,5 4,7 5,3
5. Singapura / Singapore 4,6 4,3 4,7
6. Nigéria / Nigeria 6,3 7,3 4,0
7. Sri Lanka 2,7 2,9 3,8
8. Myanmar 2,3 2,1 3,8
9. Gana / Ghana 2,6 2,9 3,5
10. França / France 3,1 2,0 3,5
11. Rússia / Russia 1,1 1,0 2,9
12. Malásia / Malaysia 2,0 1,9 2,6
13. Brasil / Brazil 0,4 1,5 2,6
14. Kuwait 2,5 2,0 2,5
15. Indonésia / Indonesia 1,4 1,4 2,5
Total Mundial / World Total 140,6 135,5 146,7
Obs.: Classificação pela importação em 2011 / Classified by 2011 imports Incluída importações de clinquer / Included clinker imports
Fontes/Sources: The Global Cement Report 10th Edition
PAÍSES / COUNTRY 2005 2006 2007 2008 2009 2010* 2011*
1. China 1.079,6 1.253,5 1.379,0 1.401,2 1.657,1 1.868,0 2.080,0
2. Índia / India 146,8 162,0 172,9 186,1 190,0 215,5 240,5
3. Estados Unidos / U.S.A. 99,4 98,2 95,5 86,5 64,0 64,9 67,9
4. Turquia / Turkey 45,6 49,0 50,8 53,4 57,6 62,0 67,8
5. Irã / Iran 32,7 35,3 40,0 44,4 48,8 61,3 66,4
6. Brasil** / Brazil** 39,2 42,4 47,2 52,3 52,1 59,2 64,1
7. Japão / Japan 72,7 73,2 71,4 67,6 59,6 54,0 56,4
8. Rússia / Russia 49,5 55,2 60,1 53,5 45,7 50,4 56,1
9. Vietnã / Vietnam 30,8 32,7 35,8 36,3 47,7 55,0 52,0
10. Arábia Saudita / Saudi Arabia 26,1 27,1 30,4 37,4 37,8 41,0 48,4
11. Coréia do Sul / Rep. of Korea 49,1 51,4 54,4 55,1 52,2 47,4 48,3
12. Egito / Egypt 38,9 39,2 40,1 40,1 46,9 48,2 45,4
13. Indonésia / Indonesia 36,1 38,1 39,9 41,8 39,7 39,5 45,2
14. México / Mexico 35,4 38,4 39,2 37,7 35,4 34,5 35,4
15. Alemanha / Germany 31,0 33,6 33,4 33,6 30,4 30,2 33,5
Total Mundial / World Total 2.344,8 2.608,0 2.797,7 2.841,5 3.033,0 3.345,0 3.638,0
(*) Dados preliminares / Preliminary data(**) Produção ajustada. Vide pág. 14 deste relatório. / Production adjusted. See page 14 of this report.Obs.: Classificação pela produção do ano 2011 / Classified by 2011 production Incluída na produção a exportação de clínquer / Included clinker exportsFontes / Sources: Cembureau SNIC – Sindicato Nacional da Indústria do Cimento Global Building Materials - Jefferies International Ltd. (fev. 12) The Global Cement Report 10th edition Canacem - México
Maiores exportadores de cimento(em milhões de toneladas)World leading exporter country (millions of tonnes)
Maiores importadores de cimento (em milhões toneladas)World leading importer country (millions of tonnes)
Maiores produtores de cimento (em milhões de toneladas)
World leading producer country (millions of tonnes)
DAD
OS
INTE
RNAC
ION
AIS
INTE
RNAT
ION
AL D
ATA
32
DAD
OS
INTE
RNAC
ION
AIS
INTE
RNAT
ION
AL D
ATA
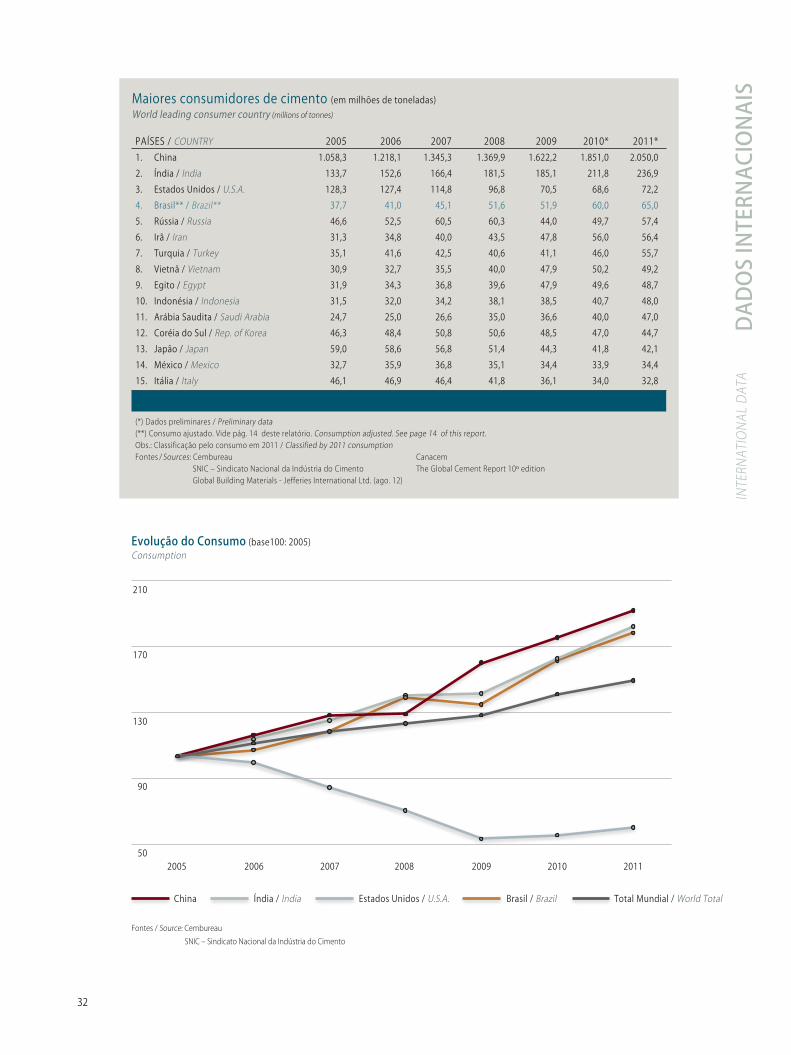
PAÍSES / COUNTRY 2005 2006 2007 2008 2009 2010* 2011*1. China 1.058,3 1.218,1 1.345,3 1.369,9 1.622,2 1.851,0 2.050,0
2. Índia / India 133,7 152,6 166,4 181,5 185,1 211,8 236,9
3. Estados Unidos / U.S.A. 128,3 127,4 114,8 96,8 70,5 68,6 72,2
4. Brasil** / Brazil** 37,7 41,0 45,1 51,6 51,9 60,0 65,0
5. Rússia / Russia 46,6 52,5 60,5 60,3 44,0 49,7 57,4
6. Irã / Iran 31,3 34,8 40,0 43,5 47,8 56,0 56,4
7. Turquia / Turkey 35,1 41,6 42,5 40,6 41,1 46,0 55,7
8. Vietnã / Vietnam 30,9 32,7 35,5 40,0 47,9 50,2 49,2
9. Egito / Egypt 31,9 34,3 36,8 39,6 47,9 49,6 48,7
10. Indonésia / Indonesia 31,5 32,0 34,2 38,1 38,5 40,7 48,0
11. Arábia Saudita / Saudi Arabia 24,7 25,0 26,6 35,0 36,6 40,0 47,0
12. Coréia do Sul / Rep. of Korea 46,3 48,4 50,8 50,6 48,5 47,0 44,7
13. Japão / Japan 59,0 58,6 56,8 51,4 44,3 41,8 42,1
14. México / Mexico 32,7 35,9 36,8 35,1 34,4 33,9 34,4
15. Itália / Italy 46,1 46,9 46,4 41,8 36,1 34,0 32,8
Total Mundial / World Total 2.333,7 2.588,2 2.778,8 2.824,0 3.004,7 3.294,0 3.583,0
(*) Dados preliminares / Preliminary data(**) Consumo ajustado. Vide pág. 14 deste relatório. Consumption adjusted. See page 14 of this report.Obs.: Classificação pelo consumo em 2011 / Classified by 2011 consumptionFontes / Sources: Cembureau Canacem SNIC – Sindicato Nacional da Indústria do Cimento The Global Cement Report 10º edition Global Building Materials - Jefferies International Ltd. (ago. 12)
210
170
130
90
50 2005 2006 2007 2008 2009 2010 2011
Evolução do Consumo (base100: 2005) Consumption
Fontes / Source: Cembureau
SNIC – Sindicato Nacional da Indústria do Cimento
Maiores consumidores de cimento (em milhões de toneladas)World leading consumer country (millions of tonnes)
China Índia / India Estados Unidos / U.S.A. Brasil / Brazil Total Mundial / World Total

DAD
OS
INTE
RNAC
ION
AIS
INTE
RNAT
ION
AL D
ATA
33
PAÍSES / COUNTRY 2005 2006 2007 2008 2009 2010 2011Américas / Americas
Estados Unidos / U.S.A. 434 427 381 318 230 227 231Canadá / Canada 297 325 307 334 266 258 257México / Mexico 314 342 347 329 321 301 299Brasil / Brazil 205 221 240 272 271 311 333Argentina 194 229 245 247 231 254 281Chile 274 262 282 288 243 259 294Venezuela 177 222 268 288 278 243 261Média Américas / America Average 297 308 301 288 253 265 269
Europa / Europe
Alemanha / Germany 328 351 333 337 310 301 342Espanha / Spain 1.192 1.278 1.266 936 630 532 439França / France 373 397 399 386 325 314 327Grécia / Greece 912 1.049 994 913 697 564 354Itália / Italy 789 813 784 699 599 565 542Portugal 826 739 737 689 580 546 462Turquia / Turkey 487 571 601 568 567 648 753Rússia / Russia 326 369 425 425 310 347 402Média Europa / Europe Average 494 534 546 506 422 404 403
Ásia / Asia
China 812 929 1.021 1.033 1.218 1.380 1.523Japão / Japan 462 459 445 403 348 328 329Coréia do Sul / Rep. of Korea 962 1.002 1.048 1042 994 961 914Índia / India 121 137 147 158 160 178 191Tailândia / Thailand 426 423 395 406 368 387 398Média Ásia / Asia Average 420 467 504 515 579 634 686África / Africa
Argélia / Algeria 408 456 479 504 522 514 544Egito / Egypt 452 477 500 527 624 638 616Marrocos / Marocco 340 374 417 453 463 463 498Tunísia / Tunisia 554 552 543 571 616 659 626África do Sul / South Africa 252 283 293 277 239 217 222Média África / Africa Average 129 135 146 151 167 171 171
Oceania / Oceania
Austrália / Australia 457 458 473 486 416 423 418Nova Zelândia / New Zealand 302 266 366 363 266 275 227Média Oceania / Oceania Average 334 330 351 358 313 315 324
Média Mundial / World Average 363 398 423 424 447 480 513
Fontes/Sources: Cembureau AFCP - Argentina SNIC – Sindicato Nacional da Indústria do Cimento Global Building Materials - Jefferies International Ltd. (ago. 12) CANACEM - México The Global Cement Report 10º edition
Consumo per capita 2011 (em kg/hab)Per capita consumption 2011 (kg/inhab)
700
600
500
400
300
200
100
0
Evolução do consumo per capita de cimento no mundo (kg / hab.)
Per capita cement consumption in the world (kg/inhab)
Américas* Europa* Ásia* África* Oceania* Mundial* Brasil *MédiaAmericas* Europe* Asia* Africa* Oceania* World( Brazil *Average
269
403
686
171
324
513
333

34
DAD
OS
INTE
RNAC
ION
AIS
INTE
RNAT
ION
AL D
ATA
Preço do cimento nos continentes em 2011 (em US$/tonelada)Cement price by continent in 2011 (US$/tonne)
Fonte / Source: Jefferies International Ltd. - Industrial Building Materials (fev. 2012)
Américas África Ásia Europa OceaniaAmericas Africa Asia Europe Oceania
160
140
120
100
80
60
40
20
0
139
76
129
152
91
Preço do cimento em 2011 - Países selecionados (em US$/tonelada)Cement price in 2011 (US$/tonne)
Fonte / Source: Jefferies International Ltd. - Industrial Building Materials (fev. 2012)
Nigéria / Nigeria
França / France
Rússia / Russia
Canadá / Canada
Inglaterra / England
África do Sul / South Africa
Espanha / Spain
México / Mexico
Chile
EUA / U.S.A.
Venezuela
Portugal
Austrália / Australia
Brasil / Brazil
Índia / India
Japão / Japan
Argentina
0 20 40 60 80 100 120 140 160 180
170
135
86
150
125
128
89
174
105
92
100
103
165
121
85
127
120

DAD
OS
INTE
RNAC
ION
AIS
INTE
RNAT
ION
AL D
ATA
35
Fonte / Source:
JP Morgan Construction and Building Materials Sector (set. 2009)
Jefferies International Ltd.Industrial Building Materials (fev. 2012)
Evolução do preço do cimento em diversos países nas Américas - Preços FOB, sem impostos (em US$/tonelada)Cement price in Americas - FOB (US$/tonne)
EUA / U.S.A.
Canadá / Canada
México / Mexico
Argentina
Venezuela
Brasil / Brazil
180
160
140
120
100
80
60
40 2003 2004 2005 2006 2007 2008 2009 2010 2011
105
100 100
8479
54
6474
49
64
100
111 111
75
100
77
111
65
100
110106
115
128
140
174
150
111 111 111 111
110 110
64
66 66
107
86100 100
100 100
929299
121
98
139
153
120
120
78
60
103
82

36
Conselho de Administração
PresidenteJosé Edison Barros Franco
Vice-PresidentesAlbrecht Curt Reuter-DomenechAndré Pires De Oliveira DiasLuiz Roberto Ortiz Nascimento
ConselheiroVitor Sarquis Hallack
Diretoria
Diretor GeralCléber Acúrcio Machado
Diretor de Finanças e ControladoriaCarlos José Cantú
DiretoresDorivaldo FerreiraManuel Antônio Sobral CruzRubens Prado Valentin JuniorValter Garbinatto de Albuquerque
INTERCEMENT BRASIL S.A.Escritório Central: Avenida Nações Unidas,12.495, 13º e 14º andaresTorre A do Centro Empresarial Berrini - CEP: 04578-000 - São Paulo - SPTels.: (11) 3718-4260 / (11) 3718-4330www.intercement.com
Fábricas Município UF
17 Intercement João Pessoa PB20 Intercement Cabo de Sto. Agostinho PE22 Intercement São Miguel dos Campos AL26 Intercement Campo Formoso BA27 Intercement Brumado BA31 Intercement Cezarina GO36 Intercement Bodoquena MS39 Intercement Santana do Paraiso MG43 Intercement Pedro Leopoldo MG48 Intercement Ijaci MG70 Intercement Apiaí SP71 Intercement Cajati SP72 Intercement Jacareí SP75 Intercement Cubatão SP82 Intercement Nova Santa Rita RS84 Intercement Candiota RS
Em Construção
Intercement Caxitú PB
Fábrica Município UF
77 Itambé Balsa Nova PR
CIA. DE CIMENTO ITAMBÉEscritório Central: Rodovia Curitiba-Ponta Grossa (BR 277), n° 125CEP: 82305-100 - Curitiba - PRTel.: (41) 3317-1144 - Fax: (41) 3373-1144www.cimentoitambe.com.br
Conselho de Administração
PresidenteRubens Slaviero
Vice-PresidentesAntonio Joaquim Ferreira CustódioCláudio Gomes SlavieroMarcos Slaviero
ConselheirosAlexandre Silva D'AmbrosioEmílio Batista GomesFrancisco Alberto Vieira de AraujoJosé Luiz SlavieroLuiz Alberto de Castro SantosNelson Koichi ShimadaNelson Luis SlavieroPaulo Dallegrave Neto
Diretoria
Diretor PresidenteRubens Slaviero
Diretores Vice-PresidentesAntonio Joaquim Ferreira CustódioCláudio Gomes SlavieroMarcos Slaviero
Diretor SuperintendentePaulo Procopiak de Aguiar
Diretor ExecutivoLuis Sérgio Gandolfi
Diretor ExecutivoLycio Roberto da Mota Vellozo
Diretor ExecutivoGilberto Vincenzo Piuzzi
Fábricas Município UF Empresa
18 Caaporã Caaporã PB Lafarge Brasil S.A.28 Candeias Candeias BA32 Cocalzinho Cocalzinho de Goiás GO
38 Montes Claros Montes Claros MG Indústria e Comércio de Extração de Areia Khouri LTDA.
40 Matozinhos Matozinhos MG Lafarge Brasil S.A.44 Arcos Arcos MG49 Santa Luzia Santa Luzia MG 56 Cantagalo Cantagalo RJ 67 Itapeva Itapeva SP
LAFARGE BRASIL S.A.Escritório Central: Av.Almirante Barroso, 52 - 15° andarCEP: 20031-000 - Rio de Janeiro - RJTel.: (21) 3804-3100 - Fax: (21) 3804-3272www.lafarge.com.br
Diretoria
Presidente Alexis Langlois
Diretor Jurídico Luciana de Morais Ferreira
Diretor Industrial Juan Antônio Aniz Leon
Fábrica Município UF
29 Ciplan Sobradinho DF
CIPLAN - CIMENTO PLANALTO S.A.Fábrica: Rodovia DF 205 - Km 2,7 - Zona RuralCEP: 73151-010 - Sobradinho - DFTel.: (61) 3487-9000 - Fax: (61) 3487-9090www.ciplan.com.br
Conselho de Administração e Diretoria
Vice-Presidentes Jorge Edney Atalla Jorge Rudney Atalla Jorge Sidney Atalla Marlene Leal de Souza Atalla
Superintendente Roberto Castelani
Diretores Elísio Gomes da Conceição Filho Luiz de Moraes Rego Neto Paulo Francisco Ramos
EMPRESAS ASSOCIADASASSOCIATED COMPANIES
Diretor de Recursos Humanos João Ricardo Cavalcanti
Diretor Superintendente da Atividade Concreto e Agregados Cláudio Soares

37
Fábricas Município UF Empresa
1 Porto Velho Porto Velho RO Votorantim Cimentos S.A. 5 Barcarena Barcarena PA 6 Primavera Primavera PA 7 Xambioá Xambioá TO 9 São Luís São Luís MA 11 Sobral Sobral CE 12 Pecém Caucaia CE 21 Poty Paulista Paulista PE 23 Laranjeiras Laranjeiras SE 30 Sobradinho Sobradinho DF 33 Goiás Edealina GO 34 Nobres Nobres MT 35 Cuiabá Cuiabá MT 37 Corumbá Corumbá MS 45 Itaú de Minas Itaú de Minas MG 55 Rio Negro Cantagalo RJ 59 Volta Redonda Volta Redonda RJ 62 Sepetiba Itaguaí RJ 64 Santa Helena Votorantim SP 65 Salto Salto de Pirapora SP 66 Cubatão Cubatão SP 68 Ribeirão Grande Ribeirão Grande SP 76 Rio Branco Rio Branco do Sul PR 78 Itajaí Itajaí SC 79 Vidal Ramos Vidal Ramos SC 80 Imbituba Imbituba SC 83 Esteio Esteio RS 85 Pinheiro Machado Pinheiro Machado RS
Fábricas Município / UF Empresas
Em operação
2 Itautinga Manaus / AM Itautinga Agro Industrial S.A. Estrada do Aleixo, km 10 - Manaus, AM (92) 3617-5500
3 Cibrasa Capanema / PA Cimentos do Brasil S.A.- Cibrasa Travessa Padre Prudêncio, nº 90, Belém, PA (91) 3224-0055
4 Itaituba Itaituba / PA Itaituba Indústria de Cimentos do Pará S.A. Travessa Padre Prudêncio,nº 90, Belém, PA (91) 3224-0055
8 Itapicuru Codó / MA Itapicuru Agro Industrial S.A Rodovia BR-316, Km 466 - Codó, MA - (99) 3661-5000
10 Itapissuma Fronteiras / PI Itapissuma S.A. Fazenda Monte Alvão - Fronteiras, PI - (89) 3454-1221
13 Itapuí Barbalha / CE Itapuí Barbalhense Indústria de Cimentos S.A. Rodovia CE-223, Barbalha-Jardim, s/nº, Km 2,5 Barbalha, CE - (88) 2101-3800
15 Itapetinga Mossoró / RN Itapetinga Agro Industrial S.A. Av. Bernardo Vieira, nº 685 - Natal, RN - (84) 3422-3400
19 Itapessoca Goiana / PE Itapessoca Agro Industrial S.A. Ilha de Itapessoca, Tejucupapo - Goiana, PE (81) 3626-8800
24 Itaguassu N.Sra. do Socorro / SE Itaguassu Agro Industrial S.A. Rod. Indl. João Pereira dos Santos N. Sra. do Socorro, SE - (79) 3114-1200
53 Itabira C. de Itapemirim / ES Itabira Agro Industrial S.A. Fazenda Monte Líbano - C. do Itapemirim, ES (28) 2102-2200
Em Construção
Itaguarana Ituaçu / BA Itaguarana S.A. Fazenda Itaguarana, Ituaçu, BA - (77) 3415-2063
Itapitanga Rosário do Oeste / MT Itapitanga Indústria de Cimentos de Mato Grosso S.A. Travessa Padre Prudêncio, 90, Belém, PA - (91) 3224-0055
CBE Ribeirão Grande / SP Companhia Brasileira de Equipamento Ilha de Itapessoca, Tejucupapo, Goiana, PE (81) 3626-8800
GRUPO JOÃO SANTOSEscritório Central: Av. Marquês de Olinda, 11CEP: 50030-000 - Recife - PETel.: (81) 4009-8000 - Fax: (81) 4009-82 76
VOTORANTIM CIMENTOS S.A.Sede: Praça Prof. José Lannes, 40 - 9° andar - Brooklin CEP: 04571-100 - São Paulo - SPTel.: (11) 2162-0600 - Fax: (11) 2162-0753www.votorantimcimentos.com.br
DiretoriaWalter Schalka Luiz Alberto de Castro Santos Edvaldo Araújo Rabelo Marcelo Chamma Mário Luiz Franceschi Fontoura
Conselho de Administração
Presidente Fernando João Pereira dos Santos
Conselheiros José Bernardino Pereira dos Santos Manoel de Souza Leão Veiga
Diretoria Executiva
Diretores Presidentes Fernando João Pereira dos Santos José Bernardino Pereira dos Santos
Diretores Vice-Presidentes Francisco de Jesus Penha Sergio Maçães
Diretores Executivos Alberto Augusto Lafaiete Galdi Mestieri Ana Patricia Baptista Rabelo Pereira dos Santos Geraldo João Pereira dos Santos José Bernardino Pereira dos Santos Filho Marcílio Jacques Brotherhood

www.snic.org.br
Rua da Assembléia, 10 - grupo 4001CEP 20011-901 - Rio de Janeiro - RJ - BrasilTel.: (21) 2531-1314 Tel. /Fax: (21) [email protected]
Projeto GráficoGisela Fiuza
Designer AssistenteVitoria Mackay
Coordenação GeralGF Designwww.gfdesign.com.br