sinai community health survey 2.0 march 2017 -...
TRANSCRIPT

Community Health CountsSinai Community HealtH Survey 2.0
march 2017

DEar fEllow chicagoans,
There is nothing more basic and essential to human happiness than health and well-being—conditions
determined by both an individual’s circumstances and behavior. The Sinai Community Health Survey 2.0
provides a rich and vivid look at the factors that contribute to health and well-being, and the range and
magnitude of differences experienced across populations and neighborhoods.
Thanks to the work of the sinai Urban health institute and the residents of nine chicago neighborhoods
who contributed their time and information, we have in-depth neighborhood-level health information, which
can be compared to similar data from the 2002 Sinai Survey. The level of detail spans 16 health topics
that reveal an extraordinarily complete picture of the health outcomes of selected chicago residents, and
possible determinants of those outcomes.
This study offers a wellspring of information about the true state of our neighbors and our neighborhoods,
ranging from physical and mental health, to access to health care, to levels of social cohesion in neighbor-
hoods. These data are an important resource for policy makers, government leaders, foundations, and
nonprofit organizations that seek to improve outcomes and reduce disparities. for The chicago community
Trust, this information is invaluable to inform our work that continues our long-standing commitment to
improving health outcomes for all chicagoans.
The large disparities that exist between neighborhoods only miles apart should be troubling—and, at the
same time, offer opportunities for solutions that could accelerate the pace by which we close gaps in
longevity, chronic disease, and healthy behaviors. There is plenty of work for us all, and benefits for every-
one. Think of the difference we can make together when we can add years and wellness to an individual’s
life. More years to enjoy grandchildren, better health to more fully enjoy life in our city.
These are differences worth making and i hope this study serves as a call to action galvanizing our individual
and collective efforts on behalf of all who call chicago home. The chicago community Trust is proud to
fund this research and we invite you to join us and help make chicago one of the healthiest places in the
nation to live.
Terry MazanyPresident and CEO The Chicago Community Trust
1
Acknowledgements 3
Introduction 5
Surveyed Communities 7
Health Snapshots
General health status 9
obesity 13
asthma and chronic obstructive pulmonary disease 17
Cardiovascular disease 20
Diabetes 25
Depression and anxiety 29
Post-traumatic stress disorder 33
infant health 36
Smoking 40
Domestic and intimate partner violence 43
Health insurance coverage 46
Health care utilization 49
unmet health care needs 54
Food insecurity 59
Criminal justice experiences 63
Social cohesion and neighborhood safety 67
Methodology 72
Sample Demographics 74
table oF ContentS
2
acknowlEDgEMEnTs
Lead authors
Jana l. hirschtick
Maureen r. Benjamins
sharon homan
Contributing authors
Veronica E. fitzpatrick
Michelle M. hughes
Bijou r. hunt
Dalia Majumdar
helen Margellos-anast
nazia s. saiyed
Data visualization
stephanie Evergreen
adelina huo
Design and layout
robertz & kobold inc.
kristin Monnard
Finally, we thank our survey participants for the generous contribution of their time.
We gratefully recognize the support of all those who made this report possible.
Research assistance
rachel Bruckman
Jon f. casas
nadia hallaj
laura Jansen
Beverly nguyen
nikhilesh raju
Data collection
University of illinois at chicago survey research laboratory
Community Advisory Committee
Juana Ballesteros
leony calderon
carla campbell
abraham celio
gay chisum
Melissa chrusfield
saranna Davidson
Vera Davis
Elio Dearrudah
ruben Escobar
Jana Estell
Maria flores
raul garcia
nita hailey gamble
Yolanda gray
Funding
The chicago community Trust
ashima sarup
Maureen shields
Donna Tsai
Brian white
alison wiles
Maia winkel
Marco Jacome
Blanche suggs killingsworth
anna Maria leon
Joline lozano
lynne Mock
Militza Pagan
Maggie Perales
Jose luis rodriguez
isaiah ross
imelda salazar
Bobby smith
Mireya Vera
sarah walker
Maribeth welch
Mariana wrzosek
3

Community Health Counts chicago lawn gagE Park hErMosa hUMBolDT Park norTh lawnDalE
norwooD Park soUTh lawnDalE wEsT EnglEwooD wEsT-wEsT Town
Sinai Community Health Survey 2.0March 2017
WorKinG toGetHer For HealtH eQuity
Health is a state of complete physical, mental, and social well-being and not merely the absence of disease or infirmity. — World Health Organization, 1948
The mission of the sinai Urban health institute (sUhi) is to achieve health equity among communities through excellence and innovation in data-driven research, interventions, evaluation, and collaboration. sUhi, a unique, nationally-recognized research center on the west side of chicago, has worked for over 15 years to eliminate health disparities in some of the most underserved neighborhoods in the city. By reducing health disparities in these neighborhoods, we can work toward health equity. health equity seeks to ensure that individuals are not denied the possibility to be healthy because they belong to a socially, politically, or economically disadvantaged group. The idea of health equity is at the epicenter of sUhi’s work and the heart of the Sinai Community Health Survey.
Sinai Community HealtH Survey 2.0
with generous support from The chicago community Trust (ccT), sUhi conducted the Sinai Community Health Survey 2.0 to provide critical data on the health outcomes and related health factors in nine chicago neighborhoods. first implemented in 2002, the Sinai Community Health Survey is still the largest community-driven face-to-face health survey ever conducted in chicago. The purpose of the survey is to:
1. Document the health status of selected chicago community areas
2. Understand the social factors associated with health-related behaviors, service utilization, and outcomes
3. Use findings to develop public health interventions to address health inequities
The data provided by the original Sinai Community Health Survey (2002) not only brought attention to striking health disparities within our city, but also led to numerous interventions addressing issues ranging from obesity to diabetes to smoking.1 we expect that the findings summarized here will have the same positive impact.
To strive toward health equity, we need meaningful data at the local level, especially for vulnerable populations. These data need to be scientifically rigorous and cover the broad range of social determinants of health. furthermore, community members need to be engaged throughout the process to ensure the data are relevant, appropriately attained, and accurately interpreted. This presentation of the Sinai Community Health Survey 2.0 provides this valuable local data for nine chicago community areas, representing some of the most socially and economically challenged neighborhoods in chicago.
5
SnaPSHotS oF SiXteen HealtH toPiCS
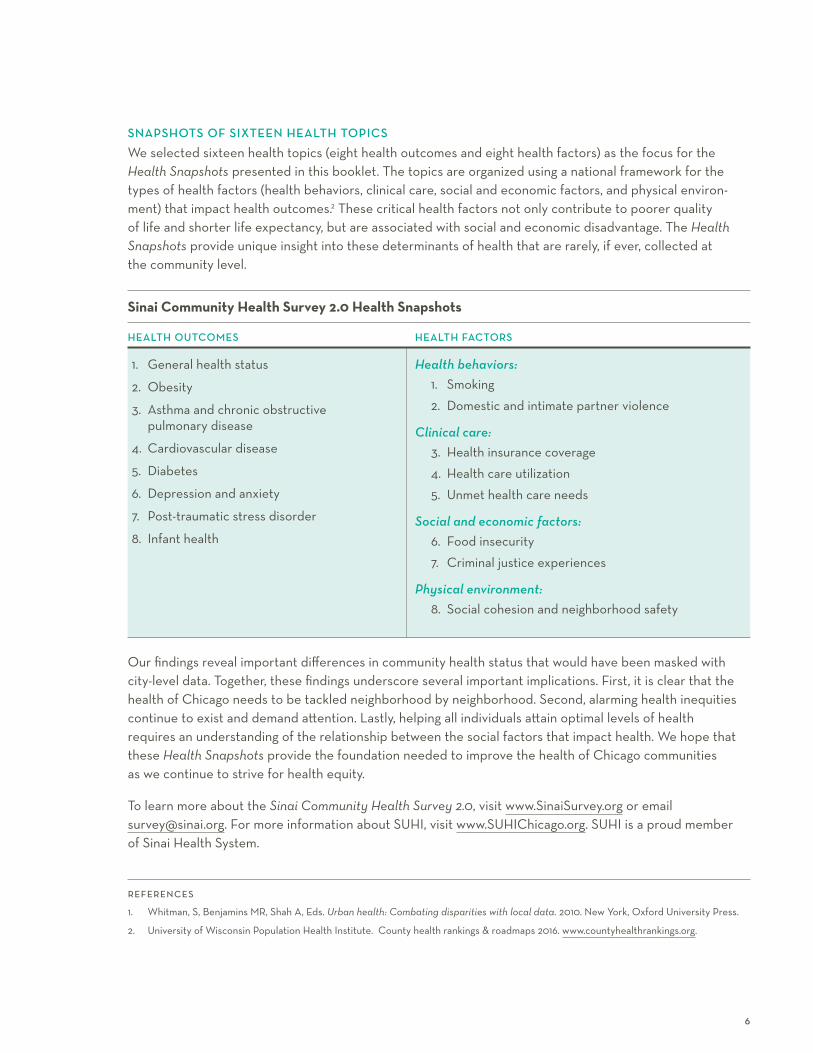
we selected sixteen health topics (eight health outcomes and eight health factors) as the focus for the Health Snapshots presented in this booklet. The topics are organized using a national framework for the types of health factors (health behaviors, clinical care, social and economic factors, and physical environ-ment) that impact health outcomes.2 These critical health factors not only contribute to poorer quality of life and shorter life expectancy, but are associated with social and economic disadvantage. The Health Snapshots provide unique insight into these determinants of health that are rarely, if ever, collected at the community level.
our findings reveal important differences in community health status that would have been masked with city-level data. Together, these findings underscore several important implications. first, it is clear that the health of chicago needs to be tackled neighborhood by neighborhood. second, alarming health inequities continue to exist and demand attention. lastly, helping all individuals attain optimal levels of health requires an understanding of the relationship between the social factors that impact health. we hope that these Health Snapshots provide the foundation needed to improve the health of chicago communities as we continue to strive for health equity.
To learn more about the Sinai Community Health Survey 2.0, visit www.sinaisurvey.org or email [email protected]. for more information about sUhi, visit www.sUhichicago.org. sUhi is a proud member of sinai health system.
references1. whitman, s, Benjamins Mr, shah a, Eds. Urban health: Combating disparities with local data. 2010. new York, oxford University Press.
2. University of wisconsin Population health institute. county health rankings & roadmaps 2016. www.countyhealthrankings.org.
Sinai Community Health Survey 2.0 Health Snapshots
HealtH outComeS
1. general health status
2. obesity
3. asthma and chronic obstructive pulmonary disease
4. cardiovascular disease
5. Diabetes
6. Depression and anxiety
7. Post-traumatic stress disorder
8. infant health
HealtH FaCtorS
Health behaviors:1. smoking
2. Domestic and intimate partner violence
Clinical care:3. health insurance coverage
4. health care utilization
5. Unmet health care needs
Social and economic factors:6. food insecurity
7. criminal justice experiences
Physical environment:8. social cohesion and neighborhood safety
6
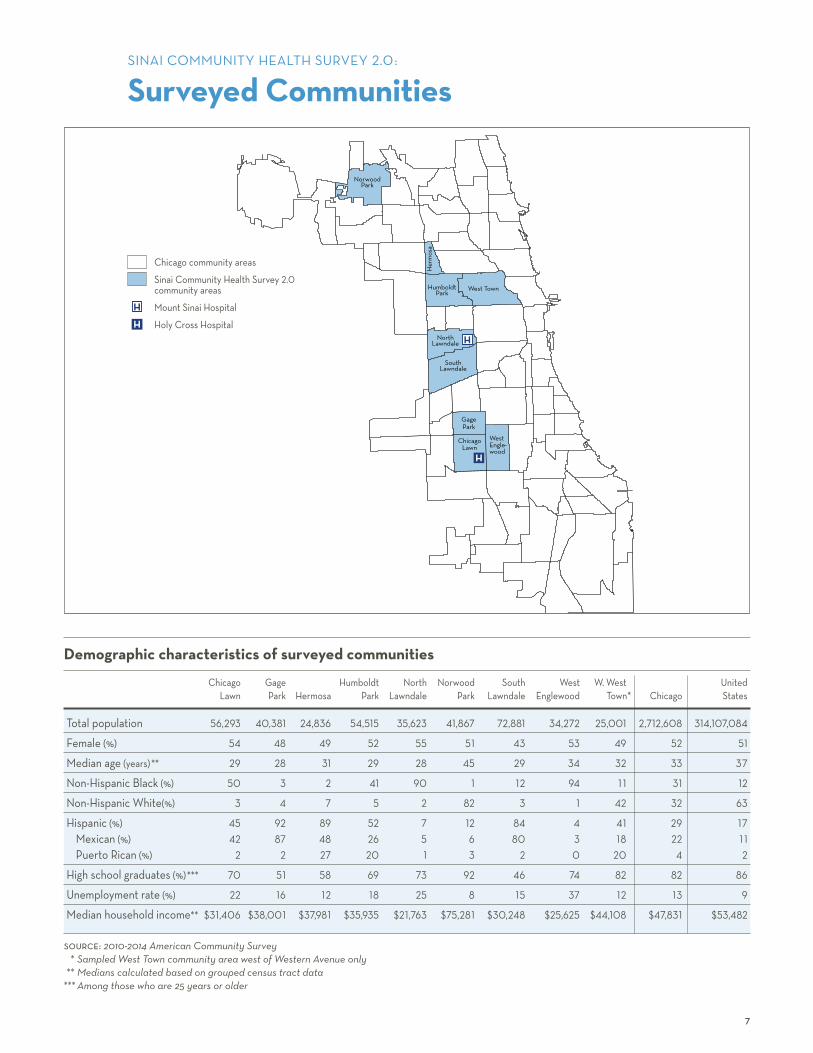
Demographic characteristics of surveyed communities
chicago gage humboldt north norwood south west w. west United lawn Park hermosa Park lawndale Park lawndale Englewood Town* chicago states
Total population 56,293 40,381 24,836 54,515 35,623 41,867 72,881 34,272 25,001 2,712,608 314,107,084
female (%) 54 48 49 52 55 51 43 53 49 52 51
Median age (years)** 29 28 31 29 28 45 29 34 32 33 37
non-hispanic Black (%) 50 3 2 41 90 1 12 94 1 1 31 12
non-hispanic white(%) 3 4 7 5 2 82 3 1 42 32 63
hispanic (%) 45 92 89 52 7 12 84 4 41 29 17Mexican (%) 42 87 48 26 5 6 80 3 18 22 1 1Puerto rican (%) 2 2 27 20 1 3 2 0 20 4 2
high school graduates (%)*** 70 51 58 69 73 92 46 74 82 82 86
Unemployment rate (%) 22 16 12 18 25 8 15 37 12 13 9
Median household income** $31,406 $38,001 $37,981 $35,935 $21,763 $75,281 $30,248 $25,625 $44,108 $47,831 $53,482
source: 2010-2014 American Community Survey * Sampled West Town community area west of Western Avenue only ** Medians calculated based on grouped census tract data *** Among those who are 25 years or older
chicago community areas
sinai community health survey 2.0 community areas
Mount sinai hospital
holy cross hospital
H
H
7
sinai coMMUniTY hEalTh sUrVEY 2.0:
Surveyed Communities
norwood Park
humboldt Park
west Town
north lawndale
south lawndale
gage Park
chicago lawn
west Engle- wood
her
mos
a
H
H


references 1. general health status. healthyPeople.gov web site. https://www.healthypeople.gov/2020/about/foundation-health-measures/
general-health-status. accessed December 20, 2016.
2. idler E, Benyamini Y. self-rated health and mortality: a review of 28 studies. J Health Soc Behav. 1997; 38(1): 21-37.
3. gold M, franks P, Erickson P. assessing the health of the nation. The predictive validity of a preference-based measure and self-rated health. Med Care. 1996; 34(2): 163-177.
4. idler El, kasl sV. self-ratings of health: Do they also predict change in functional ability? J Gerontol B Psychol Sci Soc Sci. 1995; 50B: s344-s353.
5. Blackwell Dl, Villarroel Ma. Tables of summary health statistics for U.s. adults: 2015 national health interview survey. national center for health statistics. 2016. http://www.cdc.gov/nchs/nhis/shs/tables.htm.
6. Zack MM. health-related quality of life—United states, 2006 and 2010. MMWR Suppl. 2013; 62(3): 105-111.
G eneral health status can be measured in numerous ways, including self-reported health and physically and mentally unhealthy days.1 self-reported, or subjective
health, is a simple and reliable assessment that predicts future disability, hospitalizations, and overall mortality.2-4 Using this measure of health, more than one in ten Us adults report being in fair or poor health in general.5 another way to assess overall health is to ask individuals to count the number of days in the past month that their physical or mental health was not good. on average, american adults report 3-4 days per month of poor health for both physical and mental health.6
WHiCH CommunitieS are moSt aFFeCteD?
in south lawndale, 48% of females and 41% of males reported fair or poor health status.
The average number of physically unhealthy days in the past month was six or more for females in south lawndale, hermosa, and gage Park.
WHo iS moSt aFFeCteD?
among non-hispanic Black adults and adults of Puerto rican or Mexican origin, about one in three reported fair or poor health status.
females of Puerto rican origin had an average of 8.4 physically unhealthy days in the past month.
The average number of mentally unhealthy days in the past month was five or more for adults of Puerto rican origin and non-hispanic white females.
g e n e ra l h e a lt h stat u s 9
General health status

male female
prevalence (standard error)
prevalence (standard error)
male female
FiGure 2: Percent reporting fair or poor health status by race/ethnicity and sex
us male: 12% us female: 13%
Mexican (3.9%) 35% 39% (3.6%)
Puerto rican (6.5%) 29% 34% (9.7%)
non-hispanic Black (6.1%) 36% 32% (4.9%)
non-hispanic white (5.8%) 18% 17% (7.4%)
us data source: National Health Interview Survey, 2015 (age-adjusted)Rao-Scott Chi-Square p-value = 0.0960 (males); p = 0.1085 (females)
The percentage of females reporting fair or poor health status was highest for females of Mexican origin (39%) and lowest for non-hispanic white females (17%).
The percentage of males reporting fair or poor health status was highest for non-hispanic Black males (36%) and lowest for non-hispanic white males (18%).
The differences in the percentage reporting fair or poor health status by race/ethnic group were not statistically significant for males or females.
FiGure 1: Percent reporting fair or poor health status by community area and sex
us male: 12% us female: 13%
south lawndale (6.4%) 41% 48% (9.8%)
hermosa (6.8%) 30% 44% (8.0%)
west Englewood (9.8%) 38% 44% (7.6%)
gage Park (9.2%) 27% 43% (6.7%)
humboldt Park (8.1%) 39% 40% (6.5%)
chicago lawn (10.5%) 32% 33% (7.5%)
north lawndale (8.5%) 38% 31% (7.1%)
west-west Town (4.9%) 23% 19% (5.5%)
norwood Park suppressed 15% (8.9%)
Sampled West Town community area west of Western Avenue onlyus data source: National Health Interview Survey, 2015 (age-adjusted)
The percentage of females reporting fair or poor health status ranged from a high of 48% for females in south lawndale to a low of 15% for females in norwood Park.
The percentage of males reporting fair or poor health status ranged from a high of 41% for males in south lawndale to a low of 23% for males in west-west Town.
Fair or poor health status was defined as responding either ‘fair’ or ‘poor’ when asked whether, in general, your health is excellent, very good, good, fair, or poor.
g e n e ra l h e a lt h stat u s 1 0
male female
average (standard error)
average (standard error)
male female
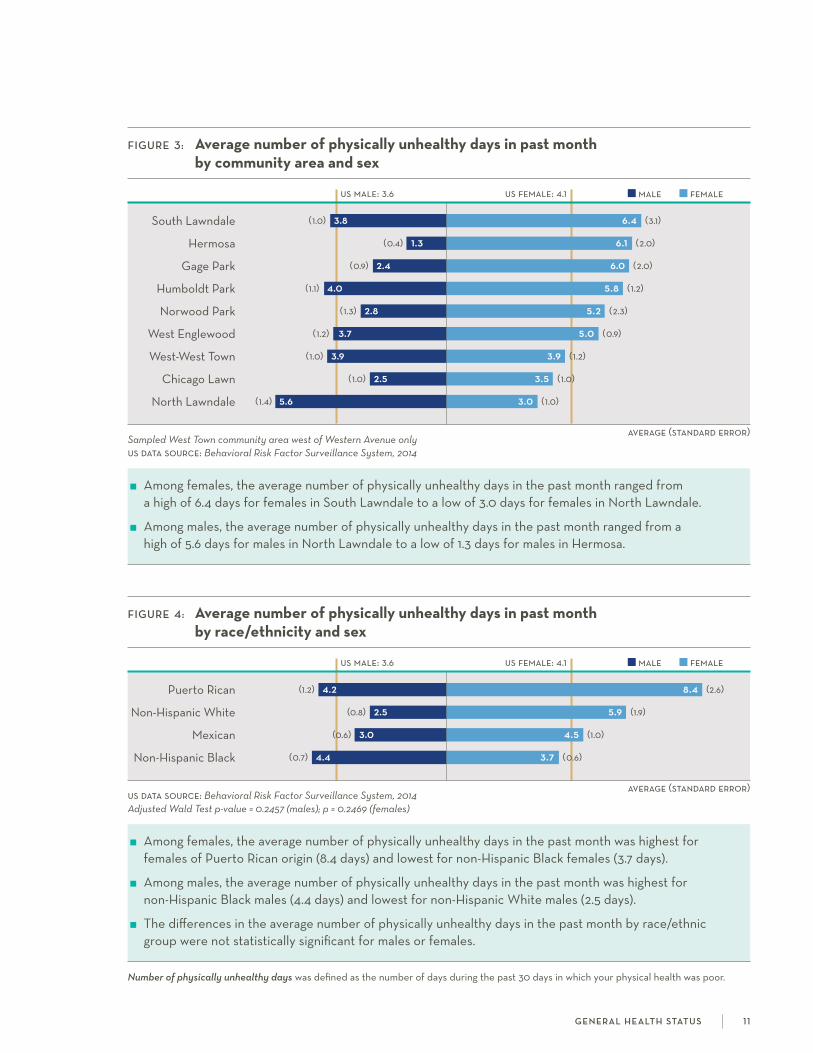
Number of physically unhealthy days was defined as the number of days during the past 30 days in which your physical health was poor.
g e n e ra l h e a lt h stat u s 1 1
FiGure 3: Average number of physically unhealthy days in past month by community area and sex
us male: 3.6 us female: 4.1
south lawndale (1.0) 3.8 6.4 (3.1)
hermosa (0.4) 1.3 6.1 (2.0)
gage Park (0.9) 2.4 6.0 (2.0)
humboldt Park (1.1) 4.0 5.8 (1.2)
norwood Park (1.3) 2.8 5.2 (2.3)
west Englewood (1.2) 3.7 5.0 (0.9)
west-west Town (1.0) 3.9 3.9 (1.2)
chicago lawn (1.0) 2.5 3.5 (1.0)
north lawndale (1.4) 5.6 3.0 (1.0)
Sampled West Town community area west of Western Avenue onlyus data source: Behavioral Risk Factor Surveillance System, 2014
among females, the average number of physically unhealthy days in the past month ranged from a high of 6.4 days for females in south lawndale to a low of 3.0 days for females in north lawndale.
among males, the average number of physically unhealthy days in the past month ranged from a high of 5.6 days for males in north lawndale to a low of 1.3 days for males in hermosa.
FiGure 4: Average number of physically unhealthy days in past month by race/ethnicity and sex
us male: 3.6 us female: 4.1
Puerto rican (1.2) 4.2 8.4 (2.6)
non-hispanic white (0.8) 2.5 5.9 (1.9)
Mexican (0.6) 3.0 4.5 (1.0)
non-hispanic Black (0.7) 4.4 3.7 (0.6)
us data source: Behavioral Risk Factor Surveillance System, 2014Adjusted Wald Test p-value = 0.2457 (males); p = 0.2469 (females)
among females, the average number of physically unhealthy days in the past month was highest for females of Puerto rican origin (8.4 days) and lowest for non-hispanic Black females (3.7 days).
among males, the average number of physically unhealthy days in the past month was highest for non-hispanic Black males (4.4 days) and lowest for non-hispanic white males (2.5 days).
The differences in the average number of physically unhealthy days in the past month by race/ethnic group were not statistically significant for males or females.

average (standard error)
average (standard error)
male female
male female
FiGure 5: Average number of mentally unhealthy days in past month by community area and sex
us male: 3.1 us female: 4.2
south lawndale (1.0) 3.2 4.7 (2.2)
west-west Town (0.4) 2.1 4.2 (0.8)
chicago lawn (0.4) 1.0 4.1 (2.4)
humboldt Park (1.5) 3.9 3.8 (1.3)
norwood Park (0.4) 0.6 3.8 (2.3)
north lawndale (0.7) 1.9 3.4 (1.4)
west Englewood (1.3) 2.9 2.6 (0.8)
hermosa (1.1) 2.5 2.2 (0.4)
gage Park (0.6) 1.9 1.8 (0.5)
Sampled West Town community area west of Western Avenue onlyUS data source: Behavioral Risk Factor Surveillance System, 2014
among females, the average number of mentally unhealthy days in the past month ranged from a high of 4.7 days for females in south lawndale to a low of 1.8 days for females in gage Park.
among males, the average number of mentally unhealthy days in the past month ranged from a high of 3.9 days for males in humboldt Park to a low of 0.6 days for males in norwood Park.
Number of mentally unhealthy days was defined as the number of days during the past 30 days in which your mental health was poor.
FiGure 6: Average number of mentally unhealthy days in past month by race/ethnicity and sex
us male: 3.1 us female: 4.2
Puerto rican (1.6) 5.0 5.7 (2.8)
non-hispanic white (1.0) 2.4 5.2 (1.9)
non-hispanic Black (0.4) 2.0 2.5 (0.5)
Mexican (0.4) 2.4 2.4 (0.8)
US data source: Behavioral Risk Factor Surveillance System, 2014Adjusted Wald Test p-value = 0.3367 (males); p = 0.3751 (females)
among females, the average number of mentally unhealthy days in the past month was highest for females of Puerto rican origin (5.7 days) and lowest for females of Mexican origin (2.4 days).
among males, the average number of mentally unhealthy days in the past month was highest for males of Puerto rican origin (5.0 days) and lowest for non-hispanic Black males (2.0 days).
The differences in the average number of mentally unhealthy days in the past month by race/ethnic group were not statistically significant for males or females.
g e n e ra l h e a lt h stat u s 1 2
references 1. Bell Ja, kivimaki M, hamer M. Metabolically healthy obesity and risk of incident type 2 diabetes: a meta-analysis of prospective cohort
studies. Obes Rev. 2014; 15(6): 504–515.
2. abdullah a, Peeters a, de courten M, stoelwinder J. The magnitude of association between overweight and obesity and the risk of diabetes: a meta-analysis of prospective cohort studies. Diabetes Res Clin Pract. 2010; 89: 309–319.
3. Prospective studies collaboration. Body-mass index and cause-specific mortality in 900,000 adults: collaborative analyses of 57 prospective studies. The Lancet. 2009; 373: 1083–1096.
4. hubert hB, feinleib M, Mcnamara PM, castelli wP. obesity as an independent risk factor for cardiovascular disease: a 26-year follow-up of participants in the framingham heart study. Circulation. 1983; 67: 968-977.
5. renegan ag, Tyson M, Egger M, heller rf, Zwahlen M. Body-mass index and incidence of cancer: a systematic review and meta-analysis of prospective observational studies. The Lancet. 2008; 371: 569–578.
6. calle, EE, rodriguez c, walker-Thurmond k, Thun MJ. overweight, obesity, and mortality from cancer in a prospectively studied cohort of U.s. adults. N Engl J Med. 2003; 348(17): 1625–1638.
7. aune, D, sen a, Prasad M, et al. BMi and all-cause mortality: systematic review and non-linear dose-response meta-analysis of 230 cohort studies with 3.74 million deaths among 30.3 million participants. BMJ. 2016; 353: i2156.
8. kitahara, cM, flint aJ, Berrington de gonzalez a, et al. association between class iii obesity (BMi of 40–59 kg/m2) and Mortality: a pooled analysis of 20 prospective studies. PLOS Medicine. 2014; 11(7): 1–14.
9. flegal kM, kit Bk, orpana h, graubard, Bi. association of all-cause mortality with overweight and obesity using standard Body Mass index categories: a systematic review and meta-analysis. JAMA. 2013; 309(1): 71–82.
10. finkelstein Ea, Trogdon Jg, cohen Jw, Dietz w. annual medical spending attributable to obesity: Payer- and service-specific estimates. Health Aff. 2009; 28(5): w822-831.
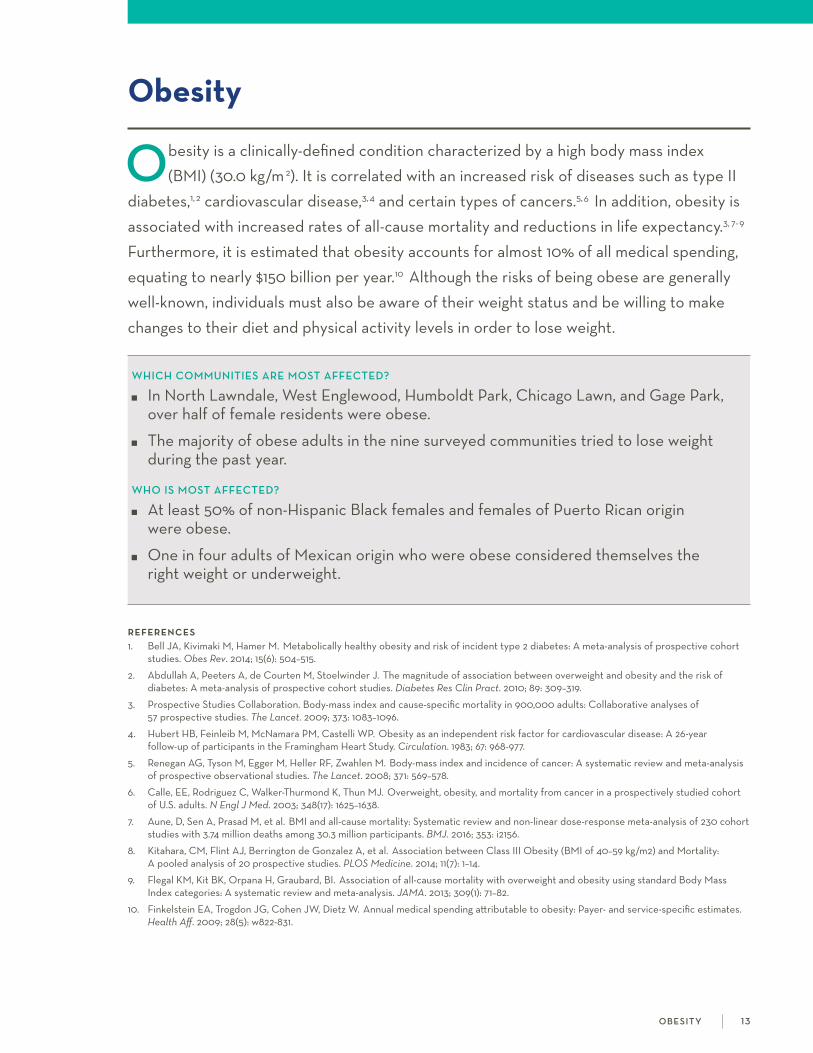
obesity is a clinically-defined condition characterized by a high body mass index (BMi) (30.0 kg/m 2). it is correlated with an increased risk of diseases such as type ii
diabetes,1,2 cardiovascular disease,3,4 and certain types of cancers.5,6 in addition, obesity is associated with increased rates of all-cause mortality and reductions in life expectancy.3, 7-9 furthermore, it is estimated that obesity accounts for almost 10% of all medical spending, equating to nearly $150 billion per year.10 although the risks of being obese are generally well-known, individuals must also be aware of their weight status and be willing to make changes to their diet and physical activity levels in order to lose weight.
WHiCH CommunitieS are moSt aFFeCteD?
in north lawndale, west Englewood, humboldt Park, chicago lawn, and gage Park, over half of female residents were obese.
The majority of obese adults in the nine surveyed communities tried to lose weight during the past year.
WHo iS moSt aFFeCteD?
at least 50% of non-hispanic Black females and females of Puerto rican origin were obese.
one in four adults of Mexican origin who were obese considered themselves the right weight or underweight.
o b e s i t y 1 3
Obesity
male female
prevalence (standard error)
prevalence (standard error)
male female
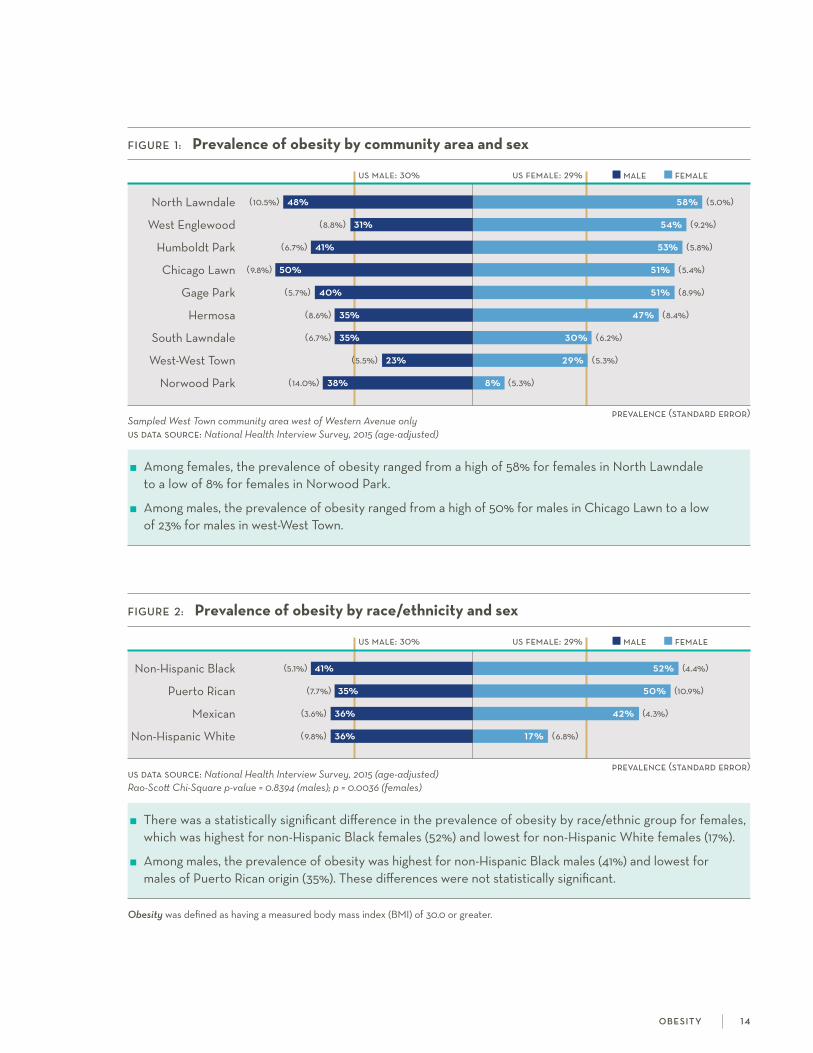
FiGure 1: Prevalence of obesity by community area and sex
us male: 30% us female: 29%
north lawndale (10.5%) 48% 58% (5.0%)
west Englewood (8.8%) 31% 54% (9.2%)
humboldt Park (6.7%) 41% 53% (5.8%)
chicago lawn (9.8%) 50% 51% (5.4%)
gage Park (5.7%) 40% 51% (8.9%)
hermosa (8.6%) 35% 47% (8.4%)
south lawndale (6.7%) 35% 30% (6.2%)
west-west Town (5.5%) 23% 29% (5.3%)
norwood Park (14.0%) 38% 8% (5.3%)
Sampled West Town community area west of Western Avenue only us data source: National Health Interview Survey, 2015 (age-adjusted)
among females, the prevalence of obesity ranged from a high of 58% for females in north lawndale to a low of 8% for females in norwood Park.
among males, the prevalence of obesity ranged from a high of 50% for males in chicago lawn to a low of 23% for males in west-west Town.
FiGure 2: Prevalence of obesity by race/ethnicity and sex
us male: 30% us female: 29%
non-hispanic Black (5.1%) 41% 52% (4.4%)
Puerto rican (7.7%) 35% 50% (10.9%)
Mexican (3.6%) 36% 42% (4.3%)
non-hispanic white (9.8%) 36% 17% (6.8%)
us data source: National Health Interview Survey, 2015 (age-adjusted) Rao-Scott Chi-Square p-value = 0.8394 (males); p = 0.0036 (females)
There was a statistically significant difference in the prevalence of obesity by race/ethnic group for females, which was highest for non-hispanic Black females (52%) and lowest for non-hispanic white females (17%).
among males, the prevalence of obesity was highest for non-hispanic Black males (41%) and lowest for males of Puerto rican origin (35%). These differences were not statistically significant.
Obesity was defined as having a measured body mass index (BMi) of 30.0 or greater.
o b e s i t y 1 4
prevalence (standard error)
prevalence (standard error)
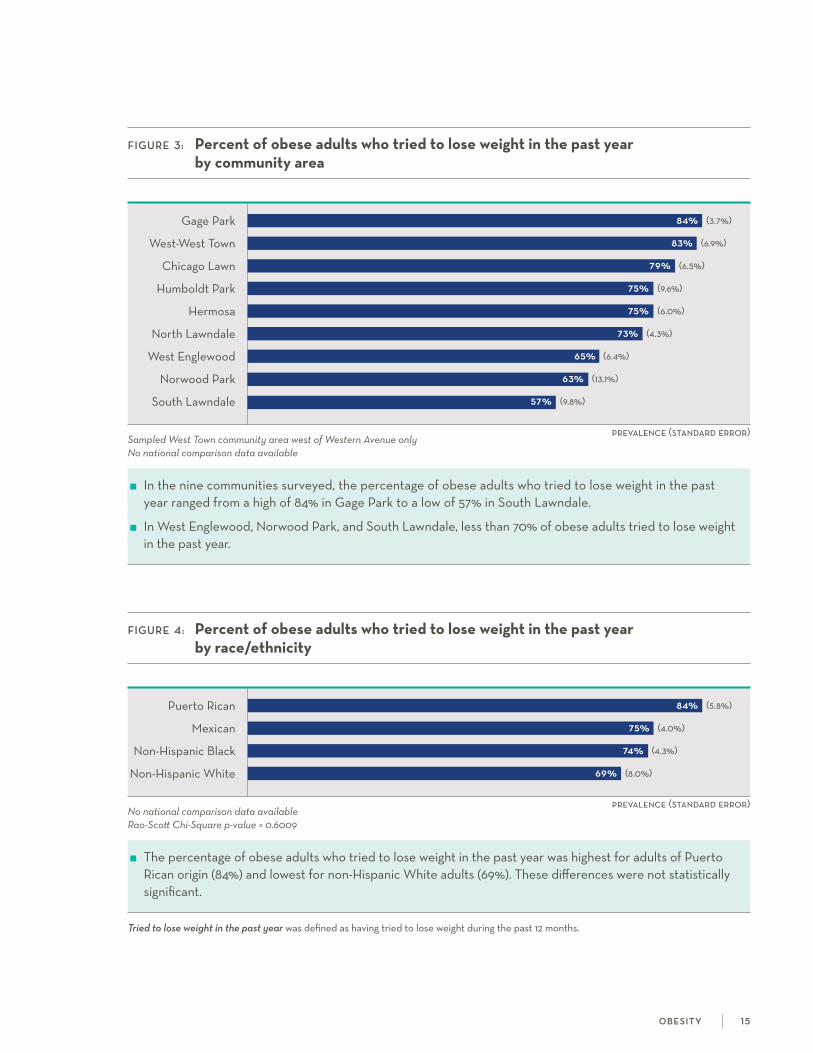
FiGure 3: Percent of obese adults who tried to lose weight in the past year by community area
gage Park 84% (3.7%)
west-west Town 83% (6.9%)
chicago lawn 79% (6.5%)
humboldt Park 75% (9.6%)
hermosa 75% (6.0%)
north lawndale 73% (4.3%)
west Englewood 65% (6.4%)
norwood Park 63% (13.1%)
south lawndale 57% (9.8%)
Sampled West Town community area west of Western Avenue onlyNo national comparison data available
in the nine communities surveyed, the percentage of obese adults who tried to lose weight in the past year ranged from a high of 84% in gage Park to a low of 57% in south lawndale.
in west Englewood, norwood Park, and south lawndale, less than 70% of obese adults tried to lose weight in the past year.
FiGure 4: Percent of obese adults who tried to lose weight in the past year by race/ethnicity
Puerto rican 84% (5.8%)
Mexican 75% (4.0%)
non-hispanic Black 74% (4.3%)
non-hispanic white 69% (8.0%)
No national comparison data availableRao-Scott Chi-Square p-value = 0.6009
The percentage of obese adults who tried to lose weight in the past year was highest for adults of Puerto rican origin (84%) and lowest for non-hispanic white adults (69%). These differences were not statistically significant.
Tried to lose weight in the past year was defined as having tried to lose weight during the past 12 months.
o b e s i t y 1 5
prevalence (standard error)
prevalence (standard error)
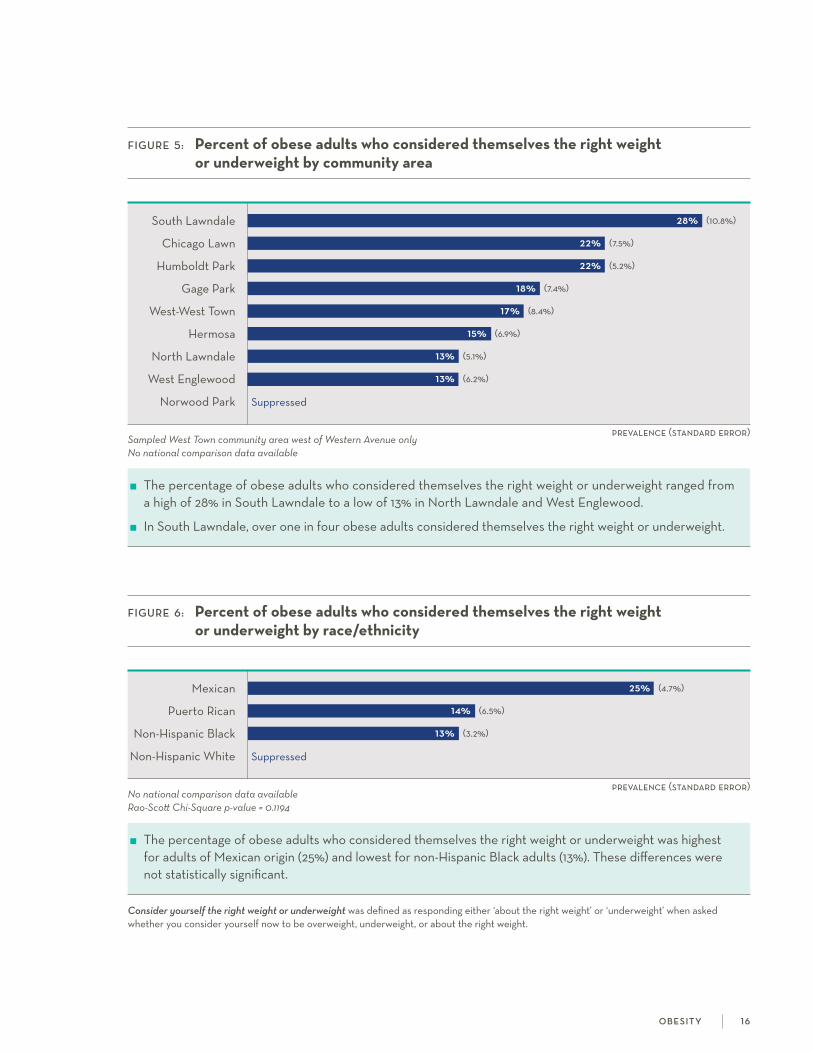
FiGure 5: Percent of obese adults who considered themselves the right weight or underweight by community area
south lawndale 28% (10.8%)
chicago lawn 22% (7.5%)
humboldt Park 22% (5.2%)
gage Park 18% (7.4%)
west-west Town 17% (8.4%)
hermosa 15% (6.9%)
north lawndale 13% (5.1%)
west Englewood 13% (6.2%)
norwood Park suppressed
Sampled West Town community area west of Western Avenue onlyNo national comparison data available
The percentage of obese adults who considered themselves the right weight or underweight ranged from a high of 28% in south lawndale to a low of 13% in north lawndale and west Englewood.
in south lawndale, over one in four obese adults considered themselves the right weight or underweight.
FiGure 6: Percent of obese adults who considered themselves the right weight or underweight by race/ethnicity
Mexican 25% (4.7%)
Puerto rican 14% (6.5%)
non-hispanic Black 13% (3.2%)
non-hispanic white suppressed
No national comparison data availableRao-Scott Chi-Square p-value = 0.1194
The percentage of obese adults who considered themselves the right weight or underweight was highest for adults of Mexican origin (25%) and lowest for non-hispanic Black adults (13%). These differences were not statistically significant.
Consider yourself the right weight or underweight was defined as responding either ‘about the right weight’ or ‘underweight’ when asked whether you consider yourself now to be overweight, underweight, or about the right weight.
o b e s i t y 1 6
a sthma and chronic obstructive pulmonary disease (coPD) are conditions character-ized by chronic airway inflammation and obstruction to the lungs.1-3 in asthma,
which usually begins in childhood, this airway obstruction is reversible, whereas in coPD, which usually begins in adulthood and primarily afflicts smokers, this airway obstruction is often irreversible.1-4 although only a small percent of american adults have asthma and/or coPD,5,6 these diseases exert a heavy burden on our society through increased emergency department visits and hospitalizations, reduced productivity due to missed school or work, and increased disability and premature death.1,4
WHiCH CommunitieS are moSt aFFeCteD?
in humboldt Park, west Englewood, and north lawndale, more than one in five adults had asthma.
in west Englewood and humboldt Park, about one in three adults had coPD.
WHo iS moSt aFFeCteD?
among females, non-hispanic Black females and females of Puerto rican origin had the highest prevalence of asthma (24% and 30%, respectively).
non-hispanic Black males had an asthma prevalence that was at least three times greater than males in other race/ethnic groups.
over one in three non-hispanic Black males had coPD.
references1. asthma facts: cDc’s national asthma control Program grantees. centers for Disease control and Prevention.
http://www.cdc.gov/asthma/pdfs/asthma_facts_program_grantees.pdf. accessed June 16, 2016.
2. Postma Ds, rabe kf. The asthma–coPD overlap syndrome. New Eng J Med. 2015; 373(13): 1241-1249.
3. nakawah Mo, hawkins c, Barbandi f. asthma, chronic obstructive pulmonary disease (coPD), and the overlap syndrome. J Am Board Fam Med. 2013; 26(4): 470-477.
4. ford Es, croft JB, Mannino DM, wheaton ag, Zhang X, giles wh. coPD surveillance—United states, 1999-2011. Chest. 2013; 144(1): 284-305.
5. centers for Disease control and Prevention. national center for health statistics. health Data interactive. www.cdc.gov/nchs/hdi.htm. accessed June 13, 2016.
6. Brfss Prevalence & Trends Data. 2015. centers for Disease control and Prevention. http://nccd.cdc.gov/Brfss.Prevalence/ rdPage.aspx?rdreport=DPh_Brfss.ExploreByTopic&islclass=class03&islTopic=Topic14&islYear=2014. accessed June 13, 2016.
7. Martinez fJ, raczek aE, seifer fD, et al. Development and initial validation of a self-scored coPD population screener questionnaire (coPD-Ps). COPD. 2008; 5:85-95.
a st h m a a n d c h r o n i c o b st r u c t i v e p u l m o n a ry d i s e a s e 1 7
Asthma and chronic obstructive pulmonary disease
prevalence (standard error)
male female
prevalence (standard error)
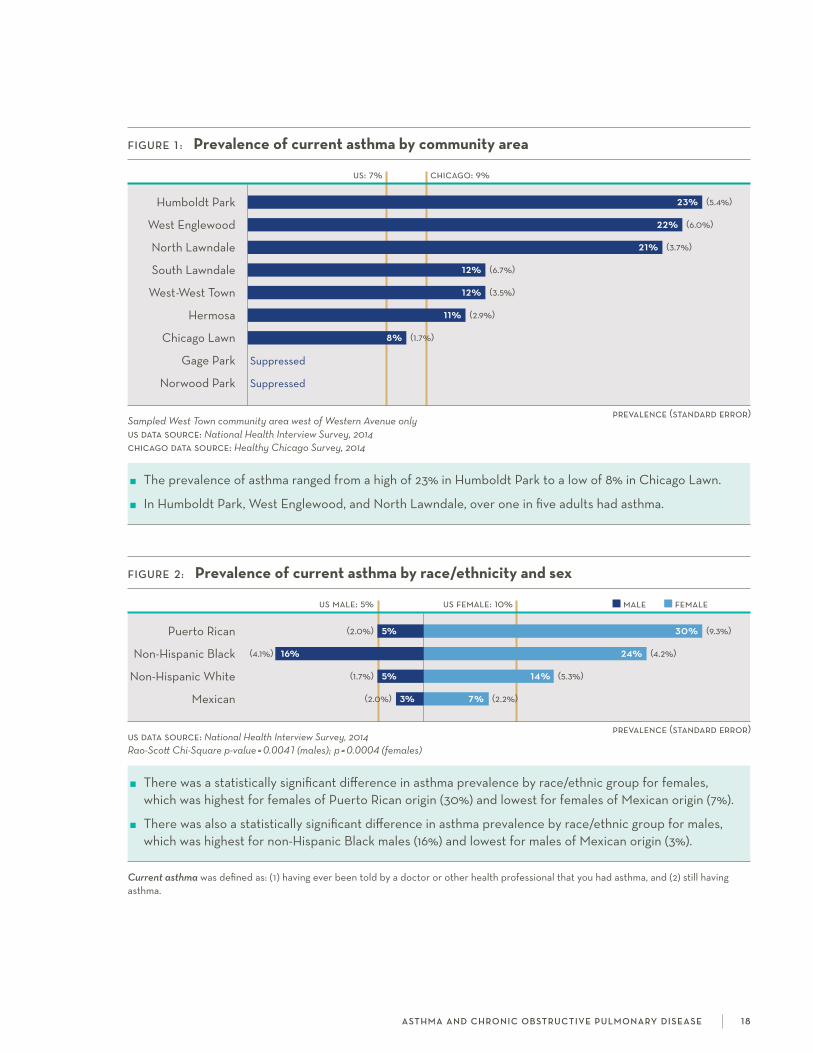
FiGure 2: Prevalence of current asthma by race/ethnicity and sex
us male: 5% us female: 10%
Puerto rican (2.0%) 5% 30% (9.3%)
non-hispanic Black (4.1%) 16% 24% (4.2%)
non-hispanic white (1.7%) 5% 14% (5.3%)
Mexican (2.0%) 3% 7% (2.2%)
us data source: National Health Interview Survey, 2014 Rao-Scott Chi-Square p-value = 0.0041 (males); p = 0.0004 (females)
There was a statistically significant difference in asthma prevalence by race/ethnic group for females, which was highest for females of Puerto rican origin (30%) and lowest for females of Mexican origin (7%).
There was also a statistically significant difference in asthma prevalence by race/ethnic group for males, which was highest for non-hispanic Black males (16%) and lowest for males of Mexican origin (3%).
Current asthma was defined as: (1) having ever been told by a doctor or other health professional that you had asthma, and (2) still having asthma.
a st h m a a n d c h r o n i c o b st r u c t i v e p u l m o n a ry d i s e a s e 1 8
FiGure 1 : Prevalence of current asthma by community area
us: 7% chicago: 9%
humboldt Park 23% (5.4%)
west Englewood 22% (6.0%)
north lawndale 21% (3.7%)
south lawndale 12% (6.7%)
west-west Town 12% (3.5%)
hermosa 11% (2.9%)
chicago lawn 8% (1.7%)
gage Park suppressed
norwood Park suppressed
Sampled West Town community area west of Western Avenue onlyus data source: National Health Interview Survey, 2014 chicago data source: Healthy Chicago Survey, 2014
The prevalence of asthma ranged from a high of 23% in humboldt Park to a low of 8% in chicago lawn.
in humboldt Park, west Englewood, and north lawndale, over one in five adults had asthma.
male female
prevalence (standard error)
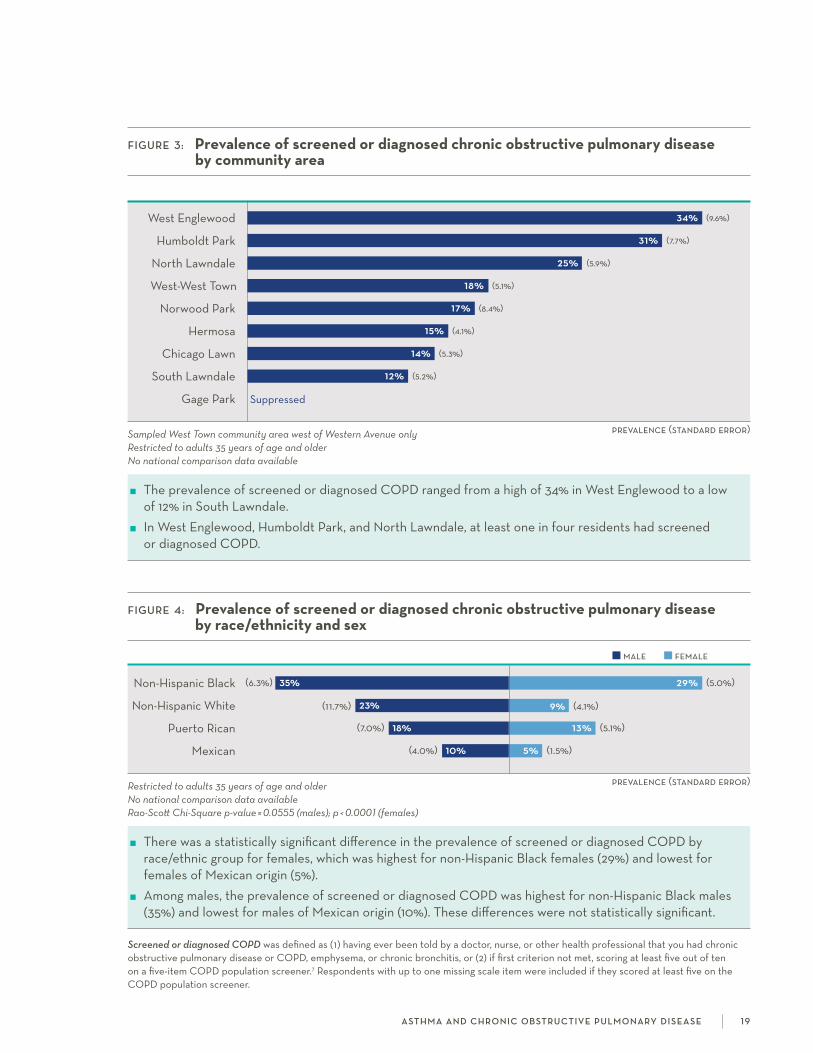
FiGure 4: Prevalence of screened or diagnosed chronic obstructive pulmonary disease by race/ethnicity and sex
non-hispanic Black (6.3%) 35% 29% (5.0%)
non-hispanic white (11.7%) 23% 9% (4.1%)
Puerto rican (7.0%) 18% 13% (5.1%)
Mexican (4.0%) 10% 5% (1.5%)
Restricted to adults 35 years of age and olderNo national comparison data availableRao-Scott Chi-Square p-value = 0.0555 (males); p < 0.0001 (females)
There was a statistically significant difference in the prevalence of screened or diagnosed coPD by race/ethnic group for females, which was highest for non-hispanic Black females (29%) and lowest for females of Mexican origin (5%).
among males, the prevalence of screened or diagnosed coPD was highest for non-hispanic Black males (35%) and lowest for males of Mexican origin (10%). These differences were not statistically significant.
Screened or diagnosed COPD was defined as (1) having ever been told by a doctor, nurse, or other health professional that you had chronic obstructive pulmonary disease or coPD, emphysema, or chronic bronchitis, or (2) if first criterion not met, scoring at least five out of ten on a five-item coPD population screener.7 respondents with up to one missing scale item were included if they scored at least five on the coPD population screener.
a st h m a a n d c h r o n i c o b st r u c t i v e p u l m o n a ry d i s e a s e 1 9
prevalence (standard error)
FiGure 3: Prevalence of screened or diagnosed chronic obstructive pulmonary disease by community area
west Englewood 34% (9.6%)
humboldt Park 31% (7.7%)
north lawndale 25% (5.9%)
west-west Town 18% (5.1%)
norwood Park 17% (8.4%)
hermosa 15% (4.1%)
chicago lawn 14% (5.3%)
south lawndale 12% (5.2%)
gage Park suppressed
Sampled West Town community area west of Western Avenue onlyRestricted to adults 35 years of age and olderNo national comparison data available
The prevalence of screened or diagnosed coPD ranged from a high of 34% in west Englewood to a low of 12% in south lawndale.
in west Englewood, humboldt Park, and north lawndale, at least one in four residents had screened or diagnosed coPD.
over one in ten Us adults live with heart disease,1 which encompasses several heart conditions including coronary heart disease and heart attacks. heart disease is the
leading cause of death for adults in the Us.2 There are several known risk factors, including high blood pressure, a common condition in which the force of blood from the heart flowing through the arteries is too high.3,4 high cholesterol, another risk factor, is a high concentration of a waxy substance in the blood.5 Because these risk factors often do not have symptoms, but are treatable, it is important to get screened for them regularly.
WHiCH CommunitieS are moSt aFFeCteD?
one in six adults in west Englewood had been diagnosed with heart disease.
in west Englewood and north lawndale, nearly half of females had been diagnosed with high blood pressure.
Males in norwood Park had the highest diagnosed prevalence (42%) of high cholesterol.
WHo iS moSt aFFeCteD?
non-hispanic Black females and non-hispanic white males had the highest prevalence of diagnosed heart disease (both 16%).
over half of females of Puerto rican origin had been diagnosed with high blood pressure.
references 1. national health interview survey, 2015 data summary. Table a-1.
https://ftp.cdc.gov/pub/health_statistics/nchs/nhis/shs/2015_shs_Table_a-1.pdf. accessed December 20, 2016.
2. Xu J, Murphy sl, kochanek kD, Bastian Ba. national Vital statistics reports. Deaths: final data for 2013. 64(2). http://www.cdc.gov/nchs/data/nvsr/nvsr64/nvsr64_02.pdf. accessed December 20, 2016.
3. Mozaffarian D, Benjamins EJ, go as, et al. aha statistical update: heart disease and stroke statistics—2016 Update. Circulation. 2016;133(4).
4. The facts about high blood pressure. american heart association. https://www.heart.org/hEarTorg/conditions/ highBloodPressure/abouthighBloodPressure/The-facts-about-high-Blood-Pressure_UcM_002050_article.jsp. accessed December 20, 2016.
5. know the facts about high cholesterol. centers for Disease control and Prevention. https://www.cdc.gov/cholesterol/docs/consumered_cholesterol.pdf. accessed December 20, 2016.
ca r d i ova s cu l a r d i s e a s e 2 0
Cardiovascular disease

prevalence (standard error)
prevalence (standard error)
FiGure 1 : Prevalence of diagnosed heart disease by community area
west Englewood 17% (4.0%)
north lawndale 13% (4.2%)
south lawndale 8% (2.4%)
chicago lawn 8% (3.2%)
norwood Park 7% (2.4%)
hermosa 6% (2.3%)
humboldt Park 6% (1.8%)
west-west Town 4% (1.5%)
gage Park 3% (1.1%)
Sampled West Town community area west of Western Avenue onlyNo national comparison data available
in the nine communities surveyed, the prevalence of diagnosed heart disease ranged from a high of 17% in west Englewood to a low of 3% in gage Park.
in west Englewood, one in six adults had been diagnosed with heart disease.
male female
FiGure 2: Prevalence of diagnosed heart disease by race/ethnicity and sex
non-hispanic Black (2.1%) 8% 16% (3.2%)
non-hispanic white (5.6%) 16% 10% (3.7%)
Puerto rican (3.6%) 7% 5% (2.4%)
Mexican (1.3%) 3% 3% (1.2%)
No national comparison data available Rao-Scott Chi-Square p-value = 0.0031 (males); p = 0.0001 (females)
There was a statistically significant difference in the prevalence of diagnosed heart disease by race/ethnic group for females, which was highest for non-hispanic Black females (16%) and lowest for females of Mexican origin (3%).
There was also a statistically significant difference in the prevalence of diagnosed heart disease by race/ethnic group for males, which was highest for non-hispanic white males (16%) and lowest for males of Mexican origin (3%).
Diagnosed heart disease was defined as (1) having ever been told by a doctor or other health professional that you had congestive heart failure, or (2) having ever been told by a doctor or other health professional that you had any other kind of heart condition including coronary heart disease, angina, or heart attack.
ca r d i ova s cu l a r d i s e a s e 2 1

male female
prevalence (standard error)
prevalence (standard error)
male female
Diagnosed high blood pressure was defined as having ever been told by a doctor or other health professional that you had hypertension or high blood pressure.
ca r d i ova s cu l a r d i s e a s e 2 2
FiGure 4: Prevalence of diagnosed high blood pressure by race/ethnicity and sex
us male: 26% us female: 24%
Puerto rican (6.6%) 29% 57% (9.9%)
non-hispanic Black (4.9%) 28% 43% (4.1%)
Mexican (3.4%) 18% 27% (5.2%)
non-hispanic white (8.9%) 34% 15% (6.1%)
us data source: National Health Interview Survey, 2015 (age-adjusted) Rao-Scott Chi-Square p-value = 0.1135 (males); p = 0.0012 (females)
There was a statistically significant difference in the prevalence of diagnosed high blood pressure by race/ethnic group for females, which was highest for females of Puerto rican origin (57%) and lowest for non-hispanic white females (15%).
among males, the prevalence of diagnosed high blood pressure was highest for non-hispanic white males (34%) and lowest for males of Mexican origin (18%). These differences were not statistically significant.
FiGure 3: Prevalence of diagnosed high blood pressure by community area and sex
us male: 26% us female: 24%
west Englewood (8.2%) 27% 47% (8.5%)
north lawndale (6.9%) 27% 45% (6.3%)
humboldt Park (8.1%) 33% 43% (6.6%)
chicago lawn (7.3%) 19% 35% (6.6%)
south lawndale (5.0%) 22% 28% (7.9%)
gage Park (8.0%) 19% 26% (7.7%)
west-west Town (4.8%) 25% 25% (5.0%)
hermosa (4.1%) 13% 21% (5.3%)
norwood Park (11.8%) 31% 11% (6.6%)
Sampled West Town community area west of Western Avenue onlyus data source: National Health Interview Survey, 2015 (age-adjusted)
among females, the prevalence of diagnosed high blood pressure ranged from a high of 47% for females in west Englewood to a low of 11% for females in norwood Park.
among males, the prevalence of diagnosed high blood pressure ranged from a high of 33% for males in humboldt Park to a low of 13% for males in hermosa.

prevalence (standard error)
prevalence (standard error)
male female
FiGure 5: Prevalence of diagnosed high cholesterol by community area and sex
west Englewood (6.2%) 23% 41% (9.3%)
gage Park (9.7%) 31% 40% (6.1%)
hermosa (5.4%) 20% 39% (9.7%)
norwood Park (10.3%) 42% 38% (14.1%)
humboldt Park (6.1%) 23% 36% (8.0%)
west-west Town (6.9%) 27% 29% (6.2%)
chicago lawn (9.0%) 24% 27% (4.3%)
south lawndale (4.2%) 22% 26% (8.7%)
north lawndale (8.1%) 28% 20% (6.7%)
Sampled West Town community area west of Western Avenue onlyNo national comparison data available
among females, the prevalence of diagnosed high cholesterol ranged from a high of 41% for females in west Englewood to a low of 20% for females in north lawndale.
among males, the prevalence of diagnosed high cholesterol ranged from a high of 42% for males in norwood Park to a low of 20% for males in hermosa.
FiGure 6: Prevalence of diagnosed high cholesterol by race/ethnicity and sex
Puerto rican (6.9%) 28% 44% (11.0%)
non-hispanic white (8.0%) 36% 30% (8.0%)
non-hispanic Black (4.1%) 25% 27% (4.4%)
Mexican (4.2%) 27% 25% (3.2%)
No national comparison data available Rao-Scott Chi-Square p-value = 0.5312 (males); p = 0.3572 (females)
among females, the prevalence of diagnosed high cholesterol was highest for females of Puerto rican origin (44%) and lowest for females of Mexican origin (25%).
among males, the prevalence of diagnosed high cholesterol was highest for non-hispanic white males (36%) and lowest for non-hispanic Black males (25%).
The differences in the prevalence of diagnosed high cholesterol by race/ethnic group were not statistically significant for males or females.
male female
Diagnosed high cholesterol was defined as (1) having ever had your blood cholesterol checked, and (2) having ever been told by a doctor, nurse or other health professional that your blood cholesterol is high.
ca r d i ova s cu l a r d i s e a s e 2 3

diabetes is a chronic medical condition characterized by high blood sugar levels. it is highly prevalent in the Us, with over 29 million adults having either diagnosed or
undiagnosed diabetes.1 not only is diabetes the seventh leading cause of death for americans, but it has huge direct and indirect costs (estimated to be $245 billion in 2012) due to increased use of health resources and decreased productivity.1-3 knowing one’s risk factors (such as family history) and being tested regularly are important ways to address this growing health problem.
WHiCH CommunitieS are moSt aFFeCteD?
about one quarter of males in chicago lawn and females in south lawndale had been diagnosed with diabetes.
in chicago lawn, hermosa, south lawndale, and gage Park, about half of adults had a family history of diabetes.
only 29% of males in south lawndale had a blood test to screen for diabetes in the past three years.
WHo iS moSt aFFeCteD?
one in four females of Puerto rican origin had been diagnosed with diabetes.
over half of adults of Puerto rican or Mexican origin had a family history of diabetes.
references 1. centers for Disease control and Prevention. national Diabetes statistics report: Estimates of diabetes and its burden
in the United states, 2014. in: services UsDohah, ed. atlanta, ga. 2014.
2. Menke a, casagrande s, geiss l, cowie cc. Prevalence of and trends in diabetes among adults in the United states, 1988-2012. JAMA. 2015;314(10):1021-1029.
3. american Diabetes association. Economic costs of diabetes in the Us in 2012. Diabetes Care. 2013;36(4):1033-1046.
d i a b e t e s 2 5
Diabetes

prevalence (standard error)
male female
prevalence (standard error)
male female
FiGure 2: Prevalence of diagnosed diabetes by race/ethnicity and sex
us male: 9% us female: 8%
Puerto rican (5.0%) 16% 25% (10.6%)
Mexican (4.1%) 15% 13% (3.1%)
non-hispanic Black (3.5%) 12% 11% (2.2%)
non-hispanic white (2.1%) 5% 7% (3.7%)
us data source: Behavioral Health Interview Survey, 2015 (age-adjusted) Rao-Scott Chi-Square p-value = 0.2462 (males); p = 0.2304 (females)
among females, the prevalence of diagnosed diabetes was highest for females of Puerto rican origin (25%) and lowest for non-hispanic white females (7%).
among males, the prevalence of diagnosed diabetes was highest for males of Puerto rican origin (16%) and lowest for non-hispanic white males (5%).
The differences in the prevalence of diagnosed diabetes by race/ethnic group were not statistically significant for males or females.
Diagnosed diabetes was defined as having ever been told by a doctor or other health professional that you have diabetes or sugar diabetes, excluding during pregnancy. Borderline diabetes was not classified as diagnosed diabetes.
d i a b e t e s 2 6
FiGure 1: Prevalence of diagnosed diabetes by community area and sex
us male: 9% us female: 8%
chicago lawn (8.5%) 28% 8% (3.1%)
north lawndale (7.2%) 11% 9% (2.1%)
gage Park (6.6%) 11% 17% (9.8%)
west Englewood (5.3%) 10% 16% (5.6%)
south lawndale (2.9%) 9% 24% (9.8%)
humboldt Park (2.7%) 8% 16% (5.3%)
west-west Town (3.7%) 8% 11% (4.0%)
hermosa (2.7%) 5% 10% (2.8%)
norwood Park suppressed suppressed
Sampled West Town community area west of Western Avenue onlyus data source: National Health Interview Survey, 2015 (age-adjusted)
among females, the prevalence of diagnosed diabetes ranged from a high of 24% for females in south lawndale to a low of 8% for females in chicago lawn.
among males, the prevalence of diagnosed diabetes ranged from a high of 28% for males in chicago lawn to a low of 5% for males in hermosa.
prevalence (standard error)
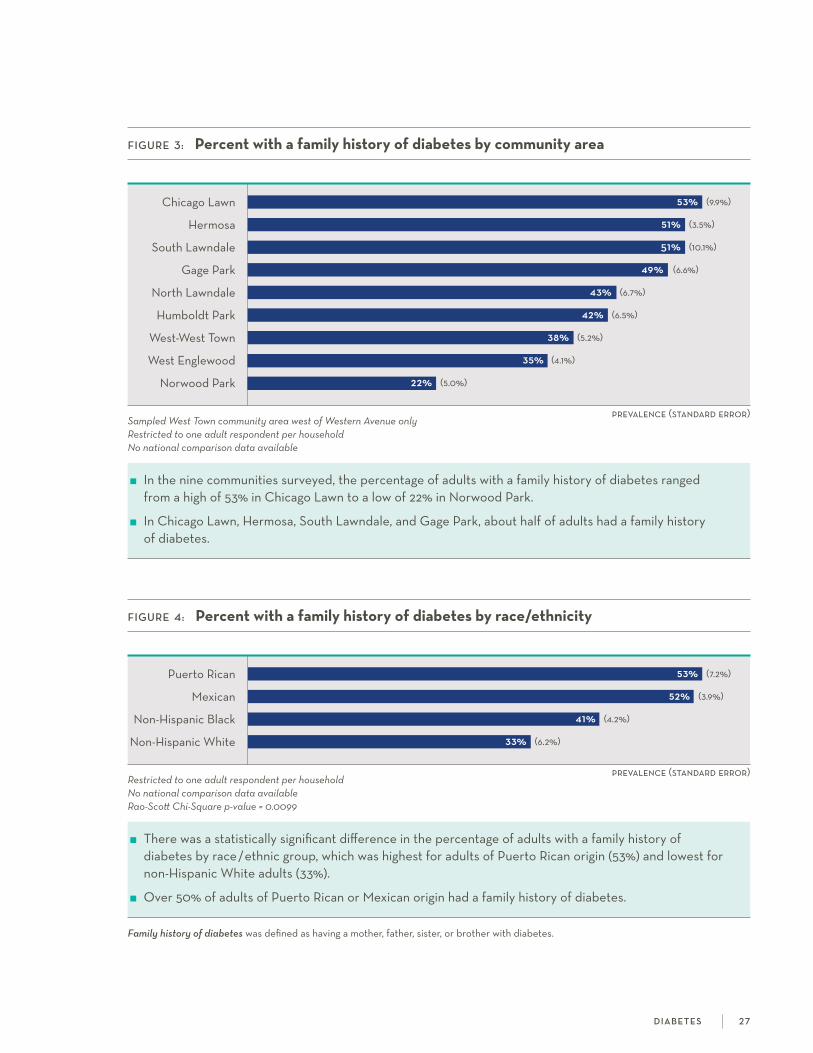
FiGure 3: Percent with a family history of diabetes by community area
chicago lawn 53% (9.9%)
hermosa 51% (3.5%)
south lawndale 51% (10.1%)
gage Park 49% (6.6%)
north lawndale 43% (6.7%)
humboldt Park 42% (6.5%)
west-west Town 38% (5.2%)
west Englewood 35% (4.1%)
norwood Park 22% (5.0%)
Sampled West Town community area west of Western Avenue onlyRestricted to one adult respondent per householdNo national comparison data available
in the nine communities surveyed, the percentage of adults with a family history of diabetes ranged from a high of 53% in chicago lawn to a low of 22% in norwood Park.
in chicago lawn, hermosa, south lawndale, and gage Park, about half of adults had a family history of diabetes.
d i a b e t e s 2 7
prevalence (standard error)
FiGure 4: Percent with a family history of diabetes by race/ethnicity
Puerto rican 53% (7.2%)
Mexican 52% (3.9%)
non-hispanic Black 41% (4.2%)
non-hispanic white 33% (6.2%)
Restricted to one adult respondent per householdNo national comparison data availableRao-Scott Chi-Square p-value = 0.0099
There was a statistically significant difference in the percentage of adults with a family history of diabetes by race/ethnic group, which was highest for adults of Puerto rican origin (53%) and lowest for non-hispanic white adults (33%).
over 50% of adults of Puerto rican or Mexican origin had a family history of diabetes.
Family history of diabetes was defined as having a mother, father, sister, or brother with diabetes.
prevalence (standard error)
male female
prevalence (standard error)
male female
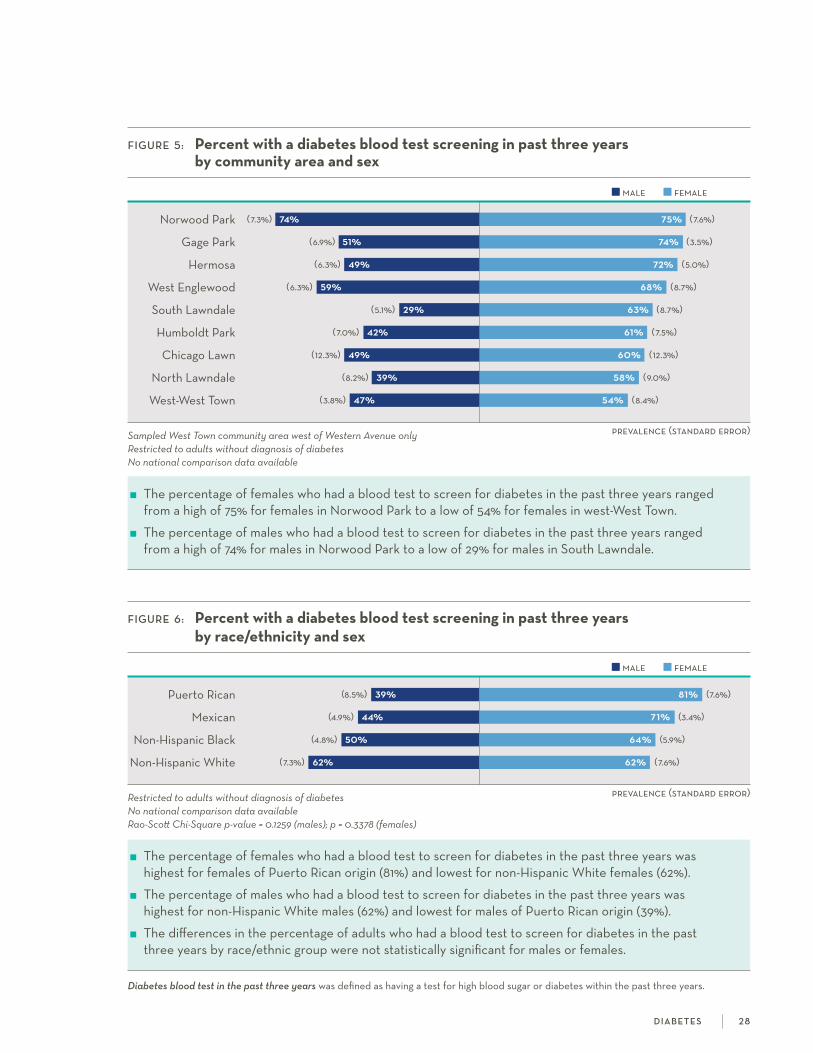
FiGure 6: Percent with a diabetes blood test screening in past three years by race/ethnicity and sex
Puerto rican (8.5%) 39% 81% (7.6%)
Mexican (4.9%) 44% 71% (3.4%)
non-hispanic Black (4.8%) 50% 64% (5.9%)
non-hispanic white (7.3%) 62% 62% (7.6%)
Restricted to adults without diagnosis of diabetesNo national comparison data availableRao-Scott Chi-Square p-value = 0.1259 (males); p = 0.3378 (females)
The percentage of females who had a blood test to screen for diabetes in the past three years was highest for females of Puerto rican origin (81%) and lowest for non-hispanic white females (62%).
The percentage of males who had a blood test to screen for diabetes in the past three years was highest for non-hispanic white males (62%) and lowest for males of Puerto rican origin (39%).
The differences in the percentage of adults who had a blood test to screen for diabetes in the past three years by race/ethnic group were not statistically significant for males or females.
Diabetes blood test in the past three years was defined as having a test for high blood sugar or diabetes within the past three years.
d i a b e t e s 2 8
FiGure 5: Percent with a diabetes blood test screening in past three years by community area and sex
norwood Park (7.3%) 74% 75% (7.6%)
gage Park (6.9%) 51% 74% (3.5%)
hermosa (6.3%) 49% 72% (5.0%)
west Englewood (6.3%) 59% 68% (8.7%)
south lawndale (5.1%) 29% 63% (8.7%)
humboldt Park (7.0%) 42% 61% (7.5%)
chicago lawn (12.3%) 49% 60% (12.3%)
north lawndale (8.2%) 39% 58% (9.0%)
west-west Town (3.8%) 47% 54% (8.4%)
Sampled West Town community area west of Western Avenue onlyRestricted to adults without diagnosis of diabetesNo national comparison data available
The percentage of females who had a blood test to screen for diabetes in the past three years ranged from a high of 75% for females in norwood Park to a low of 54% for females in west-west Town.
The percentage of males who had a blood test to screen for diabetes in the past three years ranged from a high of 74% for males in norwood Park to a low of 29% for males in south lawndale.
depression and anxiety are two of the most common mental disorders in the Us, affecting 17% and 29% of adults over the course of a lifetime, respectively.1 anxiety
disorders include symptoms such as excessive worry and may limit an individual’s ability to perform everyday tasks.2 Depressive disorders, characterized by persistent depressed mood or sadness, are associated with higher rates of chronic disease, increased health care utilization, and substantial economic burden ($211 billion in 2010).3,4 Understanding the prevalence of depression and anxiety is necessary in order to generate greater resources and target interventions to address these common conditions.
WHiCH CommunitieS are moSt aFFeCteD?
one in four adults in west-west Town had ever been diagnosed with depression.
in humboldt Park and north lawndale, one in six adults had current depression symptoms.
in the neighboring communities of humboldt Park and west-west Town, about one in five adults had current anxiety symptoms.
WHo iS moSt aFFeCteD?
among females of Puerto rican origin, 37% had ever been diagnosed with depression and 24% had current depression symptoms.
about one in four adults of Puerto rican origin had current anxiety symptoms.
references 1. kessler rc, Berglund P, Demler o, Jin r, Merikangas kr, walters EE. lifetime prevalence and age-of-onset distributions of DsM-iV
disorders in the national comorbidity survey replication. Arch Gen Psychiatry. 2005;62(6):593-602.
2. Mental health: anxiety. centers for Disease control and Prevention. http://www.cdc.gov/mentalhealth/basics/mental-illness/anxiety.htm. accessed December 20, 2016.
3. Mental health: Depression. centers for Disease control and Prevention. http://www.cdc.gov/mentalhealth/basics/mental-illness/depression.htm. accessed December 20, 2016.
4. greenberg PE, fournier aa, sisitsky T, Pike cT, kessler rc. The economic burden of adults with major depressive disorder in the United states (2005 and 2010). J Clin Psychiatry. 2015 feb;76(2):155-62.
5. spitzer rl, kroenke k, williams JBw. Validation and utility of a self-report version of PriME-MD: The PhQ Primary care study. JAMA. 1999;282:1737-1744.
6. kroenke k, spitzer rl, williams JBw, Monahan Po, lowe B. anxiety disorders in primary care: Prevalence, impairment, comorbidity, and detection. Ann Intern Med. 2007;146:317-325.
d e p r e s s i o n a n d a n x i e t y 2 9
Depression and anxiety

prevalence (standard error)
prevalence (standard error)
male female
Diagnosed depression was defined as having ever been told by a doctor, nurse, or other health professional that you had a depressive disorder, including depression, major depression, dysthymia, or minor depression.
d e p r e s s i o n a n d a n x i e t y 3 0
FiGure 1 : Prevalence of diagnosed depression by community area
chicago: 17% us: 19%
west-west Town 25% (4.6%)
humboldt Park 19% (3.7%)
south lawndale 17% (4.1%)
north lawndale 16% (4.6%)
norwood Park 14% (3.4%)
gage Park 14% (5.4%)
hermosa 13% (2.8%)
chicago lawn 10% (3.2%)
west Englewood 9% (2.6%)
Sampled West Town community area west of Western Avenue onlyus data source: Behavioral Risk Factor Surveillances System, 2015 chicago data source: Healthy Chicago Survey, 2014
in the nine communities surveyed, the prevalence of diagnosed depression ranged from a high of 25% in west-west Town to a low of 9% in west Englewood.
in west-west Town, one in four adults had been diagnosed with depression.
FiGure 2: Prevalence of diagnosed depression by race/ethnicity and sex
us male: 11% us female: 21%
Puerto rican (4.5%) 12% 37% (10.6%)
non-hispanic white (3.9%) 18% 22% (4.9%)
Mexican (2.5%) 6% 19% (3.7%)
non-hispanic Black (3.2%) 13% 15% (2.8%)
us data source: Behavioral Risk Factor Surveillance System, 2008 Rao-Scott Chi-Square p-value = 0.0519 (males); p = 0.0713 (females)
among females, the prevalence of diagnosed depression was highest for females of Puerto rican origin (37%) and lowest for non-hispanic Black females (15%).
among males, the prevalence of diagnosed depression was highest for non-hispanic white males (18%) and lowest for males of Mexican origin (6%).
The differences in the prevalence of diagnosed depression by race/ethnic group were not statistically significant for males or females.
prevalence (standard error)
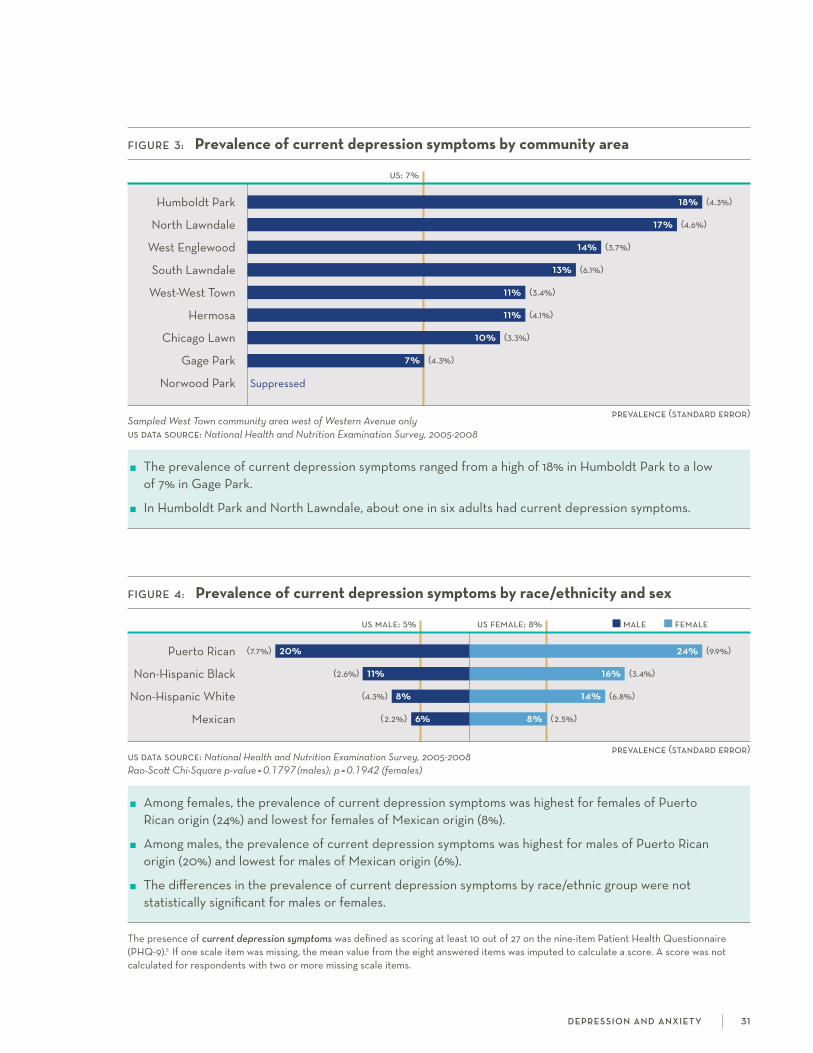
FiGure 3: Prevalence of current depression symptoms by community area
us: 7%
humboldt Park 18% (4.3%)
north lawndale 17% (4.6%)
west Englewood 14% (3.7%)
south lawndale 13% (6.1%)
west-west Town 11% (3.4%)
hermosa 11% (4.1%)
chicago lawn 10% (3.3%)
gage Park 7% (4.3%)
norwood Park suppressed
Sampled West Town community area west of Western Avenue onlyus data source: National Health and Nutrition Examination Survey, 2005-2008
The prevalence of current depression symptoms ranged from a high of 18% in humboldt Park to a low of 7% in gage Park.
in humboldt Park and north lawndale, about one in six adults had current depression symptoms.
male female
prevalence (standard error)
FiGure 4: Prevalence of current depression symptoms by race/ethnicity and sex
us male: 5% us female: 8%
Puerto rican (7.7%) 20% 24% (9.9%)
non-hispanic Black (2.6%) 11% 16% (3.4%)
non-hispanic white (4.3%) 8% 14% (6.8%)
Mexican (2.2%) 6% 8% (2.5%)
us data source: National Health and Nutrition Examination Survey, 2005-2008 Rao-Scott Chi-Square p-value = 0.1797 (males); p = 0.1942 (females)
among females, the prevalence of current depression symptoms was highest for females of Puerto rican origin (24%) and lowest for females of Mexican origin (8%).
among males, the prevalence of current depression symptoms was highest for males of Puerto rican origin (20%) and lowest for males of Mexican origin (6%).
The differences in the prevalence of current depression symptoms by race/ethnic group were not statistically significant for males or females.
The presence of current depression symptoms was defined as scoring at least 10 out of 27 on the nine-item Patient health Questionnaire (PhQ-9).5 if one scale item was missing, the mean value from the eight answered items was imputed to calculate a score. a score was not calculated for respondents with two or more missing scale items.
d e p r e s s i o n a n d a n x i e t y 3 1
prevalence (standard error)
male female
prevalence (standard error)
The presence of current anxiety symptoms was defined as scoring at least three out of six on the two-item generalized anxiety Disorder scale (gaD-2).6 respondents with up to one missing scale item were included if they scored at least three on the scale.
d e p r e s s i o n a n d a n x i e t y 32
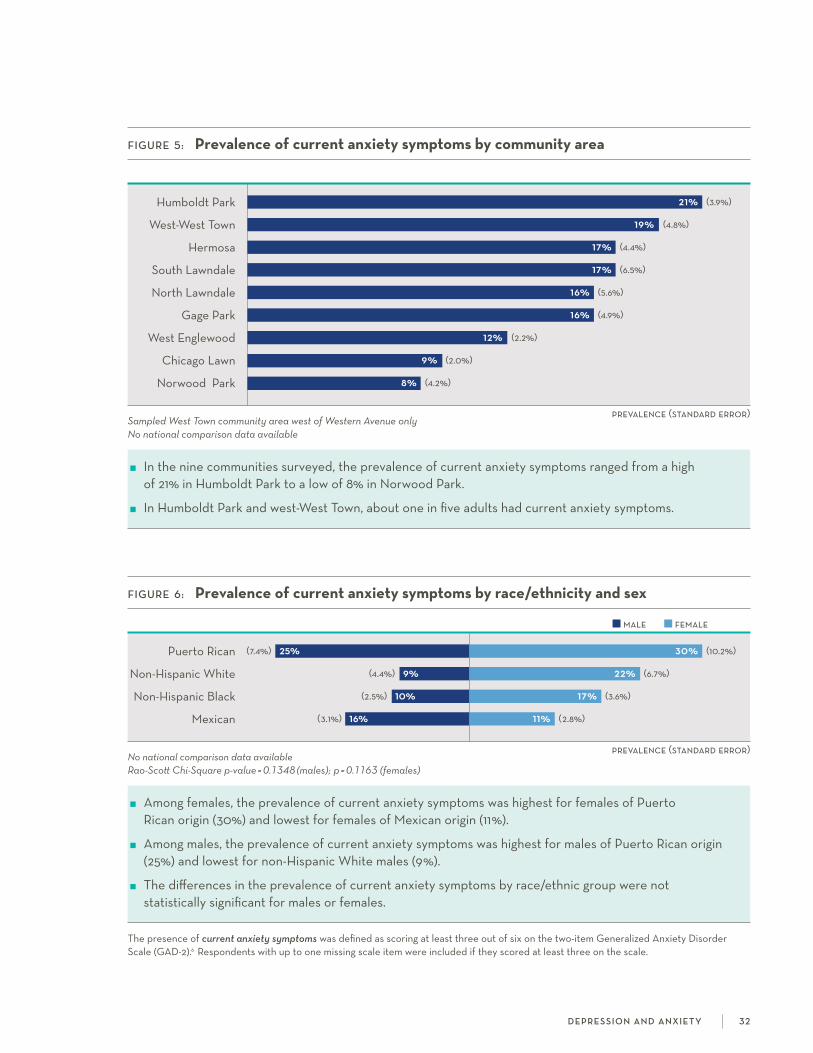
FiGure 6: Prevalence of current anxiety symptoms by race/ethnicity and sex
Puerto rican (7.4%) 25% 30% (10.2%)
non-hispanic white (4.4%) 9% 22% (6.7%)
non-hispanic Black (2.5%) 10% 17% (3.6%)
Mexican (3.1%) 16% 11% (2.8%)
No national comparison data available Rao-Scott Chi-Square p-value = 0.1348 (males); p = 0.1163 (females)
among females, the prevalence of current anxiety symptoms was highest for females of Puerto rican origin (30%) and lowest for females of Mexican origin (11%).
among males, the prevalence of current anxiety symptoms was highest for males of Puerto rican origin (25%) and lowest for non-hispanic white males (9%).
The differences in the prevalence of current anxiety symptoms by race/ethnic group were not statistically significant for males or females.
FiGure 5: Prevalence of current anxiety symptoms by community area
humboldt Park 21% (3.9%)
west-west Town 19% (4.8%)
hermosa 17% (4.4%)
south lawndale 17% (6.5%)
north lawndale 16% (5.6%)
gage Park 16% (4.9%)
west Englewood 12% (2.2%)
chicago lawn 9% (2.0%)
norwood Park 8% (4.2%)
Sampled West Town community area west of Western Avenue onlyNo national comparison data available
in the nine communities surveyed, the prevalence of current anxiety symptoms ranged from a high of 21% in humboldt Park to a low of 8% in norwood Park.
in humboldt Park and west-west Town, about one in five adults had current anxiety symptoms.

Post-traumatic stress disorder (PTsD) is an intense, recurrent emotional response to a traumatic incident, with symptoms such as reliving the event through flashbacks and
nightmares, avoidance, and increased arousal.1 PTsD can be triggered by a number of adverse life events, including abuse, physical or sexual assault, and combat exposure.2 over the course of a lifetime, about 7% of adults in the Us experience PTsD.3 individuals with PTsD often have additional mental and physical health issues such as anxiety and substance use disorders,4 and obesity and diabetes.5
WHiCH CommunitieS are moSt aFFeCteD?
in the neighboring communities of west-west Town and humboldt Park, at least one in ten adults had been diagnosed with PTsD.
at least one in four females in humboldt Park and north lawndale had current PTsD symptoms.
WHo iS moSt aFFeCteD?
among adults of Puerto rican origin, about one in six had been diagnosed with PTsD and one in three had current PTsD symptoms.
about one in five non-hispanic Black adults had current PTsD symptoms.
references 1. coping with a traumatic event. centers for Disease control and prevention. https://www.cdc.gov/masstrauma/factsheets/public/coping.
pdf. accessed January 19, 2017.
2. Post-traumatic stress disorder: risk factors. Mayo clinic. http://www.mayoclinic.org/diseases-conditions/post-traumatic-stress-disorder/basics/risk-factors/con-20022540. accessed January 19, 2017.
3. kessler rc, Berglund P, Demler o, et al. lifetime prevalence and age-of-onset distributions of DsM-iV disorders in the national comorbidity survey replication. Arch Gen Psychiatry. 2005; 62: 593-602.
4. kessler rc, sonnega a, Bromet E, et al. Posttraumatic stress disorder in the national comorbidity survey. Arch Gen Psychiatry. 1995; 52: 1048-1060.
5. farr oM, ko B-J, Joung kE, et al. Posttraumatic stress disorder, alone or additively with early life adversity, is associated with obesity and cardiometabolic risk. Nutr Metab Cardiovasc Dis. 2015; 25(5): 479-488.
6. ruggiero kJ, Del Ben k, scotti Jr, rabalais aE. Psychometric properties of the PTsD checklist–civilian version. J Trauma Stress. 2003; 16(5): 495-502.
p ost-t rau m at i c st r e s s d i s o r d e r 3 3
Post-traumatic stress disorder
prevalence (standard error)
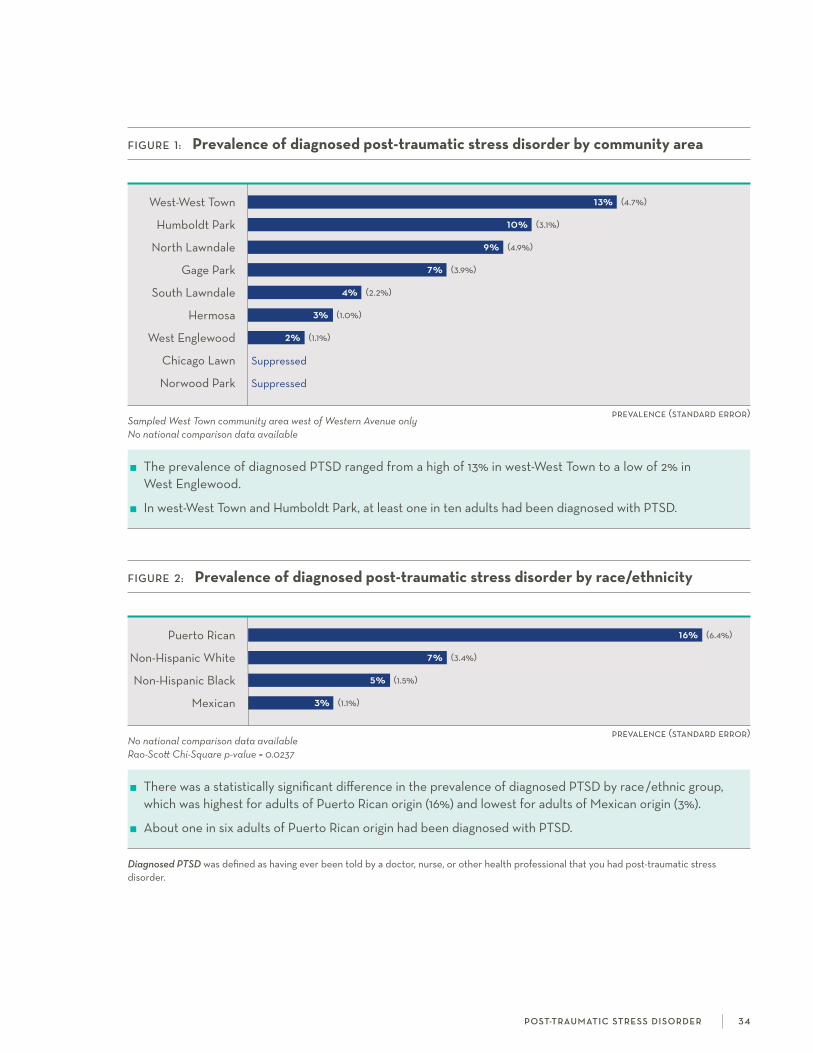
Diagnosed PTSD was defined as having ever been told by a doctor, nurse, or other health professional that you had post-traumatic stress disorder.
prevalence (standard error)
FiGure 1: Prevalence of diagnosed post-traumatic stress disorder by community area
west-west Town 13% (4.7%)
humboldt Park 10% (3.1%)
north lawndale 9% (4.9%)
gage Park 7% (3.9%)
south lawndale 4% (2.2%)
hermosa 3% (1.0%)
west Englewood 2% (1.1%)
chicago lawn suppressed
norwood Park suppressed
Sampled West Town community area west of Western Avenue onlyNo national comparison data available
The prevalence of diagnosed PTsD ranged from a high of 13% in west-west Town to a low of 2% in west Englewood.
in west-west Town and humboldt Park, at least one in ten adults had been diagnosed with PTsD.
p ost-t rau m at i c st r e s s d i s o r d e r 3 4
FiGure 2: Prevalence of diagnosed post-traumatic stress disorder by race/ethnicity
Puerto rican 16% (6.4%)
non-hispanic white 7% (3.4%)
non-hispanic Black 5% (1.5%)
Mexican 3% (1.1%)
No national comparison data availableRao-Scott Chi-Square p-value = 0.0237
There was a statistically significant difference in the prevalence of diagnosed PTsD by race/ethnic group, which was highest for adults of Puerto rican origin (16%) and lowest for adults of Mexican origin (3%).
about one in six adults of Puerto rican origin had been diagnosed with PTsD.
male female
prevalence (standard error)
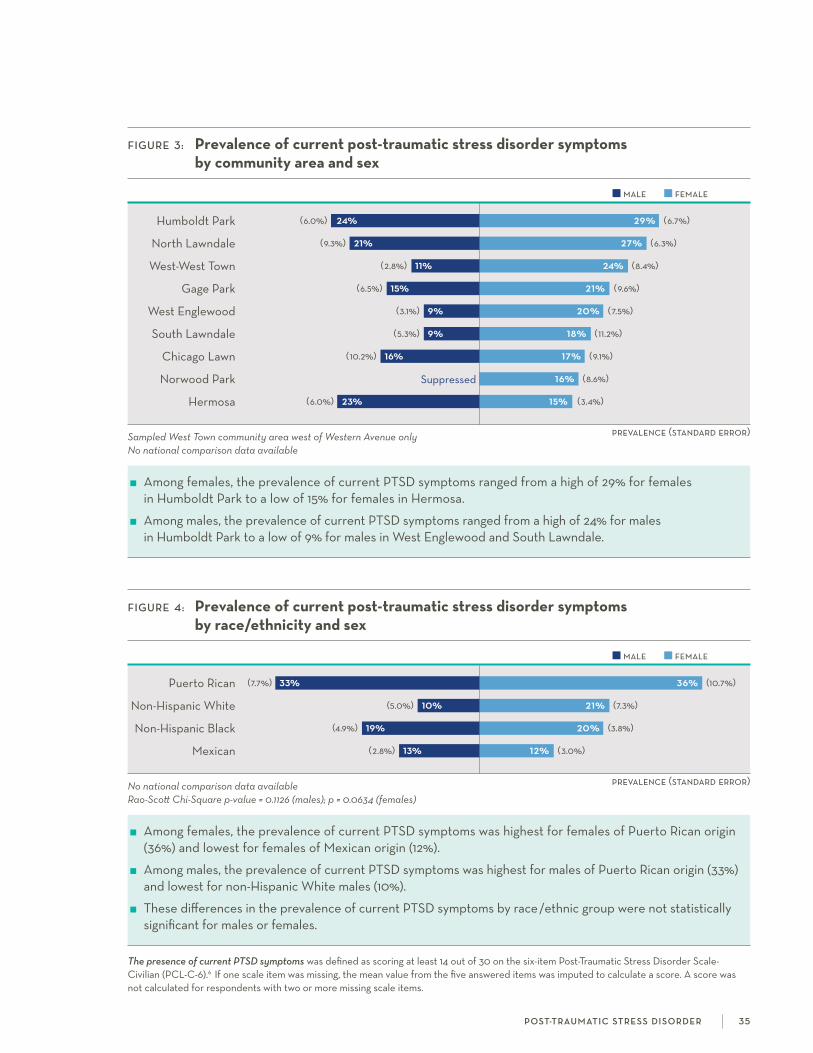
FiGure 3: Prevalence of current post-traumatic stress disorder symptoms by community area and sex
humboldt Park (6.0%) 24% 29% (6.7%)
north lawndale (9.3%) 21% 27% (6.3%)
west-west Town (2.8%) 11% 24% (8.4%)
gage Park (6.5%) 15% 21% (9.6%)
west Englewood (3.1%) 9% 20% (7.5%)
south lawndale (5.3%) 9% 18% (11.2%)
chicago lawn (10.2%) 16% 17% (9.1%)
norwood Park suppressed 16% (8.6%)
hermosa (6.0%) 23% 15% (3.4%)
Sampled West Town community area west of Western Avenue onlyNo national comparison data available
among females, the prevalence of current PTsD symptoms ranged from a high of 29% for females in humboldt Park to a low of 15% for females in hermosa.
among males, the prevalence of current PTsD symptoms ranged from a high of 24% for males in humboldt Park to a low of 9% for males in west Englewood and south lawndale.
male female
prevalence (standard error)
FiGure 4: Prevalence of current post-traumatic stress disorder symptoms by race/ethnicity and sex
Puerto rican (7.7%) 33% 36% (10.7%)
non-hispanic white (5.0%) 10% 21% (7.3%)
non-hispanic Black (4.9%) 19% 20% (3.8%)
Mexican (2.8%) 13% 12% (3.0%)
No national comparison data availableRao-Scott Chi-Square p-value = 0.1126 (males); p = 0.0634 (females)
among females, the prevalence of current PTsD symptoms was highest for females of Puerto rican origin (36%) and lowest for females of Mexican origin (12%).
among males, the prevalence of current PTsD symptoms was highest for males of Puerto rican origin (33%) and lowest for non-hispanic white males (10%).
These differences in the prevalence of current PTsD symptoms by race/ethnic group were not statistically significant for males or females.
The presence of current PTSD symptoms was defined as scoring at least 14 out of 30 on the six-item Post-Traumatic stress Disorder scale- civilian (Pcl-c-6).6 if one scale item was missing, the mean value from the five answered items was imputed to calculate a score. a score was not calculated for respondents with two or more missing scale items.
p ost-t rau m at i c st r e s s d i s o r d e r 3 5

infants born preterm (<37 weeks) or low birth weight (<2500 grams or 5 pounds, 8 ounces) are at increased risk of immediate life-threatening health problems, long-term complica-
tions, developmental delays, and infant mortality.1 when combined, preterm and low birth weight are the second leading cause of infant mortality (nearly 18% of deaths).2 in the Us in 2014, approximately one in ten live births was preterm and 8% of births were low birth weight.3 important risk factors for these associated adverse birth outcomes include maternal age, nutrition, smoking, prenatal care, infection, and stress.1
WHiCH CommunitieS are moSt aFFeCteD?
among north lawndale females who had at least one live birth, about one in three ever had a baby born prematurely and one in four ever had a low birth weight baby.
in south lawndale and west-west Town, over 20% of females who had at least one live birth ever had a baby born prematurely.
WHo iS moSt aFFeCteD?
among non-hispanic Black females who had at least one live birth, 22% ever had a baby born prematurely and 16% ever had a low birth weight baby.
The percentage of females who ever had a low birth weight baby was nearly three times as high for non-hispanic Black females compared to non-hispanic white females.
references 1. institute of Medicine committee on Understanding Premature Birth and assuring healthy outcomes. The national academies collec-
tion: reports funded by national institutes of health. in: Behrman rE, Butler as, eds. Preterm birth: causes, consequences, and prevention. washington (Dc): national academies Press national academy of sciences; 2007.
2. heron M. Deaths: leading causes for 2013. Natl Vital Stat Rep. 2016; 65(2): 1-95.
3. hamilton BE, Martin Ja, osterman MJk, et al. Births: final data for 2014. national vital statistics reports; 64(12). hyattsville, MD: national center for health statistics. 2015.
i n fa n t h e a lt h 3 6
Infant health
prevalence (standard error)
prevalence (standard error)
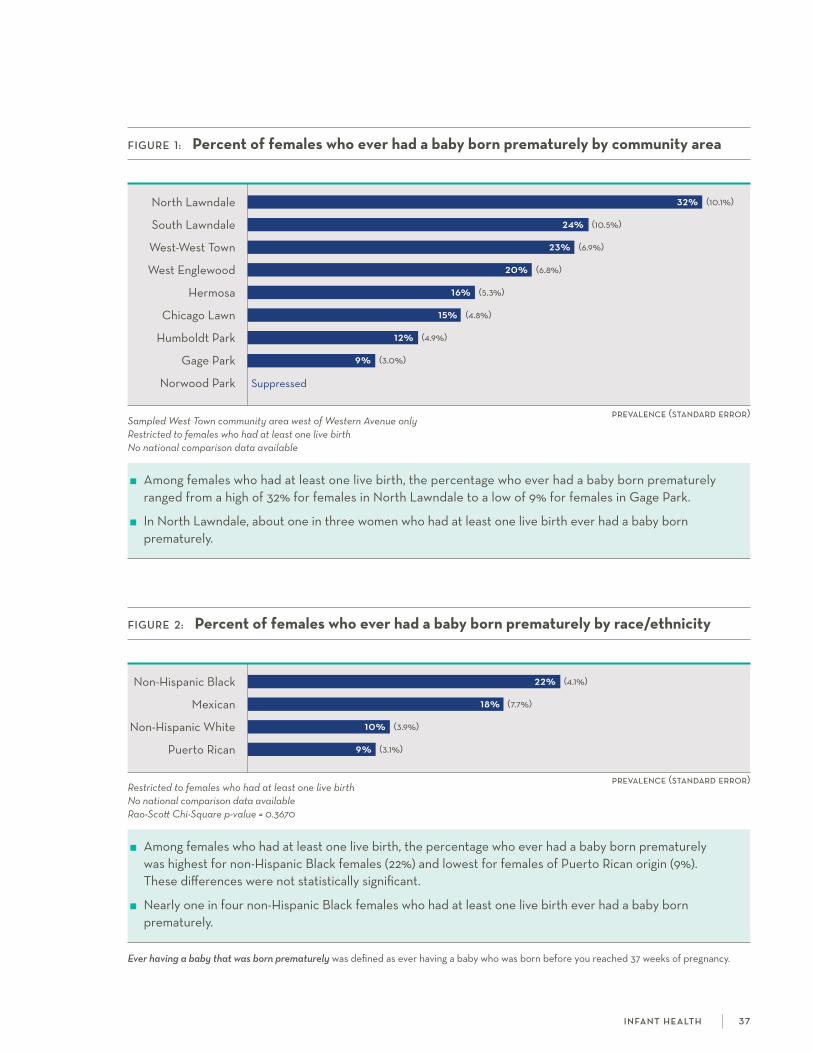
FiGure 1: Percent of females who ever had a baby born prematurely by community area
north lawndale 32% (10.1%)
south lawndale 24% (10.5%)
west-west Town 23% (6.9%)
west Englewood 20% (6.8%)
hermosa 16% (5.3%)
chicago lawn 15% (4.8%)
humboldt Park 12% (4.9%)
gage Park 9% (3.0%)
norwood Park suppressed
Sampled West Town community area west of Western Avenue onlyRestricted to females who had at least one live birth No national comparison data available
among females who had at least one live birth, the percentage who ever had a baby born prematurely ranged from a high of 32% for females in north lawndale to a low of 9% for females in gage Park.
in north lawndale, about one in three women who had at least one live birth ever had a baby born prematurely.
FiGure 2: Percent of females who ever had a baby born prematurely by race/ethnicity
non-hispanic Black 22% (4.1%)
Mexican 18% (7.7%)
non-hispanic white 10% (3.9%)
Puerto rican 9% (3.1%)
Restricted to females who had at least one live birth No national comparison data availableRao-Scott Chi-Square p-value = 0.3670
among females who had at least one live birth, the percentage who ever had a baby born prematurely was highest for non-hispanic Black females (22%) and lowest for females of Puerto rican origin (9%). These differences were not statistically significant.
nearly one in four non-hispanic Black females who had at least one live birth ever had a baby born prematurely.
Ever having a baby that was born prematurely was defined as ever having a baby who was born before you reached 37 weeks of pregnancy.
i n fa n t h e a lt h 3 7
prevalence (standard error)
prevalence (standard error)
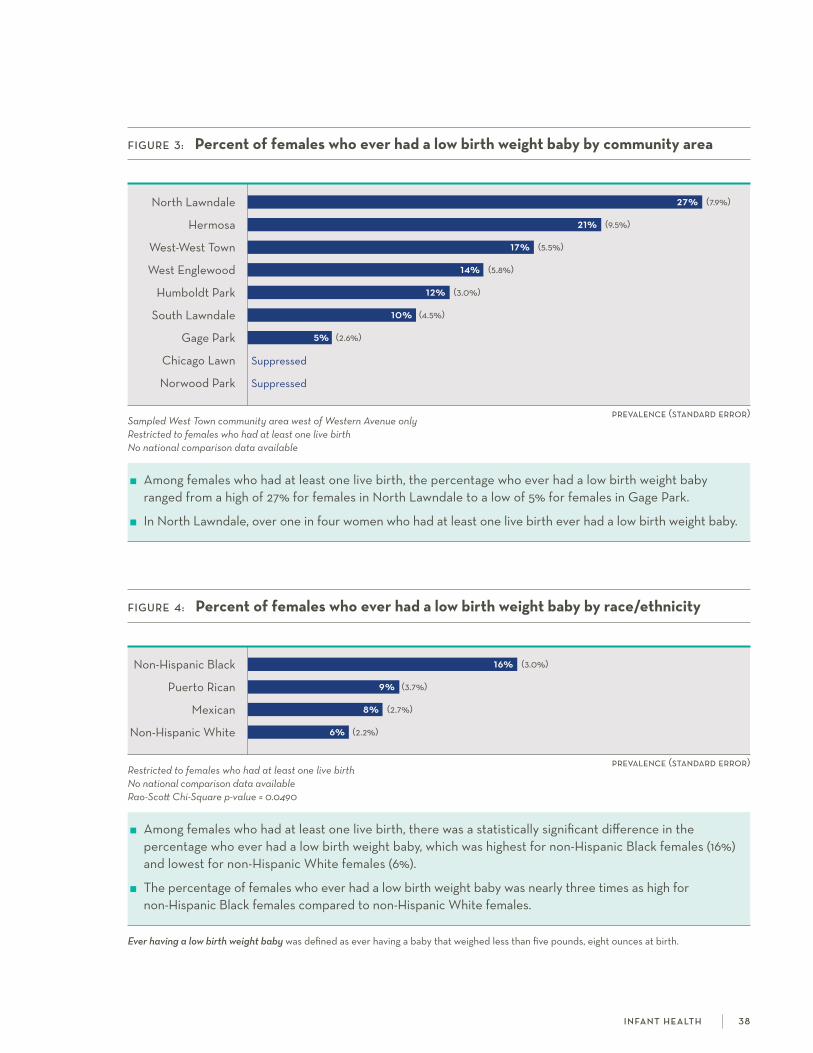
Ever having a low birth weight baby was defined as ever having a baby that weighed less than five pounds, eight ounces at birth.
FiGure 3: Percent of females who ever had a low birth weight baby by community area
north lawndale 27% (7.9%)
hermosa 21% (9.5%)
west-west Town 17% (5.5%)
west Englewood 14% (5.8%)
humboldt Park 12% (3.0%)
south lawndale 10% (4.5%)
gage Park 5% (2.6%)
chicago lawn suppressed
norwood Park suppressed
Sampled West Town community area west of Western Avenue onlyRestricted to females who had at least one live birth No national comparison data available
among females who had at least one live birth, the percentage who ever had a low birth weight baby ranged from a high of 27% for females in north lawndale to a low of 5% for females in gage Park.
in north lawndale, over one in four women who had at least one live birth ever had a low birth weight baby.
FiGure 4: Percent of females who ever had a low birth weight baby by race/ethnicity
non-hispanic Black 16% (3.0%)
Puerto rican 9% (3.7%)
Mexican 8% (2.7%)
non-hispanic white 6% (2.2%)
Restricted to females who had at least one live birth No national comparison data availableRao-Scott Chi-Square p-value = 0.0490
among females who had at least one live birth, there was a statistically significant difference in the percentage who ever had a low birth weight baby, which was highest for non-hispanic Black females (16%) and lowest for non-hispanic white females (6%).
The percentage of females who ever had a low birth weight baby was nearly three times as high for non-hispanic Black females compared to non-hispanic white females.
i n fa n t h e a lt h 3 8

references 1. U.s. Department of health and human services. The health consequences of smoking: 50 years of progress. A report of the Surgeon
General. atlanta, ga: U.s. Department of health and human services, centers for Disease control and Prevention, national center for chronic Disease Prevention and health Promotion, office on smoking and health, 2014. https://www.surgeongeneral.gov/library/reports/50-years-of-progress/full-report.pdf. accessed December 20, 2016.
2. Xu X, Bishop EE, kennedy sM, simpson sa, Pechacek Tf. annual healthcare spending attributable to cigarette smoking: an update. Am J Prev Med. 2014; 48(3): 326–333.
3. Burden of tobacco use: current cigarette smoking among U.s. adults aged 18 years and older in the U.s. centers for Disease control and Prevention web site. http://www.cdc.gov/tobacco/campaign/tips/resources/data/cigarette-smoking-in-united-states.html#by_education. accessed December 20, 2016.
4. centers for Disease control and Prevention. cigarette smoking among adults—United states, 2005-2015. Morb Mortal Wkly Rep. 2016; 65(44): 1205–1211.
5. centers for Disease control and Prevention. Quitting smoking among adults—United states, 2001-2010. Morb Mortal Wkly Rep. 2011; 60(44): 1513-1519.
s m o k i n g 4 0
tobacco use is the leading cause of preventable deaths in the Us, claiming more than 480,000 lives and contributing to over $320 billion in health care expenditures
and productivity losses annually.1-3 Despite promising reductions over the past five decades, 15% of Us adults continue to smoke, representing roughly 40 million americans.4 The majority of these individuals (69%) would like to quit and their efforts are increasingly aided by public health campaigns, cessation aids, and public policies (including tobacco taxes and smoke-free laws).5
WHiCH CommunitieS are moSt aFFeCteD?
west Englewood had the highest percentage of current smokers (56% for males and 47% for females), but also the highest percentage of smokers who were trying to quit (76%).
in west-west Town and gage Park, less than half of smokers were trying to quit.
WHo iS moSt aFFeCteD?
non-hispanic Black adults were the most likely to smoke (49% for males and 32% for females) and adults of Mexican origin were the least likely (19% for males and 6% for females).
among females of Puerto rican origin who currently smoke, 92% were trying to quit.
only 34% of non-hispanic white males who currently smoke were trying to quit.
Smoking
male female
prevalence (standard error)
prevalence (standard error)
male female
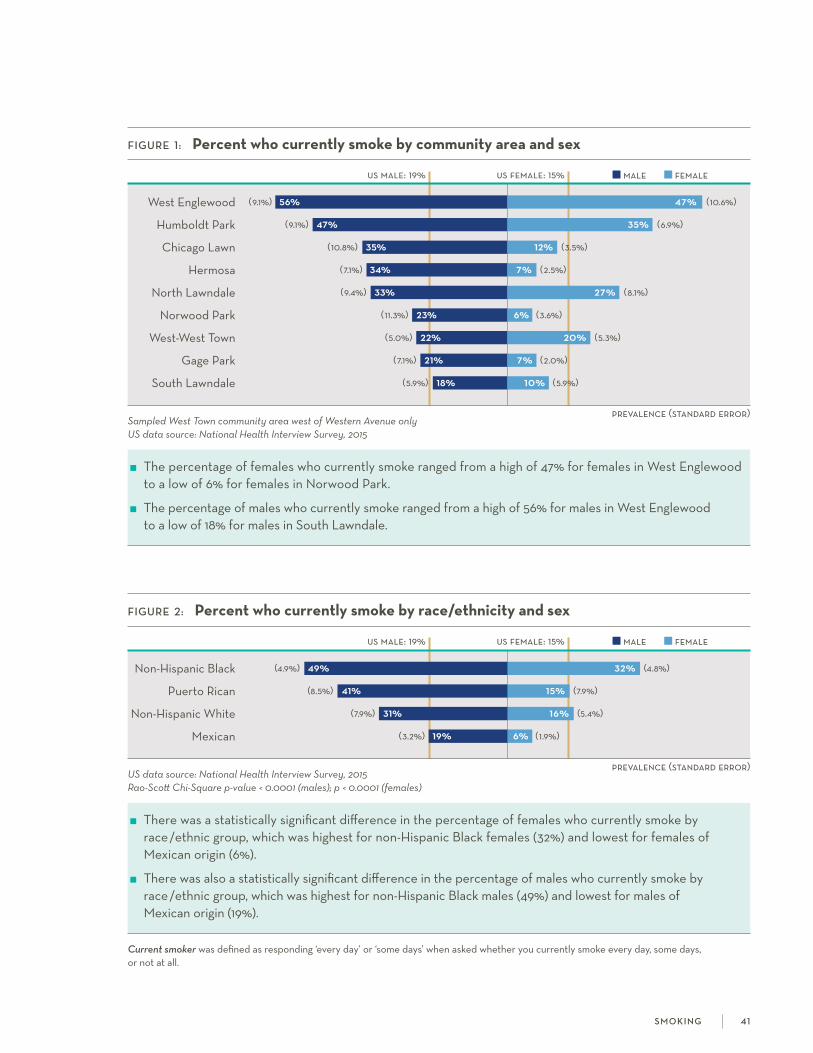
FiGure 1: Percent who currently smoke by community area and sex
us male: 19% us female: 15%
west Englewood (9.1%) 56% 47% (10.6%)
humboldt Park (9.1%) 47% 35% (6.9%)
chicago lawn (10.8%) 35% 12% (3.5%)
hermosa (7.1%) 34% 7% (2.5%)
north lawndale (9.4%) 33% 27% (8.1%)
norwood Park (11.3%) 23% 6% (3.6%)
west-west Town (5.0%) 22% 20% (5.3%)
gage Park (7.1%) 21% 7% (2.0%)
south lawndale (5.9%) 18% 10% (5.9%)
Sampled West Town community area west of Western Avenue onlyUS data source: National Health Interview Survey, 2015
The percentage of females who currently smoke ranged from a high of 47% for females in west Englewood to a low of 6% for females in norwood Park.
The percentage of males who currently smoke ranged from a high of 56% for males in west Englewood to a low of 18% for males in south lawndale.
FiGure 2: Percent who currently smoke by race/ethnicity and sex
us male: 19% us female: 15%
non-hispanic Black (4.9%) 49% 32% (4.8%)
Puerto rican (8.5%) 41% 15% (7.9%)
non-hispanic white (7.9%) 31% 16% (5.4%)
Mexican (3.2%) 19% 6% (1.9%)
US data source: National Health Interview Survey, 2015 Rao-Scott Chi-Square p-value < 0.0001 (males); p < 0.0001 (females)
There was a statistically significant difference in the percentage of females who currently smoke by race/ethnic group, which was highest for non-hispanic Black females (32%) and lowest for females of Mexican origin (6%).
There was also a statistically significant difference in the percentage of males who currently smoke by race/ethnic group, which was highest for non-hispanic Black males (49%) and lowest for males of Mexican origin (19%).
Current smoker was defined as responding ‘every day’ or ‘some days’ when asked whether you currently smoke every day, some days, or not at all.
s m o k i n g 4 1

prevalence (standard error)
male female
prevalence (standard error)
FiGure 3: Percent of smokers who were trying to quit by community area
west Englewood 76% (5.7%)
chicago lawn 64% (17.6%)
hermosa 62% (13.1%)
humboldt Park 62% (9.9%)
south lawndale 59% (12.9%)
north lawndale 57% (5.6%)
west-west Town 47% (10.1%)
gage Park 31% (12.2%)
norwood Park suppressed
Sampled West Town community area west of Western Avenue onlyNo national comparison data available
The percentage of smokers who were trying to quit ranged from a high of 76% in west Englewood to a low of 31% in gage Park.
in west-west Town and gage Park, less than half of smokers were trying to quit.
FiGure 4: Percent of smokers who were trying to quit by race/ethnicity and sex
Puerto rican (14.1%) 47% 92% (6.3%)
non-hispanic Black (6.6%) 69% 76% (5.2%)
Mexican (10.5%) 47% 46% (18.7%)
non-hispanic white (13.6%) 34% 44% (15.6%)
No national comparison data availableRao-Scott Chi-Square p-value = 0.0848 (males); p = 0.0455 (females)
There was a statistically significant difference in the percentage of female smokers who were trying to quit by race/ethnic group, which was highest for females of Puerto rican origin (92%) and lowest for non-hispanic white females (44%).
The percentage of male smokers who were trying to quit was highest for non-hispanic Black males (69%) and lowest for non-hispanic white males (34%). These differences were not statistically significant.
Trying to quit was defined as responding ‘currently trying to quit’ when asked whether you are currently trying to quit smoking or not currently trying to quit smoking.
s m o k i n g 42
Domestic violence, which includes rape, sexual assault, robbery, and aggravated assault committed by intimate partners, immediate family members, or other relatives, is a
major public health problem, accounting for 21% of all violent crime in the Us.1 intimate partner violence, which occurs between current or former spouses or dating partners, includes physical or sexual violence, stalking, and/or psychological aggression.2 one in three women in the Us is a victim of some form of physical violence by an intimate partner during her lifetime, with over 50% of female rape victims citing a domestic partner as the perpetrator.3 Many survivors of intimate partner violence experience gynecological and other physiological health problems, pregnancy complications, suicidal ideation, and substance abuse.3
WHiCH CommunitieS are moSt aFFeCteD?
Two out of three males in north lawndale reported ever witnessing domestic violence.
in west Englewood, humboldt Park, and north lawndale, about one in three females reported ever experiencing intimate partner violence.
WHo iS moSt aFFeCteD?
over half of non-hispanic Black adults and females of Puerto rican origin reported ever witnessing domestic violence.
over 40% of females of Puerto rican origin reported ever experiencing intimate partner violence.
references 1. Truman Jl, Morgan rE. nonfatal domestic violence, 2003-2012. 2014. http://www.bjs.gov/content/pub/pdf/ndv0312.pdf.
accessed December 20, 2016.
2. Understanding intimate Partner Violence. 2014. centers for Disease control and Prevention. national center for injury Prevention and control, Division of Violence Prevention. https://www.cdc.gov/violenceprevention/pdf/ipv-factsheet.pdf. accessed December 30, 2016.
3. Black Mc, Basile kc, Breiding MJ, smith sg, walters Ml, Merrick MT, chen, J, stevens, M. The national intimate partner and sexual violence survey: 2010 summary report. 2011. http://www.cdc.gov/violenceprevention/pdf/nisvs_report2010-a.pdf. accessed December 20, 2016.
d o m e st i c a n d i n t i m at e pa rt n e r v i o l e n c e 4 3
Domestic and intimate partner violence
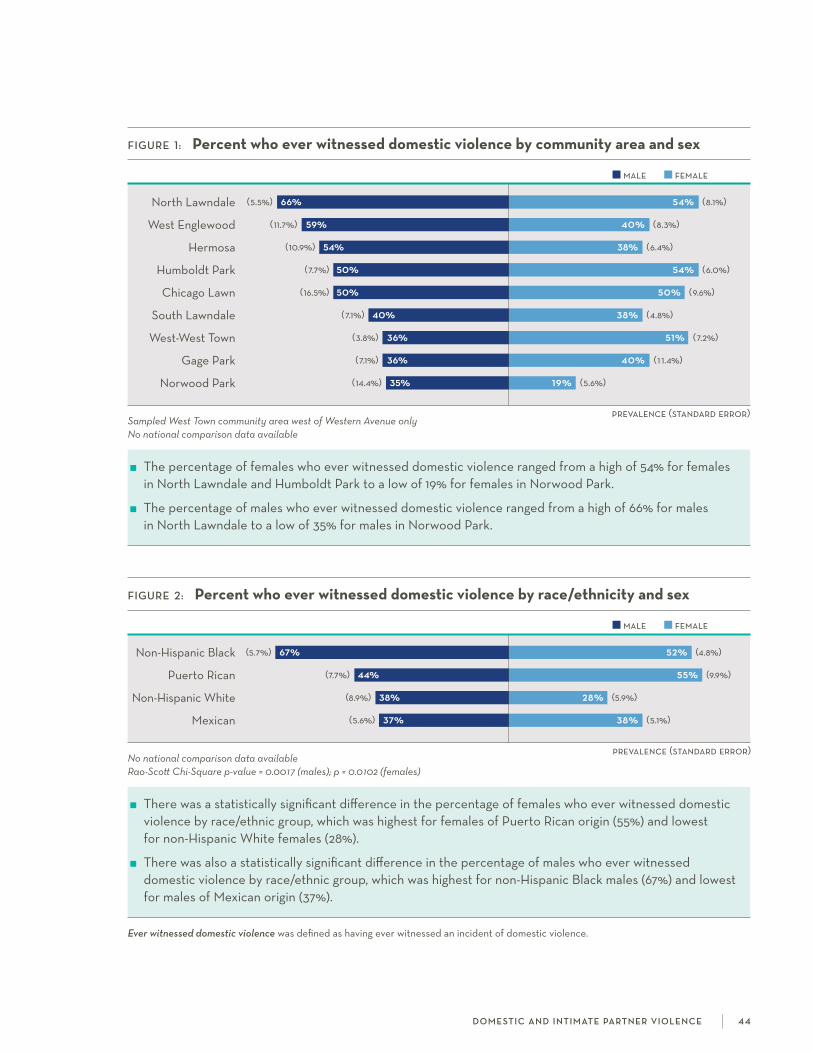
male female
prevalence (standard error)
FiGure 1: Percent who ever witnessed domestic violence by community area and sex
north lawndale (5.5%) 66% 54% (8.1%)
west Englewood (11.7%) 59% 40% (8.3%)
hermosa (10.9%) 54% 38% (6.4%)
humboldt Park (7.7%) 50% 54% (6.0%)
chicago lawn (16.5%) 50% 50% (9.6%)
south lawndale (7.1%) 40% 38% (4.8%)
west-west Town (3.8%) 36% 51% (7.2%)
gage Park (7.1%) 36% 40% (1 1.4%)
norwood Park (14.4%) 35% 19% (5.6%)
Sampled West Town community area west of Western Avenue onlyNo national comparison data available
The percentage of females who ever witnessed domestic violence ranged from a high of 54% for females in north lawndale and humboldt Park to a low of 19% for females in norwood Park.
The percentage of males who ever witnessed domestic violence ranged from a high of 66% for males in north lawndale to a low of 35% for males in norwood Park.
prevalence (standard error)
male female
FiGure 2: Percent who ever witnessed domestic violence by race/ethnicity and sex
non-hispanic Black (5.7%) 67% 52% (4.8%)
Puerto rican (7.7%) 44% 55% (9.9%)
non-hispanic white (8.9%) 38% 28% (5.9%)
Mexican (5.6%) 37% 38% (5.1%)
No national comparison data availableRao-Scott Chi-Square p-value = 0.0017 (males); p = 0.0102 (females)
There was a statistically significant difference in the percentage of females who ever witnessed domestic violence by race/ethnic group, which was highest for females of Puerto rican origin (55%) and lowest for non-hispanic white females (28%).
There was also a statistically significant difference in the percentage of males who ever witnessed domestic violence by race/ethnic group, which was highest for non-hispanic Black males (67%) and lowest for males of Mexican origin (37%).
Ever witnessed domestic violence was defined as having ever witnessed an incident of domestic violence.
d o m e st i c a n d i n t i m at e pa rt n e r v i o l e n c e 4 4
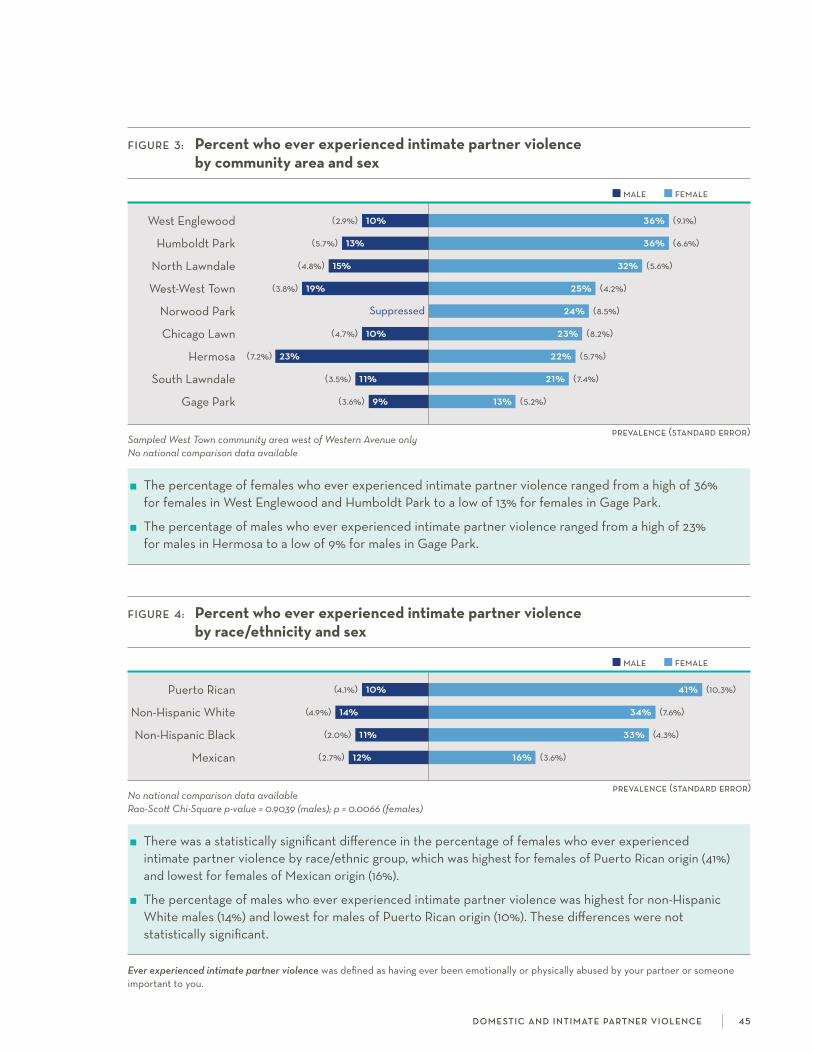
male female
prevalence (standard error)
FiGure 3: Percent who ever experienced intimate partner violence by community area and sex
west Englewood (2.9%) 10% 36% (9.1%)
humboldt Park (5.7%) 13% 36% (6.6%)
north lawndale (4.8%) 15% 32% (5.6%)
west-west Town (3.8%) 19% 25% (4.2%)
norwood Park suppressed 24% (8.5%)
chicago lawn (4.7%) 10% 23% (8.2%)
hermosa (7.2%) 23% 22% (5.7%)
south lawndale (3.5%) 11% 21% (7.4%)
gage Park (3.6%) 9% 13% (5.2%)
Sampled West Town community area west of Western Avenue onlyNo national comparison data available
The percentage of females who ever experienced intimate partner violence ranged from a high of 36% for females in west Englewood and humboldt Park to a low of 13% for females in gage Park.
The percentage of males who ever experienced intimate partner violence ranged from a high of 23% for males in hermosa to a low of 9% for males in gage Park.
prevalence (standard error)
male female
FiGure 4: Percent who ever experienced intimate partner violence by race/ethnicity and sex
Puerto rican (4.1%) 10% 41% (10.3%)
non-hispanic white (4.9%) 14% 34% (7.6%)
non-hispanic Black (2.0%) 11% 33% (4.3%)
Mexican (2.7%) 12% 16% (3.6%)
No national comparison data availableRao-Scott Chi-Square p-value = 0.9039 (males); p = 0.0066 (females)
There was a statistically significant difference in the percentage of females who ever experienced intimate partner violence by race/ethnic group, which was highest for females of Puerto rican origin (41%) and lowest for females of Mexican origin (16%).
The percentage of males who ever experienced intimate partner violence was highest for non-hispanic white males (14%) and lowest for males of Puerto rican origin (10%). These differences were not statistically significant.
Ever experienced intimate partner violence was defined as having ever been emotionally or physically abused by your partner or someone important to you.
d o m e st i c a n d i n t i m at e pa rt n e r v i o l e n c e 4 5
H ealth insurance is the primary vehicle through which most people finance their health care needs. The affordable care act enabled millions of americans to obtain health
insurance through the expansion of Medicaid and the provision of tax credits for signing up through health insurance marketplaces.1 insured individuals are more likely to utilize health services and have a usual place for medical care, and are less likely to have unmet health care needs; these are factors which, in turn, improve individual health outcomes and reduce overall health care costs.2-4 it is important to understand how individuals finance their health care needs in order to improve issues related to access, cost, and quality.
WHat are Key DiFFerenCeS at tHe Community level?
in south lawndale and hermosa, about one in three adults aged 18-64 years was uninsured.
over half of adults aged 18-64 years were covered by public insurance in west Englewood, humboldt Park, and north lawndale.
WHat are Key DiFFerenCeS by raCe /etHniC GrouP?
The percentage of adults aged 18-64 years without insurance was more than four times higher for adults of Mexican origin than non-hispanic white adults.
nearly two out of three non-hispanic Black adults aged 18-64 years were covered by public insurance.
references 1. garfield r, Majerol M, Young k. access to care for the insured and remaining uninsured: a look at california during year one of aca
implementation: an issue brief. 2015. henry J. kaiser family foundation. http://files.kff.org/attachment/issue-brief-access-to-care-for-the-insured-and-remaining-uninsured-a-look-at-california-during-year-one-of-aca-implementation. accessed December 20, 2016.
2. Villarroel Ma, cohen ra. health insurance continuity and health care access and utilization, 2014. nchs data brief, no 249. hyattsville, MD: national center for health statistics. 2016. http://www.cdc.gov/nchs/data/databriefs/db249.pdf. accessed December 20, 2016.
3. hoffman c, Paradise J. health insurance and access to health care in the United states. Ann N Y Acad Sci. 2008; 1136: 149–160.
4. wilper aP, woolhandler s, lasser kE, Mccormick D, Bor Dh, himmelstein DU. health insurance and mortality in Us adults. Am J Public Health. 2009; 99(12): 2289-2295.
h e a lt h i n s u ra n c e cov e rag e 4 6
Health insurance coverage
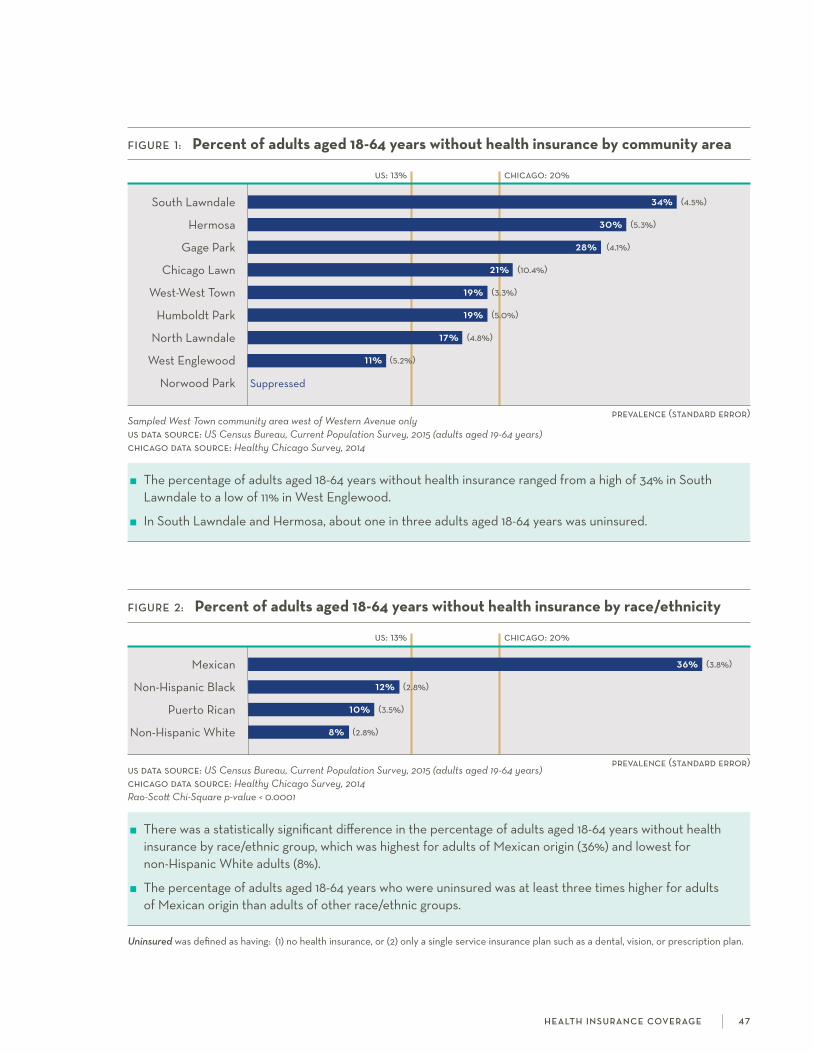
prevalence (standard error)
prevalence (standard error)
Uninsured was defined as having: (1) no health insurance, or (2) only a single service insurance plan such as a dental, vision, or prescription plan.
FiGure 1: Percent of adults aged 18-64 years without health insurance by community area
us: 13% chicago: 20%
south lawndale 34% (4.5%)
hermosa 30% (5.3%)
gage Park 28% (4.1%)
chicago lawn 21% (10.4%)
west-west Town 19% (3.3%)
humboldt Park 19% (5.0%)
north lawndale 17% (4.8%)
west Englewood 11% (5.2%)
norwood Park suppressed
Sampled West Town community area west of Western Avenue onlyus data source: US Census Bureau, Current Population Survey, 2015 (adults aged 19-64 years)chicago data source: Healthy Chicago Survey, 2014
The percentage of adults aged 18-64 years without health insurance ranged from a high of 34% in south lawndale to a low of 11% in west Englewood.
in south lawndale and hermosa, about one in three adults aged 18-64 years was uninsured.
FiGure 2: Percent of adults aged 18-64 years without health insurance by race/ethnicity
us: 13% chicago: 20%
Mexican 36% (3.8%)
non-hispanic Black 12% (2.8%)
Puerto rican 10% (3.5%)
non-hispanic white 8% (2.8%)
us data source: US Census Bureau, Current Population Survey, 2015 (adults aged 19-64 years)chicago data source: Healthy Chicago Survey, 2014Rao-Scott Chi-Square p-value < 0.0001
There was a statistically significant difference in the percentage of adults aged 18-64 years without health insurance by race/ethnic group, which was highest for adults of Mexican origin (36%) and lowest for non-hispanic white adults (8%).
The percentage of adults aged 18-64 years who were uninsured was at least three times higher for adults of Mexican origin than adults of other race/ethnic groups.
h e a lt h i n s u ra n c e cov e rag e 4 7

private public
prevalence (standard error)
FiGure 3: Percent of adults aged 18-64 years with private or public health insurance by community area
us private: 73% us public: 21%
norwood Park (9.5%) 80% 14% (6.4%)
west-west Town (5.4%) 53% 27% (4.0%)
chicago lawn (8.0%) 46% 32% (7.1%)
hermosa (5.6%) 34% 36% (4.1%)
gage Park (10.7%) 32% 37% (7.9%)
south lawndale (4.9%) 30% 35% (3.9%)
west Englewood (5.7%) 23% 66% (5.9%)
humboldt Park (5.3%) 23% 57% (7.8%)
north lawndale (4.7%) 22% 59% (5.7%)
Sampled West Town community area west of Western Avenue onlyus data source: US Census Bureau, Current Population Survey, 2015 (adults aged 19-64 years)
The percentage of adults aged 18-64 years with private health insurance ranged from a high of 80% in norwood Park to a low of 22% in north lawndale.
The percentage of adults aged 18-64 years with public health insurance ranged from a high of 66% in west Englewood to a low of 14% in norwood Park.
Private insurance was defined as having insurance coverage through (1) your employer, (2) someone else’s employer, (3) a plan that you or some- one else buys on your own, or (4) coBra. respondents who listed both private and public sources of insurance were labeled as privately insured. Public insurance was defined as having insurance coverage through (1) Medicare, (2) Medigap, (3) Medicaid [family care, Moms & Babies, county care], (4) Medicaid hMo, (5) Military health care, (6) indian health service, (7) state-sponsored health plan [e.g. illinois chiP], or (8) another government program.
prevalence (standard error)
private public
FiGure 4: Percent of adults aged 18-64 years with private or public health insurance by race/ethnicity
us private: 73% us public: 21%
non-hispanic white (6.0%) 76% 15% (4.5%)
Puerto rican (5.9%) 39% 51% (6.4%)
Mexican (4.3%) 34% 27% (2.8%)
non-hispanic Black (4.4%) 24% 64% (4.0%)
us data source: US Census Bureau, Current Population Survey, 2015 (adults aged 19-64 years)Rao-Scott Chi-Square p-value < 0.0001 (private insurance); p < 0.0001 (public insurance)
There was a statistically significant difference in the percentage of adults aged 18-64 years covered by private or public health insurance by race/ethnic group.
non-hispanic white adults had the highest percentage of 18-64 year-olds covered by private health insurance (76%), while non-hispanic Black adults had the highest percentage of 18-64 year-olds covered by public health insurance (64%).
h e a lt h i n s u ra n c e cov e rag e 4 8

appropriate use of health care services can lead to better health outcomes and reduced costs.1-3 To begin, patients with a usual source of care are more likely to have annual
check-ups, seek care promptly when ill, and receive preventive screenings.4 having a usual source of care has also been shown to positively influence a range of mental and physical health outcomes.2,3 routine check-ups, which are associated with increased use of preventive services, are particularly valuable for older adults and those with multiple chronic conditions or other risk factors.5 additionally, it is important to consider emergency department (ED) visits since high ED utilization rates may indicate lack of access to quality primary care. nearly one in five Us adults visits the ED each year, resulting in over 130 million visits annually.6,7
WHat are Key DiFFerenCeS at tHe Community level?
in west Englewood, hermosa, chicago lawn, and north lawndale, over 90% of females reported having a usual place of care.
in hermosa and south lawndale, less than half of males had a routine check-up in the past year.
WHat are Key DiFFerenCeS by raCe /etHniC GrouP?
Males of Mexican origin were the least likely to report having a usual place of care or having a routine check-up in the past year.
nearly half of non-hispanic Black adults visited an emergency room for their own care in the past year.
references 1. weinick rM, Burns rM, Mehrotra a. how many emergency department visits could be managed at urgent care centers and retail clinics?
Health Aff. 2010; 29(9): 1630-1636.
2. li c, Dick aw, fiscella k, conwell Y, friedman B. Effect of usual source of care on depression among Medicare beneficiaries: an application of a simultaneous-equations model. Health Serv Res. 2011; 46(4): 1059-1081.
3. spatz Es, sheth sD, gosch kl, et al. Usual source of care and outcomes following acute myocardial infarction. J Gen Intern Med. 2014; 29(6): 862-869.
4. Merzel c, Moon-howard J. access to health services in an urban community: Does source of care make a difference? J Urban Health. 2002; 79(2): 186-199.
5. Mehrotra a, Prochazka a. improving value in health care—against the annual physical. N Engl J Med. 2015; 373(16): 1485-1487.
6. national center for health statistics. health, United states, 2015: with special feature on racial and ethnic health disparities. hyattsville, MD. 2016. Table 74. http://www.cdc.gov/nchs/data/hus/hus15.pdf. accessed on December 20, 2016.
7. national center for health statistics. national hospital ambulatory Medical care survey, 2012. https://www.cdc.gov/nchs/data/ahcd/nhamcs_emergency/2012_ed_web_tables.pdf. accessed on December 20, 2016.
h e a lt h ca r e u t i l i z at i o n 49
Health care utilization
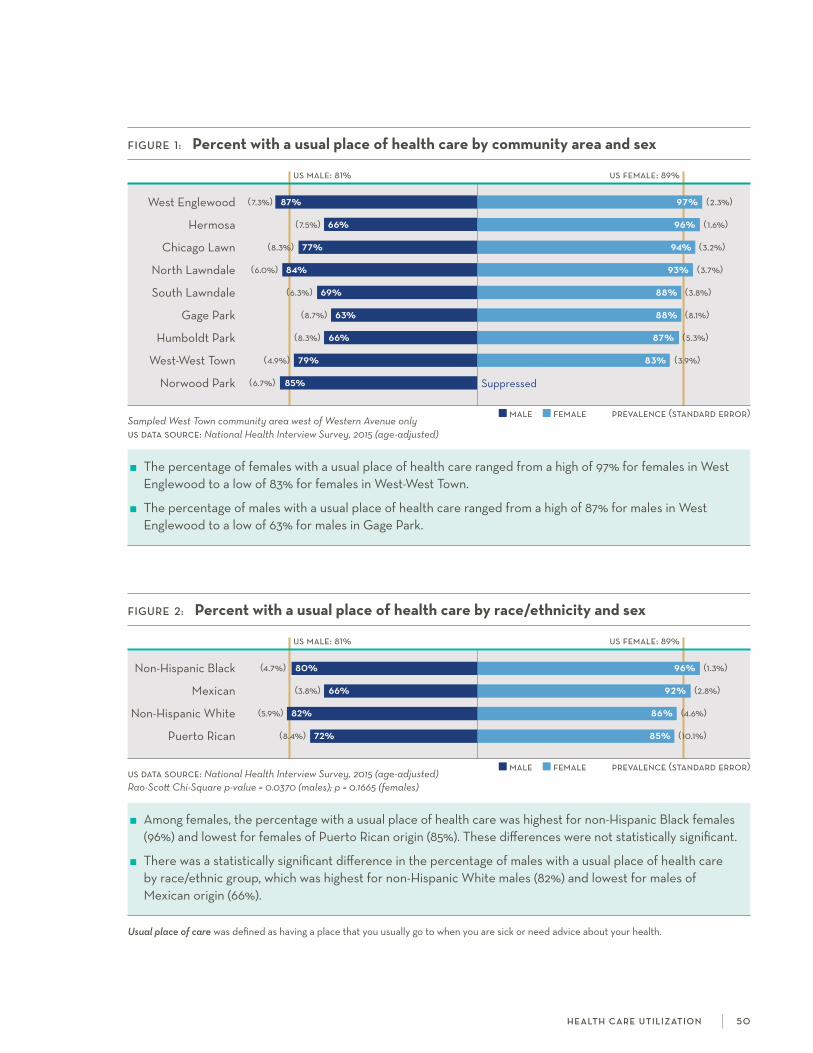
prevalence (standard error)
prevalence (standard error)
male female
male female
FiGure 2: Percent with a usual place of health care by race/ethnicity and sex
us male: 81% us female: 89%
non-hispanic Black (4.7%) 80% 96% (1.3%)
Mexican (3.8%) 66% 92% (2.8%)
non-hispanic white (5.9%) 82% 86% (4.6%)
Puerto rican (8.4%) 72% 85% (10.1%)
us data source: National Health Interview Survey, 2015 (age-adjusted)Rao-Scott Chi-Square p-value = 0.0370 (males); p = 0.1665 (females)
among females, the percentage with a usual place of health care was highest for non-hispanic Black females (96%) and lowest for females of Puerto rican origin (85%). These differences were not statistically significant.
There was a statistically significant difference in the percentage of males with a usual place of health care by race/ethnic group, which was highest for non-hispanic white males (82%) and lowest for males of Mexican origin (66%).
FiGure 1: Percent with a usual place of health care by community area and sex
us male: 81% us female: 89%
west Englewood (7.3%) 87% 97% (2.3%)
hermosa (7.5%) 66% 96% (1.6%)
chicago lawn (8.3%) 77% 94% (3.2%)
north lawndale (6.0%) 84% 93% (3.7%)
south lawndale (6.3%) 69% 88% (3.8%)
gage Park (8.7%) 63% 88% (8.1%)
humboldt Park (8.3%) 66% 87% (5.3%)
west-west Town (4.9%) 79% 83% (3.9%)
norwood Park (6.7%) 85% suppressed
Sampled West Town community area west of Western Avenue onlyus data source: National Health Interview Survey, 2015 (age-adjusted)
The percentage of females with a usual place of health care ranged from a high of 97% for females in west Englewood to a low of 83% for females in west-west Town.
The percentage of males with a usual place of health care ranged from a high of 87% for males in west Englewood to a low of 63% for males in gage Park.
Usual place of care was defined as having a place that you usually go to when you are sick or need advice about your health.
h e a lt h ca r e u t i l i z at i o n 5 0
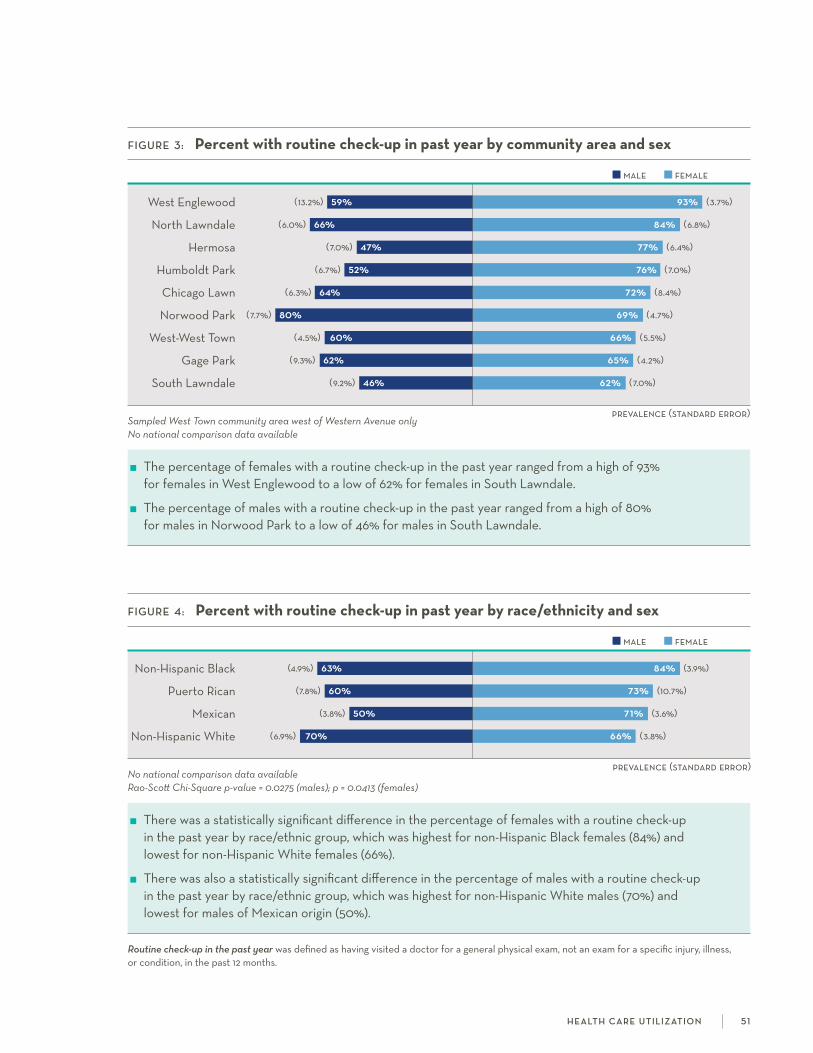
male female
prevalence (standard error)
prevalence (standard error)
male female
FiGure 3: Percent with routine check-up in past year by community area and sex
west Englewood (13.2%) 59% 93% (3.7%)
north lawndale (6.0%) 66% 84% (6.8%)
hermosa (7.0%) 47% 77% (6.4%)
humboldt Park (6.7%) 52% 76% (7.0%)
chicago lawn (6.3%) 64% 72% (8.4%)
norwood Park (7.7%) 80% 69% (4.7%)
west-west Town (4.5%) 60% 66% (5.5%)
gage Park (9.3%) 62% 65% (4.2%)
south lawndale (9.2%) 46% 62% (7.0%)
Sampled West Town community area west of Western Avenue onlyNo national comparison data available
The percentage of females with a routine check-up in the past year ranged from a high of 93% for females in west Englewood to a low of 62% for females in south lawndale.
The percentage of males with a routine check-up in the past year ranged from a high of 80% for males in norwood Park to a low of 46% for males in south lawndale.
FiGure 4: Percent with routine check-up in past year by race/ethnicity and sex
non-hispanic Black (4.9%) 63% 84% (3.9%)
Puerto rican (7.8%) 60% 73% (10.7%)
Mexican (3.8%) 50% 71% (3.6%)
non-hispanic white (6.9%) 70% 66% (3.8%)
No national comparison data availableRao-Scott Chi-Square p-value = 0.0275 (males); p = 0.0413 (females)
There was a statistically significant difference in the percentage of females with a routine check-up in the past year by race/ethnic group, which was highest for non-hispanic Black females (84%) and lowest for non-hispanic white females (66%).
There was also a statistically significant difference in the percentage of males with a routine check-up in the past year by race/ethnic group, which was highest for non-hispanic white males (70%) and lowest for males of Mexican origin (50%).
Routine check-up in the past year was defined as having visited a doctor for a general physical exam, not an exam for a specific injury, illness, or condition, in the past 12 months.
h e a lt h ca r e u t i l i z at i o n 5 1
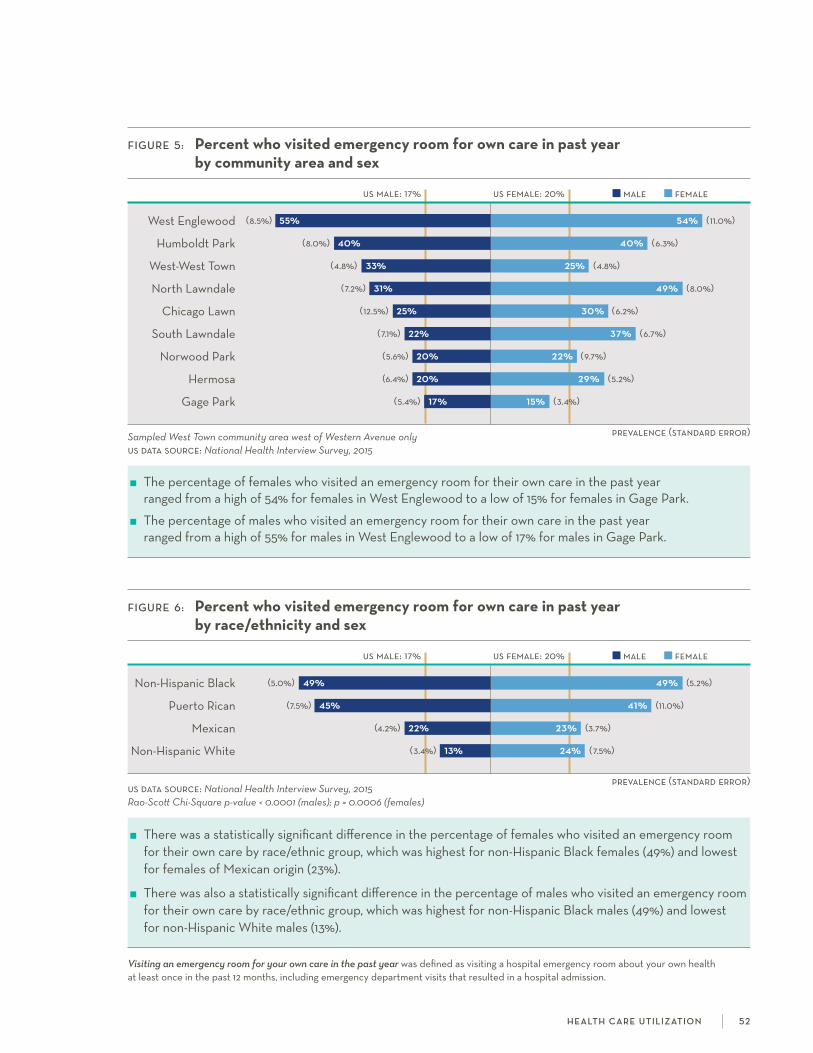
male female
prevalence (standard error)
FiGure 5: Percent who visited emergency room for own care in past year by community area and sex
us male: 17% us female: 20%
west Englewood (8.5%) 55% 54% (11.0%)
humboldt Park (8.0%) 40% 40% (6.3%)
west-west Town (4.8%) 33% 25% (4.8%)
north lawndale (7.2%) 31% 49% (8.0%)
chicago lawn (12.5%) 25% 30% (6.2%)
south lawndale (7.1%) 22% 37% (6.7%)
norwood Park (5.6%) 20% 22% (9.7%)
hermosa (6.4%) 20% 29% (5.2%)
gage Park (5.4%) 17% 15% (3.4%)
Sampled West Town community area west of Western Avenue onlyus data source: National Health Interview Survey, 2015
The percentage of females who visited an emergency room for their own care in the past year ranged from a high of 54% for females in west Englewood to a low of 15% for females in gage Park.
The percentage of males who visited an emergency room for their own care in the past year ranged from a high of 55% for males in west Englewood to a low of 17% for males in gage Park.
male female
prevalence (standard error)
FiGure 6: Percent who visited emergency room for own care in past year by race/ethnicity and sex
us male: 17% us female: 20%
non-hispanic Black (5.0%) 49% 49% (5.2%)
Puerto rican (7.5%) 45% 41% (11.0%)
Mexican (4.2%) 22% 23% (3.7%)
non-hispanic white (3.4%) 13% 24% (7.5%)
us data source: National Health Interview Survey, 2015Rao-Scott Chi-Square p-value < 0.0001 (males); p = 0.0006 (females)
There was a statistically significant difference in the percentage of females who visited an emergency room for their own care by race/ethnic group, which was highest for non-hispanic Black females (49%) and lowest for females of Mexican origin (23%).
There was also a statistically significant difference in the percentage of males who visited an emergency room for their own care by race/ethnic group, which was highest for non-hispanic Black males (49%) and lowest for non-hispanic white males (13%).
Visiting an emergency room for your own care in the past year was defined as visiting a hospital emergency room about your own health at least once in the past 12 months, including emergency department visits that resulted in a hospital admission.
h e a lt h ca r e u t i l i z at i o n 52


unmet health care needs, also described as forgone care, are one indicator of poor access to health care. nearly one in four americans aged 18-64 years reported at least
one unmet medical need due to cost in the past year.1 not surprisingly, individuals without health insurance are three times as likely to report this type of need compared to those with insurance.1 Beyond general medical care, individuals are even more likely to report going without other medical needs such as prescription medicine2 or dental care.3 forgoing or even delaying care is related to poorer health outcomes4 and increased medical expenses when preventable or treatable conditions are allowed to escalate unchecked.
WHiCH CommunitieS are moSt aFFeCteD?
about one in four adults in west Englewood and north lawndale did not get needed prescription medication in the past year due to cost.
in gage Park, 37% of adults had unmet dental care needs in the past year.
in west Englewood and south lawndale, 22% of adults needed eyeglasses in the past year but did not get them due to cost.
WHo iS moSt aFFeCteD?
non-hispanic Black adults had the highest percentage of unmet health care needs in the past year due to cost for medical care or surgery (13%), prescription medication (25%), dental care (25%), and eyeglasses (17%).
among adults of Puerto rican origin, 13% did not get needed mental health care in the past year due to cost.
references 1. Villarroel Ma, cohen ra. health insurance continuity and health care access and utilization, 2014. nchs data brief, no 249.
hyattsville, MD: national center for health statistics. 2016. http://www.cdc.gov/nchs/data/databriefs/db249.pdf. accessed December 20, 2016.
2. horner-Johnson w, Dobbertin k. Usual source of care and unmet health care needs: interaction of disability with race and ethnicity. Med Care. 2014; 52(10 suppl 3): s40-50.
3. Malecki k, wisk lE, walsh M, Mcwilliams c, Eggers s, olson M. oral health equity and unmet dental care needs in a population- based sample: findings from the survey of the health of wisconsin. Am J Public Health. 2015; 105(suppl 3): s466–s474.
4. ayanian JZ, weissman Js, schneider Ec, ginsburg Ja, Zaslavsky aM. Unmet health needs of uninsured adults in the United states. JAMA. 2000; 284(16): 2061-2069.
u n m e t h e a lt h ca r e n e e ds 5 4
Unmet health care needs
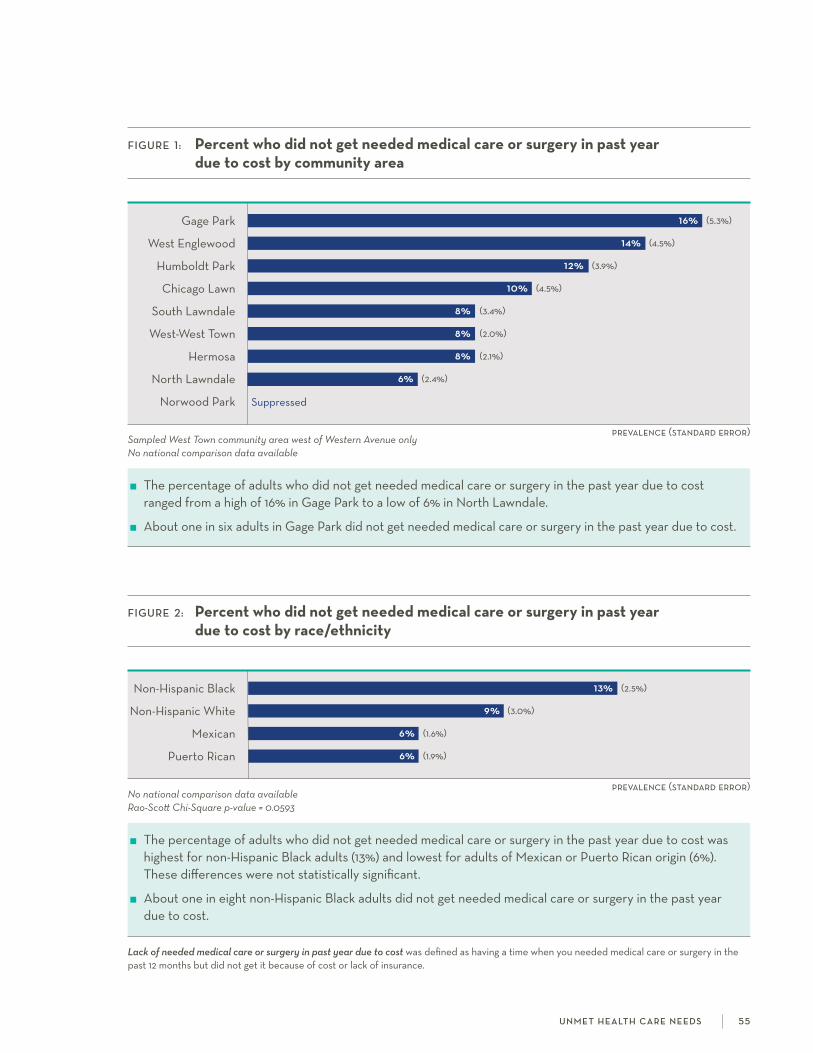
prevalence (standard error)
prevalence (standard error)
FiGure 2: Percent who did not get needed medical care or surgery in past year due to cost by race/ethnicity
non-hispanic Black 13% (2.5%)
non-hispanic white 9% (3.0%)
Mexican 6% (1.6%)
Puerto rican 6% (1.9%)
No national comparison data availableRao-Scott Chi-Square p-value = 0.0593
The percentage of adults who did not get needed medical care or surgery in the past year due to cost was highest for non-hispanic Black adults (13%) and lowest for adults of Mexican or Puerto rican origin (6%). These differences were not statistically significant.
about one in eight non-hispanic Black adults did not get needed medical care or surgery in the past year due to cost.
FiGure 1: Percent who did not get needed medical care or surgery in past year due to cost by community area
gage Park 16% (5.3%)
west Englewood 14% (4.5%)
humboldt Park 12% (3.9%)
chicago lawn 10% (4.5%)
south lawndale 8% (3.4%)
west-west Town 8% (2.0%)
hermosa 8% (2.1%)
north lawndale 6% (2.4%)
norwood Park suppressed
Sampled West Town community area west of Western Avenue onlyNo national comparison data available
The percentage of adults who did not get needed medical care or surgery in the past year due to cost ranged from a high of 16% in gage Park to a low of 6% in north lawndale.
about one in six adults in gage Park did not get needed medical care or surgery in the past year due to cost.
Lack of needed medical care or surgery in past year due to cost was defined as having a time when you needed medical care or surgery in the past 12 months but did not get it because of cost or lack of insurance.
u n m e t h e a lt h ca r e n e e ds 5 5
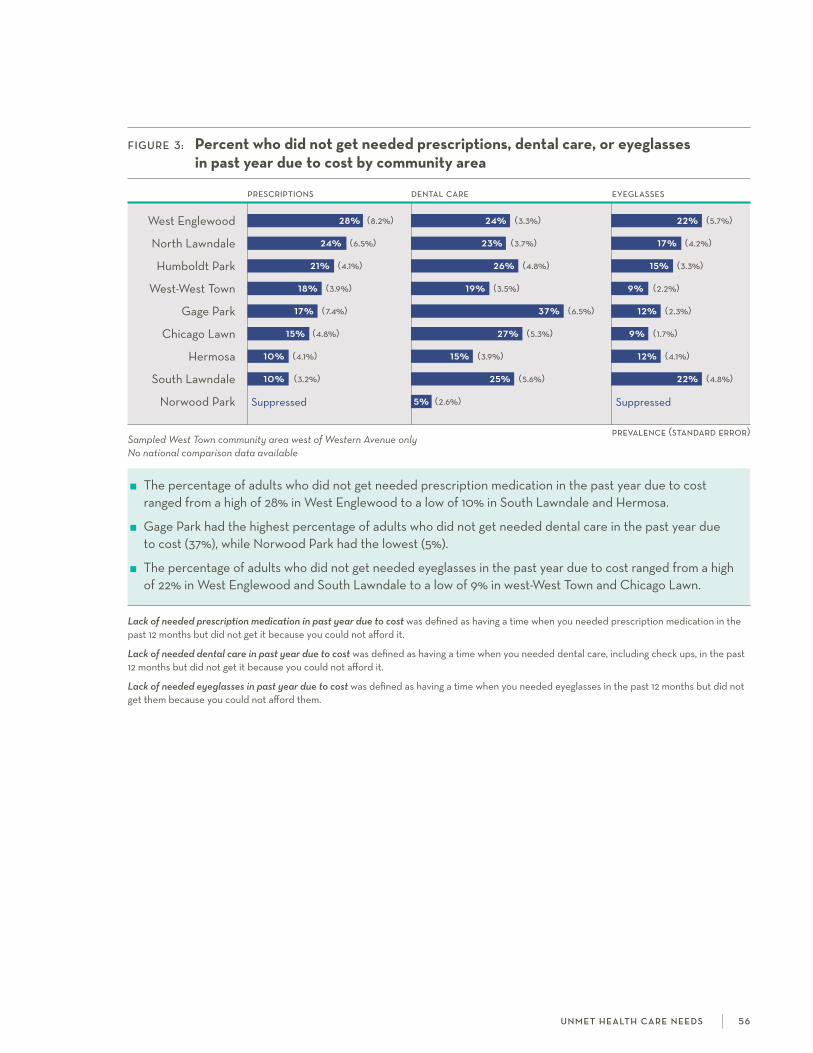
FiGure 3: Percent who did not get needed prescriptions, dental care, or eyeglasses in past year due to cost by community area
prescriptions dental care eyeglasses
west Englewood 28% (8.2%) 24% (3.3%) 22% (5.7%)
north lawndale 24% (6.5%) 23% (3.7%) 17% (4.2%)
humboldt Park 21% (4.1%) 26% (4.8%) 15% (3.3%)
west-west Town 18% (3.9%) 19% (3.5%) 9% (2.2%)
gage Park 17% (7.4%) 37% (6.5%) 12% (2.3%)
chicago lawn 15% (4.8%) 27% (5.3%) 9% (1.7%)
hermosa 10% (4.1%) 15% (3.9%) 12% (4.1%)
south lawndale 10% (3.2%) 25% (5.6%) 22% (4.8%)
norwood Park suppressed 5% (2.6%) suppressed
Sampled West Town community area west of Western Avenue onlyNo national comparison data available
The percentage of adults who did not get needed prescription medication in the past year due to cost ranged from a high of 28% in west Englewood to a low of 10% in south lawndale and hermosa.
gage Park had the highest percentage of adults who did not get needed dental care in the past year due to cost (37%), while norwood Park had the lowest (5%).
The percentage of adults who did not get needed eyeglasses in the past year due to cost ranged from a high of 22% in west Englewood and south lawndale to a low of 9% in west-west Town and chicago lawn.
Lack of needed prescription medication in past year due to cost was defined as having a time when you needed prescription medication in the past 12 months but did not get it because you could not afford it.
Lack of needed dental care in past year due to cost was defined as having a time when you needed dental care, including check ups, in the past 12 months but did not get it because you could not afford it.
Lack of needed eyeglasses in past year due to cost was defined as having a time when you needed eyeglasses in the past 12 months but did not get them because you could not afford them.
u n m e t h e a lt h ca r e n e e ds 5 6
prevalence (standard error)
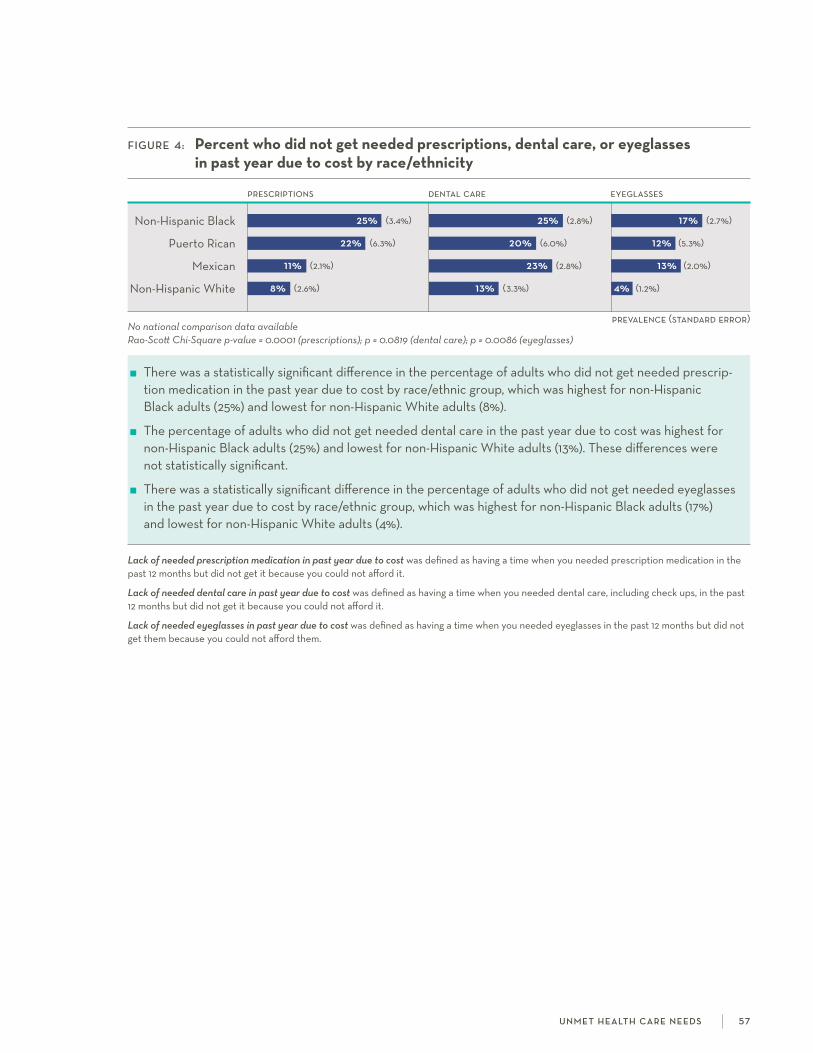
FiGure 4: Percent who did not get needed prescriptions, dental care, or eyeglasses in past year due to cost by race/ethnicity
prescriptions dental care eyeglasses
non-hispanic Black 25% (3.4%) 25% (2.8%) 17% (2.7%)
Puerto rican 22% (6.3%) 20% (6.0%) 12% (5.3%)
Mexican 11% (2.1%) 23% (2.8%) 13% (2.0%)
non-hispanic white 8% (2.6%) 13% (3.3%) 4% (1.2%)
No national comparison data availableRao-Scott Chi-Square p-value = 0.0001 (prescriptions); p = 0.0819 (dental care); p = 0.0086 (eyeglasses)
There was a statistically significant difference in the percentage of adults who did not get needed prescrip- tion medication in the past year due to cost by race/ethnic group, which was highest for non-hispanic Black adults (25%) and lowest for non-hispanic white adults (8%).
The percentage of adults who did not get needed dental care in the past year due to cost was highest for non-hispanic Black adults (25%) and lowest for non-hispanic white adults (13%). These differences were not statistically significant.
There was a statistically significant difference in the percentage of adults who did not get needed eyeglasses in the past year due to cost by race/ethnic group, which was highest for non-hispanic Black adults (17%) and lowest for non-hispanic white adults (4%).
Lack of needed prescription medication in past year due to cost was defined as having a time when you needed prescription medication in the past 12 months but did not get it because you could not afford it.
Lack of needed dental care in past year due to cost was defined as having a time when you needed dental care, including check ups, in the past 12 months but did not get it because you could not afford it.
Lack of needed eyeglasses in past year due to cost was defined as having a time when you needed eyeglasses in the past 12 months but did not get them because you could not afford them.
u n m e t h e a lt h ca r e n e e ds 57
prevalence (standard error)

prevalence (standard error)
prevalence (standard error)
FiGure 5: Percent who did not get needed mental health care in past year due to cost by community area
humboldt Park 13% (5.3%)
west Englewood 8% (3.3%)
west-west Town 6% (2.0%)
south lawndale 5% (2.3%)
hermosa 4% (3.7%)
north lawndale 3% (2.3%)
gage Park 3% (1.6%)
chicago lawn 2% (1.2%)
norwood Park suppressed
Sampled West Town community area west of Western Avenue onlyNo national comparison data available
The percentage of adults who did not get needed mental health care in the past year due to cost ranged from a high of 13% in humboldt Park to a low of 2% in chicago lawn.
about one in eight adults in humboldt Park did not get needed mental health care in the past year due to cost.
FiGure 6: Percent who did not get needed mental health care in past year due to cost by race/ethnicity
Puerto rican 13% (6.3%)
non-hispanic white 6% (2.7%)
non-hispanic Black 5% (1.5%)
Mexican 4% (1.2%)
No national comparison data availableRao-Scott Chi-Square p-value = 0.2285
The percentage of adults who did not get needed mental health care in the past year due to cost was highest for adults of Puerto rican origin (13%) and lowest for adults of Mexican origin (4%). These differences were not statistically significant.
Lack of needed mental health care in past year due to cost was defined as having a time when you needed mental health care or counseling in the past 12 months but did not get it because you could not afford it.
u n m e t h e a lt h ca r e n e e ds 5 8
Food insecurity is defined as limited availability of, or access to, nutritionally adequate and safe foods.1,2 although the prevalence is decreasing, more than one in ten Us
households (affecting over 42 million people) experienced food insecurity in 2015.2 The greatest burden falls on households with children, people with disabilities, and racial and ethnic minorities.1,3 in addition to its psychological and emotional effects, food insecurity may play a direct role in the development or worsening of chronic conditions such as diabetes and obesity.4,5
WHiCH CommunitieS are moSt aFFeCteD?
in humboldt Park, south lawndale, and gage Park, over 40% of households were food insecure in the past year.
in west Englewood, 44% of households used emergency food and 73% received food stamp benefits in the past year.
WHo iS moSt aFFeCteD?
There were significant differences in the prevalence of household food insecurity, the percentage that received emergency food, and the percentage that received food stamp benefits by race/ethnicity.
compared to non-hispanic white adults, the percentage of households that received emergency food in the past year was three times as high for adults of Mexican and Puerto rican origin and nearly seven times as high for non-hispanic Black adults.
references 1. Beaulieu sM. current and prospective scope of hunger and food security in america: a review of current research. Triangle Park, nc:
rTi international;2014.
2. coleman-Jensen a, gregory c, rabbitt M. food security in the Us. 2015; http://www.ers.usda.gov/topics/food-nutrition-assistance/food-security-in-the-us/key-statistics-graphics.aspx. accessed December 20, 2016.
3. Borger c, DelVecchio T, Engelhard E, et al. hunger in america 2014. chicago, il: feeding america;2014.
4. gucciardi E, Vahabi M, norris n, Del Monte JP, farnum c. The intersection between food insecurity and diabetes: a review. Current Nutrition Reports. 2014;3(4):324-332.
5. nackers lM, appelhans BM. food insecurity is linked to a food environment promoting obesity in households with children. JNEB. 2013;45(6):780-784.
6. Blumberg sJ, Bialostosky k, hamilton wl, Briefel rr. The effectiveness of a short form of the household food security scale. Am J Public Health. 1999;89(8):1231-1234.
f o o d i n s ecu r i t y 59
Food insecurity

prevalence (standard error)
FiGure 2: Prevalence of household food insecurity in past year by race/ethnicity
us: 13%
non-hispanic Black 41% (3.8%)
Puerto rican 30% (7.3%)
Mexican 29% (2.7%)
non-hispanic white 14% (3.6%)
Restricted to one adult respondent per householdus data source: US Census Bureau, Current Population Survey Food Security Supplement, 2015 Rao-Scott Chi-Square p-value < 0.0001
There was a statistically significant difference in the prevalence of household food insecurity by race/ethnic group, which was highest for non-hispanic Black adults (41%) and lowest for non-hispanic white adults (14%).
compared to non-hispanic white adults, the prevalence of household food insecurity was twice as high for adults of Mexican and Puerto rican origin and nearly three times as high for non-hispanic Black adults.
prevalence (standard error)
FiGure 1: Prevalence of household food insecurity in past year by community area
us: 13%
humboldt Park 46% (5.4%)
south lawndale 45% (6.5%)
gage Park 44% (7.1%)
north lawndale 37% (6.8%)
west Englewood 33% (5.5%)
chicago lawn 32% (5.0%)
west-west Town 30% (4.7%)
hermosa 29% (4.6%)
norwood Park 7% (2.8%)
Sampled West Town community area west of Western Avenue onlyRestricted to one adult respondent per householdus data source: US Census Bureau, Current Population Survey Food Security Supplement, 2015
in the nine communities surveyed, the prevalence of household food insecurity in the past year ranged from a high of 46% in humboldt Park to a low of 7% in norwood Park.
over 40% of households in humboldt Park, south lawndale, and gage Park were food insecure in the past year.
The presence of household food insecurity was defined as scoring at least two out of six on the six-item household food security survey.6 if one scale item was missing, the mean value from the five answered items was imputed to calculate a score. a score was not calculated for respondents with two or more missing scale items.
f o o d i n s ecu r i t y 6 0
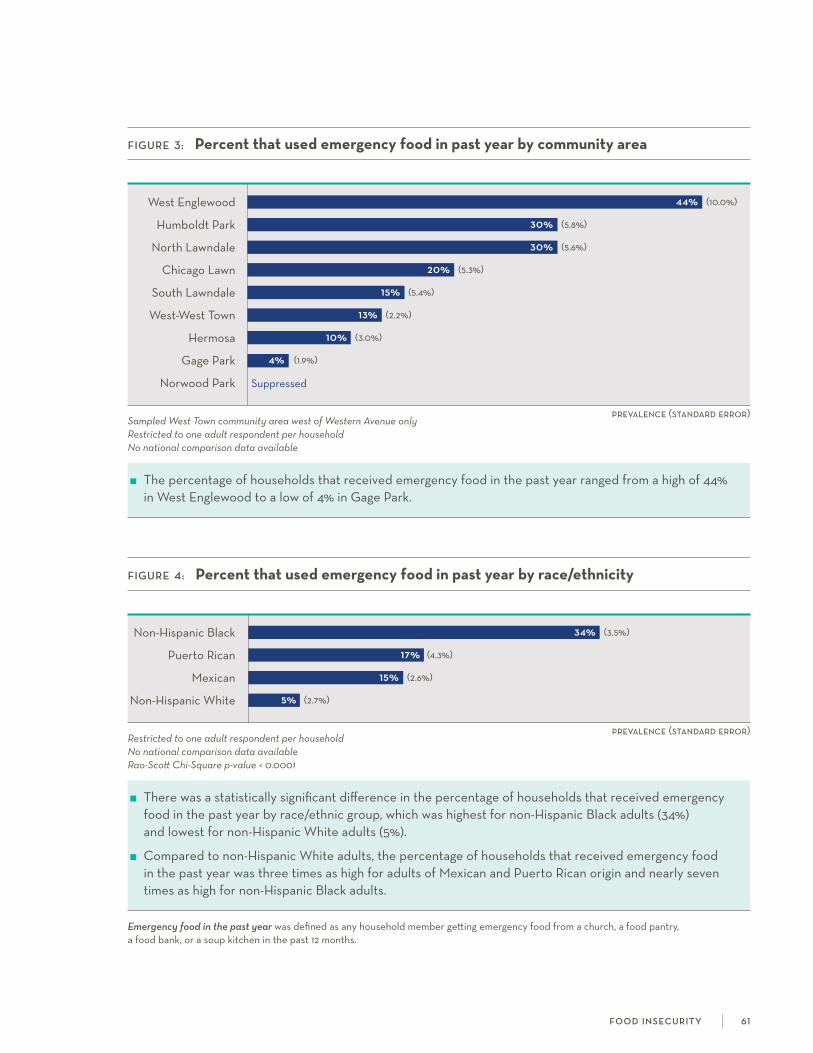
prevalence (standard error)
FiGure 4: Percent that used emergency food in past year by race/ethnicity
non-hispanic Black 34% (3.5%)
Puerto rican 17% (4.3%)
Mexican 15% (2.6%)
non-hispanic white 5% (2.7%)
Restricted to one adult respondent per householdNo national comparison data availableRao-Scott Chi-Square p-value < 0.0001
There was a statistically significant difference in the percentage of households that received emergency food in the past year by race/ethnic group, which was highest for non-hispanic Black adults (34%) and lowest for non-hispanic white adults (5%).
compared to non-hispanic white adults, the percentage of households that received emergency food in the past year was three times as high for adults of Mexican and Puerto rican origin and nearly seven times as high for non-hispanic Black adults.
prevalence (standard error)
FiGure 3: Percent that used emergency food in past year by community area
west Englewood 44% (10.0%)
humboldt Park 30% (5.8%)
north lawndale 30% (5.6%)
chicago lawn 20% (5.3%)
south lawndale 15% (5.4%)
west-west Town 13% (2.2%)
hermosa 10% (3.0%)
gage Park 4% (1.9%)
norwood Park suppressed
Sampled West Town community area west of Western Avenue onlyRestricted to one adult respondent per householdNo national comparison data available
The percentage of households that received emergency food in the past year ranged from a high of 44% in west Englewood to a low of 4% in gage Park.
Emergency food in the past year was defined as any household member getting emergency food from a church, a food pantry, a food bank, or a soup kitchen in the past 12 months.
f o o d i n s ecu r i t y 61
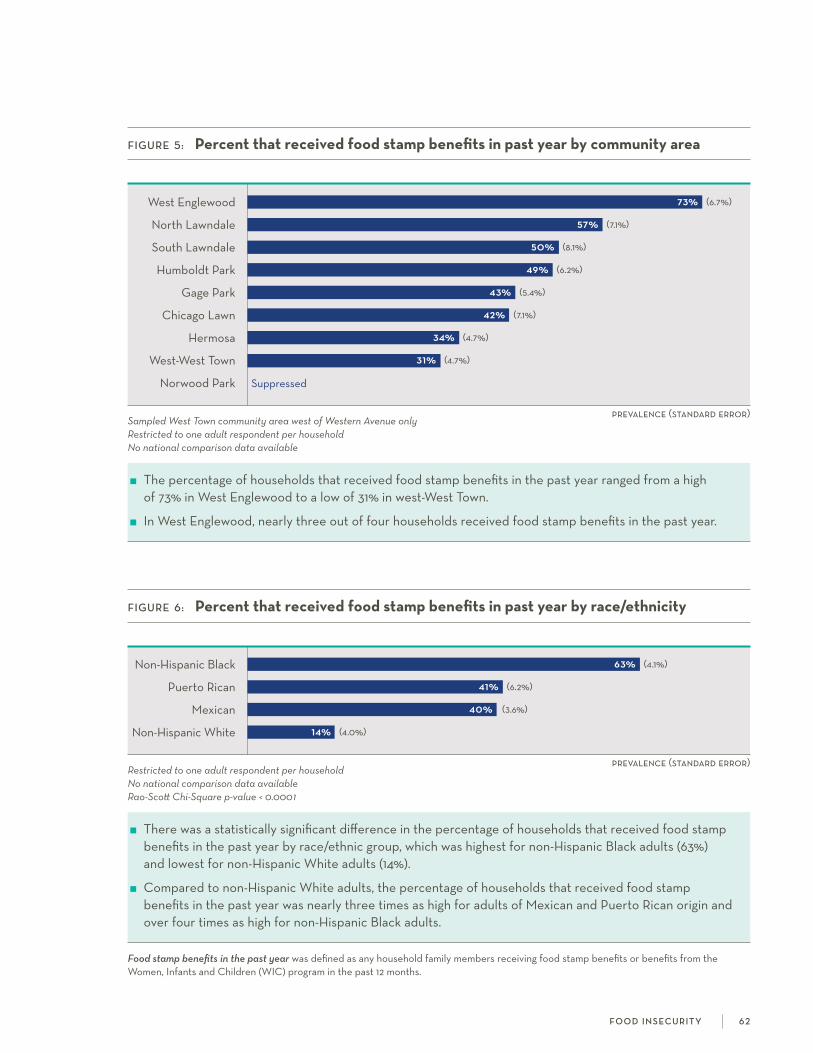
prevalence (standard error)
FiGure 5: Percent that received food stamp benefits in past year by community area
west Englewood 73% (6.7%)
north lawndale 57% (7.1%)
south lawndale 50% (8.1%)
humboldt Park 49% (6.2%)
gage Park 43% (5.4%)
chicago lawn 42% (7.1%)
hermosa 34% (4.7%)
west-west Town 31% (4.7%)
norwood Park suppressed
Sampled West Town community area west of Western Avenue onlyRestricted to one adult respondent per householdNo national comparison data available
The percentage of households that received food stamp benefits in the past year ranged from a high of 73% in west Englewood to a low of 31% in west-west Town.
in west Englewood, nearly three out of four households received food stamp benefits in the past year.
prevalence (standard error)
FiGure 6: Percent that received food stamp benefits in past year by race/ethnicity
non-hispanic Black 63% (4.1%)
Puerto rican 41% (6.2%)
Mexican 40% (3.6%)
non-hispanic white 14% (4.0%)
Restricted to one adult respondent per householdNo national comparison data availableRao-Scott Chi-Square p-value < 0.0001
There was a statistically significant difference in the percentage of households that received food stamp benefits in the past year by race/ethnic group, which was highest for non-hispanic Black adults (63%) and lowest for non-hispanic white adults (14%).
compared to non-hispanic white adults, the percentage of households that received food stamp benefits in the past year was nearly three times as high for adults of Mexican and Puerto rican origin and over four times as high for non-hispanic Black adults.
Food stamp benefits in the past year was defined as any household family members receiving food stamp benefits or benefits from the women, infants and children (wic) program in the past 12 months.
f o o d i n s ecu r i t y 62
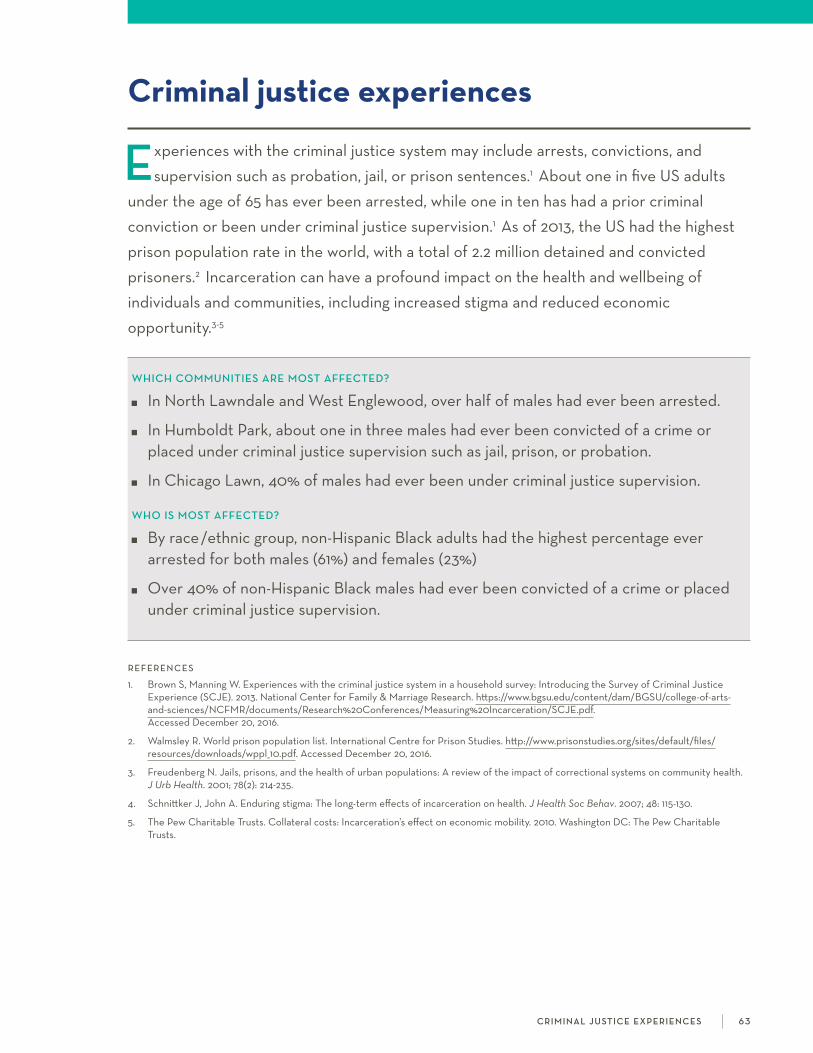
experiences with the criminal justice system may include arrests, convictions, and supervision such as probation, jail, or prison sentences.1 about one in five Us adults
under the age of 65 has ever been arrested, while one in ten has had a prior criminal conviction or been under criminal justice supervision.1 as of 2013, the Us had the highest prison population rate in the world, with a total of 2.2 million detained and convicted prisoners.2 incarceration can have a profound impact on the health and wellbeing of individuals and communities, including increased stigma and reduced economic opportunity.3-5
WHiCH CommunitieS are moSt aFFeCteD?
in north lawndale and west Englewood, over half of males had ever been arrested.
in humboldt Park, about one in three males had ever been convicted of a crime or placed under criminal justice supervision such as jail, prison, or probation.
in chicago lawn, 40% of males had ever been under criminal justice supervision.
WHo iS moSt aFFeCteD?
By race/ethnic group, non-hispanic Black adults had the highest percentage ever arrested for both males (61%) and females (23%)
over 40% of non-hispanic Black males had ever been convicted of a crime or placed under criminal justice supervision.
references 1. Brown s, Manning w. Experiences with the criminal justice system in a household survey: introducing the survey of criminal Justice
Experience (scJE). 2013. national center for family & Marriage research. https://www.bgsu.edu/content/dam/BgsU/college-of-arts- and-sciences/ncfMr/documents/research%20conferences/Measuring%20incarceration/scJE.pdf. accessed December 20, 2016.
2. walmsley r. world prison population list. international centre for Prison studies. http://www.prisonstudies.org/sites/default/files/ resources/downloads/wppl_10.pdf. accessed December 20, 2016.
3. freudenberg n. Jails, prisons, and the health of urban populations: a review of the impact of correctional systems on community health. J Urb Health. 2001; 78(2): 214-235.
4. schnittker J, John a. Enduring stigma: The long-term effects of incarceration on health. J Health Soc Behav. 2007; 48: 115-130.
5. The Pew charitable Trusts. collateral costs: incarceration’s effect on economic mobility. 2010. washington Dc: The Pew charitable Trusts.
c r i m i n a l j u st i c e e x p e r i e n c e s 6 3
Criminal justice experiences
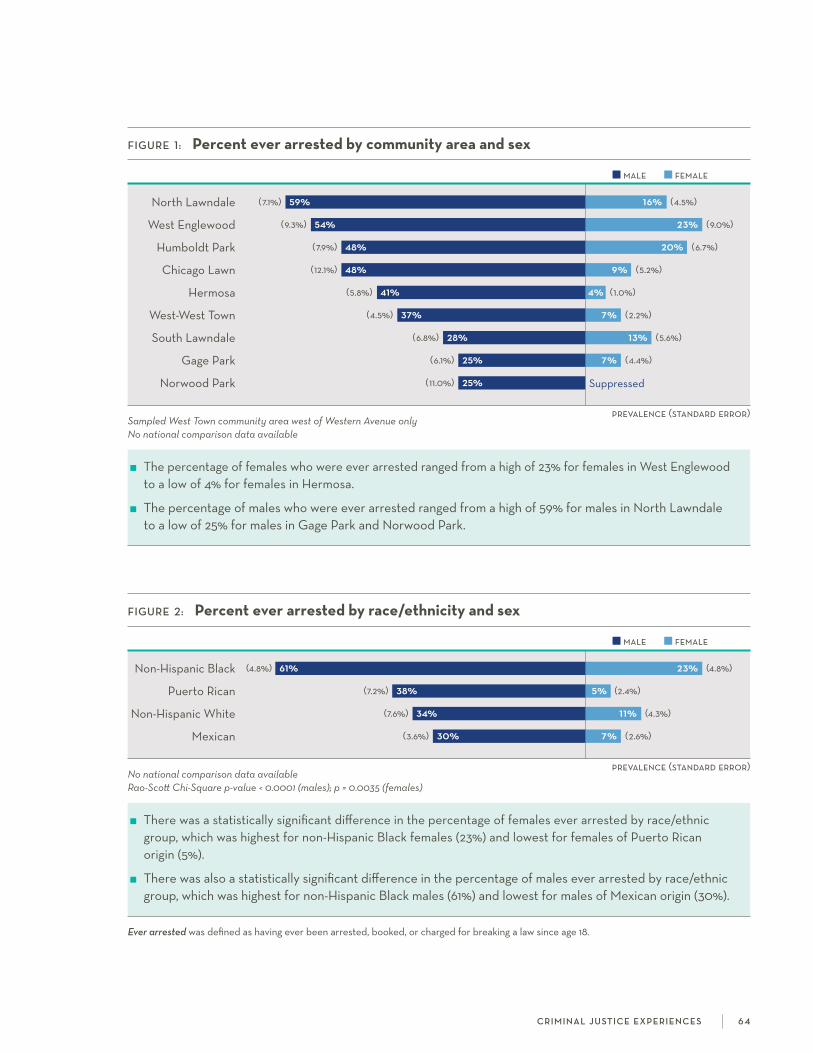
male female
prevalence (standard error)
prevalence (standard error)
male female
FiGure 1: Percent ever arrested by community area and sex
north lawndale (7.1%) 59% 16% (4.5%)
west Englewood (9.3%) 54% 23% (9.0%)
humboldt Park (7.9%) 48% 20% (6.7%)
chicago lawn (12.1%) 48% 9% (5.2%)
hermosa (5.8%) 41% 4% (1.0%)
west-west Town (4.5%) 37% 7% (2.2%)
south lawndale (6.8%) 28% 13% (5.6%)
gage Park (6.1%) 25% 7% (4.4%)
norwood Park (11.0%) 25% suppressed
Sampled West Town community area west of Western Avenue onlyNo national comparison data available
The percentage of females who were ever arrested ranged from a high of 23% for females in west Englewood to a low of 4% for females in hermosa.
The percentage of males who were ever arrested ranged from a high of 59% for males in north lawndale to a low of 25% for males in gage Park and norwood Park.
FiGure 2: Percent ever arrested by race/ethnicity and sex
non-hispanic Black (4.8%) 61% 23% (4.8%)
Puerto rican (7.2%) 38% 5% (2.4%)
non-hispanic white (7.6%) 34% 11% (4.3%)
Mexican (3.6%) 30% 7% (2.6%)
No national comparison data availableRao-Scott Chi-Square p-value < 0.0001 (males); p = 0.0035 (females)
There was a statistically significant difference in the percentage of females ever arrested by race/ethnic group, which was highest for non-hispanic Black females (23%) and lowest for females of Puerto rican origin (5%).
There was also a statistically significant difference in the percentage of males ever arrested by race/ethnic group, which was highest for non-hispanic Black males (61%) and lowest for males of Mexican origin (30%).
Ever arrested was defined as having ever been arrested, booked, or charged for breaking a law since age 18.
c r i m i n a l j u st i c e e x p e r i e n c e s 6 4
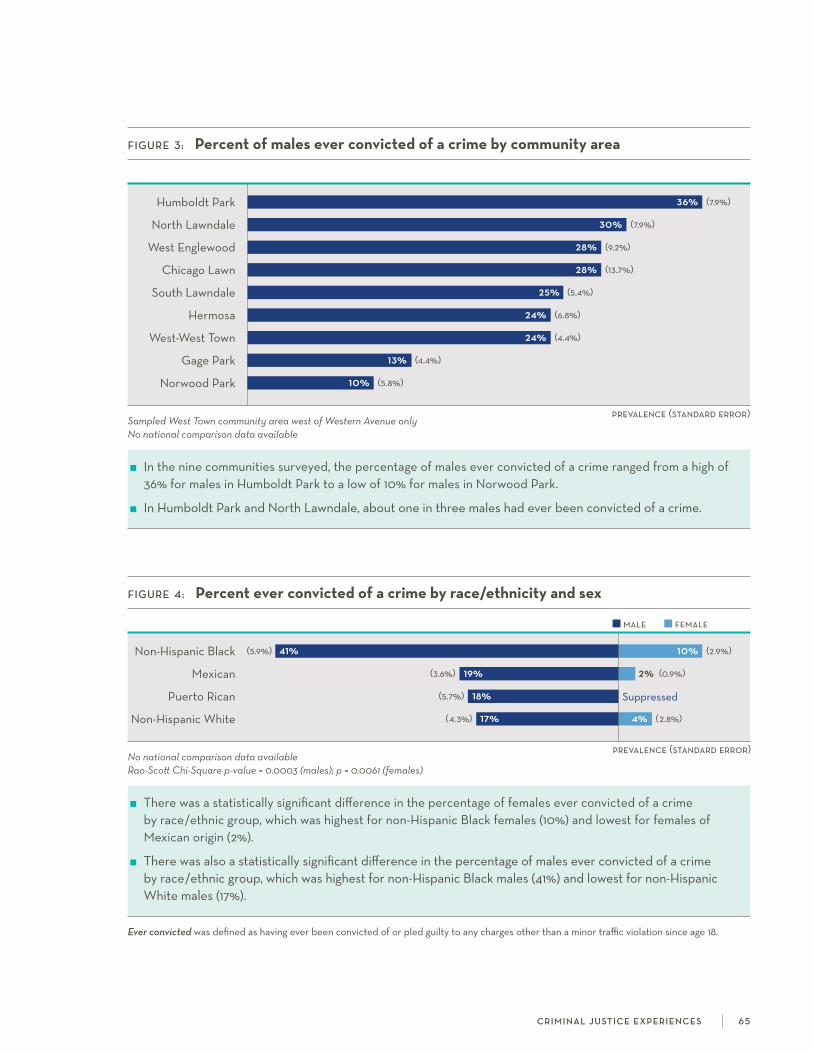
prevalence (standard error)
male female
prevalence (standard error)
FiGure 3: Percent of males ever convicted of a crime by community area
humboldt Park 36% (7.9%)
north lawndale 30% (7.9%)
west Englewood 28% (9.2%)
chicago lawn 28% (13.7%)
south lawndale 25% (5.4%)
hermosa 24% (6.8%)
west-west Town 24% (4.4%)
gage Park 13% (4.4%)
norwood Park 10% (5.8%)
Sampled West Town community area west of Western Avenue onlyNo national comparison data available
in the nine communities surveyed, the percentage of males ever convicted of a crime ranged from a high of 36% for males in humboldt Park to a low of 10% for males in norwood Park.
in humboldt Park and north lawndale, about one in three males had ever been convicted of a crime.
FiGure 4: Percent ever convicted of a crime by race/ethnicity and sex
non-hispanic Black (5.9%) 41% 10% (2.9%)
Mexican (3.6%) 19% 2% (0.9%)
Puerto rican (5.7%) 18% suppressed
non-hispanic white (4.3%) 17% 4% (2.8%)
No national comparison data availableRao-Scott Chi-Square p-value = 0.0003 (males); p = 0.0061 (females)
There was a statistically significant difference in the percentage of females ever convicted of a crime by race/ethnic group, which was highest for non-hispanic Black females (10%) and lowest for females of Mexican origin (2%).
There was also a statistically significant difference in the percentage of males ever convicted of a crime by race/ethnic group, which was highest for non-hispanic Black males (41%) and lowest for non-hispanic white males (17%).
Ever convicted was defined as having ever been convicted of or pled guilty to any charges other than a minor traffic violation since age 18.
c r i m i n a l j u st i c e e x p e r i e n c e s 6 5

prevalence (standard error)
prevalence (standard error)
male female
FiGure 5: Percent of males who were ever in jail, prison, or on probation by community area
chicago lawn 40% (15.0%)
humboldt Park 37% (7.9%)
hermosa 31% (7.7%)
north lawndale 28% (9.7%)
west Englewood 26% (8.3%)
west-west Town 19% (5.3%)
south lawndale 18% (4.6%)
norwood Park 14% (5.7%)
gage Park 8% (5.0%)
Sampled West Town community area west of Western Avenue onlyNo national comparison data available
in the nine communities surveyed, the percentage of males who were ever in jail, prison, or on probation ranged from a high of 40% for males in chicago lawn to a low of 8% for males in gage Park.
More than one in three males in chicago lawn and humboldt Park had ever been in jail, prison, or on probation.
FiGure 6: Percent who were ever in jail, prison, or on probation by race/ethnicity and sex
non-hispanic Black (5.9%) 43% 10% (2.4%)
non-hispanic white (5.7%) 27% 7% (4.6%)
Puerto rican (7.4%) 23% 4% (2.4%)
Mexican (3.4%) 15% 2% (1.2%)
No national comparison data availableRao-Scott Chi-Square p-value = 0.0001 (males); p = 0.0674 (females)
The percentage of females who were ever in jail, prison, or on probation was highest for non-hispanic Black females (10%) and lowest for females of Mexican origin (2%). These differences were not statistically significant.
There was a statistically significant difference in the percentage of males who were ever in jail, prison, or on probation by race/ethnic group, which was highest for non-hispanic Black males (43%) and lowest for males of Mexican origin (15%).
Ever in jail, prison, or on probation was defined as having ever been under any form of criminal justice supervision, including on probation, in jail, or in prison since age 18.
c r i m i n a l j u st i c e e x p e r i e n c e s 6 6
the environment in which individuals live impacts their overall health and well-being. Thus, it is important to consider aspects of one’s neighborhood, such as social cohe-
sion and safety, in addition to individual-level factors when studying mental and physical health outcomes. social cohesion is the degree to which members of a group cooperate in order to meet their collective needs.1 it has been associated with mental health outcomes, as well as health behaviors such as smoking and walking.2 Perceived neighborhood safety has also been linked to health outcomes, with fear of one’s environment leading to poorer mental health, physical functioning, and overall quality of life.3
WHiCH CommunitieS are moSt aFFeCteD?
among the nine communities surveyed, norwood Park had the highest average social cohesion score (3.2 out of 4.0).
in gage Park, 40% of females felt unsafe being out alone in their neighborhood during the day and 69% felt unsafe alone at night.
The majority of adults in south lawndale (58% of males and 71% of females) felt unsafe being out alone in their neighborhood at night.
WHo iS moSt aFFeCteD?
about one in four non-hispanic Black females and females of Puerto rican origin felt unsafe being out alone in their neighborhood during the day.
about half of non-hispanic Black females and females of Puerto rican or Mexican origin felt unsafe being out alone in their neighborhood at night.
references 1. stanley D. what do we know about social cohesion: The research perspective of the federal government’s social cohesion research
network. Can J Sociol. 2003; 28(1): 5-17.
2. Echeverría s, Diez-roux aV, shea s, Borrell ln, Jackson s. associations of neighborhood problems and neighborhood social cohesion with mental health and health behaviors: The Multi-Ethnic study of atherosclerosis. Health Place. 2008; 14(4): 853-65.
3. stafford M, chandola T, Marmot M. association between fear of crime and mental health and physical functioning. Am J Public Health. 2007; 97(11): 2076–2081.
4. Morenoff JD, sampson rJ, raudenbush s. neighborhood inequality, collective efficacy, and the spatial dynamics of urban violence. Criminology. 2001; 39: 517–558.
5. raudenbush s w, sampson r J. Ecometrics: Toward a science of assessing ecological settings, with application to the systematic social observation of neighborhoods. Sociol Methodol. 1999; 29: 1–41.
s o c i a l co h e s i o n a n d n e i g h b o r h o o d sa f e t y 67
Social cohesion and neighborhood safety
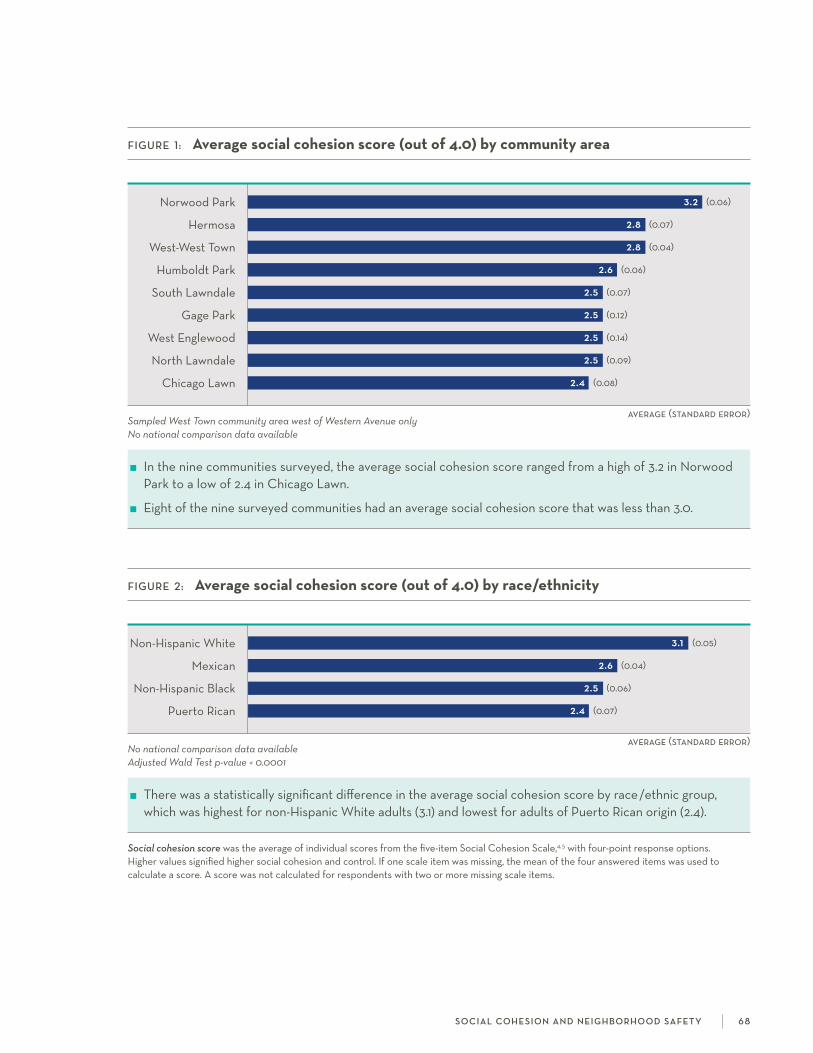
average (standard error)
FiGure 1: Average social cohesion score (out of 4.0) by community area
norwood Park 3.2 (0.06)
hermosa 2.8 (0.07)
west-west Town 2.8 (0.04)
humboldt Park 2.6 (0.06)
south lawndale 2.5 (0.07)
gage Park 2.5 (0.12)
west Englewood 2.5 (0.14)
north lawndale 2.5 (0.09)
chicago lawn 2.4 (0.08)
Sampled West Town community area west of Western Avenue onlyNo national comparison data available
in the nine communities surveyed, the average social cohesion score ranged from a high of 3.2 in norwood Park to a low of 2.4 in chicago lawn.
Eight of the nine surveyed communities had an average social cohesion score that was less than 3.0.
average (standard error)
FiGure 2: Average social cohesion score (out of 4.0) by race/ethnicity
non-hispanic white 3.1 (0.05)
Mexican 2.6 (0.04)
non-hispanic Black 2.5 (0.06)
Puerto rican 2.4 (0.07)
No national comparison data availableAdjusted Wald Test p-value < 0.0001
There was a statistically significant difference in the average social cohesion score by race/ethnic group, which was highest for non-hispanic white adults (3.1) and lowest for adults of Puerto rican origin (2.4).
Social cohesion score was the average of individual scores from the five-item social cohesion scale,4,5 with four-point response options. higher values signified higher social cohesion and control. if one scale item was missing, the mean of the four answered items was used to calculate a score. a score was not calculated for respondents with two or more missing scale items.
s o c i a l co h e s i o n a n d n e i g h b o r h o o d sa f e t y 6 8

male female
prevalence (standard error)
FiGure 3: Percent who felt unsafe alone in neighborhood during daytime by community area and sex
gage Park (6.6%) 17% 40% (10.9%)
west Englewood (8.7%) 30% 39% (10.4%)
south lawndale (7.5%) 25% 29% (6.6%)
humboldt Park (4.4%) 17% 20% (7.0%)
north lawndale (7.6%) 15% 16% (5.2%)
chicago lawn suppressed 16% (6.7%)
hermosa (1.6%) 3% 13% (2.8%)
west-west Town (1.3%) 2% 11% (4.0%)
norwood Park suppressed suppressed
Sampled West Town community area west of Western Avenue onlyNo national comparison data available
The percentage of females who felt unsafe being out alone in their neighborhood during the day ranged from a high of 40% for females in gage Park to a low of 11% for females in west-west Town.
The percentage of males who felt unsafe being out alone in their neighborhood during the day ranged from a high of 30% for males in west Englewood to a low of 2% for males in west-west Town.
male female
prevalence (standard error)
FiGure 4: Percent who felt unsafe alone in neighborhood during daytime by race/ethnicity and sex
Puerto rican (5.7%) 15% 26% (10.2%)
non-hispanic Black (4.1%) 20% 23% (4.5%)
Mexican (3.0%) 14% 18% (3.8%)
non-hispanic white suppressed suppressed
No national comparison data availableRao-Scott Chi-Square p-value = 0.0034 (males); p = 0.0138 (females)
There was a statistically significant difference in the percentage of females who felt unsafe being out alone in their neighborhood during the day by race/ethnic group, which was highest for females of Puerto rican origin (26%) and lowest for females of Mexican origin (18%).
There was also a statistically significant difference in the percentage of males who felt unsafe being out alone in their neighborhood during the day by race/ethnic group, which was highest for non-hispanic Black males (20%) and lowest for males of Mexican origin (14%).
Feeling unsafe alone in neighborhood during daytime was defined as responding ‘a little’ when asked whether you feel safe being out alone in your neighborhood during the daytime a lot, some, or a little.
s o c i a l co h e s i o n a n d n e i g h b o r h o o d sa f e t y 69

Feeling unsafe alone in neighborhood at night was defined as responding ‘a little’ when asked whether you feel safe being out alone in your neighborhood at night a lot, some, or a little.
male female
prevalence (standard error)
FiGure 5: Percent who felt unsafe alone in neighborhood at night by community area and sex
south lawndale (7.7%) 58% 71% (6.7%)
gage Park (11.0%) 41% 69% (9.2%)
chicago lawn (9.6%) 37% 59% (13.6%)
humboldt Park (7.2%) 40% 58% (8.8%)
north lawndale (10.6%) 33% 52% (6.7%)
west-west Town (4.0%) 17% 48% (6.6%)
west Englewood (9.2%) 46% 47% (11.3%)
hermosa (4.7%) 14% 37% (6.6%)
norwood Park suppressed suppressed
Sampled West Town community area west of Western Avenue onlyNo national comparison data available
The percentage of females who felt unsafe being out alone in their neighborhood at night ranged from a high of 71% for females in south lawndale to a low of 37% for females in hermosa.
The percentage of males who felt unsafe being out alone in their neighborhood at night ranged from a high of 58% for males in south lawndale to a low of 14% for males in hermosa.
male female
prevalence (standard error)
FiGure 6: Percent who felt unsafe alone in neighborhood at night by race/ethnicity and sex
non-hispanic Black (4.9%) 40% 52% (6.0%)
Puerto rican (8.0%) 36% 51% (10.3%)
Mexican (4.2%) 38% 50% (4.7%)
non-hispanic white (5.7%) 13% 19% (6.2%)
No national comparison data availableRao-Scott Chi-Square p-value = 0.0126 (males); p = 0.0031 (females)
There was a statistically significant difference in the percentage of females who felt unsafe being out alone in their neighborhood at night by race/ethnic group, which was highest for non-hispanic Black females (52%) and lowest for non-hispanic white females (19%).
There was also a statistically significant difference in the percentage of males who felt unsafe being out alone in their neighborhood at night by race/ethnic group, which was highest for non-hispanic Black males (40%) and lowest for non-hispanic white males (13%).
s o c i a l co h e s i o n a n d n e i g h b o r h o o d sa f e t y 70

Survey PoPulation
The Sinai Community Health Survey 2.0 (Sinai Survey) data are representative of non-institutionalized adults (aged 18 years and older) and children (aged 0-12 years) living in the nine communities of chicago lawn, gage Park, hermosa, humboldt Park, north lawndale, norwood Park, south lawndale, west Englewood, and the western portion of west Town (west of western avenue). a tenth community area, lower west side, was originally included but dropped during the data collection period because of recruit-ment difficulties. we selected these community areas based on location within the sinai health system primary service area, inclusion in the first Sinai Survey, and involvement in sUhi interventions and collabora-tions. The survey sample size is adequate to make fair comparisons among four race/ethnic groups (non- hispanic Black, non-hispanic white, Mexican, and Puerto rican). Because the survey was administered only in households residing in the selected communities, generalizing to the city of chicago, as a whole, is not recommended.
sUhi contracted the University of illinois at chicago survey research lab (srl) for the sampling method-ology and data collection. Both the sinai health system and University of illinois at chicago institutional review Boards approved this study. all respondents provided written consent at the time of the survey. The findings reported in this booklet are based on the adult survey data only.
QueStionnaire
sUhi researchers developed the adult and child questionnaires in consultation with our Sinai Survey community advisory committee (cac) and srl. The cac, made up of representatives who live and work in the surveyed community areas, advised sUhi on questionnaire topic choice and question wording. survey question sources include the first Sinai Survey, national health surveys, and questions drafted based on cac feedback. srl reviewed the questionnaires to ensure that they followed basic principles of questionnaire construction, pilot-tested them, and revised accordingly. The final questionnaires included 369 questions for adults and 160 questions for children. a full questionnaire topic list is available at www.sinaisurvey.org.
Survey aDminiStration
The Sinai Survey utilized a multistage sampling design. selection of the Primary sampling Units (PsUs) and the initial selection of households in the PsUs were based on Probability Proportionate to size (PPs) sampling methodology.1 after the PsUs were selected, housing units were randomly selected from each of the PsUs. Because of the difficulty of gaining entrance into some multi-unit dwellings, difficult-to-access buildings were under-sampled. interviewers made a minimum of ten personal contact attempts at different times of the day and week for each selected household in order to reach respondents.
in the final stage of sample selection, interviewers assessed the number and sex of eligible individuals in the household and, if the household contained more than one eligible adult, randomly selected the initial respondent.2 if there were two eligible adults in the household, interviewers selected a second respondent half of the time; and if there were three or more eligible adults in the household, interviewers always randomly selected a second respondent.
72
sinai coMMUniTY hEalTh sUrVEY 2.0:
Methodology
srl collected data between March 2015 and september 2016. interviews were conducted in English and spanish based on respondent preference (23% completed the survey in spanish). The interviews averaged 84 minutes (77 minutes for English-language interviews and 97 minutes for spanish.) interviewers used laptop computers and computer-assisted survey Execution system (casEs) software for the question-naire. Biomeasures including height, weight, and girth, were collected at the end of the interview.
an advance letter explained the study to each sampled household before the interviewer’s first contact attempt. interviewers also left study materials, such as door-hangers and a faQ flyer, at households where the selected participant was not contacted. in order to incentivize participation, each participating adult received $50 compensation. The overall survey response rate was 28% (american association of Public opinion research response rate #3),3 resulting in a final sample size of 1,543 adults and 394 children.
Data analySiS
researchers used sampling weights to compute statistical estimates to ensure (1) the estimates accounted for the differential probability of the selection of respondents; and (2) the demographic profile of survey respondents matched the community area demographic profiles from the 2010–2014 American Community Survey.
The community health counts booklet presents prevalence estimates by community area and by race/ ethnicity. when calculating prevalence by race/ethnicity, responses from the tenth community area, lower west side (n=33), were included. when appropriate, we provide estimates by sex within these categories. standard errors were calculated using the linearized variance estimator. we used second order rao-scott chi-square tests or adjusted wald tests to specify statistical differences in prevalence or mean estimates between groups, respectively. we suppressed data when the number of observations was less than five in a particular cell. all analyses were conducted in stata/sE 14.2. national comparison data were provided when available.
references1. sudman s. Applied sampling. 1976. new York: academic Press, pp. 134-138.
2. Bryant BE. respondent selection in a time of changing household composition. J Marketing Research. 1975; 12, 129-135.
3. american association for Public opinion research (aaPor). Standard definitions: Final dispositions of case codes and outcome rates for surveys. 2016.
73

number Percent Percent (unweighted) (unweighted) (weighted)*
Community area
chicago lawn 131 8.5
gage Park 131 8.5
hermosa 235 15.2
humboldt Park 230 14.9
lower west side** 33 2.1
north lawndale 157 10.2
norwood Park 88 5.7
south lawndale 163 10.6
west Englewood 130 8.4
west-west Town 245 15.9
Sex
Male 672 43.6 49.9
female 871 56.4 50.1
Age
18–29 401 26.1 30.5
30–44 477 31.1 27.9
45–64 484 31.5 30.9
65+ 173 1 1.3 10.7
Race/ethnicity
Puerto rican 151 9.8 5.7
Mexican 521 33.9 43.0
hispanic other 83 5.4 5.0
non-hispanic Black 536 34.8 29.4
non-hispanic white 219 14.2 15.6
non-hispanic other 29 1.9 1.2
Education attainment
less than high school degree 407 26.4 26.5
high school degree or gED 460 29.9 33.4
some college 402 26.1 25.1
college degree or more 272 17.7 14.9
number Percent Percent (unweighted) (unweighted) (weighted)*
Annual household income
>$10,000 269 20.2 16.4
$10,000 – 24,999 449 33.7 32.0
$25,000 – 49,999 342 25.7 28.9
$50,000 or more 272 20.4 22.7
Employment status
Employed for wages 743 48.5 52.3
self-employed 132 8.6 7.9
out of work 188 12.3 9.8
homemaker 103 6.7 6.7
student 66 4.3 5.8
retired 157 10.3 9.0
Unable to work 142 9.3 8.5
Marital status
Married 510 33.3 37.6
Divorced/separated 200 13.1 1 1.7
widowed 78 5.1 3.7
never married 577 37.7 35.4
Member of unmarried couple 167 10.9 1 1.6
* Weighted percentages should be used for reporting purposes** Dropped during data collection period due to recruitment difficulties
74
sinai coMMUniTY hEalTh sUrVEY 2.0:
Sample Demographics

SuGGeSteD Citation
Hirschtick Jl, benjamins mr, Homan S. Community Health Counts: Sinai Community Health Survey 2.0. Sinai urban Health institute, Sinai Health System. Chicago, il. march 2017.
Sinai Urban Health Institute1500 S. Fairfield avenue
Chicago, illinois 60608
www.suhichicago.org