simultaneous reconfiguration and capacitor placement with harmonic consideration using fuzzy harmony...
TRANSCRIPT
Arab J Sci EngDOI 10.1007/s13369-014-0971-4
RESEARCH ARTICLE - ELECTRICAL ENGINEERING
Simultaneous Reconfiguration and Capacitor Placementwith Harmonic Consideration Using Fuzzy HarmonySearch Algorithm
S. Esmaeili · H. D. Dehnavi · F. Karimzadeh
Received: 30 September 2012 / Accepted: 31 January 2013© King Fahd University of Petroleum and Minerals 2014
Abstract In this paper, network reconfiguration and capac-itor placement are modeled in the form of a multi-objectiveproblem. Minimizing the costs of real power losses and shuntcapacitor installation, and improving the harmonic conditionof network are taken into account as the optimization goals.A fuzzy system is utilized to solve multi-objective problem,and a fuzzy harmony search algorithm is proposed to reachthe optimum solution point. The proposed model is imple-mented on two typical networks: the IEEE 33-bus standardsystem and an 83-bus distribution system from Taiwan PowerCompany. The results demonstrate that simultaneous studyof shunt capacitor placement and network reconfigurationleads to better results compared to study each one separately.Furthermore, considering harmonic condition of network asa term of multi-objective function provides a suitable crite-rion for network designer to improve the power quality ofnetwork during the reconfiguration and capacitor placementprocesses.
Keywords Capacitor placement · Distribution network ·Fuzzy theory · Harmony search algorithm ·Multi-objectiveproblem · Reconfiguration
S. Esmaeili (B) · H. D. DehnaviDepartment of Electrical Engineering, Shahid Bahonar Universityof Kerman, Kerman, Irane-mail: [email protected]
H. D. Dehnavie-mail: [email protected]
F. KarimzadehGraduate University of Advanced Technology, Mahan, Kerman, Irane-mail: [email protected]
1 Introduction
High reactive current level, low voltage level, and radialstructure results in high percentage of the losses in the distrib-ution systems. Various methods have been proposed to reducethe power system losses, including installation of capacitorbanks and reconfiguration of distribution network.
The shunt capacitors are used to supply reactive power indistribution systems. The issue of capacitor banks placementhas been one of the most prominent research priorities dur-ing past decades, on which several investigations have beencarried out and plenty of techniques have been applied forsolving this problem [1–4]. Regarding the capacitor place-ment, the optimal size and location of capacitors should bedetermined by the different aims such as minimizing the costof capacitor installation and the cost of real power losses.Therefore, a wide variety of methods have been suggestedfor capacitor placement problem that includes classic onessuch as non-linear programming [1] as well as modern ones
123

Arab J Sci Eng
such as genetic algorithm [2], simulated annealing [3], andparticle swarm optimization [4].
Reconfiguration is the process that changes the distri-bution system structure by means of opening and closingthe switches. Hereto, different methods have been devel-oped to solve the reconfiguration problem in distributionsystems [5–9].
In most of papers, the capacitor placement and networkreconfiguration problems have been studied separately andfew papers have investigated them simultaneously [10,11].In most of these papers, the effects of voltage and currentharmonics have not been taken into account. In [10], a newmethod based on ant colony search algorithm has been pro-posed to solve combinational problem of feeder reconfigura-tion and capacitor placement with the aim of minimizing thesystem power losses. In [11], a joint optimization algorithmhas been proposed for combining the capacitor placementand network reconfiguration problems. Different load pat-terns have been considered to show the practical applicationof this method. The optimization problem has been aimedat minimizing the total cost due to capacitor placement andenergy losses.
Increasing utilization of non-linear loads including powerelectronics equipment and electromagnetic devices hascaused considerable amount of harmonic current injectioninto the distribution system. As the impedance of parallelcapacitors are changed in different frequencies (harmonicfrequencies), inappropriate locating and sizing of these capac-itors may bring about the resonant circuits which result inintensified current and voltage harmonics in resonant fre-quency [12]. Therefore, in [9,13], the importance of non-linear loads has been taken into account in capacitor place-ment problem.
Besides the impact of capacitor placement on the systemharmonics, the reconfiguration process also affects the har-monic level of distribution network. Since topology of dis-tribution network is altered through reconfiguration process,the coupling of lines and the relation between impedance ofthe lines will be changed in various harmonics, and conse-quently this affects the number of harmonics produced inthe system. Moreover, the power distribution route and theway the buses are connected will be changed by reconfigu-ration of network, which certainly influences the harmonicsat the system buses. Therefore, it is necessary to consider theharmonic condition of network during the reconfigurationprocess of distribution networks.
In order to investigate the harmonic condition of networkduring the capacitor placement, most of papers have mod-eled the problem based on an objective function with eco-nomic nature, and checked the harmonic parameters as con-straints after the capacitors size and location have been deter-mined [9,13]. In this paper, the problem of shunt capacitorplacement and network reconfiguration is modeled simulta-
neously in the form of multi-objective problem. In the pro-posed model, increase in annual profit (including the reduc-tion in the losses cost, and capacitors setting cost), andimprovement in total harmonic distortion (THD) of networkare considered as goals of optimization problem. In orderto solve the multi-objective problem, a fuzzy system is uti-lized, and harmony search algorithm (HS) is developed basedon fuzzy theory to achieve an optimum solution point. Theproposed model is implemented on two typical distributionnetworks; 33-bus IEEE standard network and 83-bus distrib-ution system from Taiwan Power Company (TPC). The simu-lation results show that the simultaneous analysis of networkreconfiguration and capacitor placement has more advanta-geous compared with analysis each of them separately. Sincein this model, power quality parameter is considered as a partof objective function, not only it provides further improve-ment in THD parameter but also facilitates the implement-ing of designer’s ideas on capacitor placement and networkreconfiguration from the perspective of harmonic conditionof system.
2 Mathematical Expression of the Problem
The optimal reconfiguration and capacitor placement in thepresence of linear and non-linear loads can be defined as anon-linear multi-objective problem subject to different con-straints. In this paper, both the economic and power qualityissues are considered as the objectives of the optimizationproblem. The optimum annual profit is attained by reductionin the cost of real power losses as well as reduction in thecost of capacitor setting. In addition, the power quality issueis improved by mitigating the total harmonic distortion para-meter of the distribution network. The mathematical expres-sion of the problem is described as follows:
2.1 Objective Function
In order to realize the goals of the optimization problem, themulti-objective function is expressed as follows:
F = min
(F1
F2
)(1)
The multi-objective function F consists of two terms. Thefirst term of the multi-objective function reflects the costfunction, and the second term stands for the power qualityindex.
The total cost including the cost of real power losses andthe cost of shunt capacitor installation is defined as follows[9]:
F1 = Kp Ploss +nc∑
i=1
Kci Qci ($) (2)
123

Arab J Sci Eng
where
Kp annual cost per unit of the real power loss($/kW/year);
Kci annual cost per unit of the reactive powerinjection by capacitor number i ($/kW/year);
Qci reactive power injection by capacitor numberi (kVAr);
nc total number of shunt capacitors to be installed;Ploss total real power loss (kW);
The total real power loss is calculated through followingrelationship [9]:
Ploss =nb∑
i=1
P(1)lossi+
nb∑i=1
hmax∑h=h0
P(h)loss (kW) (3)
where
nb the number of branches of network;h0 the smallest order of harmonic;hmax the highest order of harmonic;
The second term of the objective function is consideredfor improving the power quality index. This term is definedas total harmonics distortion deviation of bus voltages:
F2 =n∑
i=1
µi (4)
where
µi ={
THDi (%)− THDd(%)
0THDi (%) > THDd(%)
else
(5)
and
THDi (%) =
√∑hmaxh=h0
∣∣∣V (h)i
∣∣∣2
∣∣∣V (1)i
∣∣∣ × 100 (6)
In above formula, n is the number of network buses. Thedesired value for THD (THDd) is equal to 5 %, which isrecommended by IEEE-519 standard [14].
2.2 Constraints
The objective function is restricted by three constraints: busvoltage constraint, distribution network constraint, and num-ber and size of shunt capacitors constrain.
1. Voltage constraint: The magnitude of voltage in each busmust be kept within the following range:
Vmin ≤ |Vi | ≤ Vmax, i = 1, 2, . . . , n (7)
whereVmin the minimum value of bus voltageVmax the maximum value of bus voltageSince the harmonic analysis is of interest during the opti-mization process, the rms value of ith bus voltage can becalculated from the following relationship:
|Vi | =√√√√∣∣∣V (1)
i
∣∣∣2 +hmax∑h=h0
∣∣∣V (h)i
∣∣∣2(8)
2. Distribution network constraint: The distributionnetworks are usually operated in the radial form. Hence, itis essential to look over the radial form of network throughthe optimization process.
3. Number and size of capacitors constraint: The capacitorsare generally manufactured in the standard sizes. Hence,the size of capacitors must be chosen from integer discretevalues. It should be paid attention that the total injectedreactive power of capacitors must not exceed from thetotal reactive demand of network.
3 Optimization Techniques
3.1 Fuzzy Optimization Method
Multi-objective optimization problems usually have severalsolution points. Choosing a specific solution among validsolution points is a challenging work during the optimizationprocess. Fuzzy theory is one of the most well-known methodsfor solving multi-objective problems. In this work, a fuzzysystem is used to reach a compromise between the differ-ent terms of multi-objective function. Evidently, the differentterms of multi-objective function have different dimensions.Hence, there is a need for the use of a framework, wherethey can be compared more easily in the reconfiguration andcapacitor placement process. Therefore, a membership func-tion is assigned for each term of multi-objective function. Themembership function indicates the membership degree ofeach multi-objective function variable [15]. Figure 1 demon-strates a linear membership function that is used for eachvariable of multi-objective function. This membership func-tion can be formulated as follows:
µFi (X) =
⎧⎪⎪⎨⎪⎪⎩
1 Fi (X) ≤ Fmini
Fmaxi −Fi (X)
Fmaxi −Fmin
iFmin
i ≤ Fi (X) ≤ Fmaxi
0 Fi (X) ≥ Fmaxi
(9)
where
µFi (X) ith fuzzy variableFmax
i the maximum value of Fi (X) parameterFmin
i the minimum value of Fi (X) parameter
123

Arab J Sci Eng
Fig. 1 A linear membership function that is used for each variable ofmulti-objective function
In order to determine the maximum and minimum valuesof Fi (X), the best and worst optimized solution of each termof multi-objective function is utilized individually.
After the fuzzification process, the multi-objective func-tion is altered as follows:
F = w1 × µF1 + w2 × µF2 (10)
where w1 and w2 are the constant weighting factors for fuzzyvariables. Regarding to the desired goals in the distributionsystem, these factors are specified by the system operatorbetween zero and one. It is obvious that the optimum solutionpoint will be moved towards the goal that its weighting factoris more.
3.2 Harmony Search Algorithm
The HS algorithm originally was inspired by the analogybetween music improvisation and optimization process. Justas the musical instruments are played with certain discretemusical notes based on musicians’ experiences or random-ness in an improvisation process, so design variables can beassigned with certain discrete values based on computationalintelligence or by random in the optimization process [16].Just as musicians improve their experiences based on an aes-thetic standard, design variables in computer memory can beimproved based on fitness function. To consider the computa-tional intelligence or randomness, the original HS algorithmperforms based on five steps as follows [17]:
Step 1: Initializing algorithm parameters.Step 2: Providing the harmony memory.Step 3: Improvising a new harmony.Step 4: Updating harmony memory.Step 5: Checking the stopping criterion.
The optimum design algorithm using HS is sketched basi-cally as shown in Fig. 2.
Fig. 2 The flowchart of HS optimization algorithm
Initializing algorithm parameters and problem is based onthe following problem description:
min(F(x) |x ∈ X) (11)
where F(x) is the objective function and x = (x1, x2, . . . , xN )
is a set of variables, which has upper and lower boundary asxl < xi < xu . Algorithm parameters that consist of thefollowing parameters are initialized in this step. The har-mony memory size (HMS), or the number of solution vec-tors in the harmony memory; harmony memory consideringrate (HMCR); pitch adjusting rate (PAR); number of deci-sion variables (N) and the number of improvisations (NI), orstopping criterion. The harmony memory (HM) is a mem-ory location where all the solution vectors (sets of decisionvariables) are stored.
In the second step to initialize the harmony memory, theHM matrix is filled with as many randomly generated solu-tion vectors as the HMS:
HM =
⎡⎢⎢⎢⎣
x1
x2
...
xHMS
F(x1)
F(x2)...
F(xHMS)
⎤⎥⎥⎥⎦ (12)
123
Arab J Sci Eng
In step 3 to improvise a new harmony, three rules must beconsidered:
Rule 1: Memory consideration.Rule 2: Pitch adjustment.Rule 3: Random selection.To implement the first rule, the value of the first deci-
sion variable x ′1 for the new vector x ′ = (x ′1, x ′2, . . . , x ′N )
is selected from any of the values in the specified HM range(x1
1−x H M S1 ). Other variables can be chosen in the same man-
ner. Here, the HMCR parameter that varies between 0 and 1is defined as the probability of selecting one value from thehistorical values stored in the HM:
x ′i
←{
x ′i ∈{
x1i , x2
i , . . . , xHMSi
}with probability HMCR
x ′i ∈ Xi with probability (1-HMCR)
(13)
For example, an HMCR = 0.8 indicates that the HS algo-rithm will choose the decision variable value from histori-cally stored values in the HM with the probability of 80 %or from the entire possible range Xi with the probability of20 %.
Each component obtained by the memory consideration,is tested to determine whether it should be pitch-adjusted ornot. This operation applies the PAR parameter, which is therate of pitch adjustment as follows:
x ′i ←{
x ′i + (u(−1, 1)× bw) with probability PARx ′i with probability (1-PAR)
(14)
where bw is an arbitrary distance bandwidth for the con-tinuous design variable, and u(−1,1) is a uniform distribu-tion between -1 and 1. Clearly, step 3 deals with generatingnew potential variation in the algorithm and is comparableto mutation in the standard evolutionary algorithm.
In step 4, if the new harmony vector x1 = (x ′1, x ′2, . . . , x ′N )
has better fitness function than the worst harmony in the HM,the new harmony is included in the HM and the existingworst harmony is excluded from the HM. The HS algorithmis stopped when the stopping condition (e.g., maximum num-ber of improvisations) has been satisfied.
3.3 Fuzzy Harmony Search Algorithm
The fuzzy-HS algorithm is a developed version of HS algo-rithm that is proposed in this work. As it is mentioned inprevious section, the HS algorithm parameters are adjustedaccording to HMCR and PAR parameters. Although the val-ues of HMCR and PAR seem to be selected properly through-out the different steps of HS algorithm, in some cases, thespecific values of them lead to some errors in approaching
Fig. 3 The membership function assigned to HMCR
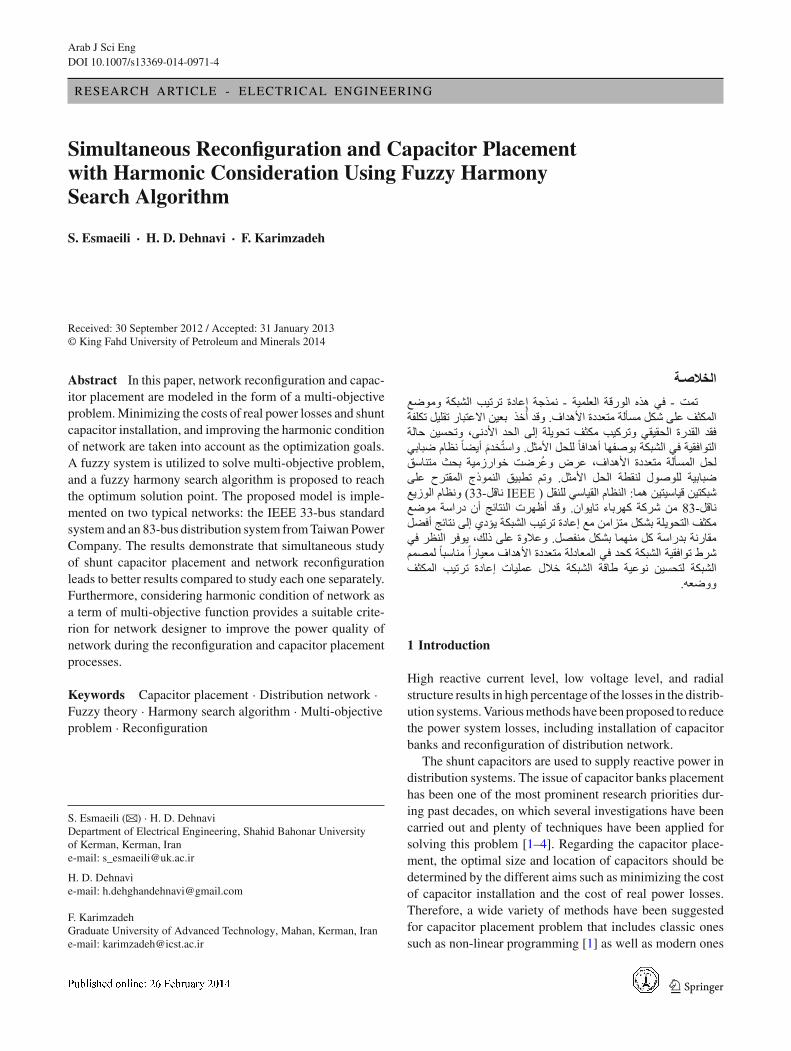
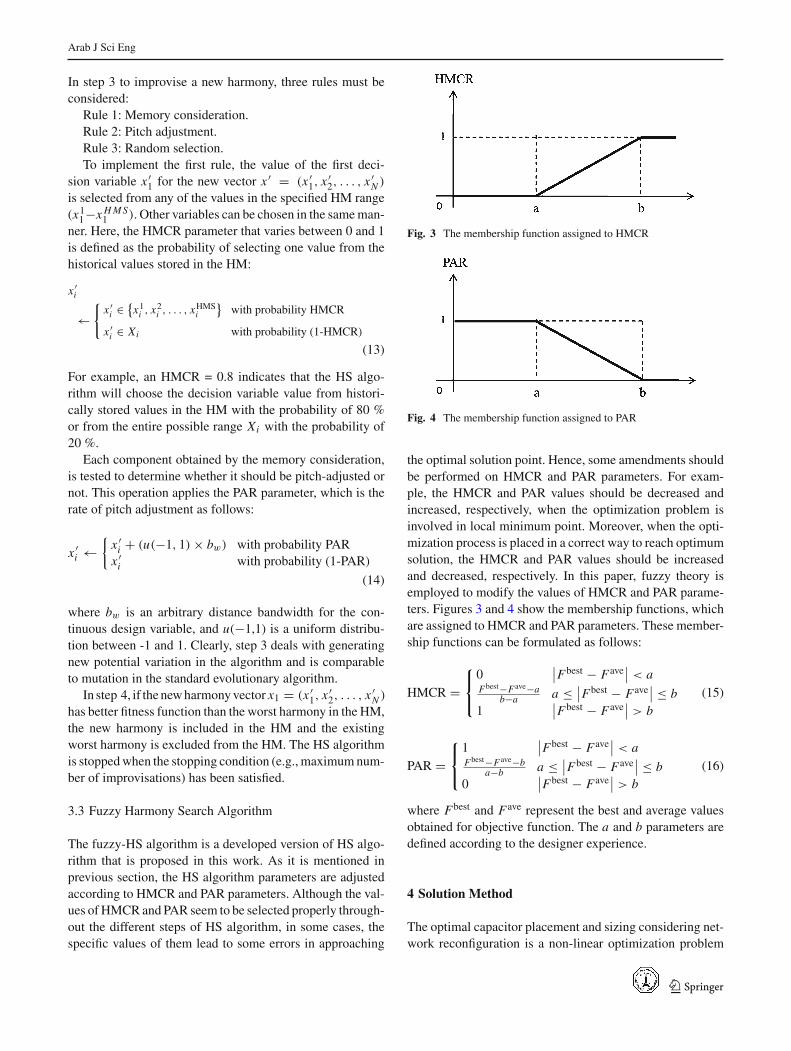
Fig. 4 The membership function assigned to PAR
the optimal solution point. Hence, some amendments shouldbe performed on HMCR and PAR parameters. For exam-ple, the HMCR and PAR values should be decreased andincreased, respectively, when the optimization problem isinvolved in local minimum point. Moreover, when the opti-mization process is placed in a correct way to reach optimumsolution, the HMCR and PAR values should be increasedand decreased, respectively. In this paper, fuzzy theory isemployed to modify the values of HMCR and PAR parame-ters. Figures 3 and 4 show the membership functions, whichare assigned to HMCR and PAR parameters. These member-ship functions can be formulated as follows:
HMCR =⎧⎨⎩
0∣∣Fbest − Fave
∣∣ < aFbest−Fave−a
b−a a ≤ ∣∣Fbest − Fave∣∣ ≤ b
1∣∣Fbest − Fave
∣∣ > b(15)
PAR =⎧⎨⎩
1∣∣Fbest − Fave
∣∣ < aFbest−Fave−b
a−b a ≤ ∣∣Fbest − Fave∣∣ ≤ b
0∣∣Fbest − Fave
∣∣ > b(16)
where Fbest and Fave represent the best and average valuesobtained for objective function. The a and b parameters aredefined according to the designer experience.
4 Solution Method
The optimal capacitor placement and sizing considering net-work reconfiguration is a non-linear optimization problem
123
Arab J Sci Eng
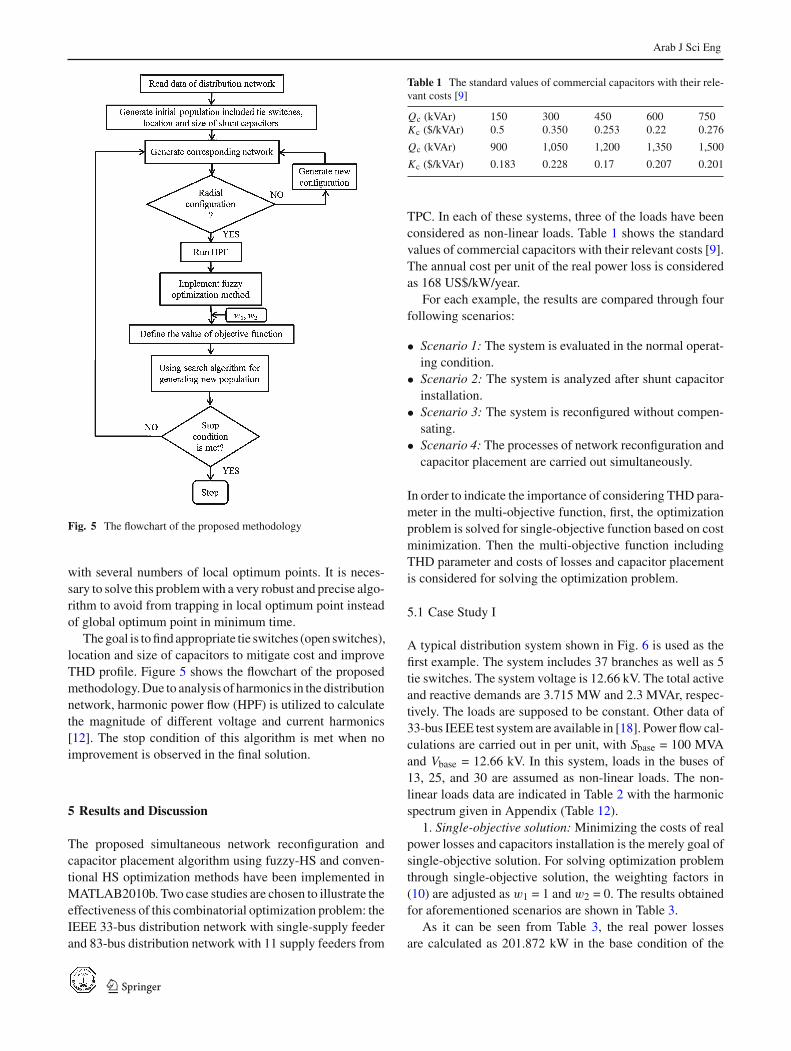
Fig. 5 The flowchart of the proposed methodology
with several numbers of local optimum points. It is neces-sary to solve this problem with a very robust and precise algo-rithm to avoid from trapping in local optimum point insteadof global optimum point in minimum time.
The goal is to find appropriate tie switches (open switches),location and size of capacitors to mitigate cost and improveTHD profile. Figure 5 shows the flowchart of the proposedmethodology. Due to analysis of harmonics in the distributionnetwork, harmonic power flow (HPF) is utilized to calculatethe magnitude of different voltage and current harmonics[12]. The stop condition of this algorithm is met when noimprovement is observed in the final solution.
5 Results and Discussion
The proposed simultaneous network reconfiguration andcapacitor placement algorithm using fuzzy-HS and conven-tional HS optimization methods have been implemented inMATLAB2010b. Two case studies are chosen to illustrate theeffectiveness of this combinatorial optimization problem: theIEEE 33-bus distribution network with single-supply feederand 83-bus distribution network with 11 supply feeders from
Table 1 The standard values of commercial capacitors with their rele-vant costs [9]
Qc (kVAr) 150 300 450 600 750Kc ($/kVAr) 0.5 0.350 0.253 0.22 0.276
Qc (kVAr) 900 1,050 1,200 1,350 1,500
Kc ($/kVAr) 0.183 0.228 0.17 0.207 0.201
TPC. In each of these systems, three of the loads have beenconsidered as non-linear loads. Table 1 shows the standardvalues of commercial capacitors with their relevant costs [9].The annual cost per unit of the real power loss is consideredas 168 US$/kW/year.
For each example, the results are compared through fourfollowing scenarios:
• Scenario 1: The system is evaluated in the normal operat-ing condition.• Scenario 2: The system is analyzed after shunt capacitor
installation.• Scenario 3: The system is reconfigured without compen-
sating.• Scenario 4: The processes of network reconfiguration and
capacitor placement are carried out simultaneously.
In order to indicate the importance of considering THD para-meter in the multi-objective function, first, the optimizationproblem is solved for single-objective function based on costminimization. Then the multi-objective function includingTHD parameter and costs of losses and capacitor placementis considered for solving the optimization problem.
5.1 Case Study I
A typical distribution system shown in Fig. 6 is used as thefirst example. The system includes 37 branches as well as 5tie switches. The system voltage is 12.66 kV. The total activeand reactive demands are 3.715 MW and 2.3 MVAr, respec-tively. The loads are supposed to be constant. Other data of33-bus IEEE test system are available in [18]. Power flow cal-culations are carried out in per unit, with Sbase = 100 MVAand Vbase = 12.66 kV. In this system, loads in the buses of13, 25, and 30 are assumed as non-linear loads. The non-linear loads data are indicated in Table 2 with the harmonicspectrum given in Appendix (Table 12).
1. Single-objective solution: Minimizing the costs of realpower losses and capacitors installation is the merely goal ofsingle-objective solution. For solving optimization problemthrough single-objective solution, the weighting factors in(10) are adjusted as w1 = 1 and w2 = 0. The results obtainedfor aforementioned scenarios are shown in Table 3.
As it can be seen from Table 3, the real power lossesare calculated as 201.872 kW in the base condition of the
123

Arab J Sci Eng
Fig. 6 The IEEE 33-bus test distribution system
Table 2 Non-linear load data for the IEEE 33-bus system
Non-linear bus number Non-linear load type kW kVar
13 PWM-ASD 60 35
25 SIX-PULSE Variablefrequency drive
420 200
30 SIX-PULSE 200 600
network. The real power losses are reduced to 138.877 kWby installing shunt capacitors, while the real power lossesare reduced to 137.764 kW when the network reconfigura-tion is performed without capacitor compensating. It can bededuced from the results that the reconfiguration can reducethe real power losses as well as capacitor placement. It is avaluable point for reconfiguration in losses reduction as it isperformed with lower cost compared with capacitor place-ment. In scenario 4, the real power losses are reduced to112.052 kW, which reflects the advantage of simultaneous
performing network reconfiguration and capacitor placementin losses reduction.
Regarding to investigate the harmonic condition of net-work in each scenario, different indices are defined. TheSATHD index represents the system average total harmonicdistortion that is calculated from the following relationship[19]:
SATHD =∑n
s=1 LsTHDs
LT(17)
whereLT total connected kVA served from the system;Ls connected kVA served from bus sth;It is worthwhile to note that the SATHD index is not
intended as an exact representation of the quality of serviceprovided to each customer. It can be used as a benchmarkagainst which quality levels of different distribution systemscan be compared.
In Table 3, the THD-D shows the value of total harmon-ics distortion deviation which is calculated from (4). More-over, the NEB parameter represents the number of busesthat their THD values have exceeded from standard value of5 %. The obtained results for harmonic parameters demon-strate that both capacitor installation and network reconfig-uration affect the harmonic condition of network. Withoutconsidering harmonic condition in the objective function,the capacitor placement may largely distort the harmoniccondition of network as the THD-D, SATHD and NEB para-meters are increased from 64.3854, 6.8118 and 22 in sce-nario 1 to 141.4936, 8.7368 and 25 in scenario 4, respec-tively. Along with capacitor placement, network reconfigu-ration may also distort the harmonic condition of network.However, in single-objective solution of this case study, thereconfiguration process incidentally improves the harmoniccondition of network as the THD-D, SATHD and NEB para-meters are improved to 44.1564, 6.7774 and 5 in scenario
Table 3 Simulation results forsingle-objective problem (casestudy I)
Scenario 1 Scenario 2 Scenario 3 Scenario 4
Real power losses (kW) 201.872 138.877 137.764 112.052
Minimum bus 0.9082 0.9251 0.9358 0.9473
voltage (pu)
Maximum 13.9167 13.9361 13.6560 31.1270
THD (%)
THD-D (%) 64.3854 141.4936 44.1564 149.2491
SATHD (%) 6.8118 8.7368 6.7774 8.8522
NEB 22 25 5 25
Total cost ($) 33,914 23,760 23,144 19,328
Tie switches 33, 34, 35, 36, 37 33, 34, 35, 36, 37 7, 9, 14, 32, 37 6, 9, 32, 34, 37
Capacitor location (Bus no.) – 30, 23, 11, 6 – 11, 5, 19, 29, 23
Size of capacitors (×150 kVAr) – 6, 3, 1, 1 – 3, 6, 1, 1, 1
123

Arab J Sci Eng
Table 4 Simulation results formulti-objective problem (casestudy I)
Scenario 1 Scenario 2 Scenario 3 Scenario 4
Fitness function (F) 0.5 0.2615 0.2382 0.1062
Real power losses (kW) 201.872 139.775 140.087 111.429
Minimum bus voltage (pu) 0.9082 0.9312 0.9413 0.9429
Maximum THD (%) 13.9167 10.3498 10.1201 9.1185
THD-D (%) 64.385 25.1914 22.3114 12.4473
SATHD (%) 6.8118 5.8946 4.1836 3.1637
NEB 22 7 5 4
Total cost ($) 33,914 24,003 23,534 19,360
Tie switches 33, 34, 35, 36, 37 33, 34, 35, 36, 37 7, 9, 14, 28, 32 6, 8, 9, 28, 32
Capacitor location (Bus no.) – 31, 8, 29, 22 – 31, 30, 15, 22, 20
Size of capacitors (×150 kVAr) – 7, 4, 1, 1 – 2, 9, 1, 1, 2
3, respectively. The obtained results for scenario 4 representthat the simultaneous network reconfiguration and capacitorplacement without considering harmonic condition index inthe objective function distorts the harmonic condition levelof network. This deduction can be attained by focusing onthe obtained results for harmonic parameters in scenario 4.As it can be seen, the THD-D, SATHD and NEB parame-ters are increased to 149.2491, 8.8522 and 25 in scenario4.
2. Multi-objective solution: In multi-objective solution,the weighting factors are adjusted to w1 = 0.7 and w2 =0.3, that reflect the more importance of costs reduction inthe optimization problem. However, the THD index is notcompletely disregarded. As it is stated before, the weightingfactors are determined according to the opinion of systemdesigner. The results obtained through four defined scenariosare shown in Table 4.
In comparison to single-objective solution, the total costobtained for each scenario is slightly increased in multi-objective solution. However, as it is expected, the value ofharmonic parameters is significantly improved in the multi-objective solution due to considering THD index as a termof multi-objective function.
As it is obvious from the results, in scenario 2, the opti-mal fitness is decreased from 0.5 (base condition) to 0.2615,by optimal capacitor placement and sizing. In scenario 3,optimal fitness is decreased to 0.2382, by only reconfigura-tion. However, in scenario 4, which is dedicated to capacitorinstallation and network reconfiguration simultaneously, theoptimal fitness decreases to 0.1062. Both network reconfigu-ration and capacitor installation can reduce cost and improveTHD index as well. It can be deduced from simulation resultsthat simultaneous study of capacitor placement and networkreconfiguration results in more improvement in cost and THDindex, as well as more reduction in real power losses.
Table 5 shows the variations of different parameters inscenario 2, 3, and 4 compared with base condition of network
Table 5 Variations of different parameters in scenarios 2, 3, and 4compared with base condition of network (case study I)
Scenario 2 Scenario 3 Scenario 4
Fitness function reduction (%) 47.7 52.4 78.8
Real power losses reduction (kW) 30.76 30.6 44.8
Minimum bus voltage increment(%)
2.53 3.64 3.82
Maximum THD improvement(%)
25.63 27.28 34.48
THD-D improvement (%) 60.87 65.35 80.67
SATHD improvement (%) 13.46 38.58 53.55
NEB reduction (%) 68.2 77.3 81.8
Total cost reduction (%) 29.22 30.6 42.91
(scenario 1). For instance, the percentile variation of realpower losses in scenario 4 is computed through the followingformulation:
Real power losses reduction in scenario 4
=∣∣∣∣ Pscenario1
loss −Pscenario4loss
Pscenario1loss
∣∣∣∣× 100(18)
Other variations of parameters are calculated in a similar wayto real power losses reduction. As it is shown in Table 5, inthis case study, the network reconfiguration and capacitorplacement have the approximately comparable performancein reducing real power losses and improving harmonic para-meters. However, the best results are obtained as soon asthe network reconfiguration and capacitor placement are per-formed at the same time.
Figures 7 and 8 show bus voltages and harmonic profile ofnetwork in various scenarios. According to Fig. 7, the mag-nitude of bus voltages is lain within the permissible range,which is defined as 10 % of nominal voltage. As it is shownin Fig. 8, in scenario 4, the THD parameter in most of thebuses has less magnitude compared to other scenarios.
123
Arab J Sci Eng
Fig. 7 The magnitude of bus voltages in different scenarios of casestudy I
Fig. 8 Harmonic profile in different scenarios of case study I
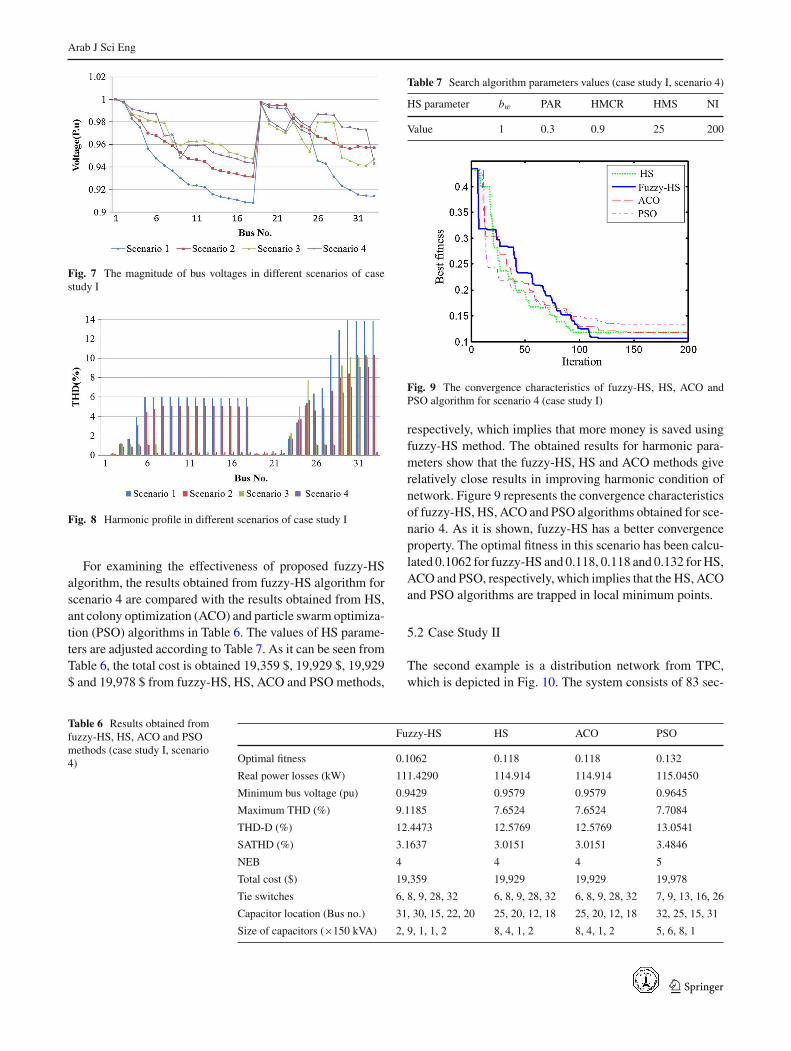
For examining the effectiveness of proposed fuzzy-HSalgorithm, the results obtained from fuzzy-HS algorithm forscenario 4 are compared with the results obtained from HS,ant colony optimization (ACO) and particle swarm optimiza-tion (PSO) algorithms in Table 6. The values of HS parame-ters are adjusted according to Table 7. As it can be seen fromTable 6, the total cost is obtained 19,359 $, 19,929 $, 19,929$ and 19,978 $ from fuzzy-HS, HS, ACO and PSO methods,
Table 7 Search algorithm parameters values (case study I, scenario 4)
HS parameter bw PAR HMCR HMS NI
Value 1 0.3 0.9 25 200
Fig. 9 The convergence characteristics of fuzzy-HS, HS, ACO andPSO algorithm for scenario 4 (case study I)
respectively, which implies that more money is saved usingfuzzy-HS method. The obtained results for harmonic para-meters show that the fuzzy-HS, HS and ACO methods giverelatively close results in improving harmonic condition ofnetwork. Figure 9 represents the convergence characteristicsof fuzzy-HS, HS, ACO and PSO algorithms obtained for sce-nario 4. As it is shown, fuzzy-HS has a better convergenceproperty. The optimal fitness in this scenario has been calcu-lated 0.1062 for fuzzy-HS and 0.118, 0.118 and 0.132 for HS,ACO and PSO, respectively, which implies that the HS, ACOand PSO algorithms are trapped in local minimum points.
5.2 Case Study II
The second example is a distribution network from TPC,which is depicted in Fig. 10. The system consists of 83 sec-
Table 6 Results obtained fromfuzzy-HS, HS, ACO and PSOmethods (case study I, scenario4)
Fuzzy-HS HS ACO PSO
Optimal fitness 0.1062 0.118 0.118 0.132
Real power losses (kW) 111.4290 114.914 114.914 115.0450
Minimum bus voltage (pu) 0.9429 0.9579 0.9579 0.9645
Maximum THD (%) 9.1185 7.6524 7.6524 7.7084
THD-D (%) 12.4473 12.5769 12.5769 13.0541
SATHD (%) 3.1637 3.0151 3.0151 3.4846
NEB 4 4 4 5
Total cost ($) 19,359 19,929 19,929 19,978
Tie switches 6, 8, 9, 28, 32 6, 8, 9, 28, 32 6, 8, 9, 28, 32 7, 9, 13, 16, 26
Capacitor location (Bus no.) 31, 30, 15, 22, 20 25, 20, 12, 18 25, 20, 12, 18 32, 25, 15, 31
Size of capacitors (×150 kVA) 2, 9, 1, 1, 2 8, 4, 1, 2 8, 4, 1, 2 5, 6, 8, 1
123
Arab J Sci Eng
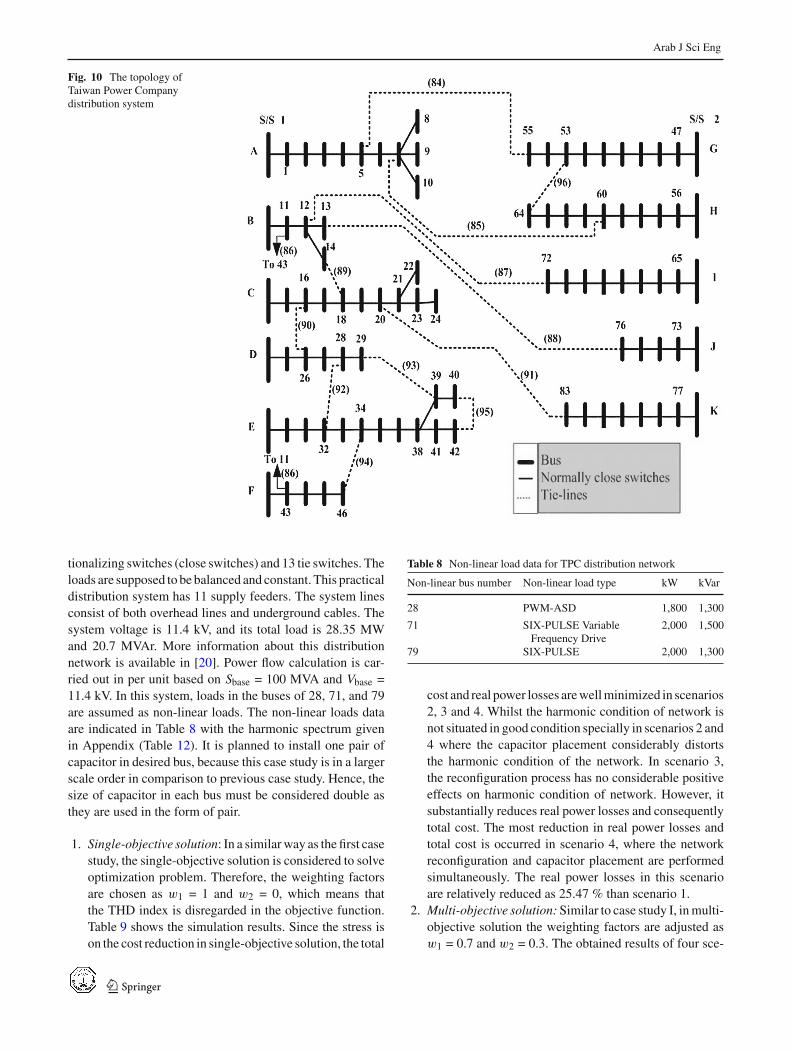
Fig. 10 The topology ofTaiwan Power Companydistribution system
tionalizing switches (close switches) and 13 tie switches. Theloads are supposed to be balanced and constant. This practicaldistribution system has 11 supply feeders. The system linesconsist of both overhead lines and underground cables. Thesystem voltage is 11.4 kV, and its total load is 28.35 MWand 20.7 MVAr. More information about this distributionnetwork is available in [20]. Power flow calculation is car-ried out in per unit based on Sbase = 100 MVA and Vbase =11.4 kV. In this system, loads in the buses of 28, 71, and 79are assumed as non-linear loads. The non-linear loads dataare indicated in Table 8 with the harmonic spectrum givenin Appendix (Table 12). It is planned to install one pair ofcapacitor in desired bus, because this case study is in a largerscale order in comparison to previous case study. Hence, thesize of capacitor in each bus must be considered double asthey are used in the form of pair.
1. Single-objective solution: In a similar way as the first casestudy, the single-objective solution is considered to solveoptimization problem. Therefore, the weighting factorsare chosen as w1 = 1 and w2 = 0, which means thatthe THD index is disregarded in the objective function.Table 9 shows the simulation results. Since the stress ison the cost reduction in single-objective solution, the total
Table 8 Non-linear load data for TPC distribution network
Non-linear bus number Non-linear load type kW kVar
28 PWM-ASD 1,800 1,300
71 SIX-PULSE VariableFrequency Drive
2,000 1,500
79 SIX-PULSE 2,000 1,300
cost and real power losses are well minimized in scenarios2, 3 and 4. Whilst the harmonic condition of network isnot situated in good condition specially in scenarios 2 and4 where the capacitor placement considerably distortsthe harmonic condition of the network. In scenario 3,the reconfiguration process has no considerable positiveeffects on harmonic condition of network. However, itsubstantially reduces real power losses and consequentlytotal cost. The most reduction in real power losses andtotal cost is occurred in scenario 4, where the networkreconfiguration and capacitor placement are performedsimultaneously. The real power losses in this scenarioare relatively reduced as 25.47 % than scenario 1.
2. Multi-objective solution: Similar to case study I, in multi-objective solution the weighting factors are adjusted asw1 = 0.7 and w2 = 0.3. The obtained results of four sce-
123

Arab J Sci Eng
Table 9 Simulation results for single-objective problem (case study II)
Scenario 1 Scenario 2 Scenario 3 Scenario 4
Real power losses (kW) 531.812 430.0850 469.807 375.7160
Minimum bus voltage (pu) 0.9286 0.9472 0.9532 0.9640
Maximum THD (%) 13.5734 78.9383 13.5601 73.9392
THD-D (%) 53.1380 440.4422 42.8599 362.5848
SATHD (%) 2.6055 8.4785 2.4009 7.7122
NEB 14 18 15 20
Total cost ($) 89,344 73,799 78,928 6,481
Tie switches 84, 85, 86, 87, 88, 89, 84, 85, 86, 87, 88, 89, 7, 13, 34, 39, 42, 55,62, 7, 13, 33, 39, 42, 63, 72,
Tie switches 90, 91, 92, 93, 94, 95, 96 90, 91, 92, 93, 94, 95, 96 72,83, 86, 89,90, 92 84, 86, 89, 90, 91, 92
Capacitor location (bus no.) – 81, 29, 51, 71, 5, 38, 23 – 82, 21, 71, 10, 53, 42, 36, 72, 6
Size of capacitors (×150 kVAr) – 8, 7, 6, 10, 9, 9, 1 – 9, 8, 10, 9, 6, 2, 3, 3, 4
Table 10 Simulation results for multi-objective problem (case study II)
Scenario 1 Scenario 2 Scenario 3 Scenario 4
Fitness function (F) 0.5 0.3798 0.3517 0.2147
Real power losses (kW) 531.812 449.381 470.732 396.363
Minimum voltage (pu) 0.9286 0.9479 0.9518 0.9532
Maximum THD (%) 13.5734 13.5734 13.5601 13.5601
THD-D (%) 53.138 51.9035 44.6150 38.3398
SATHD (%) 2.6055 2.4822 2.2950 2.1053
NEB 14 11 13 12
Total cost ($) 89344 76945 79083 68454
Tie switches 84, 85, 86, 87, 88, 89, 90,91, 92, 93, 94, 95, 96
84, 85, 86, 87, 88, 89, 90,91, 92, 93, 94, 95, 96
7, 34, 39, 42, 55, 63, 72,86, 88, 89, 90, 91, 92
7, 13, 34, 39, 41, 55, 63,72, 82, 86, 89, 90, 92
Capacitor location(Bus no.)
– 36, 9, 73, 52, 64, 10, 61 – 23, 64, 9, 10, 17, 35, 50, 6
Size of capacitors(×150 kVAr)
– 9, 9, 5, 8, 6, 7, 1 – 10, 10, 9, 7, 4, 5, 7, 6
narios are shown in Table 10. As it can be seen, in scenario2, the optimal fitness is decreased from 0.5 in scenario1 to 0.3798 by shunt capacitor placement. In scenario3, where the network reconfiguration is performed, theoptimal fitness is reduced to−0.3517. Whilst in scenario4, the simultaneous performing network reconfigurationand capacitor placement reduces the optimal fitness to0.2147. It can be inferred that in scenario 4, we havebeen getting closer to our optimization goals comparedto other scenarios.
The variations of different parameters are represented inTable 11. In contrast with case study I, the capacitor place-ment has more influence on losses reduction compared withnetwork reconfiguration. However, the harmonic conditionof network is in better situation when the reconfigurationprocess is performed on network in scenario 3. The obtainedresults for scenario 4 show that, as it is expected, the simulta-
Table 11 Variations of different parameters in scenarios 2, 3, and 4compared with base condition of network (case study II)
Scenario 2 Scenario 3 Scenario 4
Fitness function reduction (%) 24.04 29.66 57.06
Real power loss reduction (%) 15.5 11.49 25.47
Minimum bus voltageincrement (%)
2.07 2.5 2.65
Max THD improvement (%) 0 0.098 0.098
THD-D improvement (%) 2.3232 16.0394 27.8486
SATHD improvement (%) 4.73 11.92 19.20
NEB reduction (%) 21.43 7.14 14.29
Total cost reduction (%) 13.88 11.48 23.38
neous study of network reconfiguration and capacitor place-ment leads to more reduction in cost, and more improvementin THD index.
Figure 11 shows bus voltages of network in various sce-narios. As it is shown, the magnitudes of bus voltages are kept
123

Arab J Sci Eng
Fig. 11 The magnitude of bus voltages in different scenarios of casestudy II
in desired range, which is defined 10 % of nominal voltagemagnitude. Figure 12 demonstrates the harmonic profile ofnetwork for each scenario. The buses that their THD valueshave exceeded from 1 % are illustrated.
Figure 13 demonstrates the convergence characteristics offuzzy-HS, HS, ACO and PSO methods for scenario 4. Basedon the convergence characteristics, the fuzzy-HS, HS andACO methods are converged to the same point. However, thefuzzy-HS algorithm has reached the optimum solution pointafter 94 iterations, while the HS and ACO algorithms havereached the optimum solution after 128 and 140 iterations.Hence, it can be deduced that fuzzy-HS algorithm has beenconverged to optimum solution point faster than HS and ACOalgorithms in this case study.
6 Conclusion
In this paper, the combinational problem of optimal capaci-tor placement and network reconfiguration in the presence ofnon-linear loads has been formulated in the form of a multi-
Fig. 13 The convergence characteristics of fuzzy-HS, HS, ACO andPSO algorithms for scenario 4 (case study II)
objective function. Minimizing the cost of real power lossesand capacitor installation cost and improving the power qual-ity index have been pursued as the goals of the optimizationproblem. For solving the multi-objective optimization prob-lem, a fuzzy system is utilized. Moreover, a fuzzy-HS algo-rithm has been proposed to find the optimum solution point.The proposed model has been implemented on the IEEE33-bus distribution network and a 83-bus practical distrib-ution system. It can be inferred from the simulation resultsthat simultaneous study of capacitor placement and networkreconfiguration has considerable merit in comparison withanalyzing each of them separately. In addition, consideringharmonic condition of network as a term of multi-objectivefunction provides a suitable criterion for network designerto improve the power quality of network during the recon-figuration and capacitor placement processes. Finally, theresults obtained from fuzzy-HS, HS, ACO and PSO algo-rithms showed that the convergence behavior of proposedfuzzy-HS algorithm has found to be more reliable in com-parison to conventional HS, ACO and PSO methods.
Fig. 12 Harmonic profile indifferent scenarios of case studyII
123
Arab J Sci Eng
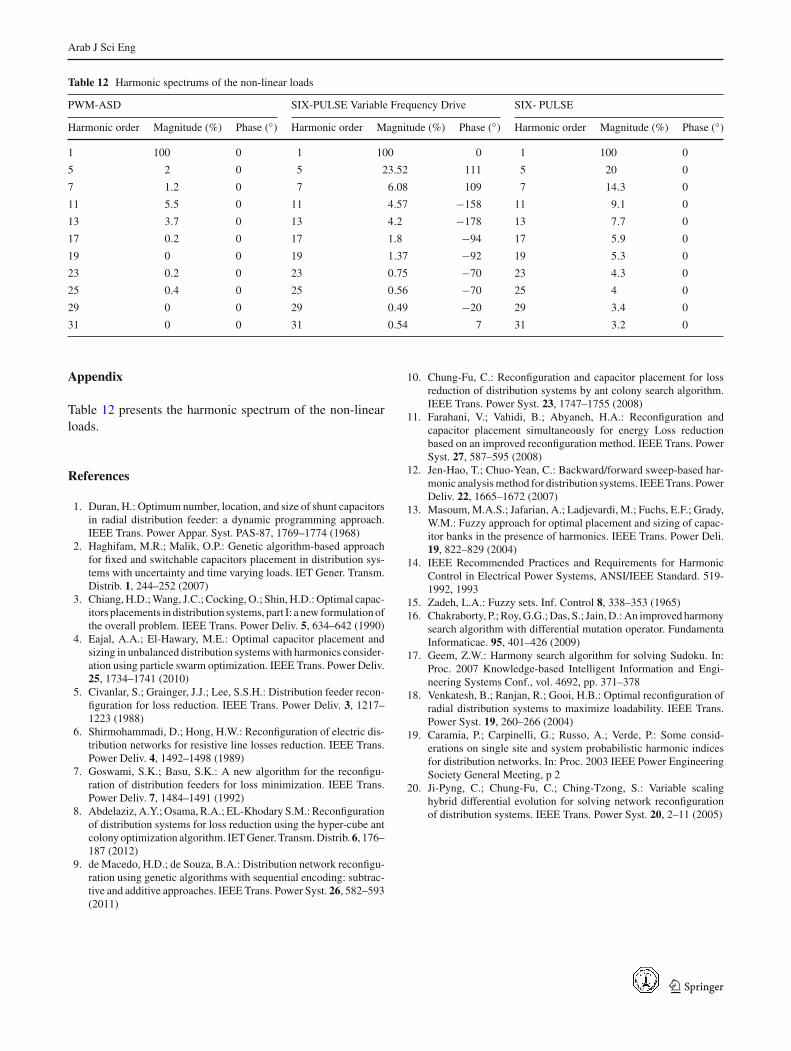
Table 12 Harmonic spectrums of the non-linear loads
PWM-ASD SIX-PULSE Variable Frequency Drive SIX- PULSE
Harmonic order Magnitude (%) Phase (◦) Harmonic order Magnitude (%) Phase (◦) Harmonic order Magnitude (%) Phase (◦)
1 100 0 1 100 0 1 100 0
5 2 0 5 23.52 111 5 20 0
7 1.2 0 7 6.08 109 7 14.3 0
11 5.5 0 11 4.57 −158 11 9.1 0
13 3.7 0 13 4.2 −178 13 7.7 0
17 0.2 0 17 1.8 −94 17 5.9 0
19 0 0 19 1.37 −92 19 5.3 0
23 0.2 0 23 0.75 −70 23 4.3 0
25 0.4 0 25 0.56 −70 25 4 0
29 0 0 29 0.49 −20 29 3.4 0
31 0 0 31 0.54 7 31 3.2 0
Appendix
Table 12 presents the harmonic spectrum of the non-linearloads.
References
1. Duran, H.: Optimum number, location, and size of shunt capacitorsin radial distribution feeder: a dynamic programming approach.IEEE Trans. Power Appar. Syst. PAS-87, 1769–1774 (1968)
2. Haghifam, M.R.; Malik, O.P.: Genetic algorithm-based approachfor fixed and switchable capacitors placement in distribution sys-tems with uncertainty and time varying loads. IET Gener. Transm.Distrib. 1, 244–252 (2007)
3. Chiang, H.D.; Wang, J.C.; Cocking, O.; Shin, H.D.: Optimal capac-itors placements in distribution systems, part I: a new formulation ofthe overall problem. IEEE Trans. Power Deliv. 5, 634–642 (1990)
4. Eajal, A.A.; El-Hawary, M.E.: Optimal capacitor placement andsizing in unbalanced distribution systems with harmonics consider-ation using particle swarm optimization. IEEE Trans. Power Deliv.25, 1734–1741 (2010)
5. Civanlar, S.; Grainger, J.J.; Lee, S.S.H.: Distribution feeder recon-figuration for loss reduction. IEEE Trans. Power Deliv. 3, 1217–1223 (1988)
6. Shirmohammadi, D.; Hong, H.W.: Reconfiguration of electric dis-tribution networks for resistive line losses reduction. IEEE Trans.Power Deliv. 4, 1492–1498 (1989)
7. Goswami, S.K.; Basu, S.K.: A new algorithm for the reconfigu-ration of distribution feeders for loss minimization. IEEE Trans.Power Deliv. 7, 1484–1491 (1992)
8. Abdelaziz, A.Y.; Osama, R.A.; EL-Khodary S.M.: Reconfigurationof distribution systems for loss reduction using the hyper-cube antcolony optimization algorithm. IET Gener. Transm. Distrib. 6, 176–187 (2012)
9. de Macedo, H.D.; de Souza, B.A.: Distribution network reconfigu-ration using genetic algorithms with sequential encoding: subtrac-tive and additive approaches. IEEE Trans. Power Syst. 26, 582–593(2011)
10. Chung-Fu, C.: Reconfiguration and capacitor placement for lossreduction of distribution systems by ant colony search algorithm.IEEE Trans. Power Syst. 23, 1747–1755 (2008)
11. Farahani, V.; Vahidi, B.; Abyaneh, H.A.: Reconfiguration andcapacitor placement simultaneously for energy Loss reductionbased on an improved reconfiguration method. IEEE Trans. PowerSyst. 27, 587–595 (2008)
12. Jen-Hao, T.; Chuo-Yean, C.: Backward/forward sweep-based har-monic analysis method for distribution systems. IEEE Trans. PowerDeliv. 22, 1665–1672 (2007)
13. Masoum, M.A.S.; Jafarian, A.; Ladjevardi, M.; Fuchs, E.F.; Grady,W.M.: Fuzzy approach for optimal placement and sizing of capac-itor banks in the presence of harmonics. IEEE Trans. Power Deli.19, 822–829 (2004)
14. IEEE Recommended Practices and Requirements for HarmonicControl in Electrical Power Systems, ANSI/IEEE Standard. 519-1992, 1993
15. Zadeh, L.A.: Fuzzy sets. Inf. Control 8, 338–353 (1965)16. Chakraborty, P.; Roy, G.G.; Das, S.; Jain, D.: An improved harmony
search algorithm with differential mutation operator. FundamentaInformaticae. 95, 401–426 (2009)
17. Geem, Z.W.: Harmony search algorithm for solving Sudoku. In:Proc. 2007 Knowledge-based Intelligent Information and Engi-neering Systems Conf., vol. 4692, pp. 371–378
18. Venkatesh, B.; Ranjan, R.; Gooi, H.B.: Optimal reconfiguration ofradial distribution systems to maximize loadability. IEEE Trans.Power Syst. 19, 260–266 (2004)
19. Caramia, P.; Carpinelli, G.; Russo, A.; Verde, P.: Some consid-erations on single site and system probabilistic harmonic indicesfor distribution networks. In: Proc. 2003 IEEE Power EngineeringSociety General Meeting, p 2
20. Ji-Pyng, C.; Chung-Fu, C.; Ching-Tzong, S.: Variable scalinghybrid differential evolution for solving network reconfigurationof distribution systems. IEEE Trans. Power Syst. 20, 2–11 (2005)
123