simultaneous quantitative estimation of lisinopril …
TRANSCRIPT

CHEMISTRY JOURNAL OF MOLDOVA. General, Industrial and Ecological Chemistry. 2020, 15(1), 8-20
ISSN (p) 1857-1727 ISSN (e) 2345-1688
http://cjm.asm.md
http://dx.doi.org/10.19261/cjm.2020.669
© Chemistry Journal of Moldova
CC-BY 4.0 License
SIMULTANEOUS QUANTITATIVE ESTIMATION OF
LISINOPRIL AND HYDROCHLOROTHIAZIDE RESIDUES USING
HPLC FOR CLEANING VALIDATION
Imeda Rubashvili a,b*
, Natela Karukhnishvili b, Khatuna Makharadze
b
aPetre Melikishvili Institute of Physical and Organic Chemistry, Ivane Javakhishvili Tbilisi State University,
31, Politkovskaya str., Tbilisi 0179, Georgia bQuality Control Laboratory, „Aversi-Rational“ Ltd, 14, Chirnakhuli str., Tbilisi 0198, Georgia
*e-mail: [email protected]; phone: (+995) 593 56 02 45
Abstract. The aim of this study was to develop and validate direct - swab and indirect - rinse sampling
procedures and a high performance liquid chromatography (HPLC) method for simultaneous
quantitative estimation of residues of active pharmaceutical ingredients (API) – lisinopril and
hydrochlorothiazide (HCT) in cleaning control samples collected from pharmaceutical manufacturing
equipment surfaces after manufacturing of lisinopril/hydrochlorothiazide 20/25 mg uncoated tablets.
The swab and rinse sampling procedures were developed and validated in order to obtain a suitable and
good recovery (>80%). The acceptance limits of the above-mentioned APIs on the manufacturing
equipment surfaces have been established based on pharmacological and toxicological criteria.
The new, rapid, specific and selective, developed HPLC method for simultaneous quantitative
determination of lisinopril and HCT residues was validated with respect to robustness, system
suitability test, specificity, linearity-range, precision, limits of detection and quantitation. The stability
of APIs solutions and membrane filter compatibility were studied as well. The method validation was
carried out according to ICH Q2 guideline and United States Pharamcopeia requirements. The limit of
detection and the limit of quantitation for lisinopril were 0.039 µg/mL and 0.155 µg/mL and for HCT -
0.012 µg/mL and 0.025 µg/mL, respectively.
Keywords: lisinopril, hydrochlorthiazide, swab sampling, rinse sampling, HPLC, validation.
Received: 23 March 2020/ Revised final: 08 May 2020/ Accepted: 12 May 2020
Introduction
Cleaning validation should be performed
in order to confirm the effectiveness of any
cleaning procedure for all products contacting
pharmaceutical manufacturing equipment. This
activity is required by FDA (Food and Drug
Administration) and GMP (Good Manufacturing
Practice) in pharmaceutical industry and
establishes documented evidence with a high
degree of assurance that the cleaning procedure
effectively removes chemical (the previous
product’s active pharmaceutical ingredient or
cleaning/disinfectant agent) or microbial residues
from the manufacturing equipment and facilities
below the scientifically predetermined acceptable
level. Drug manufacturers must demonstrate that
cleaning processes are capable and effective in
removing contaminants from the product contact
surfaces to the above-mentioned limits. From both
regulatory and industry standpoint, cleaning
validation is a critical analytical responsibility of
the quality assurance system and an important
activity which establishes that cross-
contamination of the next batch of different
pharmaceutical products is under control to ensure
the quality of the finished product and patient
safety [1-3].
The developed cleaning procedure used in
the manufacturing process of a new
pharmaceutical product – uncoated tablets of
lisinopril/hydrochlorothiazide 20/25 mg must
have been inspected and experimentally proven in
accordance with the GMP requirements to be
suitable and efficient for removal of APIs residues
of the above-mentioned product to ensure proper
quality and prevent cross-contamination of the
subsequent drug product. The need to carry out
the cleaning validation was due to the fact that
this product is the worst case for the cleaning
procedure regarding the solubility of the product’s
active pharmaceutical ingredients. In order to
perform cleaning validation, it was necessary to
find a sensitive and specific analytical method
combined with appropriate sampling procedures
for simultaneous determination of lisinopril and
8
I. Rubashvili et al. / Chem. J. Mold., 2020, 15(1), 8-20
hydrochlorthiazide (HCT) residues on the
manufacturing equipment surfaces.
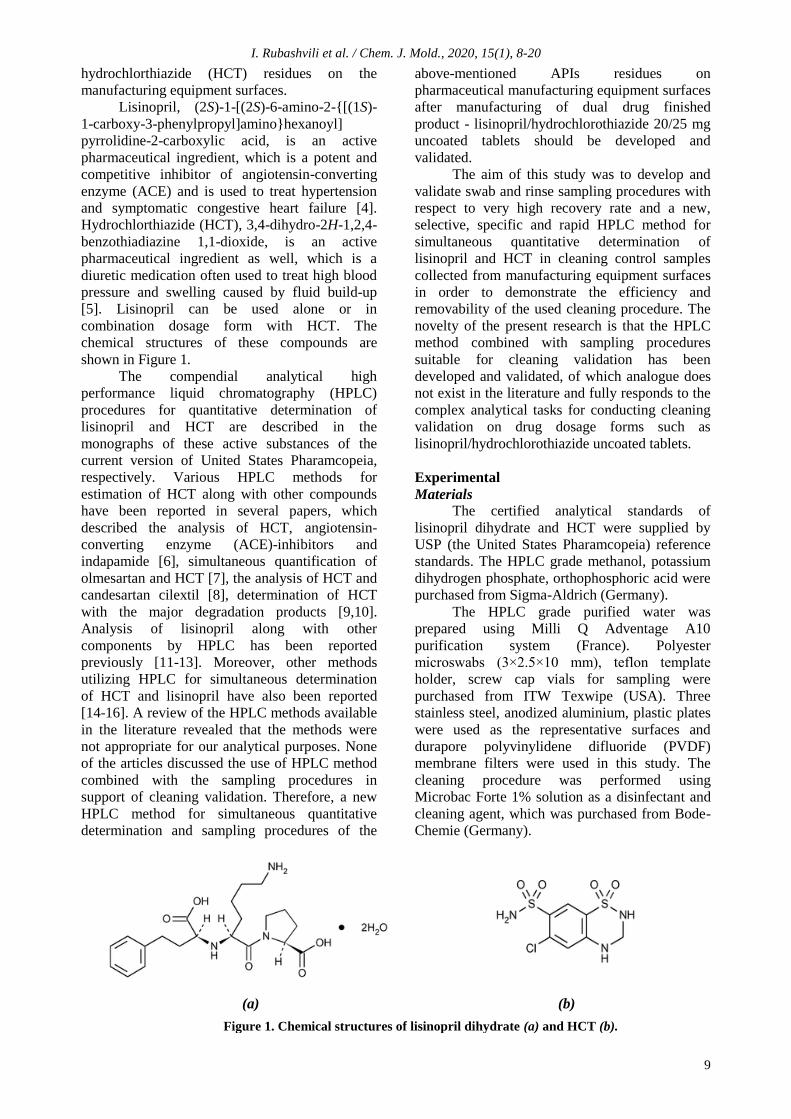
Lisinopril, (2S)-1-[(2S)-6-amino-2-{[(1S)-
1-carboxy-3-phenylpropyl]amino}hexanoyl]
pyrrolidine-2-carboxylic acid, is an active
pharmaceutical ingredient, which is a potent and
competitive inhibitor of angiotensin-converting
enzyme (ACE) and is used to treat hypertension
and symptomatic congestive heart failure [4].
Hydrochlorthiazide (HCT), 3,4-dihydro-2H-1,2,4-
benzothiadiazine 1,1-dioxide, is an active
pharmaceutical ingredient as well, which is a
diuretic medication often used to treat high blood
pressure and swelling caused by fluid build-up
[5]. Lisinopril can be used alone or in
combination dosage form with HCT. The
chemical structures of these compounds are
shown in Figure 1.
The compendial analytical high
performance liquid chromatography (HPLC)
procedures for quantitative determination of
lisinopril and HCT are described in the
monographs of these active substances of the
current version of United States Pharamcopeia,
respectively. Various HPLC methods for
estimation of HCT along with other compounds
have been reported in several papers, which
described the analysis of HCT, angiotensin-
converting enzyme (ACE)-inhibitors and
indapamide [6], simultaneous quantification of
olmesartan and HCT [7], the analysis of HCT and
candesartan cilextil [8], determination of HCT
with the major degradation products [9,10].
Analysis of lisinopril along with other
components by HPLC has been reported
previously [11-13]. Moreover, other methods
utilizing HPLC for simultaneous determination
of HCT and lisinopril have also been reported
[14-16]. A review of the HPLC methods available
in the literature revealed that the methods were
not appropriate for our analytical purposes. None
of the articles discussed the use of HPLC method
combined with the sampling procedures in
support of cleaning validation. Therefore, a new
HPLC method for simultaneous quantitative
determination and sampling procedures of the
above-mentioned APIs residues on
pharmaceutical manufacturing equipment surfaces
after manufacturing of dual drug finished
product - lisinopril/hydrochlorothiazide 20/25 mg
uncoated tablets should be developed and
validated.
The aim of this study was to develop and
validate swab and rinse sampling procedures with
respect to very high recovery rate and a new,
selective, specific and rapid HPLC method for
simultaneous quantitative determination of
lisinopril and HCT in cleaning control samples
collected from manufacturing equipment surfaces
in order to demonstrate the efficiency and
removability of the used cleaning procedure. The
novelty of the present research is that the HPLC
method combined with sampling procedures
suitable for cleaning validation has been
developed and validated, of which analogue does
not exist in the literature and fully responds to the
complex analytical tasks for conducting cleaning
validation on drug dosage forms such as
lisinopril/hydrochlorothiazide uncoated tablets.
Experimental
Materials
The certified analytical standards of
lisinopril dihydrate and HCT were supplied by
USP (the United States Pharamcopeia) reference
standards. The HPLC grade methanol, potassium
dihydrogen phosphate, orthophosphoric acid were
purchased from Sigma-Aldrich (Germany).
The HPLC grade purified water was
prepared using Milli Q Adventage A10
purification system (France). Polyester
microswabs (3×2.5×10 mm), teflon template
holder, screw cap vials for sampling were
purchased from ITW Texwipe (USA). Three
stainless steel, anodized aluminium, plastic plates
were used as the representative surfaces and
durapore polyvinylidene difluoride (PVDF)
membrane filters were used in this study. The
cleaning procedure was performed using
Microbac Forte 1% solution as a disinfectant and
cleaning agent, which was purchased from Bode-
Chemie (Germany).
(a) (b)
Figure 1. Chemical structures of lisinopril dihydrate (a) and HCT (b).
9

I. Rubashvili et al. / Chem. J. Mold., 2020, 15(1), 8-20
Instrumentation
The HPLC analysis was performed using an
Ag 1260 Infinity system and the output signal was
monitored and processed using the Chemstation
software (USA). SONOREX™ Digital 102P
ultrasonic bath DK 102 (Germany), Vortex-
Genie™ 2 (USA), shaker 3056 IKA SH 501
DIGITAL Werke (Germany), semi-micro
analytical balance CPA 232S Sartorius
(Germany), GFL water bath (Germany) were used
for sample preparation. All the measuring
equipment were appropriately calibrated and
qualified. The experiment was carried out in a
controlled laboratory area (temperature,
t= 22±3°C, relative humidity, RH= 45±15%).
Chromatographic system conditions
The method was developed using the
following columns - BDS Hypersil C8(2)
250×4.6 mm, 5 μm (Thermo Scientific) and
LiChrospher® RP-8 250×4.6 mm, 5 μm (Merk-
Millipore) with an isocratic elution of mobile
phase containing a mixture of buffer solution
pH 3.0 and methanol (60/40 v/v) filtered through
PVDF 0.45 μm membrane filters and degassed;
the flow rate of mobile phase was 0.7 mL/min; the
UV detection was performed at different
wavelengths - 215 nm for lisinopril and 272 nm
for HCT; the injected volume was 10 μL; the
column temperature was maintained at 40°C.
Validation of analytical HPLC method
The developed HPLC method was
validated with respect to robustness - standard
solution stability, membrane filter compatibility
test, chromatographic critical factors study using
design of experiments (DoE), system suitability
test (SST), specificity, linearity-range, precision,
limits of detection (LOD) and quantitation (LOQ)
according to ICH (International Conference on
Harmonisation) guideline and Microsoft Excel
2010 was used for statistical assessment and
graphical analysis [17].
Sample preparation and sampling procedure
Lisinopril and HCT reference standards
diluted in a mixture of methanol and water
90/10 v/v were used as a standard solution
at the concentration of 10/20 μg/mL and
12.5/25 μg/mL, respectively.
Rinsing and swabbing are two sampling
procedures available to demonstrate cleaning
validation; the both sampling procedures were
used in this study. The swabbing is a subjective
manual procedure, which involves physical
interaction between the swab and the equipment
surface and varies from sampler to sampler. The
surface was successively wiped with one swab
moistened with extraction solution (diluent – a
mixture of methanol and water 90/10 v/v). The
scheme of swabbing procedure is shown in
Figure 2(a). The swabs were placed in the 5 mL
screw-cap test tubes containing 1 mL of the
selected diluent. Subsequently, the tubes were
placed in an ultrasonic bath for 2 minutes and the
solutions were analyzed by HPLC. The rinse
samples from uneven surfaces (i.e. plastic brush)
were collected by rinsing with the fixed volume of
the diluent.
Due to the nature of material of the
manufacturing equipment surfaces, the three types
of material - stainless steel, anodized aluminium
and plastic were selected, which were previously
cleaned by using disinfectant/detergent and dried
before the experiment. The sampling points (hard
to clean) were determined based on risk
assessment using HACCP (hazard analysis and
critical control points).
(a) (b)
Figure 2. The scheme of swabbing procedure (a) and sequence (steps 1-4) of swab wiping (b).
10

I. Rubashvili et al. / Chem. J. Mold., 2020, 15(1), 8-20
The usual standardized swab sampling
procedure (procedure I) involved moistening
swabs with solvent and swabbing the area to be
sampled in an overlapping zigzag pattern – first
the surface area was wiped horizontally from one
side to the other (back and forth) (1, 2 in
Figure 2(b)), then, after rotating the swab,
vertically (up and down) (3, 4 in Figure 2(b)).
Fresh surface was exposed and repeatedly wiped
to extract the maximum residue. Finally, the swab
was stored in a closed and labelled container for
estimation. Two other variants - the procedures II
and III differ from the procedure I only in the
swabbing direction and were only used for the
robustness study. According to the procedure II,
first the surface area was wiped horizontally
from one side to the other and then, after rotating
the swab, again horizontally. According to
the procedure III, first the surface area was
wiped diagonally upwards and downwards, after
rotating the swab, again diagonally in the same
manner [3,18,19].
Design of experiments
For the robustness test of the developed
swab sampling procedure and analytical HPLC
method, both quantitative and qualitative factors,
selected based on experience were considered.
The five factors with their levels for swabbing
procedure and HPLC method are summarized in
Tables 1 and 2. The percentage recovery rate of
each API from the surface and system suitability
test parameters – the column efficiency
(theoretical plates – N), the tailing factor (USP
symmetry - As), the relative standard deviation
(RSD) of peak areas (RSDA) and the RSD of
retention times (RSDRT) (n= 6) and the resolution
factor between HCT and lisinopril at 215 nm (Rs)
obtained from standard solution were used as the
response variable for the swab sampling
procedure and analytical HPLC method,
respectively. The experiment was conducted in
25-2
= 8 runs for five two-level factors.
Validation of sampling procedure
Validation parameters - robustness and
accuracy of sampling procedure were studied
using the DoE technique. Both developed
sampling procedures were checked and the
percentage recovery rate (two individual
determinations) was determined. The selected
surface area of the plates was sprayed with
100 μL (for swabbing) and 5 mL (rinsing)
of standard stock solution (lisinopril and HCT
at concentration – 100/200 mg/mL and
125/250 μg/mL, respectively) using a
micropipette and the solvent was allowed to
evaporate. Then swab sampling was performed
according to swab wipe standardized procedure as
described in sample solution preparation. The
swab samples were diluted with the same diluent
to 1 mL. For rinse sampling, the surface area was
rinsed with approximately 100 mL of diluent and
then diluted to a volume with the same diluent to
100 mL, and mixed well. Then it was filtered
through a 0.45 μm membrane filter.
The percentage recovery rate was
calculated by Eq.(1):
(1)
where, Arec is the peak area of lisinopril/HCT
obtained from sample solution (recovered
amount);
Asp is the peak area of lisinopril/HCT
obtained from spiked solution (amount
added) [3].
Table 1
Robustness factors and design of experiments for swab sampling procedure.
No. Factor (Xi) Unit Low level (-) Nominal level (0) High level (+)
1 Surface material (X1) - Anodized aluminum Stainless steel Plastic
2 Swabbing (X2) - II I III
3 Methanol percentage in diluent (X3) % 80% 90% 100%
4 Sampler (X4) - I Chemist-analyst - II Chemist-analyst
5 Amount spiked (lisinopril) μg 8 10 12
Amount spiked (HCT) (X5) 10 12.5 15
Table 2
Robustness factors and design of experiments for analytical procedure.
No. Factor (Xi) Unit Low level (-) Nominal level (0) High level (+)
1 Flow rate of mobile phase (X1) mL/min 0.6 0.7 0.8
2 Buffer solution of mobile phase (X2) pH 2.8 3.0 3.2
3 Methanol percentage in mobile phase (X3) % 35 40 45
4 Column temperature (X4) °C 35 40 45
5 DAD* wavelength for lisinopril/HCT (X5) nm 213
270
215
272
217
274
*Diode-array-detection.
11

I. Rubashvili et al. / Chem. J. Mold., 2020, 15(1), 8-20
Quantitative estimation of lisinopril/HCT
residues
The concentration (µg/mL) of
lisinopril/HCT residues in sample solution was
calculated by Eq.(2):
(2)
where, Ru is the peak area of analyte obtained
from the chromatogram of swab sample
solution;
Rs is the peak area of analyte obtained
from the chromatogram of standard
solution;
W is the weighted mass of standard, mg;
D is the dilution factor;
P is the purity of the standard compound,
(assay, %).
Methodology to establish acceptance limits
The acceptance limits for the drug residues
must ensure the absence of cross-contamination
for subsequent batches manufactured in the
affected equipment. FDA’s guidance for
determining residues acceptance limits requires a
logical, practical, achievable and verifiable
determination practice [2]. The acceptance limits
for cleaning validation were based on two
pharmacological (the dosage criteria - the patient
should not take more than 0.1% of the minimum
therapeutic dose of the API of the previous
product in the maximal daily dose of the
subsequent product) and toxicological.
The maximum allowable carryover (mg) -
MAC was calculated based on the both above-
mentioned criteria [3,18,19].
The MAC was calculated based on the
pharmacological criteria using Eq.(3):
(3)
where, TD is the minimal therapeutic dose of the
studied API of the control product (mg);
SF is a safety factor -1/1000 for solid oral
dosage form;
BS is the smallest batch size of the
subsequently processed product batch (mg);
LDD is the largest daily dose of
the subsequently processed product’s
API (mg).
The MAC was calculated based on the
toxicological criteria by Eq.(4):
(4)
where, NOEL is no-observed effect level (mg/kg);
WA is human average weight calculated
on 50 (kg);
2000 is an empirical constant.
The acceptance limits - AL for API residues
in sample solution was calculated using Eq.(5)
and Eq.(6) depending on the cleaning procedure.
Thus, for sample solution obtained from
swabbing:
(5)
And, for sample solution obtained from rinsing:
(6)
where, As is the sampling area (cm
2);
Rec is the percentage recovery rate of the
sampling method;
At is the total production line area (cm2);
V is the volume of sample solution obtained
from swabbing/rinsing (mL).
Results and discussion
Establishing acceptance limits
The smallest batch size of the subsequent
product was selected for calculating the values
of the MAC. The lowest obtained value of MAC
of both APIs – lisinopril and HCT were
used to calculate the acceptance limits, given
in Table 3.
Table 3
The calculated acceptance limits (µg/mL).
Name of
API
Pharmacological
criteria*
Toxicological
criteria**
Swabbing Rinsing Swabbing Rinsing
Lisinopril 162.0 120.0 3.45 2.45
HCT 202.0 75.0 1.11 0.83
*Pharmacological criteria were calculated using
the values of MAC obtained from Eq.(3);
**Toxicological criteria were calculated using the
values of MAC obtained from Eq.(4).
The determined concentration of lisinopril
and HCT residues in sample solutions should not
exceed the established AL. According to the
current version of good manufacturing practice
guidelines (GMP EU Annex 15) the acceptance
criteria should be based on a toxicological
evaluation [1]. The results of the calculated
acceptance limits based on the various approaches
show that the strictest limit is the AL based on
toxicological criteria. Therefore, this limit should
be considered for estimation of the API residues.
12

I. Rubashvili et al. / Chem. J. Mold., 2020, 15(1), 8-20
Development and validation of sampling
procedure
The sampling procedures were developed
in order to obtain a suitable and good recovery of
APIs residues. The surface (sampling area -
25 cm2) was successively wiped with one micro
polyester swab moistened with diluent. The swabs
were spiked with different quantities of lisinopril
and HCT. A mixture of methanol and water
90/10 v/v was used as diluent (easy to remove
from surfaces by purified water after sampling
and easy to check its residues using gas
chromatography; the studied APIs residues are
soluble in methanol; and the selected diluents
ensure the best chromatographic characteristics of
the peaks). The sonication time was set to
2-3 minutes.
The robustness of the swab sampling
procedure was checked using the recovery rate
(Table 4). All the recovery values obtained from
the robustness test (8-run design experiment) were
more than 86.36%, which approved that the
developed swab sampling procedure can be
considered robust and none of the examined
factors had a significant effect on the swab
recovery rate.
The accuracy of the combination of
sampling procedure and analytical HPLC
procedure was assessed by comparing the analyte
amount determined versus the known amount
spiked at two different concentration levels
(10 and 20 µg/mL for lisinopril and, 12.5 and
25 µg/mL for HCT) with three individual
determinations (n= 3). The accuracy is expressed
as percentage of standard compound recovered
from a spiked solution (placebo+standard) with a
corresponding RSD, %. The average recovery
should be within 80.0-120.0% and the RSD of
percentage recovery rates for three individual
determinations should not be more than 4.0%
for each concentration level of spiked sample
solution (acceptance criteria). The accuracy
test results are shown in Table 5. The main
recovery rates are more than 82.93% (at two
different concentrations n= 3), which confirms
that the developed sampling procedures have a
good recovery.
To estimate the compatibility of the used
swab material - polyester (ITW Texwipe swab,
USA), the standard solution and extracted swab
solution added standard of the same concentration
were prepared and injected (Figure 3). This test
confirms the existence of desorption of
lisinopril/HCT residues from the swab material.
The compatibility of swab material was evaluated
quantitatively by the calculated percentage
difference between peak areas obtained from
standard solution and extracted swab solution
added standard which should not be more than
3.0% (acceptance criteria).
Table 4
Robustness test results for the swab sampling procedure.
Experiment
no.
Factors Mean recovery, %
X1 X2 X3 X4 X5 Lisinopril HCT
1 + + + + + 93.25 98.55
2 + + - + + 92.50 91.91
3 + - + - + 91.55 87.11
4 + - - - - 96.65 86.36
5 - + + - - 93.77 95.00
6 - + - - + 89.25 94.21
7 - - + + - 87.74 88.33
8 - - - + + 92.66 87.92
Table 5
The accuracy results.
API residue Spiked sample
solution, µg/mL
Recovery rate, % RSD
(n= 3)
The main recovery rate, %
(n= 3) I II III
Swabbing
Lisinopril 10 95.96 97.27 93.25 1.75
96.40 20 96.77 98.01 97.15 0.53
HCT 12.5 95.77 97.07 93.16 1.71
95.17 25 94.25 93.78 96.96 1.48
Rinsing
Lisinopril 10 87.58 81.53 85.23 2.94
85.70 20 89.25 83.14 87.44 2.96
HCT 12.5 82.88 80.59 84.99 2.17
82.93 25 83.15 82.45 83.50 0.53
13

I. Rubashvili et al. / Chem. J. Mold., 2020, 15(1), 8-20
The calculated percentage difference is
0.43% for lisinopril and 0.25% for HCT. Hence,
the lisinopril and HCT residues desorb from the
swab and the swab material does not effect on the
determination of the above-mentioned APIs
residues.
Optimization of chromatographic system
conditions and robustness study
The final chromatographic conditions
were determined by optimizing the system
operational parameters: wavelength for detection,
composition of the mobile phase, flow rate, nature
of stationary phase and checking the system
suitability parameters: theoretical plates, tailing
factor, peak purity, resolution, etc.
The calibration curve showed good
linearity for the trace level quantitative estimation
at 215 and 272 nm for lisinopril and HCT,
respectively. Five critical factors (X1 - flow rate
of mobile phase; X2 - buffer solution of mobile
phase; X3 - methanol percentage in mobile phase;
X4 - column temperature; X5 - DAD wavelength
for lisinopril/HCT) were selected and small
variations (low and high levels) were induced
in the nominal values of the method. An
8-run design experiment was performed to assess
the effect of each factor in the system
suitability test results. Table 6 shows the design
experiments results of the robustness test for the
developed HPLC method. The variability of
resolution factor is 12.32% but the minimal value
of the resolution factor is not bellow the
acceptance criteria (>7.0).
Validation of analytical HPLC method
The specificity test was checked using the
standard solution, the spiked swab and rinse
sample solutions, and the blank solution. This
solution was prepared in the same manner as the
spike sample solution but no standard was used.
The specificity test results have shown that there
is no interference from the extracted blank and the
diluent at the retention time (RT) of analyte peak.
The lisinopril and HCT peaks were pure and the
purity factor (999.988 for lisinopril and 999.995
for HCT) was more than the purity threshold
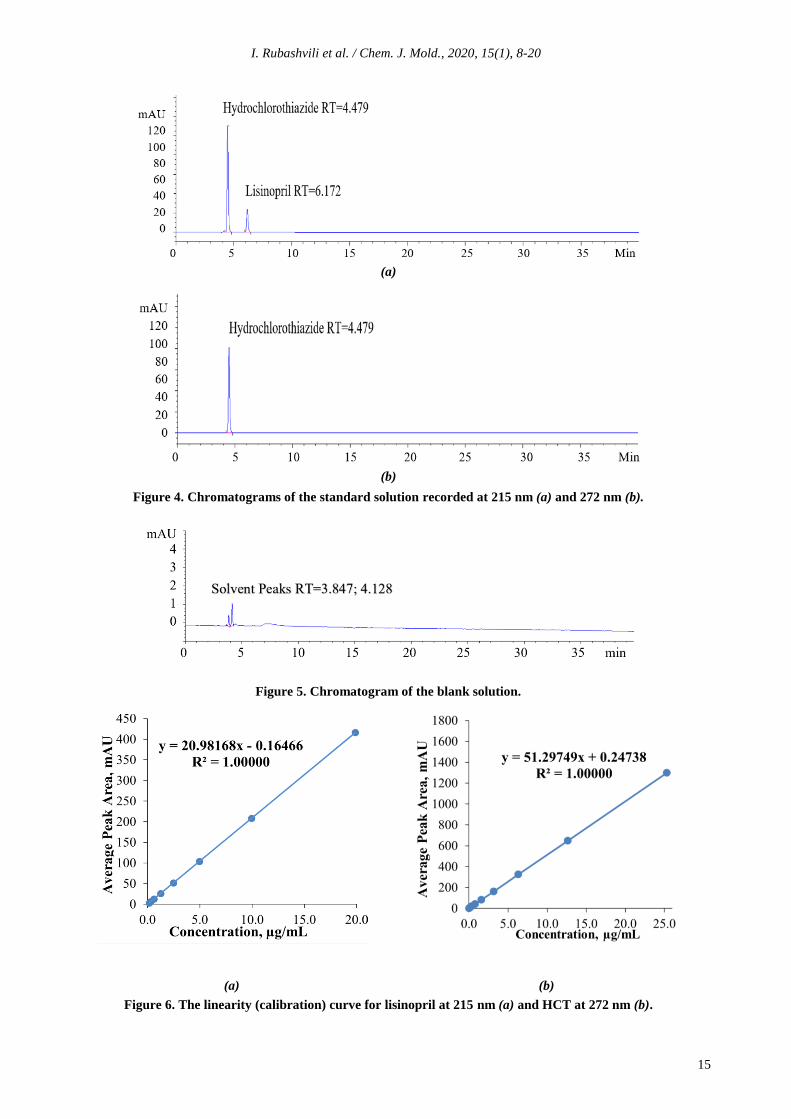
(990.0). Figures 4 and 5 show the chromatograms
obtained from the standard solution and the blank
solution, respectively.
In order to study the linearity-range, the
working solutions were prepared at eight
different concentration levels (the range was
0.155-20.0 µg/mL for lisinopril and
0.025-25.0 µg/mL for HCT) and injected by six
replicates (n= 6) for each concentration level. The
linearity was checked by the square of correlation
coefficient (acceptance criteria: >0.998), the RSD
of peak areas (acceptance criteria: <5.0%) at all
concentration levels excluding the last
concentration level which should not be more
than 10%, the RSD of retention times (acceptance
criteria: <1.0%). The calibration curves were
constructed by plotting the peak area against the
corresponding concentration of the injected
working standard solutions that indicate a perfect
linearity for each compound. Figure 6(a) and (b)
shows the linearity plots for lisinopril and HTC,
respectively.
Table 6
Robustness results of recovery study for analytical procedure.
Experiment
no.
Factors Resolution factor
(Rs) X1 X2 X3 X4 X5
1 + + + + + 7.61
2 + + - + + 7.55
3 + - + - + 7.85
4 + - - - - 7.92
5 - + + - - 8.11
6 - + - - + 7.86
7 - - + + - 7.22
8 - - - + + 7.23
Figure 3. The scheme of compatibility
testing of swab.
14
I. Rubashvili et al. / Chem. J. Mold., 2020, 15(1), 8-20
(a)
(b)
Figure 4. Chromatograms of the standard solution recorded at 215 nm (a) and 272 nm (b).
Figure 5. Chromatogram of the blank solution.
(a) (b)
Figure 6. The linearity (calibration) curve for lisinopril at 215 nm (a) and HCT at 272 nm (b).
15

I. Rubashvili et al. / Chem. J. Mold., 2020, 15(1), 8-20
The limit of quantitation (LOQ) was
estimated to be ten times the s/N ratio; the limit of
detection (LOD) was estimated to be three times
of s/N ratio (acceptance criteria). The quantitation
limit was achieved by injecting a series of
stepwise diluted solutions and the precision was
established at the specific determined level. The
RSD of peak area should not be more than 10%
(acceptance criteria). The determined limits of
quantitation and detection of lisinopril and HCT
by HPLC are presented in Table 7.
Table 7
The LOQ and LOD of HPLC method.
Parameter Value
Lisinopril HCT
LOQ, µg /mL 0.155 0.025
LOD, µg /mL 0.039 0.012
RSD of peak areas for
LOQ (n= 6)
2.001 3.343
RSD of retention times for
LOQ (n= 6)
0.050 0.073
s/N for LOQ 18.23 14.25
s/N for LOD 4.03 7.98
In order to check the chromatographic
system performance, the system suitability test
was performed by using six replicate injections
(n= 6) of the standard solution at the
concentrations – 10 μg/mL and 12.5 μg/mL,
respectively. The following parameters - the RSD
of peak areas, the RSD of the retention times, the
peak tailing factor (the USP coefficient of the
peak symmetry), the column efficiency - the
number of theoretical plates and resolution factor
between HCT and lisinopril were measured. The
results are summarized in Table 8.
The precision of the analytical method was
estimated by measuring repeatability (intra-day
precision) and time-dependent intermediate
precision (inter-day) on six replicate injections of
standard solution and on six individual
determinations of lisinopril and HCT in sample
solution at the same concentrations (10 and
12.5 µg/mL for lisinopril and HCT, respectively).
This validation parameter was studied
during the accuracy study of sampling procedures.
Sample solutions were prepared according to the
description in the experimental section. The
intermediate precision (inter-day) was carried out
on a different day. The intra-day precision was
checked by the RSD of the determined
concentrations (µg/mL) for three individual
determinations of lisinopril and HCT which
should not be more than 4.0%; The intermediate
precision was checked by the RSD of six
individual determinations (totally inter-day and
intra-day determinations) of lisinopril and HCT
which should not be more than 4.0%, the
percentage difference, which should be more than
5.0% and F-test which should not be more than
19. The precision study results given in Tables 9,
10 and 11 are within the acceptance criteria
indicating that this method has a good precision.
The standard solution stability was checked
three times: initially, and after 24 h and 48 h of
storage at room temperature against a freshly
prepared standard solution. The stability was
checked using two standard solutions and by the
percentage difference between the peak areas of
the standard solution stored at room temperature
and the freshly prepared one which should not
exceed 3.0% (acceptance criteria). The bias in
terms of peak area between two standard solutions
should be within 0.98-1.02 (acceptance criteria).
The percentage difference between the peak
areas obtained with two standard solutions, one
stored at room temperature for 24 h and
another prepared freshly, is 1.3% and 0.51% for
lisinopril and HCT, respectively. This gives the
confidence that APIs residues are stable within
48 h and the residues concentration does not
change in sample solutions during cleaning
validation process.
Table 8
The system suitability test parameters results.
Parameter Lisinopril HCT Acceptance criteria
Column efficiency >11766 >8178 >2000
RSD of peak areas (n= 6) 0.113% 0.127% <2.0%
RSD of retention times (n= 6) 0.018% 0.024% <1.0%
Tailing factor (USP symmetry*) 0.84 0.85 0.8÷1.2
Resolution factor between
HCT and lisinopril 7.95 >7
*USP symmetry is the coefficient of the peak symmetry S= W0.05/2f where,
W= peak width at 5% of peak height,
f= time from width start point at 5% of peak height to RT.
16

I. Rubashvili et al. / Chem. J. Mold., 2020, 15(1), 8-20
Table 9
The precision repeatability results for standard solution.
Injection no.
Lisinopril HCT
Peak area*,
mAU
RT**,
min
Peak area*,
mAU
RT**,
min
1 208.40 6.034 650.71 4.484
2 208.50 6.032 650.07 4.482
3 208.04 6.042 651.14 4.489
4 209.06 6.033 650.10 4.482
5 208.54 6.036 651.24 4.487
6 208.61 6.034 651.74 4.487
Average 208.53 6.035 650.83 4.485
RSD 0.330 0.004 0.666 0.003
* The instrument error for peak area ± 0.1 mAU;
** The instrument error for RT ± 0.01 min.
Table 10
The precision results for sample obtained with swab sampling solution, µg/mL.
Sample solution
no.
Precision repeatability (intra-day) Intermediate precision (inter-day)
Lisinopril HCT Lisinopril HCT
1 17.52 23.52 17.24 22.27
2 17.74 23.31 16.93 22.69
3 17.58 24.24 17.38 23.03
Average 17.61 23.69 17.18 22.66
RSD (n= 3) 0.115 0.488 0.230 0.381
RSD (n= 6) 0.286 0.685
Percentage difference 2.47 4.44
F-test 6.04 1.64
The PVDF membrane filter compatibility
was evaluated using a standard solution
and by calculating the percentage difference
between peak areas of filtered and
non-filtered standard solutions which should not
be more than 0.5% (acceptance criteria). The
percentage difference between peak areas of
filtered and non-filtered standard solutions is
0.24% and 0.12% for lisinopril and HCT,
respectively, which gives the confidence that the
adsorption of each analyte does not occur on the
used filter.
Estimation of lisinopril and HCT residues in
samples from swabbing and rinsing
Both swabbing and rinsing procedures were
performed for APIs residues sampling from
manufacturing equipment surfaces. The APIs
residues were expressed in µg/mL. After
manufacturing of three consecutive batches of
finished drug product - uncoated tablets of
lisinopril/hydrochlorothiazide 20/25 mg,
equipment cleaning samples were collected from
different sampling points. After sampling, the
equipment surfaces were rinsed with purified
water for several times to remove residual
methanol on surfaces. The last rinsed portions
were checked using gas chromatography to detect
methanol residues. Swab and rinse samples were
tested immediately to estimate lisinopril and HCT
residues using the validated HPLC method. The
results are shown in Table 12. Figure 7 shows
typical chromatograms obtained from the sample
solution. The secondary peaks that appeared on
the chromatograms belong to the diluent and one
unknown compound (RT= 21 min) extracted from
the swab material.
The determined concentrations of lisinopril
and HCT residues are below the established
acceptance limits for cross-contamination.
The standard operating cleaning procedure
established for cleaning of manufacturing
equipment surfaces provides enough efficacy in
order to remove the above-mentioned APIs from
the cleaned surfaces and excludes the risk of
cross-contamination of the subsequent finished
product.
17

I. Rubashvili et al. / Chem. J. Mold., 2020, 15(1), 8-20
Table 11
The precision results for sample obtained with rinse sampling solution, µg/mL.
Sample
solution no.
Precision repeatability (intra-day) Intermediate precision (inter-day)
Lisinopril HCT Lisinopril HCT
1 16.15 20.79 15.77 21.28
2 15.05 20.61 16.03 20.89
3 15.83 20.88 16.23 20.88
Average 15.68 20.76 16.01 21.02
RSD (n= 3) 0.566 0.138 0.231 0.228
RSD (n= 6) 0.206 0.219
Percentage difference 2.08 1.25
F-test 6.02 0.36
Table 12
The results of lisinopril and HCT residues analysis.
Sampling
procedure
Number of
sampling points
The determined concentration range
of residues, µg/mL
Acceptance limit,
µg/mL
Lisinopril HCT Lisinopril HCT
Swabbing 10 0.19÷0.67 0.06÷0.46 3.45 1.11
Rinsing 3 0.28÷0.62 0.24÷0.69 2.45 0.83
(a)
(b)
Figure 7. Chromatograms of the sample solution recorded at 215 nm (a) and 272 nm (b).
Conclusions
An analytical HPLC method combined with
swab and rinse sampling procedures was
developed for simultaneous quantitative
determination of lisinopril and hydrochlorthiazide
(HCT) residues on surfaces of pharmaceutical
equipment used in the manufacturing process. The
lisinopril/hydrochlorthiazide 20/25 mg uncoated
tablets were used to demonstrate cleaning
validation. The analytical method was validated
with respect to precision, accuracy, robustness,
specificity, system suitability test and linearity-
range over the concentration range from
0.155 µg/mL to 20.0 µg/mL for lisinopril and
from 0.025 µg/mL to 25 µg/mL for HCT.
Both developed swab and rinse sampling
procedures were found to be robust and accurate
with high recovery rate (>80%). No interferences
from swab/blank solutions were observed.
Standard solutions of both compounds were stable
18

I. Rubashvili et al. / Chem. J. Mold., 2020, 15(1), 8-20
within 48 hours; therefore, the concentrations of
cleaning control sample solutions did not change
for a time from sampling to injecting into HPLC
system. Hence, the obtained results confirm
that the standard cleaning procedure is adequate
and effective for removing both APIs residues
from equipment surfaces. The determined
concentrations of lisinopril (<3.45 µg/mL by
swabbing and <2.45 µg/mL by rinsing) and HCT
(<1.11 µg/mL by swabbing and <0.83 µg/mL
by rinsing) in sample solutions are much lower
than calculated acceptance limit of cross-
contamination of the next finished product.
The validated protocol of sampling and
HPLC method may be successfully used by other
pharmaceutical quality control laboratories to
sustain cleaning validation process for lisinopril
and HCT residues after manufacturing of
uncoated tablets.
References
1. EU Guidelines for good manufacturing practice for
medicinal products for human and veterinary use.
EudraLex, Volume 4, Annex 15: Qualification
and Validation, 2015, Brussels.
https://ec.europa.eu/health/documents/eudralex/vol-
4_en
2. Guide to inspections validation of cleaning
processes. U.S. Food and Drug Administration,
Office of Regulatory Affairs, 2014, Washington.
https://www.fda.gov/validation-cleaning-processes-
793
3. Rubashvili, I.; Kharukhnishvili, N.;
Makharadze, K. Vincamine residues analysis using
HPLC and establishing limits of cross-
contamination in support of cleaning validation.
Revue Roumaine de Chimie, 2018, 63(3),
pp. 205-215. http://revroum.lew.ro/2018/03/
4. U.S. Pharmacopeia National Formulary USP39
NF34: Volume 2. Lisinopril. The United States
Pharmacopeial Convention. United Book Press:
Baltimore, 2016, pp. 4580-4579.
https://www.uspnf.com/official-text/proposal-
statuscommentary/usp-39-nf-34
5. U.S. Pharmacopeia National Formulary USP39
NF34: Volume 2. Hydrochlorothiazide. The United
States Pharmacopeial Convention. United Book
Press: Baltimore, 2016. pp. 4209-4210.
https://www.uspnf.com/official-text/proposal-
statuscommentary/usp-39-nf-34
6. Dawud, E.R.; Shakya, A.K. HPLC-PDA analysis of
ACE-inhibitors, hydrochloro thiazide and
indapamide utilizing design of experiments.
Arabian Journal of Chemistry, 2019, 12(5),
pp. 718-728.
DOI: https://doi.org/10.1016/j.arabjc.2014.10.052
7. Kumar, A.; Dwivedi, S.P.; Prasad, T. Method
validation for simultaneous quantification of
olmesartan and hydrochlorothiazide in human
plasma using LC-MS/MS and its application
through bioequivalence study in healthy volunteers.
Frontiers in Pharmacology, 2019, 10, pp. 810-823.
DOI: https://doi.org/10.3389/fphar.2019.00810
8. Srikalyani, V.; Madhuri, T.; Sareesh, K.;
Kumar, R.M. Simultaneous estimation of
hydrochlorthiazide and candesartan cilextil in bulk
and pharmaceutical dosage forms by RP-HPLC
PDA method. International Journal of
Pharmaceutical Sciences and Research, 2018, 17,
pp. 150-157.
DOI: 10.13040/IJPSR.0975-8232.9(1).150-57
9. Bernardi, L.S.; Severino Júnior, P.N.; Barreto
Biscaia, I.F.; Sangoi, M.S; Todeschini, V.;
Mendes, C.; Segatto Silva, M.A.; Oliveira, P.R.
Determination of hydrochlorothiazide and two
major degradation products by stability indicating
high performance liquid chromatography. Current
Pharmaceutical Analysis, 2020, 16(2), pp. 176-180.
DOI: 10.2174/1573412914666181017151551
10. Urupina, D.; Al-Bazi, S. Stability-indicating
method development and validation for the assay of
hydrochlorothiazide and determination of
impurities/degradants in hydrochlorothiazide raw
material and tablets using reverse-phase liquid
chromatography. Austin Journal of Analytical and
Pharmaceutical Chemistry, 2016, 3(3), pp. 1-7.
https://austinpublishinggroup.com/analytical-
pharmaceutical-chemistry/v3-i3.php
11. Arayne, M.S.; Sultana, N.; Zuberi, M.H.;
Siddiqui F.A.; Haroon, U. Simultaneous
determination of metformin, captopril, lisinopril,
and enalapril by RP-HPLC: its applications in
dosage formulations and in human serum.
Medicinal Chemistry Research, 2013, 22,
pp. 5717-5722.
DOI: https://doi.org/10.1007/s00044-013-0501-z
12. Chandler, V.; Mohan, M.; Seth, R.; Singh, P.;
Singh, R.; Gupta, S. Development and validation of
RP-HPLC method for the estimation of lisinopril in
tablet dosage form. Analytical Chemistry Letters,
2012, 2(5), pp. 309-313. DOI:
https://doi.org/10.1080/22297928.2012.10648282
13. Chauhan, V.; Prajapati, S.T.; Patel, C.N.
A validated RP-HPLC method for simultaneous
estimation of amlodipine and lisinopril in
pharmaceutical dosage form. International Journal
of Pharmaceutical Sciences and Research, 2018,
17, pp. 1712-1715.
DOI: https://dx.doi.org/10.13040/IJPSR.0975-8232.
2(7).1712-15
14. Ivanović, D.; Medenica, M.; Jančić, B.;
Knežević, N.; Malenović, A.; Milić, J. Validation
of an analytical procedure for simultaneous
determination of hydrochlorothiazide, lisinopril and
their impurities. Acta Chromatographica, 2007, 18,
pp. 143-156.
http://acta-chromatographica.us.edu.pl/
15. Aparna, P.; Rao, S.; Thomas, K.M.; Mukkanti, K.
Simultaneous determination of lisinopril and
hydrochlorothiazide related impurities in lisinopril
and hydrochlorothiazide combined tablet dosage
forms using HPLC. Analytical Chemistry:
19

I. Rubashvili et al. / Chem. J. Mold., 2020, 15(1), 8-20
An Indian Journal, 2008, 7(7), pp. 454-161.
https://www.tsijournals.com/journals/archive/tsac-
volume-7-issue-7-year-2008.html
16. Maslarska, V.; Peikova, L.; Tsvetkova, B.
RP-HPLC method for the simultaneous
determination of lisinopril and NSAIDs in API,
pharmaceutical formulations and human serum.
American Journal of Analytical Chemistry, 2012,
3(2), pp. 147-152.
DOI: https://dx.doi.org/10.4236/ajac.2012.32021
17. ICH Harmonized Tripartite Guideline: Validation
of Analytical Procedures: Text and Methodology
Q2 (R1). International Conference on
Harmonization of Technical Requirements For
Registration Of Pharmaceuticals For Human Use,
Switzerland, 2005, 17 p. https://www.ich.org/
18. Rubashvili, I.; Karukhnishvili, N.; Loria, K.;
Dvali, N. Validation of swab sampling and HPLC
methods for determination of meloxicam residues
on pharmaceutical manufacturing equipment
surfaces for cleaning validation. Turkish Journal of
Pharmaceutical Sciences, 2015, 12(3), pp. 287-298.
http://www.turkjps.org/
19. Rubashvili, I.; Karukhnishvili, N.; Makharadze, K.;
Tsitsishvili, V. Development and validation of
quantitative determination and sampling methods
for acetaminophen residues on pharmaceutical
equipment surfaces. Bulletin of the Georgian
National Academy of Sciences, 2018, 12(1),
pp. 107-112.
http://science.org.ge/bnas/vol-12-1.html
20