simulations of strong ground motion in sw iberia for the 1969
TRANSCRIPT
Geophys. J. Int. (2007) 171, 807–822 doi: 10.1111/j.1365-246X.2007.03571.x
GJI
Sei
smol
ogy
Simulations of strong ground motion in SW Iberia for the 1969February 28 (M s = 8.0) and the 1755 November 1 (M ∼ 8.5)earthquakes – II. Strong ground motion simulations
Raphael Grandin,1,∗ Jose Fernando Borges,1,2 Mourad Bezzeghoud,1,2 Bento Caldeira1,2
and Fernando Carrilho3
1Centro de Geofısica de Evora, Universidade de Evora, Evora, Portugal2Departmento de Fısica, Universidade de Evora, Evora, Portugal3Instituto de Meteorologia, Lisbon, Portugal
Accepted 2007 July 30. Received 2007 July 30; in original form 2006 November 24
S U M M A R YThis is the second paper of a series of two concerning strong ground motion in SW Iberia dueto earthquakes originating from the adjacent Atlantic area. The aim of this paper is to use thevelocity model that was proposed and validated in the companion paper for seismic intensitymodelling of the 1969 (M s = 8.0) and 1755 (M = 8.5–8.7) earthquakes.
First, we propose a regression to convert simulated values of Peak Ground Velocity (PGV)into Modified Mercalli Intensity (MMI) in SW Iberia, and using this regression, we buildsynthetic isoseismal maps for a large (M s = 8.0) earthquake that occurred in 1969. Basedon information on the seismic source provided by various authors, we show that the velocitymodel effectively reproduces macroseismic observations in the whole region. We also confirmthat seismic intensity distribution is very sensitive to a small number of source parameters:rupture directivity, fault strike and fault dimensions. Then, we extrapolate the method to thecase of the great (M = 8.5–8.7) 1755 earthquake, for a series of hypotheses recently proposedby three authors about the location of the epicentral region. The model involving a subduction-related rupture in the Gulf of Cadiz results in excessive ground motion in northern Morocco,suggesting that the source of the 1755 earthquake should be located further west. A rupturealong the western coast of Portugal, compatible with an activation of the passive western Iberianmargin, would imply a relatively low average slip, which, alone, would could not account forthe large tsunami observed in the whole northern Atlantic ocean. A seismic source locatedbelow the Gorringe Bank seems the most likely since it is more efficient in reproducing thedistribution of high intensities in SW Iberia due to the 1755 earthquake.
Key words: Iberian region, ocean–continent transition, strong ground motion, waveformmodelling.
1 I N T RO D U C T I O N
Most great tsunamigenic earthquakes are related to well-defined
interplate convergence zones: the circum-Pacific seismic belt, the
Sunda arc, the Hellenic arc and the Antilles arc. An exception is
the massive earthquake that struck Iberia and Morocco on 1755
November 1, was felt in a large part of Europe, and produced a
powerful tsunami that crossed the Atlantic Ocean. This earthquake
occurred along a passive margin, in a region where plate bound-
∗Now at: Institut de Physique du Globe de Paris (IPGP), Laboratoire de
Tectonique et Mecanique de la Lithosphere, 4 place Jussieu, 75252 Paris,
France. E-mail: [email protected]
aries are not unequivocally defined by bathymetry, and where the
existence of an active subduction zone is not clearly supported by
seismological evidence. Thus, despite the large size of the fault that
is responsible for this extreme event (several hundred kilometres),
the location of the epicentral region of the 1755 earthquake is poorly
known; many hypotheses have been made by various authors for its
source. Managing to discriminate between acceptable and unac-
ceptable scenarios for this earthquake is a fundamental step in the
improvement of seismic risk assessment.
In this paper, we concentrate on the comparison of macroseismic
observations with synthetic seismic intensity for a set of possible
source parameters. For this purpose, we have to take into account
the major heterogeneities that affect, at various scales, the crustal
structure in the region, and that largely condition the distribution of
C© 2007 The Authors 807Journal compilation C© 2007 RAS
Dow
nloaded from https://academ
ic.oup.com/gji/article/171/2/807/658273 by guest on 05 February 2022

808 Raphael Grandin et al.
seismic intensities on land. A realistic velocity model, embedded
into a wave propagation code, is an appropriate way to study source
parameters of the 1755 earthquake, provided there is sufficient data.
The finite difference method is well adapted to this strategy, since it
is computationally efficient enough to enable a large number of tests
to be run, and accurate in the low frequency range (f < 0.5 Hz),
which is the most significant for the study of the destructive effects
of large earthquakes at a regional scale. The velocity model used
here was proposed and validated in the companion paper (Grandin
et al. 2007). For this purpose, it is necessary to introduce a regres-
sion between simulated values of Peak Ground Motion Parameter
(PGMP) and Modified Mercalli Intensity (MMI). The 1969 earth-
quake (M s = 8.0) constitutes the most obvious test to calibrate this
regression: source parameters are reasonably well constrained, and
the distribution of macroseismic observations is uniform and of good
quality.
After a short introduction to the seismo-tectonic setting in SW
Iberia, we will establish this regression, and calibrate it using the
1969 earthquake. Finally, we will extrapolate to the case of the 1755
earthquake, and test three hypothetical models for the 1755 earth-
quake source. This will enable us to determine which source fits best
the observed intensity distribution of the ‘Lisbon’ earthquake.
2 S E I S M O - T E C T O N I C S E T T I N G
2.1 Tectonic context
The current tectonic regime at the boundary of the African and
Eurasian plates varies with longitude (Fig. 1), as a result of the
rotation of Africa, with respect to Eurasia, around an Euler pole lo-
cated offshore Morocco, close to (20◦N; 20◦W) (Argus et al. 1989;
DeMets et al. 1994). This boundary is commonly divided into three
sections (Buforn et al. 1988). To the west, between the Africa–
Eurasia–North America triple junction (35◦W) to the eastern end
of the Terceira Ridge (24◦N), the regime is transtensional with an
extension rate of 4.4 mm yr–1 (Borges et al. 2007), and is respon-
sible for the active volcanism found in the Azores archipelago. In
the central section, the relative motion of the two plates seems to
be accommodated by a single right-lateral fault, the Gloria fault,
although significant seismic activity is observed in a broad region
Figure 1. Bathymetric map of the region of study. Inset shows the location of the region of study, and a sketch of the kinematic regime at plate boundaries.
Isobaths are traced with a 1000 m interval below −1000 m, with a 200 m interval above (data provided by the British Oceanic Data Centre 2003). Dots show
the location of earthquakes epicentres recorded from 1995 January to 2005 December (data provided by the Instituto de Meteorologia, Lisbon). Small light
grey dots are earthquakes with 3 < M w < 4, medium dark grey dots are earthquakes with 4 < M w < 5, and large black dots are earthquakes with M w > 5.
White triangles indicate the location of large historical earthquakes (the possible location of the source of the 1755 ‘Lisbon’ earthquake is discussed in the
text). Major offshore active fault are also shown (from Hayward et al. 1999; Gracia et al. 2003a). Submarine canyons are identified by dashed lines.
C© 2007 The Authors, GJI, 171, 807–822
Journal compilation C© 2007 RAS
Dow
nloaded from https://academ
ic.oup.com/gji/article/171/2/807/658273 by guest on 05 February 2022
Strong motion in SW Iberia: Part 2 809
off the fault (Lynnes & Ruff 1985). East of 16◦W, the bathymetric
continuity of the Gloria fault cannot be followed, and the defini-
tion of the boundary is less clear. A transpressive tectonic regime
dominates, with a very low convergence rate of 4 mm yr–1 (Argus
et al. 1989; McClusky et al. 2003) trending NW–NNW, consistent
with the observed maximum horizontal stress direction (Ribeiro
et al. 1996; Borges et al. 2001; Stich et al. 2003; Carrilho et al.2004). Deformation is distributed over an increasingly large area
that can reach a N–S width of 300 km near the continental mar-
gin of Iberia (Chen & Grimison 1989). In this section, seismicity is
scattered, most events concentrating along a 100-km wide band that
trends ESE–WNW from 16◦W to 9◦W (Fig. 1). A progressive shift
of focal mechanisms, from strike-slip mechanisms in the west, to
predominant reverse faulting in the east, has also been reported by
Buforn et al. (1988), and can be interpreted as an increasing plunge
of the minimum compression axis. In the Gulf of Cadiz, seismicity
is denser to the north, around the Guadalquivir Bank. East of the
Strait of Gibraltar, in the Alboran domain and in Betic-Rif Arc, seis-
micity (Calvert et al. 2000) and GPS data (Fadil et al. 2006) both
suggest that active deformation is spread over several hundreds of
kilometres. In this study, we focus on the central section, which is
believed to be the host of the great 1755 earthquake.
In the area, a series of topographic structures trending
WSW–ENE occur (Fig. 1). The Horseshoe scarp and the Marques de
Pombal scarp, parallel to the Sao Vicente canyon, have experienced
deformation since, at least, the Miocene (Zitellini et al. 2001; Gracia
et al. 2003b; Terrinha et al. 2003). The most prominent seamount is
Gorringe Bank, an uplifted thrust block of crustal and upper-mantle
rocks that reaches 25 m below sea level and was emplaced during
the Miocene (12 Ma) by plate breakage, differential loading and
NW–SE shortening of the Jurassic (150 Ma) oceanic lithosphere
(Hayward et al. 1999). North of the Coral Patch Seamount and
Coral Patch Ridge, scarps affect the seafloor, with the same trend,
and large amplitude folds involve the sedimentary cover down to
the basement (Hayward et al. 1999). The transition between the lo-
calized and diffuse plate boundary may be due to a change in the
nature (and age) of the lithosphere (Jimenez-Munt et al. 2001). On
the other hand, by analogy with the Macquarie Ridge Complex at
the Australia–Pacific Plate boundary, Massel et al. (2000) suggest
that the proximity of the Europe–Africa pole of rotation may induce
significant changes in boundary conditions over small timescales (a
few million years) thus resulting in a transitional state of deforma-
tion. The latter scenario is supported by the occurrence of unusually
large oceanic earthquakes inside the area of scattered seismicity in
1969 (M s = 8.0; Fukao 1973) and 1975 (M s = 7.9; Lynnes & Ruff
1985). Moreover, focal mechanisms of these two events shared no
obvious resemblance with bathymetric structures in the epicentral
area.
In the Alboran region, seismic activity is scattered, and strike-slip
mechanisms are consistent with a NW–SE compression, and hor-
izontal extension in the NE–SW direction (Bezzeghoud & Buforn
1999). East of 1◦E, as the least compressive axis shifts to a verti-
cal direction, seismicity becomes more localized along the Algerian
coast, and the compressive stress regime is expressed by somewhat
simpler thrust mechanisms (Bezzeghoud & Buforn 1999).
2.2 Instrumental seismicity
On land, seismicity is scattered, with a maximum focal depth of 15–
20 km (Fig. 1), and a large variety of focal mechanisms (Borges et al.2001). In the Lusitanian Basin, microseismicity reveals a complex
pattern of focal mechanisms, and the depth of earthquakes, between
14 and 23 km, suggests that deformation is controlled by tectonic
activity deep in the basement (Fonseca & Long 1991). Seismic
activity in the region of Evora is associated with unmapped struc-
tures (Borges et al. 2001). In the Monchique range, the steady
microtremor activity probably involves pre-existing tectonic fea-
tures located at depth (Dias 2001). Further south, the activity of the
Portimao Fault can be inferred from the N to S trending active zone
(Carrilho et al. 2004), consistent with average focal mechanisms
showing N–S strike-slip fault-planes (Bezzeghoud & Borges 2003),
as suggested by Terrinha (1997). In the Guadalquivir foreland basin,
seismicity is low, and seems to be limited to the blind Subbetics
frontal thrust.
Offshore, the poor azimuthal coverage and the lack of stations at
short distances from epicentres do not allow the depth distribution
of earthquakes, even close to the coast, to be constrained. However,
most events occurring between 14◦W and 7◦W are located at depths
between 5 and 25 km, and can reach 90 km (Buforn et al. 1988) in the
oceanic domain that lies west of 10◦W. The widening of the diffuse
plate boundary goes together with an increase of the maximum depth
of earthquakes: from 35 km at the eastern termination of the Gloria
fault (Grimison & Chen 1986), to 60–90 km in the Gulf of Cadiz
(Buforn et al. 2004), and 150 km east of the Strait of Gibraltar,
with occasional deep earthquakes (650 km) below the Alboran Sea
(Calvert et al. 2000).
The largest instrumental earthquake, M s = 8.0 (USGS), occurred
on 1969 February 28 in the eastern Horseshoe Abyssal Plain. From
the study of depth phases (pP, sP and pwP), Grimison & Chen (1986)
determined a focal depth of 50 km for a strong aftershock (mb =5.5) that occurred on 1969 May 5. They also deduced that the old
Jurassic oceanic lithosphere (155 Ma) has a brittle thickness of ap-
proximately 40–70 km, limited by the 600 ◦C isotherm, thus jus-
tifying the intermediate depth seismicity observed in the area. In
the Gulf of Cadiz, seismicity concentrated around the Guadalquivir
Bank, as well as the occurrence of the 1964 earthquake (Udıas &
Lopez-Arroyo 1970), with magnitude M w = 6.2 (Buforn et al.1988), suggest that this structure, that is clearly identified on seismic
profiles and free-air gravity anomaly maps (Gracia et al. 2003a), is
active.
In the eastern Azores-Gibraltar Fault Zone, the largest events have
thrust-type focal mechanisms, with a small strike-slip component.
However, since the 1969 sequence, only one earthquake has reached
a magnitude of 51 (2003 July 29, M w = 5.3, discussed in detail in
the companion paper); hence, most events are too small to be of
regional significance.
2.3 Historical seismicity
The Lower Tagus Valley was struck by several important his-
torical earthquakes: the 1531 January 26 earthquake (Justo &
Salwa 1998), with magnitude M ∼ 6.5–7.0 (Justo & Salwa 1998;
Vilanova 2003) and the 1909 April 23 earthquake (Moreira 1985;
Teves-Costa et al. 1999), with magnitude M w = 6.0 (Teves-Costa
et al. 1999), are the best known cases. The source of the 1858
November 11 Setubal earthquake, with magnitude M ∼ 7.1
(Vilanova 2003), might be a blind thrust fault, trending NNE–SSW,
located below to the Setubal canyon, in the Sado Valley (Ribeiro
1We would like to acknowledge the occurrence of a M w = 6.1 earthquake
on the 12th of February, 2007, while the present paper was under review. A
special issue of the EMSC Newsletter is dedicated to this event.
C© 2007 The Authors, GJI, 171, 807–822
Journal compilation C© 2007 RAS
Dow
nloaded from https://academ
ic.oup.com/gji/article/171/2/807/658273 by guest on 05 February 2022
810 Raphael Grandin et al.
2002), possibly connecting with an E–W fault on land (Moreira
1985). In the Algarve, the Loule Fault, which accommodated a sig-
nificant part of the shortening across the Algarve basin, due to the
presence of halokinetic structures in its footwall, could be respon-
sible for the 1856 December 1 earthquake (Moreira 1985; Terrinha
1997), with magnitude M ∼ 5.5 (Vilanova 2003). The source of the
tsunamigenic 1722 December 27 Tavira earthquake, with magnitude
M ∼ 7.0 (Vilanova 2003), might be located offshore the southern
Portuguese coast, possibly near the Guadalquivir bank area (Baptista
et al. 2000).
In short, seismic activity is low on the continent, and thrust faults
are often blind, with long recurrence times, leading to large uncer-
tainties. Offshore, activity is more significant, but epicentral loca-
tions are, obviously, even more uncertain. The existence of major
canyons, aligned with clearly mapped onshore faults, has led many
authors to associate some historical earthquakes with such struc-
tures; however, these morphological observations can be misleading
(Dinis 2006). In this context, it is not surprising that the location of
the tsunamigenic 1755 November 1 earthquake, with magnitude M∼ 8.5–8.8 (Abe 1979; Johnston 1996), is still heavily debated (John-
ston 1996; Zitellini et al. 2001; Gutscher et al. 2002; Terrinha et al.2003; Vilanova et al. 2003; Ribeiro et al. 2006). Similarly, historical
information about the large tsunami generated by the 1761 March 31
earthquake, with magnitude 7.5 (Martins & Mendes Vıctor 2001),
are too sparse to allow a determination of the epicentral region (Bap-
tista et al. 2006).
3 S E I S M I C I N T E N S I T Y M O D E L L I N G
3.1 Numerical method and source implementation
To model the propagation of seismic waves in a 3-D media, we used
the code E3D, an explicit 2-D/3-D elastic finite-difference wave
propagation code (Larsen & Schultz 1995), based on the work of
Madariaga (1976). The method and computational issues related
to the finite-difference scheme are presented in details in the com-
panion paper (Grandin et al. 2007). This numerical method was
successfully applied in 3-D by a large number of authors for gen-
erating synthetic seismograms in the USA (e.g. Olsen & Schuster
1992; Frankel & Vidale 1992; Olsen & Archuleta 1996; Larsen et al.1997; Wald & Graves 1998; Stidham et al. 1999; Dreger et al. 2001;
Pitarka et al. 2004; Hartzell et al. 2006) and in Japan (e.g. Pitarka
et al. 1994, 1996, 1998; Sato et al. 1999, Satoh et al. 2001; Kagawa
et al. 2004). However, the size of the region studied in the present
paper (∼400 × 400 km) is exceptionally large, and our knowledge
of the crustal structure in the region of interest is more limited than
in the above studies. Therefore, we expect only the broad features
of the wavefield to be reproduced (Grandin et al. 2007). We recall
that simulations are only reliable at low frequency, the maximum
frequency being proportional to the minimum velocity in the grid,
and to the inverse of grid spacing. In this paper, a grid spacing of
1 km is used, thus yielding a maximum frequency of 0.3 Hz.
In the case of the two larger earthquakes studied here (7.5 <
M w < 8.5), the finiteness of the dimension of the fault and of the
duration of rupture cannot be ignored. Following the source im-
plementation scheme of E3D, we model these extended sources by
superimposing a large number of point sources over a rectangular
fault plane that shares the same strike and dip as the individual
subevents. The kinematics of rupture, namely rupture propagation
direction, is simulated by triggering rupture on each subfault at the
right time: rupture can nucleate at a certain location on the fault,
and then propagate radially until the fault edge is reached; rupture
velocity is assumed to be constant over the fault plane. To prevent
high-frequency noise from entering the radiated spectrum, and thus
generate a smooth source time function, one has to make sure that
rupture on each subfault is initiated before rupture on the previous
adjacent subfault has stopped. We chose to use a Brune signal as
the elementary source time function for rupture on each subfault
(Brune 1970). The displacement rate u, as a function of time t , is
given by:
u(t) = t
τ 2e−t/τ , (1)
where τ is the characteristic time of subevent rupture, that sets both
the rise time and the duration of the rupture (Beresnev and Atkinson
1997). In the case of a finite source, rupture velocity is fixed to
2.5 km s–1, and the grid spacing is 1 km. By setting τ to 0.4 s,
rupture initiates on a subfault when the previous subfault has reached
approximately 25 per cent of the total displacement.
We additionally assume a uniform seismic moment distribution
over the fault plane. Thus, the slip is not uniform due to the variation
of rigidity modulus with depth inside the velocity model. However,
in the epicentral distance range considered here (d > 100 km), we
have checked that this condition does not induce significant differ-
ences from a uniform geometric moment distribution. Furthermore,
we set the depth to the top of the fault so that coseismic rupture does
not extend beyond the seismic basement. This prevents the occur-
rence of supershear rupture velocities in the shallow sedimentary
cover, but assumes that sediments are not involved in significant
seismic wave generation. From a seismological point of view, this
hypothesis is valid. Indeed, the total seismic moment is given by:
M0 =∫
(μb)d S, (2)
where μ and b are, respectively, the rigidity and slip at an elementary
surface dS, located on the fault plane �. For large earthquakes, the
low rigidity of shallow sedimentary layers (two times lower than
average crustal rigidity), and their small thickness (a few per cent of
the thickness of the brittle Jurassic oceanic crust) ensure that their
contribution to the total seismic excitation is low. This is valid for the
case of a uniform coseismic slip, or, inversely, of a uniform seismic
moment distribution.
To determine the stability of our results, we have performed a large
number of simulations to evaluate the importance of the parameters
we have arbitrarily fixed. In the case of the extended rupture, we
have verified that dividing or multiplying τ by a factor of 2 does
not affect significantly the radiated wavefield. Modifying the value
of vr within reasonable bounds only slightly affects the amplitude
of ground shaking, by enhancing or weakening the directivity ef-
fect. Finally, we have checked that a complex geometry, involving a
slow, shallow rupture on a plane extending inside the sedimentary
cover does not affect the results significantly, while the additional
number of parameters, and thus the risk of generating spurious re-
sults, increases dramatically. On the other hand, variations of focal
parameters, fault plane geometry and rupture directivity have strong
effects on the resulting radiated wavefield.
In the rest of the paper, the computational domain has a grid spac-
ing of 1 km, and extends to a depth of 70 km. Anelastic attenuation
is included (Table 1 in companion paper).
3.2 Regression of Peak Ground Velocity versus Modified
Mercalli Intensity
Four sources of information exist for the seismicity that occurs off-
shore SW Iberia. First, seismological data is available for recent
C© 2007 The Authors, GJI, 171, 807–822
Journal compilation C© 2007 RAS
Dow
nloaded from https://academ
ic.oup.com/gji/article/171/2/807/658273 by guest on 05 February 2022

Strong motion in SW Iberia: Part 2 811
Table 1. Regressions of Peak Ground Velocity (PGV) measured in m s–1 versus Modified Mercalli Intensity (MMI) discussed here.
Parameters a and b are defined in eq. (2).
Reference a b Region of study Frequency range (Hz) Intensity range (MMI)
Trifunac & Brady (1975) 4.00 10.52 Western United States 0.07–25.0 IV–X
Wald et al. (1999) 3.47 9.29 Western United States – V–IX
Wu et al. (2003) 2.35 8.01 Taiwan – III–IX
Kaka & Atkinson (2004) 1.79 9.33 Northeastern America – II–VIII
This study 3.50 10.50 Southwestern Iberia 0.10–0.50 IV–X
instrumental earthquakes. Second, macroseismic data has been re-
trieved from inquiries carried out immediately after major events,
or a posteriori, by the study of historical information. Third, several
recent studies aimed at imaging the relation between the complex
bathymetry and the structure of the sediment cover, using geophysi-
cal techniques, to locate active tectonic structures. Fourth, near-field
tsunami data has been deduced from available tide-gauges and his-
torical observations. Additional observations have been made in the
case of the great 1755 earthquake (far-field tsunami, near and far-
field hydrological effects, landslides, seiches and seismic activity
triggering), but, since they are not available for any other earth-
quake, this type of information will not be discussed here.
In the area, all four types of information are reliably available for
only one major earthquake, namely the 1969 February 28 Horse-
shoe Abyssal Plain earthquake. More recent earthquakes have been
much smaller, and, as a consequence, were barely felt on land, and
probably did not produce surface ruptures, nor a detectable tsunami.
Older earthquakes of comparable magnitude are badly constrained
from a seismological point of view (excluding the 1964 earthquake,
which occurred in the eastern Gulf of Cadiz) and macroseismic ob-
servations, as well as tsunami observations, are less reliable. This
is obviously the case of historical earthquakes. Our major objec-
tive is the computation of synthetic seismic intensity maps, in order
to assess seismic risk associated with sources located offshore SW
Iberia. In this context, correctly reproducing ground motion dis-
tribution for the 1969 earthquake is the first step towards the pre-
diction of isoseismal maps due to any hypothetical source (Levret
1991; Johnston 1996; Paula & Oliveira 1996): the 1969 event is the
only event of comparable magnitude for which source parameters
are well constrained, and macroseismic information is reliable and
dense enough to ensure a safe regression. However, we must bear in
mind that seismic intensity heavily depend on local effects, which
explains the large standard deviation of observations made in the
field; such effects are beyond our level of resolution. Therefore, we
will only consider the broad features of the isoseismals, deduced
by comparing the ‘smoothed’ intensity values provided by various
authors.
Laws relating the intensity of an earthquake (I 0) to epicentral
distance in SW Iberia are available from a series of studies (Levret
1991; Johnston 1996; Baptista 1998; Lopez Casado et al. 2000;
Martınez-Solares & Lopez-Arroyo 2004); these studies suggest that,
in the area, attenuation is very low for large magnitude earthquakes.
We use a different approach, where we relate the level of shaking,
obtained by a quantitative simulation of wave propagation through
the crust and upper mantle, to the macroseismic intensity. Thus, in
addition to geometric attenuation, the effects of source finiteness,
directivity, and heterogeneities of the propagation medium are also
included.
The observed correlation between the level of seismic intensity
and the peak value of ground motion has been described at length
by Trifunac & Brady (1975), who gave regressions of the peak val-
ues of velocity and acceleration, versus MMI, in a study focused on
the Western United States. Other authors provided alternative rela-
tions for the Western United States (Wald et al. 1999), Taiwan (Wu
et al. 2003) or Eastern North America (Kaka & Atkinson 2004).
The relations referenced here are of the form:
MMI = a log(PGMP) + b, (3)
where PGMP is the Peak Ground Motion Parameter (displacement,
velocity and acceleration).
The value of a mostly affects the geometric attenuation of inten-
sity, while b is a constant. Wald et al. (1999) and Wu et al. (2003) sug-
gest that, for high intensities (>VII), Peak Ground Velocity (PGV)
correlates better with MMI than Peak Ground Displacement (PGD)
or Peak Ground Acceleration (PGA). The values of the parame-
ters a and b used by a series of authors are presented in Table 1,
with PGV expressed in m s−1. Since they are clearly region-specific,
these relations should be used with caution when applied to synthetic
ground motion in SW Iberia: they concern different tectonic and ge-
ological environments, and were obtained using higher frequencies
(>1 Hz) than frequencies available in this study (<0.3 Hz). Thus,
they provide bounds to the regression that may apply to the specific
case of SW Iberia.
Our method to determine a regression of the form of eq. (3) is
the following. As a preliminary step, we performed a large number
of simulations for the 1969 event, and tested the dependence of the
results on variations of the source parameters in order to evaluate
whether small to moderate uncertainties on fault parameters can re-
sult in large uncertainties of the final result. We concluded that, at
the regional scale, and in the case of an extended fault, the distribu-
tion of PGV is, at the first order, mainly controlled by the magnitude
of the earthquake and source location (this result is not surprising,
and will enable us, in the final stage of this study, to discriminate be-
tween realistic and unrealistic locations for the epicentre of the 1755
earthquake). Rupture directivity (controlled by the rupture initiation
location), strike direction and fault dimensions are critical factors
for the azimuthal distribution of the maximum amplitude oscilla-
tions. In contrast, the computation is little sensitive to other source
parameters, such as the dip, the rake, rupture velocity and depth to
the top of the fault or the duration and shape of the source time
function.
Thus, we concluded that the problem can be partitioned: in a first
step, we select an average value for source parameters of the 1969
earthquake, which enables us to do the followings.
1. Fix the value of b , which controls the decay of PGV with
epicentral distance.
2. Fix the value of a , which controls the average value of PGV.
Because of the linearity of the equations used for the computation
of ground motion in this study, the simulated seismic moment has the
same scaling effect as parameter b, and there is a trade-off between
the two parameters that can only be resolved by the study of at least
C© 2007 The Authors, GJI, 171, 807–822
Journal compilation C© 2007 RAS
Dow
nloaded from https://academ
ic.oup.com/gji/article/171/2/807/658273 by guest on 05 February 2022
812 Raphael Grandin et al.
two earthquakes. We find that a relation similar to that of Trifunac
& Brady (1975) gives good results (Table 1).
In a second step, we discuss the effects of the uncertainties on
source parameters, which have second order effects on the distribu-
tion of intensities. We especially focus on source directivity effects
and basin amplification. This step is necessary to the validation of
the values of a and b, since source parameters estimates of the 1969
earthquake made by various authors are somewhat contradictory
(see discussion below).
4 T H E 1 9 6 9 E A RT H Q UA K E
4.1 Seismic source characterization
The focal mechanism and seismic moment of the 1969 February
28 earthquake has been studied by (among others) Lopez-Arroyo &
Udıas (1972), McKenzie (1972), Fukao (1973), Buforn et al. (1988)
and Grimison & Chen (1988). They concluded that the mechanism
is a thrust, with a strike of 40–70◦, and a small left-lateral compo-
nent. Grimison & Chen (1988) suggested that the earthquake was
composed of two subevents, the second one having an almost pure
strike-slip mechanism. Lopez-Arroyo & Udıas (1972) suggested
that the SE dipping nodal plane should be the fault plane, but Fukao
(1973), and subsequent publications by other authors, favoured the
NW dipping plane. Lopez-Arroyo & Udıas (1972) calculated a seis-
mic moment of 6.3 × 10¹⁹ Nm, while Fukao (1973) and Grimison
& Chen (1988) computed a seismic moment nearly 10 times larger,
of 6.0 × 10²⁰ Nm and 8.0 × 10²⁰ Nm, respectively. Fault length
was estimated to be 85 km (Lopez-Arroyo & Udıas 1972) or 80 km
(Fukao 1973), but, due to the 10-fold difference of seismic moment
calculations, Buforn et al. (1988) and Grimison & Chen (1988) dis-
agree on the value of fault width, with 20 and 50 km, respectively.
Fukao (1973), and Grimison & Chen (1988) both suggested that the
rupture propagation was directed towards the NE. The computed
epicentral depths are 22 km (Lopez-Arroyo & Udıas 1972), 33 km
(Fukao 1973) and 32 km (Grimison & Chen 1988).
Macroseismic data for the 1969 earthquake in Iberia has been
compiled and published by Lopez-Arroyo & Udıas (1972), Mendes
(1974), Martınez-Solares et al. (1979), Paula & Oliveira (1996) and
Martınez-Solares & Lopez-Arroyo (2004). Using data provided by
Paula & Oliveira (1996) for Portugal, and by Mezcua (1982) for
Spain, we built a new map of the observed seismic intensities for
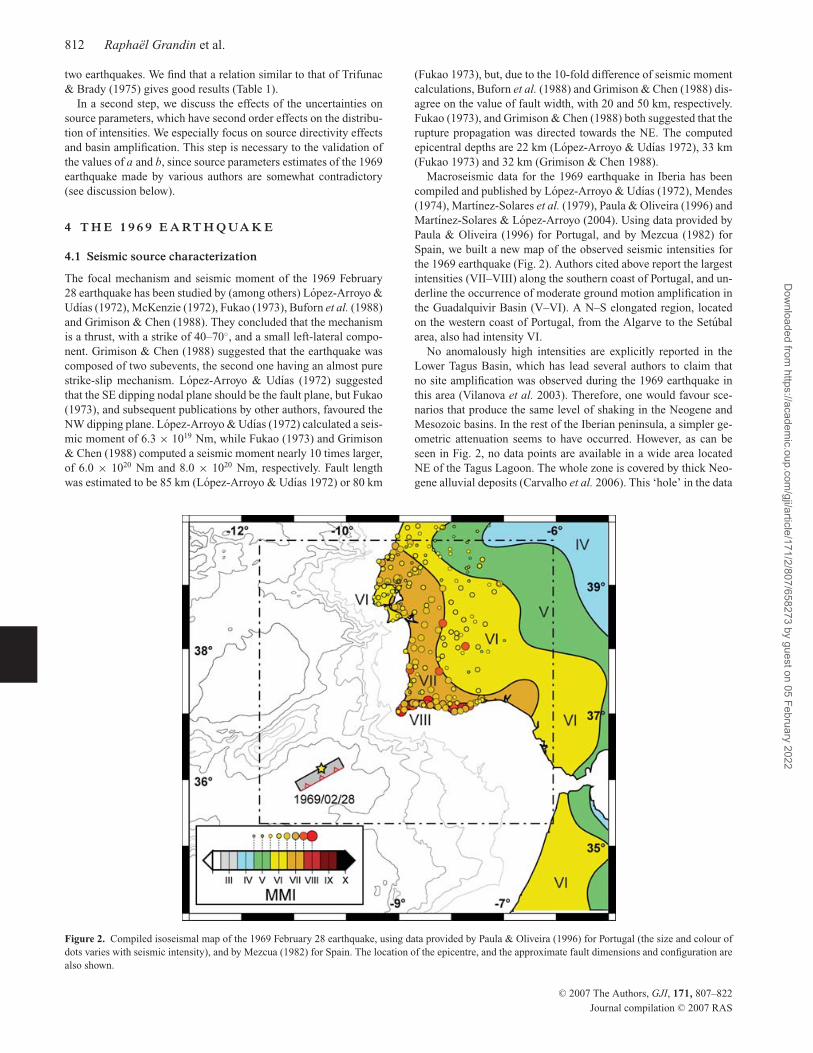
the 1969 earthquake (Fig. 2). Authors cited above report the largest
intensities (VII–VIII) along the southern coast of Portugal, and un-
derline the occurrence of moderate ground motion amplification in
the Guadalquivir Basin (V–VI). A N–S elongated region, located
on the western coast of Portugal, from the Algarve to the Setubal
area, also had intensity VI.
No anomalously high intensities are explicitly reported in the
Lower Tagus Basin, which has lead several authors to claim that
no site amplification was observed during the 1969 earthquake in
this area (Vilanova et al. 2003). Therefore, one would favour sce-
narios that produce the same level of shaking in the Neogene and
Mesozoic basins. In the rest of the Iberian peninsula, a simpler ge-
ometric attenuation seems to have occurred. However, as can be
seen in Fig. 2, no data points are available in a wide area located
NE of the Tagus Lagoon. The whole zone is covered by thick Neo-
gene alluvial deposits (Carvalho et al. 2006). This ‘hole’ in the data
Figure 2. Compiled isoseismal map of the 1969 February 28 earthquake, using data provided by Paula & Oliveira (1996) for Portugal (the size and colour of
dots varies with seismic intensity), and by Mezcua (1982) for Spain. The location of the epicentre, and the approximate fault dimensions and configuration are
also shown.
C© 2007 The Authors, GJI, 171, 807–822
Journal compilation C© 2007 RAS
Dow
nloaded from https://academ
ic.oup.com/gji/article/171/2/807/658273 by guest on 05 February 2022
Strong motion in SW Iberia: Part 2 813
is surprising, and will necessitate further investigations, but does
not allow us to discuss whether amplification, or attenuation, oc-
curred in the central part of the Neogene Lower Tagus Basin due to
the incoming long-wavelength seismic waves excited by the 1969
earthquake (M s = 8.0). Similarly, observations made by Pereira de
Sousa (1919) in the case of the 1755 earthquake (M ∼ 8.5) are
bewildering: in the Neogene Lower Tagus Basin, large buildings
(parish churches) located at the same epicentral distance and above
comparable sedimentary column thicknesses suffered significantly
different levels of shaking (for instance, IX–X in Benavente versus
VI in Alcochete). However, in the case of the 1969 earthquake, we
must admit that, should amplification have occurred, it must have
been very localized.
Heinrich et al. (1994), Guesmia et al. (1996), Miranda et al.(1996) and Gjevick et al. (1997) conducted studies of the tsunami
associated with the 1969 event, and concluded that Fukao’s (1973)
source parameters allow the tsunami observations (traveltimes and
amplitudes) in southern Iberia to be reproduced relatively well. How-
ever, the synthetic mareograms do not succeed in reproducing the
traveltime and polarity of the primary wave observed in Casablanca,
Morocco. Gjevick et al. (1997) suggested that a slightly rotated
strike of the source (from 55◦ to 73◦) provides a better agreement
with the observations. These conclusions support the hypothesis of
a complex 1969 tsunami source.
4.2 Results and discussion
The main disagreement between authors about the 1969 earthquake
lies in the determination of the seismic moment, and therefore, of
fault width and coseismic slip. We chose to test the two sources
proposed by Fukao (1973), and Buforn et al. (1988), with fault
widths of 20 and 50 km, respectively. We also tested a third source,
with fault dimensions and focal parameters fixed at intermediary
values. For each of the three sources, the fault plane was rotated
by 10◦, clockwise and anticlockwise, in order to account for the
uncertainties on the strike. A total of nine tests were performed
(Table 2).
Rupture is nucleated SW of the fault centre (at a distance of
20 km along strike), at two-thirds of the fault width (distance mea-
sured along dip, from fault top), and propagates radially at a velocity
of 2.5 km s–1. We have checked that a bilateral rupture gives sim-
ilar results, with slightly lower intensities, while a rupture directed
towards SW results in small intensities on land (maximum of VI),
incompatible with observations (maximum of VIII).
Due to the difficulty in estimating the depth to the top of the fault,
this parameter is not assessed by any author. In our study, we noticed
that the results were little dependent on this depth, provided that the
top of the fault is located below the seismic basement. Therefore,
we fixed this parameter to 8 km. The middle of the top of the fault
is located at (36.0◦N; –10.45◦E). The value of the seismic moment
was adjusted for each hypothetical source in order to obtain a similar
level of synthetic seismic intensity for all cases.
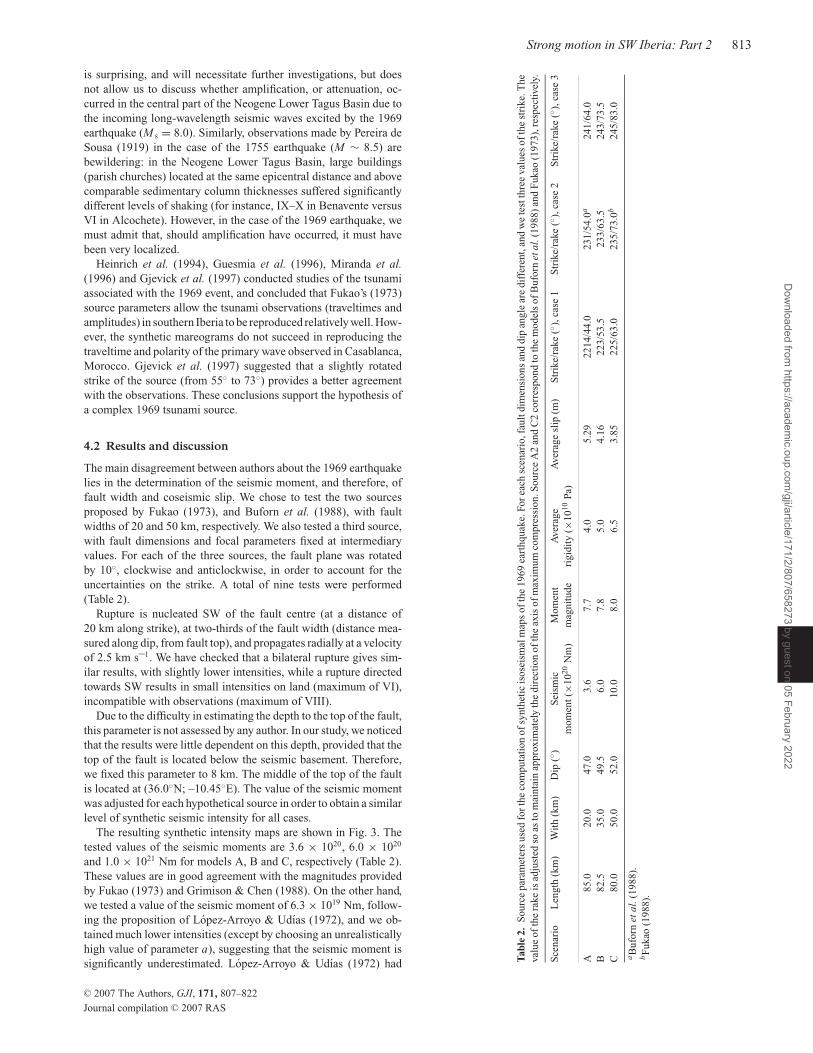
The resulting synthetic intensity maps are shown in Fig. 3. The
tested values of the seismic moments are 3.6 × 10²⁰, 6.0 × 10²⁰
and 1.0 × 10²¹ Nm for models A, B and C, respectively (Table 2).
These values are in good agreement with the magnitudes provided
by Fukao (1973) and Grimison & Chen (1988). On the other hand,
we tested a value of the seismic moment of 6.3 × 10¹⁹ Nm, follow-
ing the proposition of Lopez-Arroyo & Udıas (1972), and we ob-
tained much lower intensities (except by choosing an unrealistically
high value of parameter a), suggesting that the seismic moment is
significantly underestimated. Lopez-Arroyo & Udıas (1972) had Tab
le2.
So
urc
ep
aram
eter
su
sed
for
the
com
pu
tati
on
of
syn
thet
icis
ose
ism
alm
aps
of
the
19
69
eart
hq
uak
e.F
or
each
scen
ario
,fau
ltd
imen
sio
ns
and
dip
ang
lear
ed
iffe
ren
t,an
dw
ete
stth
ree
valu
eso
fth
est
rike.
Th
e
valu
eo
fth
era
ke
isad
just
edso
asto
mai
nta
inap
pro
xim
atel
yth
ed
irec
tio
no
fth
eax
iso
fm
axim
um
com
pre
ssio
n.S
ou
rce
A2
and
C2
corr
esp
on
dto
the
mo
del
so
fB
ufo
rnet
al.(
19
88
)an
dF
uk
ao(1
97
3),
resp
ecti
vel
y.
Sce
nar
ioL
eng
th(k
m)
Wit
h(k
m)
Dip
(◦)
Sei
smic
Mo
men
tA
ver
age
Aver
age
slip
(m)
Str
ike/
rake
(◦),
case
1S
trik
e/ra
ke
(◦),
case
2S
trik
e/ra
ke
(◦),
case
3
mo
men
t(×
10
20
Nm
)m
agn
itu
de
rig
idit
y(×
10
10
Pa)
A8
5.0
20
.04
7.0
3.6
7.7
4.0
5.2
92
21
4/4
4.0
23
1/5
4.0
a2
41
/64
.0
B8
2.5
35
.04
9.5
6.0
7.8
5.0
4.1
62
23
/53
.52
33
/63
.52
43
/73
.5
C8
0.0
50
.05
2.0
10
.08
.06
.53
.85
22
5/6
3.0
23
5/7
3.0
b2
45
/83
.0
aB
ufo
rnet
al.(
19
88
).bF
uk
ao(1
98
8).
C© 2007 The Authors, GJI, 171, 807–822
Journal compilation C© 2007 RAS
Dow
nloaded from https://academ
ic.oup.com/gji/article/171/2/807/658273 by guest on 05 February 2022
814 Raphael Grandin et al.
Figure 3. Synthetic isoseismal maps of the 1969 February 28 earthquake, using source parameters summed in Table 2 (see text for discussion). The focal
mechanism of each source is shown.
already expressed doubts about the compatibility of this value with
the high stress drop of the 1969 earthquake, inferred from the
surprisingly small number of aftershocks.
All 9 models succeed in reproducing the ‘L-shaped’ macro-
seismic field, characterized by the same level of intensities along
the southwestern coast of Portugal and Spain, with a decrease
when moving inland. The largest intensities are found either in
the eastern Algarve (southern Portugal), or in the Lower Tagus
Valley Basin. For model A, because of the smaller fault width,
directivity is stronger, and small variations of the fault strike in-
duce appreciable differences in the distribution of intensities. On
the other hand, model C is less sensitive to such variations. In
all cases, solutions with a fault plane rotated anticlockwise give
larger intensities in the Lower Tagus Valley Basin, and thus can be
excluded.
Model A2, extrapolated from Lopez-Arroyo & Udıas (1972) and
Buforn et al. (1988), reproduces well the observations, with the high-
est intensities in the Algarve (VIII) and a large ‘L-shaped’ region
of lower intensities (VI) extending from the western Guadalquivir
Basin to the Lisbon Area. The rotated mechanism (model A3) yields
similar features. On the other hand, model C2, which corresponds to
the solution proposed by Fukao (1973) gives much higher intensities
in the Lower Tagus Valley Basin (IX) than in the Algarve (VII). A
rotation of the fault plane (model C3) does not improve this result
significantly. However, a reduction of the fault width (B2) increases
the directivity effect, and re-establishes a balance between intensi-
ties calculated in the Algarve, in the Guadalquivir Basin and the
Lower Tagus Valley Basin.
For each model, we can calculate the average displacement using
the eq. (2), with a uniform rigidity modulus. Given the high rigidity
C© 2007 The Authors, GJI, 171, 807–822
Journal compilation C© 2007 RAS
Dow
nloaded from https://academ
ic.oup.com/gji/article/171/2/807/658273 by guest on 05 February 2022

Strong motion in SW Iberia: Part 2 815
modulus at the fault location (Table 2), the calculated average dis-
placements (∼4 m) for models B and C are in good agreement with
empirical regression moment magnitude versus average displace-
ment (Wells & Coppersmith 1994). On the other hand, for models
A and B, the deduced value of the moment magnitude (M w = 7.7–
7.8) differs slightly from the surface wave magnitude (M s = 8.0,
according to USGS), confirming the high stress drop character of
the 1969 earthquake (Kanamori & Anderson 1975). We conclude
that our preferred model is model B.
In this part, we confirmed that the distortion of isoseismals, due
to the variety of geological settings found in the region, could be
correctly matched by using a relatively simple 3-D velocity model
and appropriate source parameters. From the macroseismic study
of the 1969 earthquake, we can draw three conclusions. First, a
clockwise rotation of the mechanisms can be excluded, because it
would ‘transfer’ radiated energy from the Guadalquivir region to
the Lisbon area, and generate significantly higher intensities in the
Lower Tagus Valley Basin. Second, the seismic moment calculated
by Lopez-Arroyo & Udıas (1972) is significantly lower than the
seismic moment deduced from this study, which is, on the other
hand, in good agreement with the value provided by Fukao (1973).
Third, a fault width of 35 km gives better results than the fault widths
of 20 and 50 km proposed by Buforn et al. (1988) and Fukao (1973),
respectively.
However, two main discrepancies between observed and synthetic
isoseismal maps persist. First, intensities at the NE border of the
model are higher in the synthetics. This could be explained by the
poor correlation between the lowest intensities and computed PGV
in the range of frequencies considered here. Second, synthetic in-
tensities in the Lusitanian Basin are much smaller that observed
intensities. This can be improved by a better modelling of the geo-
logical structure in the area, especially at shallow depth.
5 T H E 1 7 5 5 E A RT H Q UA K E
5.1 Source characterization
The 1755 November 1 earthquake was the strongest earthquake
ever reported in Europe, and was extremely destructive throughout
Portugal (Pereira de Sousa 1919), Spain (Martınez-Solares et al.1979) and Morocco (Levret 1991) (Fig. 4); the shock was even
felt in Northern Germany, the Azores and the Cape Verde Islands
(Reid 1914). The large size of the earthquake is further attested by
the observation of seiches in southern England, in Holland and as
far as Finland (Reid 1914). The large tsunami-waves generated by
the earthquake also provoked extensive damage along the coasts of
Portugal, southern Spain and Morocco, and were even detected in
the Lesser Antilles and southwestern England. Extensive geological
evidence of tsunami deposits associated with the 1755 earthquakes
have been reported in southern Portugal (Andrade 1992; Dawson
et al. 1995), southern England (Foster et al. 1993), on the Spanish
coast (Luque et al. 2001), at the Tagus Estuary mouth (Abrantes
et al. 2005) and in the Cape da Roca-Cascais area west of Lisbon
(Scheffers and Kelletat 2005).
The problem of epicentral location has been addressed by various
early studies (Reid 1914; Pereira de Sousa 1919), and, since the
Figure 4. Compiled isoseismal map of the 1755 November 1 earthquake, using data provided by Pereira de Sousa (1919) and Moreira (1984) for Portugal,
Martınez-Solares et al. (1979) for Spain, and Levret (1991) for Morocco. The three tested fault models at Gorringe Bank (Johnston 1996), along the Marques
de Pombal – Pereira de Sousa Fault Zone (Zitellini et al. 2001; Terrinha et al. 2003) and in the Gulf of Cadiz (Gutscher et al. 2002; Gutscher et al. 2006; Thiebot
& Gutscher 2006) are shown (Table 3).
C© 2007 The Authors, GJI, 171, 807–822
Journal compilation C© 2007 RAS
Dow
nloaded from https://academ
ic.oup.com/gji/article/171/2/807/658273 by guest on 05 February 2022
816 Raphael Grandin et al.
beginning of the instrumental period, a consensus attributed the
origin of the earthquake to a structure located between the Gorringe
Bank and the Coral Patch Ridge (Machado 1966; Moreira 1985;
Johnston 1996).
In the most recent hypothesis among several scenarios, Johnston
(1996) suggested that a NE–SW trending fault, possibly outcropping
at the base of the NW flank of Gorringe Bank, could be responsible
for the 1755 earthquake. Using isoseismal regression analysis, he
deduced a seismic moment of 1.26 × 10²² Nm, and a fault area
of 16 000 km2 compatible with an average slip of 12 m. The SE
dipping fault plane suggests that the Eurasian oceanic plate is being
overridden by the African oceanic plate, at least a shallow depth.
However, the recent re-evaluation of historical information avail-
able for the 1755 earthquake and tsunami (Baptista et al. 1995,
1998a; Vilanova et al. 2003), as well as results from new seismic
surveys offshore SW Iberia (Zitellini et al. 2001; Gutscher et al.2002), has led a series of authors to propose alternative scenarios.
Baptista et al. (1995, 1998a) presented a review of historical
records of tsunami parameters that have been used as the basis for
a series of studies that aimed at determining the epicentral area
location by backward ray tracing of the tsunami (Baptista et al.1996, 1998b). A source located in Gorringe Bank, with a fault length
of 120 km and a dip directed towards NE, was tested by Baptista
et al. (1996, 1998b), and led to simulated traveltimes systematically
longer than observations in Iberia; the authors concluded that ‘the
Gorringe Bank is a very unlikely source for the 1755 event’. Several
subsequent publications aimed at testing the coherence of various
hypothetical sources in terms of tsunami traveltimes (Baptista et al.1996, 1998b, 2003; Gutscher et al. 2006). These studies concluded
that a source compatible with an incipient subduction along the
western Portuguese margin (e.g. Ribeiro 2002) provides a better fit
between inferred and modelled tsunami traveltimes than a source
located at Gorringe Banks.
At the same time, Zitellini et al. (2001) reported active thrusting
at the base of a large submarine hill dubbed ‘Marques de Pombal’,
located 80 km west of Cape Sao Vicente. This inferred thrust zone
is associated with seismic activity, may have a listric geometry, and
might be connected to a backthrust fault via a decollement surface
located at a depth of 16–18 km. However, the surface of the inferred
fault is too small (7 000 km2) to generate a M w ∼ 8.5 earthquake.
Terrinha et al. (2003) subsequently proposed that the Marques de
Pombal Thrust should be extended further north, where, instead
of cutting directly to the surface, it would connect to a shallower
decollement level (depth of ∼8–10 km), and finally reach the base of
the continental slope at the eastern border of the Tagus Abyssal Plain.
The complex geometry of the second segment would be responsi-
ble for the inversion of the normal faults of the Pereira de Sousa
Fault Zone, and would yield a much larger surface (19 000 km2),
compatible with the magnitudes of the earthquake and associ-
ated tsunami. Additionally, Gracia et al. (2003b) showed that
half of the NNE–SSW striking scarp created by this ESE dip-
ping fault, is buried below submarine landslide deposits, suggest-
ing that slope failure processes could have contributed to tsunami
generation.
On the other hand, based on interpretation of other seismic pro-
files, and gravimetry and thermal modelling, Gutscher et al. (2002;
2006) and Thiebot & Gutscher (2006) propose that the olistostrome
units of the western Gulf of Cadiz were accumulated as a result of
the ongoing westward displacement of a shallow east dipping fault
plane, in a suduction context. This fault plane, currently locked,
would have been responsible for the 1755 earthquake, at least as
a secondary source associated with a primary source further west.
Platt & Houseman (2003) and Fonseca (2005) objected that the ab-
sence of a Wadati–Benioff zone does not allow a straightforward
confirmation of the activity of a hypothetic subduction plane, nei-
ther in the Gulf of Cadiz, nor along the western Portuguese margin.
Another objection comes from preliminary GPS data, which sug-
gests that the western Betic-Rif belt and NW Morocco behave rigidly
(Fadil et al. 2006; Stich et al. 2006), thus bringing into question the
connection of the southern ramp of the presumed subduction plane,
which lies in a region of low seismic activity (Fig. 1), with unmapped
active structures onshore.
Another complex scenario has been proposed by Vilanova et al.(2003), who argued that the multiple shocks felt all over Iberia, and
the high seismic intensities observed in the Lisbon area demonstrate
the presence of a secondary source in the Lower Tagus Valley. The
rupture of the inferred NNE–SSW striking, WNW dipping thrust
plane outcropping on the western bank of the Tagus river, at the
frontier between the Mesozoic and Neogene basins (Fonseca et al.2000, 2001), would be due to stress triggering. Such a scenario would
imply that strong motion in the Lisbon area is dominated by the
existence of major local sources, rather than offshore sources, as the
epicentral location(s) of the 1755 earthquake(s) is (are) critical to our
understanding of the seismic hazard in the whole SW Iberia region
(Montilla et al. 2002). However, as pointed by Matias et al. (2005),
should clear evidence of the validity of this hypothesis be found,
it is likely that the available historical information will never allow
a magnitude to be assigned to this secondary event. Consequently,
we are unable to discuss the scenario proposed by Vilanova et al.(2003) in this study.
Seismic intensity modelling was performed by various authors,
using probabilistic and stochastic methods (Mendes-Victor et al.1999; Baptista et al. 2003), or site-effect functions and attenuation
relations (Gutscher et al. 2006). These methods suffer important
limitations, because they do not take into account physical con-
siderations attached to the complexity of the seismic source, on
one hand, and the propagation medium, on the other hand. Hence,
it is not surprising that the conclusions of the studies cited above
are contradictory: Mendes-Victor et al. (1999) back the hypoth-
esis of the two NNW–SSE striking sources (‘N160N135’) de-
scribed by Baptista et al. (1996, 1998b); Baptista et al. (2003)
favour a ‘L-shaped’ rupture (‘MPTF/GB’) on two segments located
below Marques de Pombal and Guadalquivir Bank, respectively;
Gutscher et al. (2006) suggest that a source located at (−8.5◦W;
36.0◦N), possibly an asperity at the northwestern corner of the
subduction plane proposed by Gutscher et al. (2002), would ex-
plain most of the observed macroseismic intensities in Iberia and
Morocco.
Generally, all authors cited above agree on a primary source lo-
cated offshore SW Portugal.
5.2 Results and discussion
In this study, we test, by forward modelling, three previously pub-
lished sources for the 1755 earthquake that can be considered as end-
members of the set of proposed offshore seismic sources (Fig. 4).
First (model G), a steep fault, dipping towards SE, and extending
down to a depth of 50 km below Gorringe Bank is tested (John-
ston 1996). A second source (model M) is implemented, consist-
ing of listric faults rooted in the middle crust, below the Marques
de Pombal – Pereira de Sousa fault zone, and distant of ∼50 km
from the SW coast of Portugal, along the Alentejo margin (Zitellini
et al. 2001; Terrinha et al. 2003). Finally (model C), we simulate a
C© 2007 The Authors, GJI, 171, 807–822
Journal compilation C© 2007 RAS
Dow
nloaded from https://academ
ic.oup.com/gji/article/171/2/807/658273 by guest on 05 February 2022

Strong motion in SW Iberia: Part 2 817
Table 3. Source parameters used for the computation of synthetic isoseismal maps of the 1755 earthquake. Latitude, longitude and depth are specified at the
centre of the top of the fault.
Gulf of Cadiz: source C
Seismic moment (×1020 Nm) Rigidity, (×1010 Pa) Fault area (×103 km2) Average slip (m) Rupture velocity (km s−1)
127.9 3.5 36.6 10.0 2.5
Fault Longitude (◦E) Latitude (◦N) Depth b.s.l. (km) Length (km) Width (km) Strike (km) Dip (◦) Rake (◦)
#1 −8.93 35.30 6.50 162.02 68.32 349.0 2.5 79.0
#2 −8.20 35.47 9.49 174.02 68.33 349.0 5.0 79.0
#3 −7.48 35.69 15.44 198.02 68.65 349.0 7.5 79.0
Marques de Pombal & Pereira de Sousa: source M
Seismic moment (×1020 Nm) Rigidity (×1010 Pa) Fault area (×103 km2) Average slip (m) Rupture velocity (km s−1)
46.3 3.5 13.2 10.0 2.5
Fault Longitude (◦E) Latitude (◦N) Depth b.s.l. (km) Length (km) Width (km) Strike (km) Dip (◦) Rake (◦)
#1 −9.79 36.66 18.00 55.66 40.00 20.0 0.0 60.0
#2 −10.10 36.75 5.00 55.66 31.96 20.0 24.0 60.0
#3 −9.61 37.05 18.00 37.15 20.00 20.0 0.0 60.0
#4 −9.78 37.10 11.00 37.15 17.21 20.0 24.0 60.0
#5 −10.27 37.24 9.00 37.15 46.43 20.0 2.5 60.0
#6 −9.60 37.49 11.00 55.66 17.21 20.0 24.0 60.0
#7 −10.58 37.78 7.00 55.66 92.86 20.0 2.5 60.0
Gorringe Banks: source G
Seismic moment (×1020 Nm) Rigidity (×1010 Pa) Fault area (×103 km2) Average slip (m) Rupture velocity (km s−1)
126.0 6.0 16.0 13.1 2.7
Fault Longitude (◦E) Latitude (◦N) Depth b.s.l. (km) Length (km) Width (km) Strike (km) Dip (◦) Rake (◦)
#1 −11.45 36.94 8.00 200.00 80.00 60.0 40.0 90.0
rupture along a shallow dipping subduction-related thrust in the
Gulf of Cadiz (Gutscher et al. 2002; Gutscher et al. 2006; Thiebot
& Gutscher 2006).
Source parameters are shown in Table 3. The seismic moment
for each model is deduced from eq. (2) using the value of slip and
fault area proposed by the various authors, and the average rigidity
at the depth. For each source, fault plane geometry (dimensions,
strike, dip and depth) is set using available published information,
but many other parameters (rake, rupture velocity and directivity)
are, obviously, not constrained by historical information, and must
be extrapolated from the study of similar instrumental earthquakes.
We assume that all fault segments act with a pure thrust mech-
anism; this hypothesis is supported by the observation of source
mechanisms of recent great (M w > 8.0) shallow dip-slip earthquakes
(Harvard CMT Catalogue).
Rupture velocity was set to 2.5 km s–1 for the shallow rupture
models B and C, which is a typical value for dip-slip crustal earth-
quakes. For model A, which involves faulting at larger depths, a
slightly higher rupture velocity of 2.7 km s–1 was used.
As emphasized by McGuire et al. (2002), the majority of large
(M > 7) earthquakes exhibit a preferential direction of rupture, and
the 1755 earthquake may be expected to have behaved in the same
way. Hence, for sources A and B, in addition to a bilateral rupture
scenario, the two unilateral cases are tested. However, the low aspect
ratio of source C is not typical of great tsunamigenic earthquakes,
and an along-dip directed rupture cannot be excluded. Therefore,
for this earthquake, two additional nucleation points are considered,
in addition to the three along-strike cases (Fig. 5).
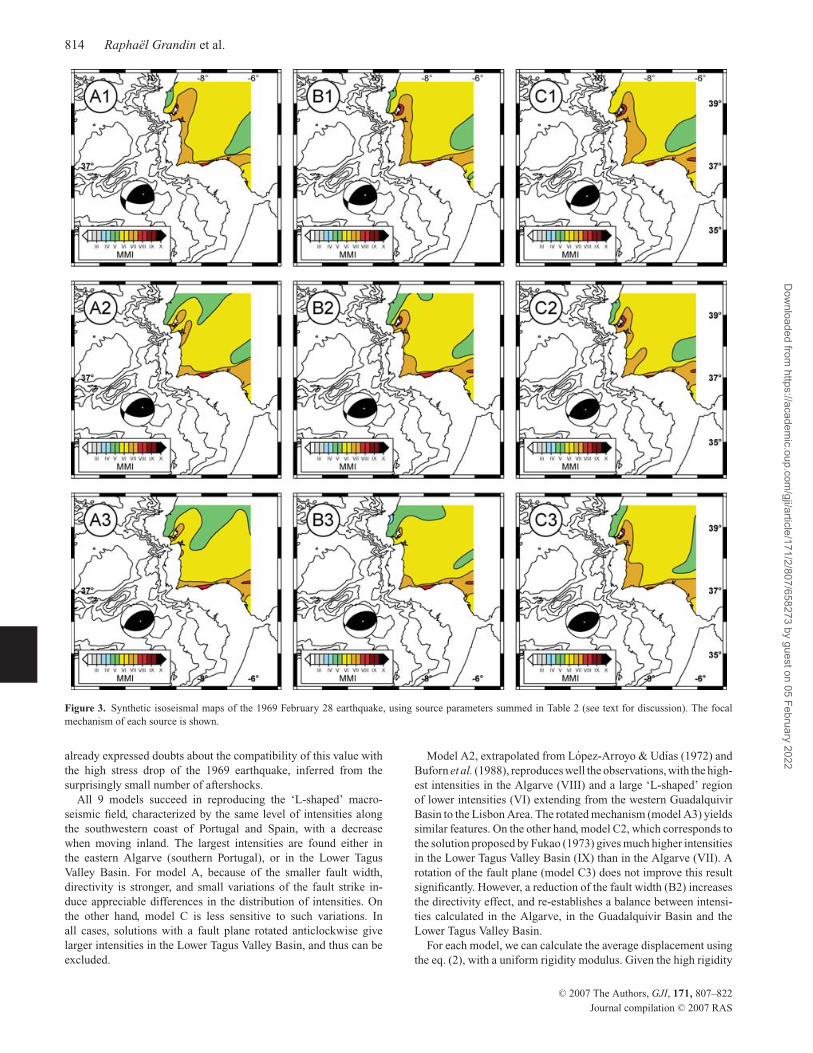
Model C, with a fault located a few tens of kilometres away from
the coasts of the eastern Gulf of Cadiz, systematically produces a
similar level of ground shaking in southern Spain, southern Portugal
and northern Morocco. Compared to the historical isoseismal map,
the highest intensities (X–XI) are shifted from the southern coast
of Portugal to the southwestern coast Spain. In the most favourable
case (a rupture directed towards WSW), simulated intensities are
still much higher than intensities deduced from historical studies
carried out in Morocco (IX–X versus VII–VIII) and in the Internal
Betics (VIII versus V) by Levret (1991) and Martınez-Solares &
Lopez-Arroyo (2004), respectively. Overall, this model fails to re-
produce a key feature of the 1755 November 1 earthquake, that is
the observation of higher intensities in Portugal than in Spain and
Morocco.
In the case of model M, we observe high intensities in the Lisbon
area (IX–X), in the Lusitanian Basin, in the Lower Tagus Valley
Basin, and in the Arrabida chain, that are compatible with obser-
vations. These intensities are conditioned by rupture directivity, be-
cause the area lies in the strike direction of the fault. Intensities in
Algarve (IX) are also correctly reproduced, mainly because of the
proximity of the source. However, intensities computed in the west-
ern direction (VIII) are much higher than observations (VI–VII). In
the synthetics, the decrease of intensities with distance is very low,
with intensities VIII distributed over a 300-km wide zone. The re-
lation between PGV and MMI is not the cause of this phenomenon,
since, in order to remove this effect, an unrealistically high value of
the parameter a, in eq. (3), would be required. The radiation pattern
induced by the style of faulting can explain these discrepancies: in
C© 2007 The Authors, GJI, 171, 807–822
Journal compilation C© 2007 RAS
Dow
nloaded from https://academ
ic.oup.com/gji/article/171/2/807/658273 by guest on 05 February 2022
818 Raphael Grandin et al.
Figure 5. Synthetic isoseismal maps of the 1755 November 1 earthquake, using source parameters summed in Table 3. Stars denote epicentral location (see
text for discussion). The first and second rows correspond to model C, the third row corresponds to model M, and the fourth row corresponds to model G.
C© 2007 The Authors, GJI, 171, 807–822
Journal compilation C© 2007 RAS
Dow
nloaded from https://academ
ic.oup.com/gji/article/171/2/807/658273 by guest on 05 February 2022
Strong motion in SW Iberia: Part 2 819
the most remote areas, surface waves generated by the roughly E–W
coseismic slip have a maximum amplitude in the direction of the
Algarve, the Guadalquivir Basin and the Betic-Rif Belt, but also
in the areas further north, in eastern Portugal and western Spain.
This effect might be reduced if a smaller fault width was used, but
would require a smaller seismic moment, and a lower tsunamigenic
efficiency.
As for model G, most features of the observed macroseismic field
seem to be correctly reproduced with a rupture directed towards SW:
high intensities in the Algarve (IX–X) and in the Lisbon area (IX),
associated with a moderate amplification in the Guadalquivir Basin
(VIII). We also observe a rapid decrease of intensities from south
to north, at 8◦W, and from west to east, at 39◦N. The shape of the
limit between intensities IX and X is in very good agreement with
observations, and the highest level of shaking is located at Cape Sao
Vicente. On the other hand, simulated intensities at the SE corner
of the computational grid (6.5◦N; 39.5◦N) are larger than intensities
reported by Martınez-Solares & Lopez-Arroyo (2004) in the area
(V–VI). However, it can be noted that this overestimation is also
observed for models C (VII) and M (VII–VIII), but the error is
much smaller for model G (VI).
Magnitude estimates made from isoseismal area regression meth-
ods (Johnston 1996) or tsunami strength (Abe 1979) were obtained
assuming an epicentral location close to Gorringe Bank, and con-
strained using mostly near field data, as the quality of macroseismic
and tsunami observations dramatically decreases with their mag-
nitude. An eastward displacement of the source would obviously
reduce the inferred moment magnitude. In this study, for both mod-
els M and C, modelled intensities in the innermost areas of Iberia
(VII–VIII) are significantly higher than observed intensities (VI),
even when an average slip of 10 m is used. This incompatibility be-
tween the proposed fault locations of models M and C, and the ob-
served macroseismic field, suggest that the seismic moment should
be reduced, either by scaling down the average slip, or by reduc-
ing fault dimensions. However, Baptista et al. (1998b, 2003) and
Gutscher et al. (2006) all admit that an average slip of ∼20 m is
needed to reproduce tsunami wave amplitudes and run-up values
comparable with observation, in the case of a rupture located close
to the coast. Such large average coseismic slips have only been ob-
served for exceptional great (M w > 9.0) mega-thrust earthquakes
(1957 Aleutian earthquake, 1960 Chile earthquake, 1964 Alaska
earthquake and 2004 Sumatra earthquake), with rupture lengths an
order of magnitude larger than values considered here. Therefore,
for models M and C, a second incompatibility appears between pro-
posed fault dimensions and the average slip needed to generate the
large tsunami wave amplitude.
We conclude that a fault located below Gorringe Bank, with a
rupture directed towards SW, reproduces better the overall pattern
of macroseismic observations than a fault aligned along the Marques
de Pombal – Pereira de Sousa Fault zone, or a subduction-related
thrust fault in the Gulf of Cadiz.
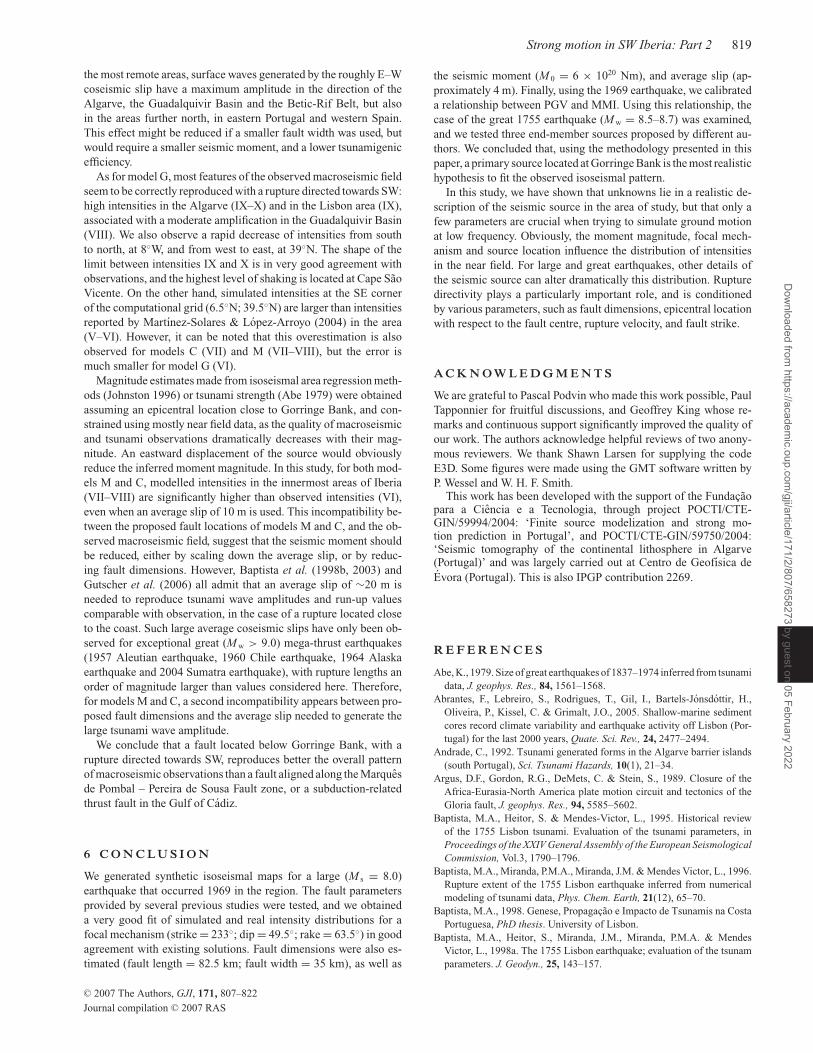
6 C O N C L U S I O N
We generated synthetic isoseismal maps for a large (M s = 8.0)
earthquake that occurred 1969 in the region. The fault parameters
provided by several previous studies were tested, and we obtained
a very good fit of simulated and real intensity distributions for a
focal mechanism (strike = 233◦; dip = 49.5◦; rake = 63.5◦) in good
agreement with existing solutions. Fault dimensions were also es-
timated (fault length = 82.5 km; fault width = 35 km), as well as
the seismic moment (M 0 = 6 × 10²⁰ Nm), and average slip (ap-
proximately 4 m). Finally, using the 1969 earthquake, we calibrated
a relationship between PGV and MMI. Using this relationship, the
case of the great 1755 earthquake (M w = 8.5–8.7) was examined,
and we tested three end-member sources proposed by different au-
thors. We concluded that, using the methodology presented in this
paper, a primary source located at Gorringe Bank is the most realistic
hypothesis to fit the observed isoseismal pattern.
In this study, we have shown that unknowns lie in a realistic de-
scription of the seismic source in the area of study, but that only a
few parameters are crucial when trying to simulate ground motion
at low frequency. Obviously, the moment magnitude, focal mech-
anism and source location influence the distribution of intensities
in the near field. For large and great earthquakes, other details of
the seismic source can alter dramatically this distribution. Rupture
directivity plays a particularly important role, and is conditioned
by various parameters, such as fault dimensions, epicentral location
with respect to the fault centre, rupture velocity, and fault strike.
A C K N O W L E D G M E N T S
We are grateful to Pascal Podvin who made this work possible, Paul
Tapponnier for fruitful discussions, and Geoffrey King whose re-
marks and continuous support significantly improved the quality of
our work. The authors acknowledge helpful reviews of two anony-
mous reviewers. We thank Shawn Larsen for supplying the code
E3D. Some figures were made using the GMT software written by
P. Wessel and W. H. F. Smith.This work has been developed with the support of the Fundacao
para a Ciencia e a Tecnologia, through project POCTI/CTE-GIN/59994/2004: ‘Finite source modelization and strong mo-tion prediction in Portugal’, and POCTI/CTE-GIN/59750/2004:‘Seismic tomography of the continental lithosphere in Algarve(Portugal)’ and was largely carried out at Centro de Geofısica de
Evora (Portugal). This is also IPGP contribution 2269.
R E F E R E N C E S
Abe, K., 1979. Size of great earthquakes of 1837–1974 inferred from tsunami
data, J. geophys. Res., 84, 1561–1568.
Abrantes, F., Lebreiro, S., Rodrigues, T., Gil, I., Bartels-Jonsdottir, H.,
Oliveira, P., Kissel, C. & Grimalt, J.O., 2005. Shallow-marine sediment
cores record climate variability and earthquake activity off Lisbon (Por-
tugal) for the last 2000 years, Quate. Sci. Rev., 24, 2477–2494.
Andrade, C., 1992. Tsunami generated forms in the Algarve barrier islands
(south Portugal), Sci. Tsunami Hazards, 10(1), 21–34.
Argus, D.F., Gordon, R.G., DeMets, C. & Stein, S., 1989. Closure of the
Africa-Eurasia-North America plate motion circuit and tectonics of the
Gloria fault, J. geophys. Res., 94, 5585–5602.
Baptista, M.A., Heitor, S. & Mendes-Victor, L., 1995. Historical review
of the 1755 Lisbon tsunami. Evaluation of the tsunami parameters, in
Proceedings of the XXIV General Assembly of the European SeismologicalCommission, Vol.3, 1790–1796.
Baptista, M.A., Miranda, P.M.A., Miranda, J.M. & Mendes Victor, L., 1996.
Rupture extent of the 1755 Lisbon earthquake inferred from numerical
modeling of tsunami data, Phys. Chem. Earth, 21(12), 65–70.
Baptista, M.A., 1998. Genese, Propagacao e Impacto de Tsunamis na Costa
Portuguesa, PhD thesis. University of Lisbon.
Baptista, M.A., Heitor, S., Miranda, J.M., Miranda, P.M.A. & Mendes
Victor, L., 1998a. The 1755 Lisbon earthquake; evaluation of the tsunam
parameters. J. Geodyn., 25, 143–157.
C© 2007 The Authors, GJI, 171, 807–822
Journal compilation C© 2007 RAS
Dow
nloaded from https://academ
ic.oup.com/gji/article/171/2/807/658273 by guest on 05 February 2022
820 Raphael Grandin et al.
Baptista, M.A., Miranda, P.M.A., Miranda, J.M. & Mendes Victor, L., 1998b.
Constraints on the source of the 1755 Lisbon tsunami inferred from nu-
merical modelling of historical data on the source of the 1755 Lisbon
tsunami, J. Geodyn., 25, 159–174.
Baptista, M.A., Lopes, C., Lopes, F.C. & Miranda, J.M., 2000. Analysis of the
1722.12.27 earthquake and the tsunami (Tavira-Portugal), 2a Assembleia
Luso-Espanhola de Geodesia e Geofısica, Lagos, Portugal, 8–12 February,
Abstracts, pp. 153–154.
Baptista, M.A., Miranda, P.M.A., Chierici, F. & Zitellini, N., 2003. New study
of the 1755 earthquake source based on multi-channel seismic survey data
and tsunami modeling, Nat. Hazards Earth Sci. Syst., 3, 333–340.
Baptista, M.A., Miranda, J.M. & Luis, J.F., 2006. In Search of the 31 March
1761 Earthquake and Tsunami Source, Bull. Seism. Soc. Am., 96(2), 713–
721, doi:10.1785/0120050111.
Beresnev, I.A. & Atkinson, G.M., 1997. Modeling finite-fault radiation from
the �n spectrum, Bull. Seism. Soc. Am., 87, 67–84.
Bezzeghoud, M. & Buforn, E., 1999. Source parameters of the 1992 Melilla
(Spain, M w = 4.8), 1994 Alhoceima (Morocco, M w = 5.8), and 1994
Mascara (Algeria, M w = 5.7) earthquakes and seismotectonic implica-
tions, Bull. Seism. Soc. Am., 89(2), 359–372.
Bezzeghoud, M. & Borges, J.F., 2003.Mecanismos focais em Portugal con-
tinental, Fısica de la Tierra, 15, 229–245.
Borges, J.F., Fitas, A.J.S., Bezzeghoud, M. & Teves-Costa, P., 2001. Seismo-
tectonics of Portugal and its adjacent Atlantic area, Tectonophysics, 337,373–387.
Borges, J.F., Bezzeghoud, M., Buforn, E., Pro, C. & Fitas, A., 2007. The
1980, 1997 and 1998 Azores earthquakes and some seismo-tectonic im-
plications, Tectonophysics, 435, 37–54, doi:10.1016/j.tecto.2007.01.008
British Oceanic Data Centre, 2003. Centenary edition of the GEBCO digital
atlas, www.bodc.ac.uk.
Brune, J.N., 1970. Tectonic stress and the spectra of seismic shear waves
from earthquakes, J. Geophys. Res., 75, 4997–5009.
Buforn, E., Udıas, A. & Mezcua, J., 1988. Seismicity and focal mechanisms
in south Spain, Bull. Seism. Soc. Am., 78, 2008–2224.
Buforn, E., Bezzeghoud, M., Udıas, A. & Pro, C., 2004. Seismic sources
on the Iberia-African plate boundary and their tectonic implications, PureAppl. Geophys., 161, doi:10.1007/s00024-003-2466-1.
Calvert, A. et al., 2000. Geodynamic evolution of the lithosphere and upper
mantle beneath the Alboran region of the western Mediterranean: con-
straints from travel time tomography, J. geophys. Res., 105, 10 871–10
898.
Carrilho, J., Teves-Costa, P., Morais, I., Pagarete, J. & Dias, R., 2004.
GEOALGAR Project: first results on seismicity and fault-plane solutions,
Pure Appl. Geophys., 161, 589–606.
Carvalho, J., 2004. Sısmica de alta resolucao aplicada a prospeccao, geotec-
nica e risco sısmico, Ph.D. thesis. Univ. of Lisbon, 435 pp.
Carvalho, J., Cabral, J., Goncalves, R., Torres, L. & Mendes-Victor, L., 2006.
Geophysical methods applied to fault characterization and earthquake
potential assessment in the Lower Tagus Valley, Portugal, Tectonophysics,418, 277–297.
Chen, W.P. & Grimison, N., 1989. Earthquakes associated with diffuse
zones of deformation in the oceanic lithosphere: some examples, Tectono-physics, 166, 133–150.
Dawson, A.G., Hindson, R., Andrade, C., Freitas, C., Parish, R. & Bateman,
M., 1995. Tsunami sedimentation associated with the Lisbon earthquake
of 1 November AD 1755: Boca do Rio, Algarve, Portugal, The Holocene,5(2), 209–215.
DeMets, C., Gordon, R.G., Argus, D.F. & Stein, S., 1994. Effect of recent
revisions to the geomagnetic reversal time scale on estimates of current
plate motions, Geophys. Res. Lett., 21(20), 2191–2194.
Dias, R.P., 2001. Neotectonica da Regiao do Algarve, Ph.D. thesis. Univ. of
Lisbon, 369 pp.
Dinis, J.L., 2006. Nazare do Canhao a “falha”, da hipotese ao mito, paper
presented at VII Congresso Nacional de Geologia, Estremoz, Portugal,
29 June – 13 July.
Fadil, A., Vernant, P., McClusky, S., Reilinger, R., Gomez, F., Ben Sari, D.,
Mourabit, T., Feigl, K. & Barazangi, M., 2006. Active tectonics of the
western Mediterranean: Geodetic evidence for rollback of a delaminated
subcontinental lithospheric slab beneath the Rif Mountains, Morocco,
Geology, 34(7), 529–532.
Fonseca, J.F.B.D. & Long, R.E., 1991. Seismotectonics of SW Iberia: a
distributed plate margin? in Seismicity, Seismotectonics, and Seismic Riskof the Ibero-Maghrebian Region, eds Mezcua, J. & Udıas, A., Memoir 8,
Instituto Geografico Nacional, Madrid.
Fonseca, J.F.B.D., Vilanova, S., Bosi, V.B. & Meghraoui, M., 2000. Inves-
tigations Unveil Holocene Thrusting for Onshore Portugal, EOS, 81(36),
412–413.
Fonseca, J.F.B.D., Vilanova, S., Bosi, V.B. & Meghraoui, M., 2001. Paleoseis-
mological studies Near Lisbon: Holocene thrusting or landslide activity?,
EOS, 82(32), 351–353.
Foster, I.D.L., Dawson, A.G., Dawson, S., Lees, J.A. & Mansfield, L., 1993.
Tsunami sedimentation sequences in the Scilly Isles, south-west England,
Sci. Tsunami Hazards, 11(1), 35–46.
Frankel, A. & Vidale, J.E., 1992. A three-dimensional simulation of seismic
waves in the Santa Clara Valley, California, from a Loma Prieta aftershock,
Bull. Seism. Soc. Am., 82, 2045–2074.
Fukao, Y., 1973. Thrust faulting at a lithospheric plate boundary: the Portugal
earthquake of 1969, Earth Planet. Sci. Lett., 18, 205–216.
Gjevik, B., Pedersen, G., Dybesland, E., Harbitz, C.B., Miranda, P.M.,
Baptista, M.A., Mendes-Vector, L., Heinrich, P., Roche, R. & Guesmia,
M., 1997. Modeling tsunamis from earthquake sources near Gorringe
Bank sourthwest of Portugal, J. Geophys. Res., 102(C13), 27,931–27,949.
Gracia, E., Danobeitia, J., Verges, J., Bartolome, R. & Cordoba, D. 2003a.
Crustal architecture and tectonic evolution of the Gulf of Cadiz (SW
Iberian margin) at the convergence of the Eurasian and African plates,
Tectonics, 22(4), doi:10.1029/2001TC901045.
Gracia, E., Danobeitia, J. & Verges, J., 2003b. Mapping active faults offshore
Portugal (36◦N-38◦N): implications for the seismic hazard assessment
along the southwest Iberian margin, Geology, 31(1), 83–86.
Grandin, R., Borges, J.F., Bezzeghoud, M., Caldeira, B. & Carrilho, F., 2007.
Simulations of strong ground motion in SW Iberia for the 1969 February
28 (M S = 8.0) and the 1755 November 1 (M ∼ 8.5) earthquakes–I.
Velocity model, Geophys. J. Int., doi:10.1111/j.1365-246X.2007.03570.x.
Grimison, N. & Chen, W., 1986. The Azores-Gibraltar plate boundary: focal
mechanisms, depth of earthquakes and their tectonical implications, J.geophys. Res., 91, 2029–2047.
Grimison, N. & Chen, W., 1988. Focal mechanisms of four recent earth-
quakes along the Azores-Gibraltar plate boundary, Geophys. J. R. astr.Soc., 92, 391–401.
Guesmia, M., Heinrich, P. & Mariotti, C., 1996. Finite element modelling of
the 1969 Portuguese tsunami, Phys. Chem. Earth, 21(12), 1–6.
Gutscher, M.A., Malod, J., Rehault, J.P., Contrucci, I., Klingelhoefer, F.,
Mendes-Victor, L. & Spackman, W., 2002. Evidence for active subduction
ben(eath Gibraltar, Geology, 30, 1071–1074.
Gutscher, M.-A., Baptista, M.A., Miranda, J.M., 2006. The Gibraltar Arc
seismogenic zone. Part 2: constraints on a shallow east dipping fault plane
source for the 1755 Lisbon earthquake provided by ts Baptista et al., 2003
unami modeling and seismic intensity, Tectonophysics, 426(1–2), 153–
166.
Hartzell, S. et al., 2006. Modeling and Validation of a 3D Velocity Structure
for the Santa Clara Valley, California, for Seismic-Wave Simulations, Bull.Seism. Soc. Am., 96(5), 1851–1881.
Hayward, N., Watts, A.B., Westbrook, G.K. & Collier, J.S., 1999. A seismic
reflection and GLORIA study of compressional deformation in the Gor-
ringe Bank region, eastern North Atlantic, Geophys. J. Int., 138, 831–850.
Heinrich, P., Baptista, M.A. & Miranda, P., 1994. Numerical simulations of
the 1969 tsunami along the Portuguese coasts, Preliminary results, Sci.Tsunami Hazards, 12(1), 3–23.
Jimenez-Munt, I., Fernandez, M., Torne, M. & Bird, P., 2001. The transi-
tion from linear to diffuse plate boundary in the Azores-Gibraltar region:
results from a thin-sheet model, Earth. Planet. Sci. Lett., 192, 175–189.
Johnston, A., 1996. Seismic moment assessment of earthquakes in stable
continental regions – III. New Madrid 1811–1812, Charleston 1886 and
Lisbon 1755, Geophys. J. Int., 126, 314–344.
Justo, J.L. & Salwa, C., 1998. The 1531 Lisbon earthquake, Bull. Seism. Soc.Am., 88(2), 319–328.
C© 2007 The Authors, GJI, 171, 807–822
Journal compilation C© 2007 RAS
Dow
nloaded from https://academ
ic.oup.com/gji/article/171/2/807/658273 by guest on 05 February 2022

Strong motion in SW Iberia: Part 2 821
Kagawa, T., Zhao, B., Miyakoshi, K. & Irikura, K., 2004. Modeling of 3D
basin structures for seismic wave simulations based on available informa-
tion on the target area: case study of the Osaka Basin, Japan, Bull. Seism.Soc. Am., 94, 1353–1368.
Kaka, S.I. & Atkinson, G.M., 2004. Relationships between instrumental
ground-motion parameters and Modified Mercalli Intensity in Eastern
North America, Bull. Seism. Soc. Am., 94, 1728–1736.
Kanamori, H. & Anderson, D.L., 1975. Theoretical basis of some empirical
relations in seismology, Bull. Seism. Soc. Am., 65(5), 1073–1095.
Larsen, S.C. & Schultz, C.A., 1995. ELAS3D, 2D/3D Elastic Finite-Difference Wave Propagation Code, Lawrence Livermore National Lab-
oratory, UCRLMA-121792, 18 pp.
Larsen, S., Antolik, M., Dreger, D., Stidham, C., Schultz, C., Lomax, A. &
Romanowicz, B., 1997. 3D models of seismic wave propagation; simu-
lating scenario earthquakes along the Hayward Fault, Seism. Res. Lett.,68(2), 328.
Levret, A., 1991. The effects of the November 1st, 1755 “Lisbon” earthquake
in Morocco, Tectonophysics, 193, 83–94.
Lopez-Arroyo, A. & Udıas, A., 1972. Aftershock sequence and focal pa-
rameters of the february 28th, 1969 earthquake of the Azores-Gibraltar
Fracture Zone, Bull. Seism. Soc. Am., 62(3), 699–720.
Lopez Casado, C., Molina Palacios, S., Delgado, J. & Pelaez, J.A., 2000.
Attenuation of intensity with epicentral distance in the Iberian Peninsula,
Bull. Seism. Soc. Am., 90(1), 34–47.
Luque, L., Lario, J., Zazo, C., Goy, J.L., Dabrio, C.J. & Silva, P.G., 2001.
Tsunami deposits as paleoseismic indicators: examples from the Spanish
coast, Acta Geologica Hispanica, 36 (3–4), 197–211.
Lynnes, C.S. & Ruff, L.J., 1985. Source process and tectonic implications
of the great 1975 North Atlantic earthquake, Geophys. J. R. astr. Soc., 82,497–510.
Machado, F., 1966. Contribucao para o estudo do terremoto do terramoto de
1 de Novembro de 1755, Rev. Fac. Ciencias, Lisbon, C14, 19–31.
Madariaga, R., 1976. Dynamics of an expanding circular fault, Bull. Seism.Soc. Am., 66 (3), 639–666.
Martınez-Solares, J.M., Lopez, A. & Mezcua, J., 1979. Isoseismal map of
the 1755 Lisbon earthquake obtained from Spanish data, Tectonophysics,53, 301–313.
Martınez-Solares, J.M. & Lopez-Arroyo, A., 2004. The great historical
1755 earthquake. Effects and damage in Spain, J. Seismol., 8(2), 275–
294.
Martins, I. & Mendes Vıctor, L.A., 2001. Contribuicao para o Estudo daSismicidade da regiao oeste da penınsula iberica. Publicacao no 25, Inst.
Geof. Infante D. Luıs, Univ. de Lisboa, 67 pp., Instituto Geofısico do
Infante D. Luıs, Lisboa.
Massel, C. et al., 2000. Neotectonics of the Macquarie Ridge Complex,
Australia-Pacific plate boundary, J. geophys. Res., 105(B6), 13 457–13
480.
Matias, L.M., 1996. A sismologia experimental na modelacao da estru-
tura da crusta em Portugal continental, Ph.D. thesis. Univ. of Lisbon,
398 pp.
Matias, L., Ribeiro, A., Baptista, M.A., Zitellini, N., Cabral, J., Terrinha,
P., Teves-Costa, P. & Miranda, J.M., 2005. Comment on “Lisbon 1755:
a case of triggered onshore rupture?” by Susana P. Vilanova, Catarina F.
Nunes, and Joao F. B. D. Fonseca, Bull. Seism. Soc. Am., 95(6), 2534–2538,
doi:10.1785/0120040023.
McClusky, S., Reilinger, R., Mahmoud, S., Ben Sari, D. & Tealeb, A., 2003.
GPS constraints on Africa (Nubia) and Arabia plate motions, Geophys. J.Int., 155, 126–138.
McGuire J., Zhao, L. & Jordan, T.H., 2002. Predominance of unilateral
rupture for a global catalog of large earthquakes, Bull. Seism. Soc. Am.,92 (8), 3309–3317.
McKenzie D., 1972. Active Tectonics of the Mediterranean Region, Geophys.J. R. astr. Soc., 30, 109–185.
Mezcua, J., 1982. Catalogo general de isosistas de la Peninsula Iberica,Instituto Geographico Nacional, Madrid.
Mendes, A.S., 1974. Consideracoes sobre o sismo de 28 de Fevereiro
de 1969, Publ. Servico Meteorologico Nacional, Portugal, RT1194,
GEO158.
Mendes-Victor, L., Baptista, M.A., Miranda, J.M. & Miranda, P.M.A., 1999.
Can hydrodynamic modelling of tsunami contribute to seismic risk assess-
ment?, Phys. Chem. Earth, 24, 139–144.
Miranda, J.M., Miranda, P.M.A., Baptista, M.A. & Mendes-Victor, L., 1996.
A comparison of the spectral characterisitics of observed and simulated
tsunamis, Phys. Chem. Earth, 21(12), 71–74.
Montilla, J.A.P., Lopez Casado, C. & Henares Romero, J. 2002. Deag-
gregation in magnitude, distance, and azimuth in the South and
West of the Iberian Peninsula, Bull. Seism. Soc. Am., 92(6), 2177–
2185.
Moreira, V.S., 1984. Sismicidade historica de Portugal Continental, Revista
do Instituto Nacional de Meteorologia e Geofısica, Lisbon, pp. 79.
Moreira, V.S., 1985. Seismotectonics of Portugal and its adjacent area in the
Atlantic, Tectonophysics, 11, 85–96.
Olsen, K. & Schuster, G., 1992. Site amplification in the Salt Lake Valley by
three-dimensional elastic wave propagation, EOS, Trans. Am. Geophys.Union, 73(43) (Supplement), 338.
Olsen, K.B. & Archuleta, R.J., 1996. Site response in the Los Angeles Basin
from 3-D simulations of ground motion, SRL, 67(2), p. 49.
Paula, A. & Oliveira, C.S., 1996. Evaluation of 1947–1993 macroseismic
information in Portugal using the EMS-92 scale, Ann. Geof. 39(5), 989–
1003.
Pereira de Sousa, F.L., 1919. O terremoto do 1◦ de Novembro de 1755 em
Portugal e um estudo demografico (Servicos Geologicos de Portugal),
Vol. I-IV.
Pitarka, A., Takenaka, H. & Suetsugu, D., 1994. Modeling strong motion in
the Ashigara Valley for the 1990 Odawara, Japan, earthquake, Bull. Seism.Soc. Am., 84, 1327–1335.
Pitarka, A., Suetsugu, D. & Takenaka, H., 1996. Elastic finite-difference
modeling of strong motion in Ashigara Valley for the 1990 Odawara,
Japan, earthquake, Bull. Seism. Soc. Am., 86, 981–990.
Pitarka, A., Irikura, K., Iwata, T. & Sekiguchi, H., 1998. Three-dimensional
simulation of the near-fault ground motion for the 1995 Hyogo-Ken
Nanbu (Kobe), Japan, earthquake, Bull. Seism. Soc. Am., 88, 428–
440.
Pitarka, A., Graves, R. & Sommerville, P., 2004. Validation of a 3D velocity
model of the Puget Sound region based on modeling ground motion from
the 28 February 2001Nisqually earthquake, Bull. Seism. Soc. Am., 94(5),
1670–1689.
Platt, J.P. & Houseman, G., 2003. Comment on: evidence for ac-
tive subduction beneath Gibraltar, by Gutscher, M.-A., J. Malod,
J.-P. Rehault, I. Contrucci, F. Klingelhoefer, Mendes-Victor, L. and W.
Spakman, Geology, 31(6), e22. (Online Forum http://www.gsajournals.
org/gsaonline/?request=get-static&name=i0091-7613-31-6).
Reid, H.F., 1914. The Lisbon earthquake of November 1, 1755, Bull. Seism.Soc. Am., 4(2), 53–80.
Ribeiro, A., Cabral, J., Baptista, R., Matias, L., 1996. Stress pattern in Por-
tugal mainland and the adjacent Atlantic region, West Iberia, Tectonics,15, 641–659.
Ribeiro, A., 2002. Soft Plate and Impact Tectonics, Springer Verlag, Berlin
Heidelberg, Germany, 324 pp.
Ribeiro, A., Mendes-Victor, L., Cabral, J., Matias, L. & Terrinha, P., 2006.
The 1755 Lisbon earthquake and the beginning of closure of the Atlantic,
Eur. Rev., 14, 193–205.
Sato, T., Graves, R.W. & Somerville, P.G., 1999. Three-dimensional finite-
difference simulations of long-period strong motions in the Tokyo
metropolitan area during the 1990 Odawara earthquake (Mj 5.1) and the
great 1923 Kanto earthquake (Ms8.2) in Japan, Bull. Seism. Soc. Am., 89,579–607.
Satoh, T., Kawase, H., Sato, T. & Pitarka, A. 2001. Three-dimensional finite-
difference waveform modeling of strong motions observed in the Sendai
Basin, Japan, Bull. Seism. Soc. Am., 91, 812–825.
Scheffers, A. & Kelletat, D., 2005. Tsunami relics on the coastal land-
scape west of Lisbon, Portugal, Science of Tsunami Hazards, 23(1), 3–
16.
Stich, D., Ammon, C.J. & Morales, J., 2003. Moment tensor solutions for
small and moderate earthquakes in the Ibero-Maghreb region, J. geophys.Res., 108, 2148, doi:10.1029/2002JB002057.
C© 2007 The Authors, GJI, 171, 807–822
Journal compilation C© 2007 RAS
Dow
nloaded from https://academ
ic.oup.com/gji/article/171/2/807/658273 by guest on 05 February 2022

822 Raphael Grandin et al.
Stich, D., Serpelloni, E., Mancilla, F. & Morales, J., 2006. Kine-
matics of the Iberia-Maghreb plate contact from seismic mo-
ment tensors and GPS observations, Tectonophysics, 426, 295–317.
doi:10.1016/j.tecto.2006.08.004.
Stidham, C., Dreger, D., Antolik, M., Larsen, S. & Romanowicz, B., 1999.
Three-dimensional structure influences on the strong motion wavefield
of the 1989 Loma Prieta earthquake, Bull. Seism. Soc. Am., 89, 1184–
1202.
Dreger, D., Dolence, D., Stidham, C., Baise, L. & Larsen, S., 2001. Evaluat-
ing 3D earth models for the purpose of strong ground motion simulation,
Seism. Res. Lett., 72(2), 278.
Terrinha, P., 1997. Structural geology and tectonic evolution of the Algarve
basin, South Portugal, Ph.D. thesis. Univ. of Lisboa, 425 pp.
Terrinha, P. et al. 2003. Tsunamigenic-seismogenic structures, neotectonics,
sedimentary processes and slope instability on the southwest Portuguese
Margin, Mar. Geol., 195, 55–73.
Teves-Costa, P., Borgis, J.F., Rio, I., Ribeiro, R. & Marreiros, C., 1999.
Source parameters of old earthquakes: semi-automatic digitalization of
analog records and seismic moment assessment, Nat. Hazards, 19, 205–
220.
Thiebot, E. & Gutscher, M.-A., 2006. The Gibraltar Arc seismogenic zone
(part 1): constraints on a shallow east dipping fault plane source for the
1755 Lisbon earthquake provided by seismic data, gravity and thermal
modeling, Tectonophysics, 426(1–2), 135–152.
Trifunac, M.D. & Brady, A.G., 1975. On the correlation of seismic intensity
scales with the peaks of recorded strong ground motion, Bull. Seism. Soc.Am. 65, 139–162.
Udıas, A. & Lopez-Arroyo, A., 1970. Body and surface wave study of source
parameters of the March 15, 1964 Spanish earthquake, Tectonophysics, 9,323–346.
Vilanova, S.P., 2003. Sismicidade e Perigosidade Sısmica do Vale Inferior
do Tejo, Ph.D. thesis. Univ. of Lisbon, 259 pp.
Vilanova, S.P., Nunes, C.F. & Fonseca, J.F.B.D., 2003. Lisbon 1755: a case
of trigerred onshore rupture?, Bull. Seism. Soc. Am., 93, 2056–2068.
Wald, D. & Graves, R., 1998. The seismic response of the Los Angeles basin,
California, Bull. Seism. Soc. Am., 88, 337–356.
Wald, D.J., Quitoriano, V., Heaton, T.H., Kanamori, H., Scrivner, C.W. &
Worden, C.B., 1999. TriNet “ShakeMaps”: rapid generation of instru-
mental ground motion and intensity maps for earthquakes in southern
California, Earthq. Spectra, 15, 537–556.
Wells, D. & Coppersmith, K., 1994. New empirical relationships among
magnitude, rupture length, rupture width, rupture area and surface dis-
placement, Bull. Seism. Soc. Am., 84, 974–1002.
Wu, Y.-M., Teng, T.-L., Shin, T.-C. & Hsiao, N.-C., 2003. Relationship
between peak ground acceleration, peak ground velocity, and intensity
in Taiwan, Bull. Seism. Soc. Am., 93, 386–396.
Zitellini, N. et al., 2001. Source of the 1755 Lisbon earthquake and tsunami
investigated, EOS Trans. Amer. Geophys. U., 82, 285.
C© 2007 The Authors, GJI, 171, 807–822
Journal compilation C© 2007 RAS
Dow
nloaded from https://academ
ic.oup.com/gji/article/171/2/807/658273 by guest on 05 February 2022