simulation of tailings filtration performance
TRANSCRIPT

1
Simulation of Tailings Filtration Performance
Jason Palmer
Metso-Outotec, Australia
ABSTRACT
Tailings filtration is growing in interest with increased pressure on water resources and Tailings
storage facility legislation. In greenfield projects limited sample is available to evaluate filtration
performance and often composite samples to represent mineral recovery are utilised.
The mineral resource over the life of the mine can be variable and small changes in clay or other
material can have significant effects on the filterability.
This paper looks at methods to predict filterability of a tailings stream with changes in mineralogy.
Based on initial testwork and historical database information, mineralogy and particle size data can
be analysed in HSC SIM to predict the rate and achievable moisture. Together with plant model
information, alternative dewatering strategies can be evaluated to determine the capital and
operating costs.

2
INTRODUCTION
Mine planning and realisation start with geology, detailed information on mineralisation is usually
collected in the early stage of a project. As the responsibility shifts from mine planning to mineral
processing, the focus moves from the major body of the resource to the desired mineral or final
concentrate.
In the past, the properties of tailings where disposal is in a wet tailings dam were often a minor
consideration. With a shift towards filtered tailings, the properties and the variability of the tailings
takes on more importance.
MODELING OF CAKE FILTRATION
Multiple theories have been developed to describe cake filtration. Many early models describe the
flow of liquid through the cake using a capillary analogy to explain and predict filtration
performance. One of the simpler and reliable theories is the Darcy equation (equation 1) where the
rate Q is proportional to the cake resistance, area, pressure and viscosity of the slurry to be dewatered.
This explains the formation of a filter cake from a slurry.
� = ����
��=
���
� (1)
� =� × �� × �� × �
8 × � × � (2)
��� =� �� ���� (� !"#)
!"#$ (3)
(1),(2),(3)refer to the nomenclature at the end of the document
Hagen- Poiseuille’s (equation 2) formula further relates the filtrate flow to the particle size or more
specifically the diameter of pores in the cake. The value r is the pore diameter and is difficult to
measure. A relationship to the particle size is more useful.
In equation (1) the Kozeny constant K depends on the structure of the cake, and it is typically assumed
to be 5.0 for randomly packed incompressible beds (Grace, 1953; Tiller, 1953). Equation (1) can be
further modified and written in terms of average specific cake resistance, to give Equation (3).
Equation (3) now clearly shows that the relationship between the average specific cake resistance and
specific surface area should be quadratic if the cake porosity remains constant.
The use of equations (1) and (2) for predicting the values of filtrate flow or cake resistance is
reasonable. The applied pressure in filtration has a direct influence on the packing structure of the
bed, thus influencing also several other parameters in the equations (Häkkinen et al., 2008). Sperry
(1916) and others added a second resistance for the filter media to improve the models, however, all

3
are based on the assumptions, the state of the cake with the compressive stress and assumed the
particles' diameters are within an order of magnitude.
To compare the predictability of capillary based models we can look at filterability of different
slurries where viscosity and void fraction are kept constant and specific surface is compared to cake
resistance. Specific surface itself is quite complex to measure accurately with some variability
depending upon the measurement procedure. Particles with porous structures show very high
surface areas and measurements that consider mean diameters give better comparison to filtration
tests. Despite selecting samples with relatively homogeneous materials, as shown in Figure 1, some
material correlated well and others not. As a methodology for analysing unknown samples the
theoretical approach has some limitations. When extending this approach to tailings with diverse
compositions and clays with large surface areas compared to their mean diameter, theoretical
modelling from specific surface should be used with caution. Where the model can be compared to
filtration data, the model can be refined, and the accuracy greatly improved.
Figure 1 Filterability vs specific surface area
In industrial filtration operation, there is significantly larger variability of type and slurry particle
sizes than in laboratory experiments. When the major particles retain to form a cake, a fine material
(slimes and clays) penetrates the cake, moving with filtrate forming non homogenous cakes. Ignoring
the effect of fine particle retention could lead to an overestimation of the compression effect on cake
permeability, since a small amount of fine retention may significantly blind a cake.
Rheological models take compressive yield stress and the hindered settling rate as functions of the
local volume fraction.
In general, the performance of a filtration of non-Newtonian slurry depends not only on the rheology
of the dispersion medium of slurry, but also on the properties of the filter cake, such as the porosity

4
and specific filtration resistance of the cake. Micro structure and Monti Carlo models further help
explain filtration behaviour, however definition of particle parameters from mineralogical data is
difficult and these were not utilised.
In cake filtration, cake formation and growth is a particle-packing process. Particle packing is never
ordered but random in actual filtration. Extensive modelling (Ni 2001) of the solid flow by Discrete
Particle Method (DPM) is at the individual particle level, whilst the fluid flow by Continuum Fluid
Method CFM is at the computational cell level.
By combining CFM with DPM, studies of cake filtration give results that are comparable to those
obtained by the above Monte Carlo method to a large degree, both models exclude van der Waal
forces. Once again despite the accuracy and sophistication of these models they do not represent a
method to accurately model complex mineral slurries.
To enable simulation in HSC Chemistry® a permeability and cake formation rate proportional to
particle size is required and more complex simulations were not used. While effective in analysing
test data, few models can predict the expected performance from mineralogical data, and physical
testing remains the best methodology for determining filterability and is used as an input to the
model where possible.
The filterability is also defined by the equipment selected and the particles in the slurry fed to the
filtration equipment. Various factors affect filter performance. Temperature, viscosity, and soluble
solids concentration determine the liquid properties whilst particle size and shape, the way they are
concentrated will define the resistance to liquid flow through the cake and particle surface
interactions and pore size will determine the extent to which gas can displace liquid.
TEST ANALYSIS OF VARIABLE PARTICLE SIZES
The filterability of tailings slurries was experimentally studied to see the differences between the
filterability of coarser and finer fractions, obtained from hydrocyclone separation of a tailings stream.
A feed sample of 97.3kg was split to an overflow of 29.4 kg and an underflow of 67.9 kg. As a
benchmark the filterability of the feed material gave a rate of 3200 kg/m2h. The coarse fraction was
significantly easier to filter and capacities up to 9000 kg/m2h were achieved. The slimes fraction was
very difficult to Filter and at 1000 kg/m2h the slimes requires a similar sized filter to whole tails
filtration. (see figure 2)
This dependence of filterability on the fines fraction indicates that a model built on the filterability of
the fines fraction as a rate limiting value, with coarser material added as ballast to modify capacity
and moisture. In vacuum filters the maximum capacity is not limited by cake thickness, compared to
pressure filtration where chamber volume and machine function limit filtration rates with coarse
material.

5
Figure 2 Hydrocyclone separated tails filterability
Filtration models and industrial scaleup
Filtration models for complex mine tailings can be constructed from a combination of theorical
models and laboratory test results. Rather than selecting composite samples as a baseline, samples
that represent the more difficult materials should be tested and used for the model. Clays and
oxidised materials should be tested if possible.
Where insufficient material exists to conduct filtration testing, specific surface measurements can be
useful in predicting cake resistance. Mineralogical analysis data allows data of similar minerals
filterability to be used and the rates can be modified to suit the expected ore composition.
The cake resistance, while important, may represent only a small fraction of the industrial scale
equipment performance and the model needs to be customised to the preferred filtration technology.
In addition to cake resistance models, cake moisture also needs to be considered. Filtered tailings for
dry stack disposal need to dewatered to a moisture defined by geotechnical properties, the required
moisture will be below the saturated cake moisture and some form of gas displacement of filtrate in
the cake is required to achieve the process targets. Testing is preferred however pore pressure
analysis can be useful in selecting the correct filter technology or estimating the achievable filtered
cake moisture.
10
10.5
11
11.5
12
12.5
13
13.5
0 1000 2000 3000 4000 5000 6000 7000
Ca
ke
mo
istu
re (
% w
/w)
Capacity (kg/m2 h)
Cycloned tails filterability
cyclone o/f
cyclone feed
cyclone u/f

6
The required differential pressure to exceed the capillary pressure can be calculated using several
equations. One equation predicts the pressure from surface tension, as shown in Equation (4), and it
is a function of the pore diameter D, surface tension τ and the solid wetting angle θ. Unlike flotation
concentrates, tailings generally have a hydrophilic surface and a large wetting angle that increases
the threshold pressure. (Wakeman, R.J. and Tarleton, E.S. (2005))
Alternatively, when considering gas flow displacement, the relative permeability models of Lloyd
and Dobbs (equation 5), can be applied. This model can be used to predict the threshold pressure
required for airflow.
Airflow is an important parameter and the saturated void fraction gives a good starting cake
moisture, to relate the final moisture to capacity a decay model taken from filtration data is required.
To estimate the required geotechnical moisture extensive testing is usually required, where this is not
available plastic limit and liquid limit data can be utilised to estimate a geotechnical stacking
moisture.
By combining a model of cake filtration and cake drying with machine parameters, reasonable
predictions of filter performance can be estimated. In addition, the gas flow model utilises parameters
available in HSC Chemistry®
Δp = �� '()*
+ (4)
,- =..0 (1 ℇ)�
ℇ3 (5)
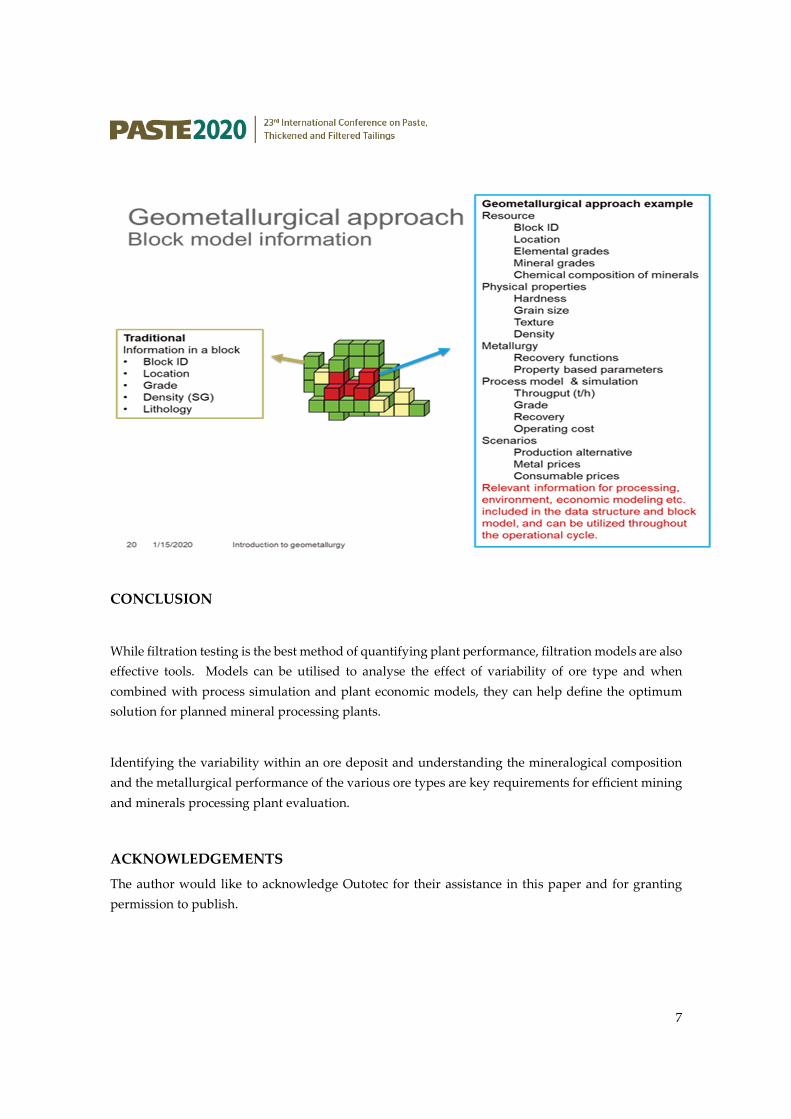
Filtration models and Geometallurgical characterization
Compared to product dewatering where tailings are filtered, the operating costs can be significant.
Filtration models can be included to Geometallurgical models to assist economic evaluation of ores.
The results of mineralogical characterization, ore grindability, Bond Wi, and the locked cycle flotation
and dewatering tests can be reprocessed with HSC Chemistry® 9 Data module utilizing linear
regression analysis and principal component analysis.
7
CONCLUSION
While filtration testing is the best method of quantifying plant performance, filtration models are also
effective tools. Models can be utilised to analyse the effect of variability of ore type and when
combined with process simulation and plant economic models, they can help define the optimum
solution for planned mineral processing plants.
Identifying the variability within an ore deposit and understanding the mineralogical composition
and the metallurgical performance of the various ore types are key requirements for efficient mining
and minerals processing plant evaluation.
ACKNOWLEDGEMENTS
The author would like to acknowledge Outotec for their assistance in this paper and for granting
permission to publish.

8
NOMENCLATURE
Q Filter capacity (kg m2/h)
K Filtration resistance
Δp Differential pressure
µ Viscosity
A Filter area (m2)
L Cake thickness (m)
V Filtrate volume (m3/h)
r Pore diameter (m)
ε void fraction.
SSA Particle surface area
45 solids density
Pb threshold pressure.
σ solids volume fraction.
d particle diameter.
θ wetting angle.
τ surface tension.
REFERENCES
Palmer, J. Operational results and future trends of filtration technology in minerals processing, XV
Balkan Mineral processing Conference, 2013
Linan Ni, Modelling and Simulation of Cake Formation In Cake Filtration Process, Faculty Of Science
And Technology The University Of New South Wales, Thesis, 2001
Safonov, D, Häkkinen Blaine surface areas of Hematite samples, Lappeenranta University of
Technology 2015.
Liipo, J., Hicks, M. Takalo, V-P., Remes, A. Talikka, M., Khizanishvili, S., and Natsvlishvili, M.
Geometallurgical characterization of South Georgian complex copper-gold ores. The Southern
African Institute of Mining and Metallurgy, 2019