simulation of multiphase flow in models of complex … · simulation of multiphase flow in models...
TRANSCRIPT

IMPERIAL COLLEGE LONDON
Department of Earth Science and Engineering
Centre for Petroleum Studies
Simulation of Multiphase Flow in Models of Complex Tidal Heterogeneities
By
Hamza Shaikh
A report submitted in partial fulfilment of the requirements for the MSc and/or the DIC.
September 2013

Simulation of Multiphase Flow in Models of Complex Tidal Heterogeneities ii
DECLARATION OF OWN WORK
I declare that this thesis Simulation of Multiphase Flow in Models of Complex Tidal Heterogeneities is entirely my own
work and that where any material could be construed as the work of others, it is fully cited and referenced, and/ or with appropriate acknowledgement given.
Signature:
Name of Student: Hamza Shaikh
Name of Imperial College Supervisor: Matthew D. Jackson
Names of Schlumberger Supervisors: Marie Ann Giddins, Alan Thompson

Simulation of Multiphase Flow in Models of Complex Tidal Heterogeneities iii
Acknowledgements
I would like to acknowledge all the people who contributed to this memorable MSc thesis project experience at Schlumberger. I am very grateful to Marie Ann Giddins for giving me the opportunity to work on this project at the honoured Abingdon Technology Centre. Her help, patience and deep knowledge of the subject were the key components that played an essential part in writing this paper. Also, this research would not have been possible without the guidance and support from the great technical minds at Schlumberger, including Alan Thompson, who helped me in interpreting my results from the experiments, and Balraj Grewal, who delivered a workshop to teach INTERSECT. Kelti Petto, an ambitious individual, was in a similar position as me last year, and he provided a lot of help for getting a kick-start into the project by providing me a refresher of Petrel and ECLIPSE softwares. Also, it was very nice of everyone in the Technical Services team at Schlumberger to be very flexible and accommodating by taking time off from their busy schedules and guiding me and my intern colleagues in solving some of the issues we had during our projects
I would also like to extend my gratitude to Matthew Jackson for providing me regular feedback on my results, and also Benoit Massart for his hard work in constructing the Geological model. This work certainly would not have been completed to good quality without the morale boost from my fiancée, Sofia Baber, who also kindly offered to proofread the paper and suggest improvements.
These 5 years at Imperial College London have been absolutely amazing. Choosing Imperial for higher education was one of the best decisions I made. Some memories from Imperial will always remain with me, including all the good times spent with friends, and more recently, finding my significant other, my fiancée.
Last, but not the least, I am thankful to my family members, who have always been supportive throughout my entire life. Their love has shaped me into the person I am today.

Simulation of Multiphase Flow in Models of Complex Tidal Heterogeneities iv
Table of Contents List of Figures ................................................................................................................................................................................. v
List of Tables .................................................................................................................................................................................. v
Abstract ........................................................................................................................................................................................... 1
1. Introduction ............................................................................................................................................................................. 1
2. Simulation Methodology ......................................................................................................................................................... 2
2.1. Grid Construction ............................................................................................................................................................ 3
2.2. Model Structure and Rock and Fluid Properties ............................................................................................................. 4
2.3. Calculation of Effective Permeability and Relative Permeabilities ................................................................................ 4
2.3.1. Single Phase Effective Permeability Calculation .................................................................................................... 4
2.3.2. Multi-Phase Relative Permeability Calculation ...................................................................................................... 5
3. Results ..................................................................................................................................................................................... 5
3.1. Single Phase Effective Permeabilities ............................................................................................................................ 5
3.2. Multi-phase Simulation Model ....................................................................................................................................... 6
3.3. Gridding Error ................................................................................................................................................................. 7
3.4. Relative Permeability Results ......................................................................................................................................... 8
3.4.1. Straight Line Relative Permeabilities ...................................................................................................................... 8
3.4.2. Directional Impact ................................................................................................................................................... 9
3.4.3. Reverse Flow ......................................................................................................................................................... 10
3.4.4. Density and Viscosity Effects ............................................................................................................................... 10
3.4.5. Increased Mud Drape Coverage and Reverse Flow .............................................................................................. 11
3.5. Irreducible Oil Saturation ............................................................................................................................................. 11
4. Discussion ............................................................................................................................................................................. 12
5. Conclusion ............................................................................................................................................................................ 12
6. Recommendations for Further Work .................................................................................................................................... 12
7. Nomenclature ........................................................................................................................................................................ 13
8. References ............................................................................................................................................................................. 13
Appendices .................................................................................................................................................................................... 15
Appendix A – Literature Reviews ............................................................................................................................................ 16
Appendix B – Milestones Table ............................................................................................................................................... 23

Simulation of Multiphase Flow in Models of Complex Tidal Heterogeneities v
List of Figures Figure 1: 3D grid for flow simulation and its respective outcrop. The mud drapes (red lines at the bottom) have been positioned onto the foreset-toeset surfaces (in black). A) Cross-section along the dip direction. B) Cross-section along the strike direction. ............................................................................................................................................................................... 3 Figure 2: A) Variation of injection and production face pressures, average field pressure and pressure difference across the injection and production faces with time. B) Variation of both oil and water injection and production rates with time. .............. 6 Figure 3: Cross section showing sweeping of oil using a mixture of oil and water. ...................................................................... 7 Figure 4: A) Flow in the horizontal direction. B) Flow in the vertical direction. ........................................................................... 7 Figure 5: Errors in oil and water relative permeabilities in the horizontal direction as a function of water saturation. ................ 8 Figure 6: Comparison between straight line and curved relative permeabilities. ........................................................................... 8 Figure 7: A) Relative permeability plots with 25% mud drape coverage. Cross sections for B) Dip, C) Strike and D) Vertical directions. ........................................................................................................................................................................................ 9 Figure 8: A) Relative permeability curves in the forward and reverse strike directions with 25% mud drape coverage. ........... 10 Figure 9: A) 3 pairs of relative permeability curves in the dip direction with 25% mud drape coverage with (1) no density or viscosity contrast, (2) with density ratio of 0.8 and (3) with a viscosity ratio of 0.1. .................................................................. 10 Figure 10: Relative permeability plots for forward and reverse flow in the strike direction for 70% and 25% mud drape coverage cases. .............................................................................................................................................................................. 11 Figure 11: Irreducible oil saturation comparison. ......................................................................................................................... 12 List of Tables Table 1: Description of the various cases analysed ........................................................................................................................ 2 Table 2: Rock and fluid properties ................................................................................................................................................. 4 Table 3: Single phase effective permeability results for the different models used. ...................................................................... 5

Simulation of Multiphase Flow in Models of Complex Tidal Heterogeneities
Hamza Shaikh
Matthew. D. Jackson, Imperial College London
Marie Ann Giddins, Alan Thompson, Schlumberger
Abstract
Heterolithic sandstone reservoirs have gained economic interest due to several recent, as well as old discoveries around the world. However, the presence of heterogeneities makes their petrophysical properties difficult to calculate using conventional core, wireline and well test data. These heterogeneities are characterised by complex inter-bedding of sandstone and mudstone.
Flow simulations were conducted on an unconventional grid of approximately 6 million cells representing a 3x3x1m cross-bedded sandstone reservoir constructed using outcrop data. Multi-phase flow was investigated and a set of oil and water relative permeabilities along with their respective gridding errors were obtained for various cases including the dip, strike and vertical directions as well as increased mud drape coverage from 25% to 70%. Furthermore, the effect of introducing a viscosity and density contrast between the fluids was also investigated.
It was observed that the relative permeabilities were affected by the presence of mudstone and entrapment of fluids. Finally an accurate comparison of the residual oil saturation was conducted for the various cases of different mud drape coverage, leading to a better understanding of the reservoir.
1. Introduction
Heterolithic tidal sandstone reservoirs have gradually become very economically interesting, and they feature in numerous locations worldwide, including Alaska, Canada, Russia, Venezuela and most notably offshore Norway (Martinius et al. 2005). Heterolithic sandstones consist of complex intervals of interbedded sedimentary features, which vary from thin lenticular sands in mudstone to mud flasers in sandstone (Martinius et al. 2005). The range of these small-scale (mm to cm) intercalations vary significantly in both the lateral, as well as vertical directions, demonstrating changes in the energy of the sedimentary depositional processes (Reineck & Wunderlich 1968) typical of tidally-influenced depositional environments. During a tidal cycle, flood and ebb current stages occur one after the other with a slack water period following each of these two phases. The tidal current is very weak throughout the slack water periods, so clay and silt settle down from the suspension, creating relatively continuous mudstone layers known as mud drapes (Nio & Yang 2001).
In 3D, especially, the occurrence of these heterogeneities introduces complex sedimentary architecture (Jackson et al. 2005), resulting in a significant special irregularity in reservoir properties for instance capillary pressure, permeability, mobile oil saturation, which become difficult to calculate for investigative purposes (Norris & Lewis 1991; Martinius et al. 2001). Furthermore, mud drapes can serve as obstacles to fluid flow (Ringrose et al. 2005), affecting the performance of reservoirs. Previous studies in Norway (Martinius et al. 2005) have proved that improved description and modelling of such reservoirs can generate better field development strategies and improved oil recovery, bringing substantial economic benefits.
Conventionally, permeability variations are represented on a block centred grid in a reservoir model, incorporated into grid blocks using results deduced from core, wireline and well tests. The huge amount of variation in properties with length, especially in tidal sandstone requires a better approach to capture the permeability variations. Core samples are obtained at mm-cm scale and do not take into account the inconstancy of facies. Well test analysis on the other hand samples at intervals between 100m-1km scale and averages over many different facies. The reservoir grid block scale is between 10’s-100’s of metres. Therefore upscaling permeability using a method which produces representative effective values is difficult (Renard & de Marsily 1997). Furthermore, it has been demonstrated in previous work (Corbett & Jensen 1993; Jackson et al. 2003) that core plug measurements are not likely to be appropriate at the reservoir grid block scale for tidal sandstone reservoirs.
Imperial College London
Simulation of Multiphase Flow in Models of Complex Tidal Heterogeneities 2
Linking the gap between the characterisation of core scale properties (mm-cm) and reservoir properties (>10-100m) has been attempted in the past by incorporating 2D outcrop data (Oost & Baas 1994), using 3D descriptions from larger outcrop rock samples of different sizes (Jackson et al. 2003; Jackson et al. 2005) and applying stochastic 3D models (Ringrose et al. 2003; Ringrose et al. 2005). These have provided better knowledge of the effect of heterogeneities in tidal sandstone reservoirs and facilitated quantifying the impact of parameters such as sand body connectivity on oil recovery in these reservoirs (Jackson et al. 2003; Jackson et al. 2005; Brandsaeter et al. 2005).
The aims of the project are to investigate multiphase flow and consider the impact of mobility contrast on model performance of heterolithic tidal sandstone reservoir models.
The procedure used for this study was a condensed version of surface-based modelling pioneered by Sech et al. (2009). Massart et al. (2011) used this methodology to create a generic 3m by 3m by 1m high resolution model in 3D of tidal bar deposits, where the rock volume was populated using a cross-bedding surface template by specifying input parameters constrained by an outcrop data analogue. This technique established a good ability of signifying the faults and spatial irregularity of the alternating mudstone and sandstone layers in the rock volume (Sech et al. 2009). The Ecocene Dir Abu Lifa Member, situated in the Western Desert in Egypt, South-West of Cairo was used to extract the outcrop parameters to create this model (Massart et al. 2011).
The dimensions of the model were chosen to be greater than the core scale (Bear 1972; Nordahl et al. 2005), and yet close to the Representative Elementary Volume (REV) (Norris & Lewis 1991). The REV suggests the minimum volume of rock essential to represent the homogenous properties of a reservoir. Jackson et al. (2003) demonstrated that REV for a tidal heterolithic sandstone reservoir could be obtained at core blocks with dimensions of approximately 30 cm. This supported the size of the model created. To further add validity to the model, a mud frequency function (Massart et al. 2011) obtained from representative outcrop data was used to place mud stochastically on mud drape surfaces.
In previous studies (Talabi 2011; Hou 2012; Petto 2012), the effective permeability using single phase flow was investigated. Many reservoir engineering applications make use of individual oil and water relative permeabilities. The objective of this project is to investigate the effects of such heterogeneity on multi-phase flow properties, particularly oil and water relative permeabilities in tidal sandstone reservoirs by performing multiple simulation studies on two mud drape coverage (25% and 70% percentage coverage of mud with respect to sand) models along the dip, strike (depositional) and vertical directions. Additionally, the errors generated due to gridding will also be analysed. 2. Simulation Methodology
The simulations were run to mimic conventional core flood experiments to measure the relative permeabilities of oil and water using a very fine scale simulation grid (DeBaun et al. 2005). Three models were used for the purpose of this study: 0% mud drape coverage (100% sandstone), 25% mud drape coverage and 70% mud drape coverage.
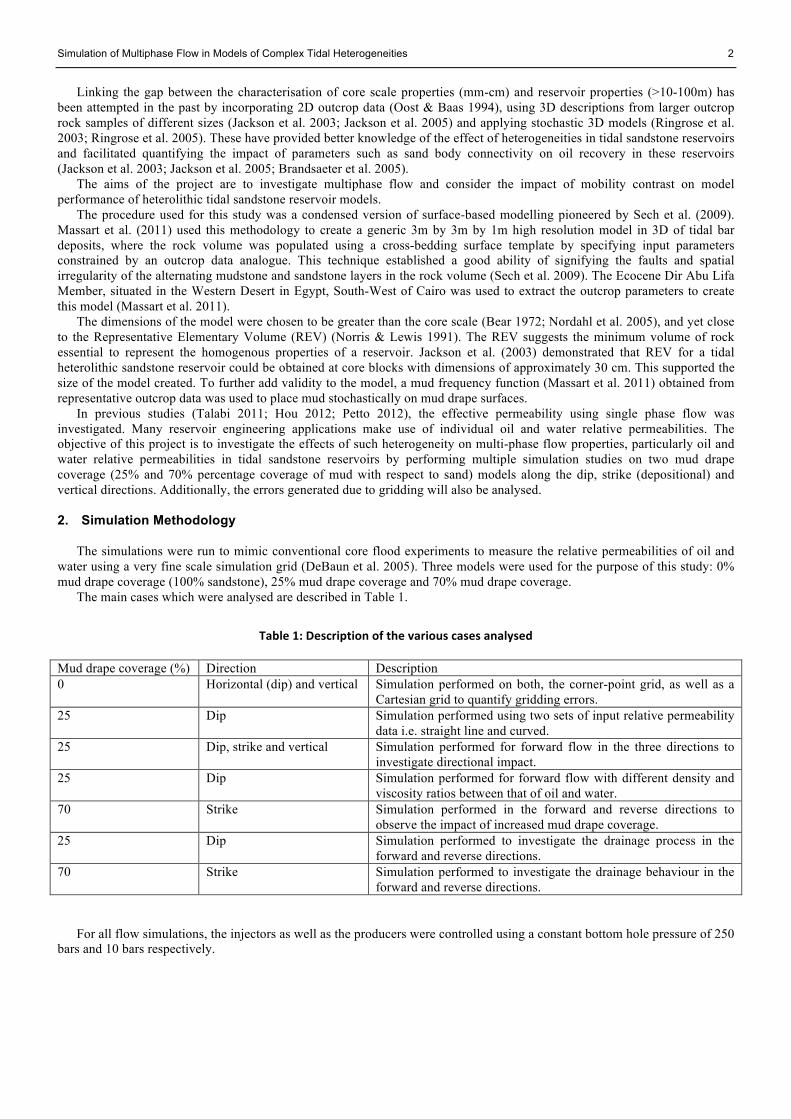
The main cases which were analysed are described in Table 1.
Table 1: Description of the various cases analysed
Mud drape coverage (%) Direction Description 0 Horizontal (dip) and vertical Simulation performed on both, the corner-point grid, as well as a
Cartesian grid to quantify gridding errors. 25 Dip Simulation performed using two sets of input relative permeability
data i.e. straight line and curved. 25 Dip, strike and vertical Simulation performed for forward flow in the three directions to
investigate directional impact. 25 Dip Simulation performed for forward flow with different density and
viscosity ratios between that of oil and water. 70 Strike Simulation performed in the forward and reverse directions to
observe the impact of increased mud drape coverage. 25 Dip Simulation performed to investigate the drainage process in the
forward and reverse directions. 70 Strike Simulation performed to investigate the drainage behaviour in the
forward and reverse directions.
For all flow simulations, the injectors as well as the producers were controlled using a constant bottom hole pressure of 250 bars and 10 bars respectively.

Simulation of Multiphase Flow in Models of Complex Tidal Heterogeneities 3
2.1. Grid Construction
The grid used for this study was constructed by Massart et al. (2011), who took into account the following considerations (Jackson et al. 2005) in order to represent the distribution of mudstone in the model as accurately as possible:
1. A corner-point grid geometry was used using model surfaces as controls for the grid architecture. 2. The mudstone and sandstone layers had been split into layers. These layers had different resolutions which ensured that
the mudstone layers would be as thin as possible as to make observations and without affecting the sandstone layers. This also ensured a fewer number of cells, and hence lowered the computation time.
3. Vertical pillars used to construct the grid were regularly placed in the dip and strike (horizontal) directions. The surfaces put a restriction on the number of layers in the vertical direction.
4. The model also consisted of pinch-out cells. They were made inactive (zero thickness) and non-neighbouring connections were used to incorporate these cells into the simulation.
The reason behind using corner-point gridding was to accurately represent the geological heterogeneity. Wadsley (1980)
and Goldthorpe & Chow (1985) pioneered the idea of corner-point gridding to be used in typical finite difference reservoir simulators to incorporate reservoir boundaries, faults, surfaces, horizontal wells and flow patterns. Corner-point grids are better than simple Cartesian grids as they require less computational time by avoiding the need for numerous small-sized grid cells. Faults, pinch-outs and discontinuities are captured better using a corner-point as opposed to a simple Cartesian grid (Ding & Lemonnier 1995).
Using the set of rules described above, Massart et al. (2011) constructed a corner point grid with 60 cells each in the 𝑖 and 𝑗 directions and 1600 cells in the 𝑘 direction with the total number of cells equalling 5760000, only 12% of which were active. This technique of constructing the grid was used in previous work (White & Barton 1998), and further developed for use in 3D modelling by Jackson et al. (2005). Figure 1 shows an illustration of the grid and its comparison with the outcrop.
A) B)
1m
Figure 1: 3D grid for flow simulation and its respective outcrop. The mud drapes (red lines at the bottom) have been positioned onto the foreset-‐toeset surfaces (in black). A) Cross-‐section along the dip direction. B) Cross-‐section along the strike direction.
1m
3m
3m
1m
3m
3m

Simulation of Multiphase Flow in Models of Complex Tidal Heterogeneities 4
One drawback of corner-point gridding is that the grid introduces artefacts in the solution of the flow simulation equations. The permeability tensor is non-diagonal owing to the lack of orthogonality in the grid. Furthermore, diagonal permeability tensors were assumed when solving the flow equations, which would lead to some errors occurring on the grid devised for this study (Wu & Parashkevov 2005). Previous literature (Ding & Lemonnier 1995; Peaceman 1996) has mentioned the errors due to non-orthogonality briefly, but there does not exist a standard method established to quantify this (Bagheri & Settari 2003). A method to analyse the errors in this study with respect to this grid is discussed later in this study. 2.2. Model Structure and Rock and Fluid Properties
The dimensions of the grid were 3m x 3m x 1m represented on 60 x 60 x 1600 cells. However, due to the nature of the
gridding, only about 12% cells were active. The pressure difference across the two faces along which the permeabilities are measured is a key variable in the
calculation. For the dip and strike directions, the opposite faces were assigned a high permeability buffer of 54 ×10! mD as calculated by (Talabi 2011) to ensure uniform distribution of the pressure along the face. On the other hand, the layers in the vertical direction were uneven, so two additional buffer layers were added on at the top and bottom. This changed the number of grid cells to 60 x 60 x 1602. These buffers simulate the effect of meshes used in standard core flood experiments.
Straight line relative permeabilities were input into the model to measure the single phase effective permeability. The capillary pressure was neglected in all the simulations.
For the majority of the simulations, the corey correlations (Zahoor et al. 2009) described in equations (1) and (2) were used. In this study, the critical and connate water saturations were identical and equal to 0.25.
𝑘!" = 0.8 !.!!!!!.!"
!…………………………………………………………………………..……………………………...(1)
𝑘!" = 0.3 !!!!.!"!.!"
!……………………………..……………………………………………………………………….....(2)
The rock and fluid properties have been summarised in Table 2.
Table 2: Rock and fluid properties
Property Value Sandstone permeability 77 mD Mudstone permeability 0 mD Oil density 1000 𝑘𝑔/𝑚! Water density 1000 𝑘𝑔/𝑚! Oil viscosity 0.31 cP Water viscosity 0.31 cP Rock porosity 0.3 Rock compressibility 1.45 ×10!! 𝑏𝑎𝑟!! Water compressibility 1 ×10!!" 𝑏𝑎𝑟!! Oil formation volume factor 1.0 rb/stb Water formation volume factor 1.0 rb/stb
The value of the rock compressibility ensured that the effects of rock property would have limited effect on the flow. In order to work in metric units, the model was scaled from 3m x 3m x 1m to 300m x 300m x 100m. The range of depth
assigned to the grid was from -50m to 50m with 0m in the middle. 2.3. Calculation of Effective Permeability and Relative Permeabilities
2.3.1. Single Phase Effective Permeability Calculation
The procedure applied to calculate the single phase absolute permeability is as follows: 1. The methodology used was similar to the one used by Warren & Price (1961). The model was fully saturated with water
and water was injected into one face of the model using injection wells and produced from the opposite face of the model using production wells. For the dip and strike directions, 60 injection wells and 60 production wells were positioned and

Simulation of Multiphase Flow in Models of Complex Tidal Heterogeneities 5
completed through all the 1600 vertical layers along the two faces respectively. For the analysis in the vertical direction, 100 wells were positioned at the top with completion applied to only the 1st layer and 100 wells were positioned at the bottom with completion applied to only the 1602nd layer.
2. The pressure at the injection face was measured by isolating that layer from the model and noting the pressure. This was repeated for the opposite i.e. production face.
3. The flow rate at steady state (when rate of injection = rate of production) was noted and with a simple application of Darcy’s law, the effective permeability in field units was then back-calculated in field units as shown in equation (3) (Dake 1983).
𝐾 = !! ! !∆!! ∆! !
…………………………………………………………………………………………………………………(3)
2.3.2. Multi-Phase Relative Permeability Calculation
The following procedure was used to calculate the multi-phase relative permeabilities for oil and water: 1. The respective sandstone relative permeability curves were input into the model. 2. In order to obtain the two-phase relative permeabilities, a mixture of oil and water was injected. This was done by
injecting different proportions of oil and water in order to vary the in place water saturation. 3. Each simulation was run until steady state was achieved i.e. when the injection rates of both fluids were equal to their
respective production rates. The pressures were obtained using the same method as described in the previous section. 4. The modified version of Darcy’s law incorporating two-phase flow was used to calculate the relative permeabilities in
field units for water and oil as shown in equations (4) and (5) respectively (Dake 1983).
𝑘!" =!! ! !∆!! ∆! ! !
……………………………………………………………………………………………………………......(4)
𝑘!" =!! ! !∆!! ∆! ! !
……………………………………………………………………………………………………………….(5)
5. The final step of the procedure was to determine the average saturation in the model upon reaching steady state. This
was calculated using the fluids in place for the sandstone cells as defined in equation (6).
𝑆! =!"#
!"#!!"#………………………………………………………………………………………………………………..(6)
Mudstones are porous and are water saturated. They do not contain oil because the pressure required to force oil into the very small pores is greater than that available from buoyancy forces resulting from the density contrast between oil and water. It was important to filter out the mudstone cells by applying a permeability filter when calculating the average water saturation. This is because mudstone cells are impermeable. 3. Results 3.1. Single Phase Effective Permeabilities
Using the methodology described in the previous section, the single phase effective permeability was calculated for the
models. These have been tabulated in Table 3 below:
Table 3: Single phase effective permeability results for the different models used.
Model Effective Permeability (mD) 25% mud drape, dip direction 5.22
25% mud drape, vertical direction 49.14 25% mud drape, dip direction 26.42
25% mud drape, strike direction 54.77 25% mud drape, vertical direction 2.25
25% mud drape, strike direction reverse 55.24 70% mud drape, strike direction 44.80
70% mud drape, strike direction reverse 44.80

Simulation of Multiphase Flow in Models of Complex Tidal Heterogeneities 6
These results matched well with previous studies (Petto 2012; Hou 2012).
3.2. Multi-phase Simulation Model
The multi-phase simulation was performed for 3000 days for the strike and dip directions and 5000 days for the vertical direction. This ensured steady state was reached when performing the permeability calculation. Figure 2 shows raw results for the injection face pressure, production face pressure, field pressure, pressure difference and liquid flow rates for a sample case of imbibition in the dip direction with 25% mud drape coverage with water injected fraction of 0.1. Figure 3 shows the cross section in the dip direction of the same case demonstrating the sweep at steady state. The regions with low water saturation indicate the trapping of oil. The average water saturation measured at steady-state in this case was 0.42. Note that the flow is from left to right.
A)
B)
Figure 2: A) Variation of injection and production face pressures, average field pressure and pressure difference across the injection and production faces with time. B) Variation of both oil and water injection and production rates with time.

Simulation of Multiphase Flow in Models of Complex Tidal Heterogeneities 7
3.3. Gridding Error
In order to estimate the errors owing to the corner-point grid geometry, the experiment was conducted on a 100%
sandstone model in the horizontal (dip) and vertical directions using both a corner-point grid as well as a Cartesian grid as shown in Figure 4.
Figure 4: A) Flow in the horizontal direction. B) Flow in the vertical direction.
Figure 3: Cross section showing sweeping of oil using a mixture of oil and water.
A)
B)

Simulation of Multiphase Flow in Models of Complex Tidal Heterogeneities 8
It can be seen that in the vertical direction, both the Cartesian as well as the corner-point grid match perfectly onto the original relative permeability curves, indicating no errors. However, in the horizontal direction, neither the Cartesian nor the corner-point grid matches the original relative permeability curves. The difference in results using the corner-point grid and the original relative permeability curve is an indication of the gridding error. This error was plotted as a function of the water saturation and curve-fitted as shows in Figure 5 below.
Figure 5: Errors in oil and water relative permeabilities in the horizontal direction as a function of water saturation.
Equations (7) and (8) below define the relationship between kro error and Sw and krw error and Sw. These error functions were used to plot the error bars in the succeeding analysis for the horizontal (dip and strike) directions.
𝑘!"𝑒𝑟𝑟𝑜𝑟 = −1.6231 𝑆! ! + 3.2233 𝑆! ! − 1.927 𝑆! + 0.3085……………..............................................................(7)
𝑘!"𝑒𝑟𝑟𝑜𝑟 = 0.1191 𝑆! ! − 0.1371 𝑆! + 0.0275…………….........................................................................................(8)
3.4. Relative Permeability Results
Figures 6 to 12 show the relative permeability curves plotted against the water saturation for the respective cases mentioned in Table 1. The original relative permeability points are joined together using smooth curves/straight lines. The calculated relative permeabilities are shown as discrete data points. 3.4.1. Straight Line Relative Permeabilities
Figure 6 shows that the calculated straight line oil and water relative permeabilities in the dip direction for the 25% mud
drape coverage sit perfectly onto the original lines. A slight deviation of the calculated relative permeabilities from the original curves is observed when using non-linear relative permeabilities.
Figure 6: Comparison between straight line and curved relative permeabilities.

Simulation of Multiphase Flow in Models of Complex Tidal Heterogeneities 9
3.4.2. Directional Impact
The plots in Figure 7 indicate that most oil is trapped in the vertical direction, followed by dip and strike directions with 25% mud drape coverage. This is shown in 2-D cross sections illustrating the steady-state average oil saturation for the three directions at fw=1. Note that the flow is from left to right in the dip and strike directions, and top to bottom in the vertical direction.
Figure 7: A) Relative permeability plots with 25% mud drape coverage. Cross sections for B) Dip, C) Strike and D) Vertical directions.
A)
B)
C)
D)
Simulation of Multiphase Flow in Models of Complex Tidal Heterogeneities 10
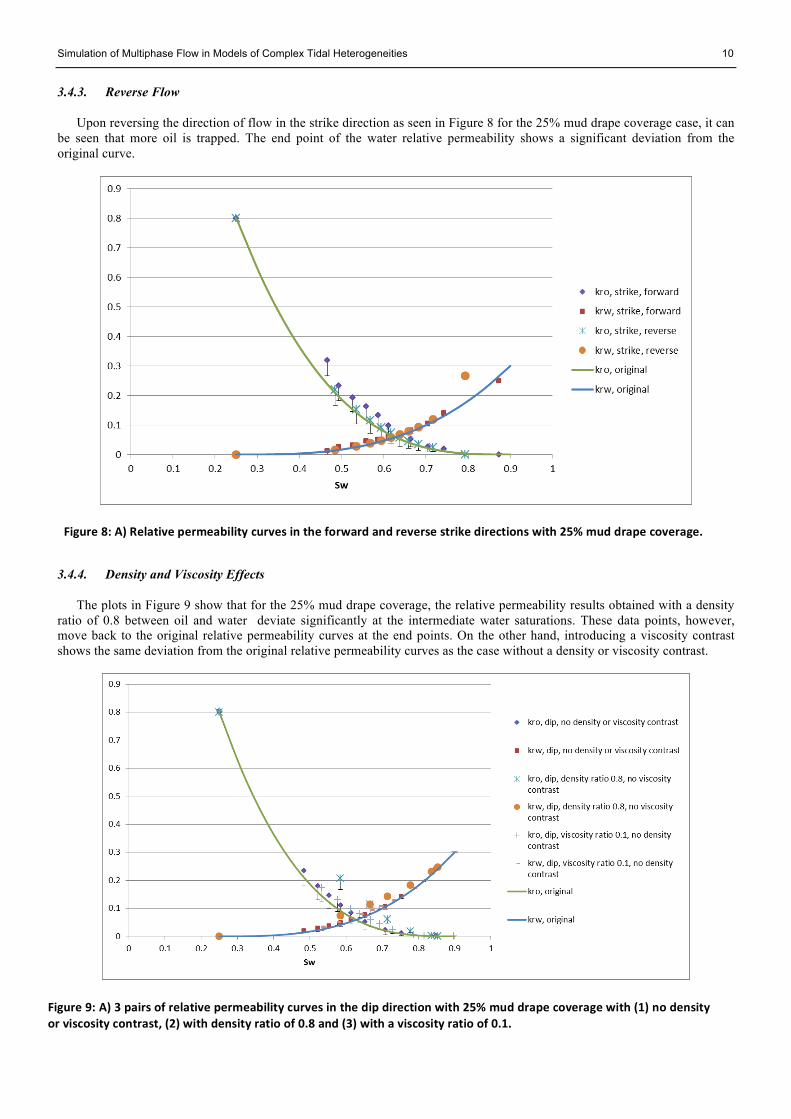
3.4.3. Reverse Flow Upon reversing the direction of flow in the strike direction as seen in Figure 8 for the 25% mud drape coverage case, it can
be seen that more oil is trapped. The end point of the water relative permeability shows a significant deviation from the original curve.
3.4.4. Density and Viscosity Effects The plots in Figure 9 show that for the 25% mud drape coverage, the relative permeability results obtained with a density
ratio of 0.8 between oil and water deviate significantly at the intermediate water saturations. These data points, however, move back to the original relative permeability curves at the end points. On the other hand, introducing a viscosity contrast shows the same deviation from the original relative permeability curves as the case without a density or viscosity contrast.
Figure 8: A) Relative permeability curves in the forward and reverse strike directions with 25% mud drape coverage.
Figure 9: A) 3 pairs of relative permeability curves in the dip direction with 25% mud drape coverage with (1) no density or viscosity contrast, (2) with density ratio of 0.8 and (3) with a viscosity ratio of 0.1.

Simulation of Multiphase Flow in Models of Complex Tidal Heterogeneities 11
3.4.5. Increased Mud Drape Coverage and Reverse Flow The plots in Figure 10 show that the relative permeability data points for oil in the strike direction show a decrease upon
increasing the mud drape coverage, indicating an increased trapping of oil. Reversing the direction of flow in the strike direction for the same mud drape coverage case also does the same. Both, forward and reverse directions show a similar trend for the water relative permeability. The end point of the water relative permeability upon increasing the mud drape coverage shifts further away from the original curve.
Figure 10: Relative permeability plots for forward and reverse flow in the strike direction for 70% and 25% mud drape coverage cases.
3.5. Irreducible Oil Saturation
Figure 11 illustrates a comparison using bar charts of the irreducible oil saturation for the different cases. The irreducible oil saturation is greatest for the vertical direction followed by the dip direction, followed by the strike direction for the 25% mud drape coverage case. The impact of higher mud drape coverage is to increase the irreducible oil saturation as seen in the analysis for the 25% and 70% mud drape coverage in the strike direction. Both forward and reverse strike directions yield the same irreducible oil saturation for the 70% mud drape coverage case. However, this trend is not noticed in the 25% mud drape coverage case in which the irreducible oil saturation is lower in the forward strike direction than in the reverse strike direction. There is a slight decrease in the irreducible oil saturation in the dip direction for the 25% mud drape coverage case upon introducing a density contrast. The difference is more significant upon introducing a viscosity contrast.
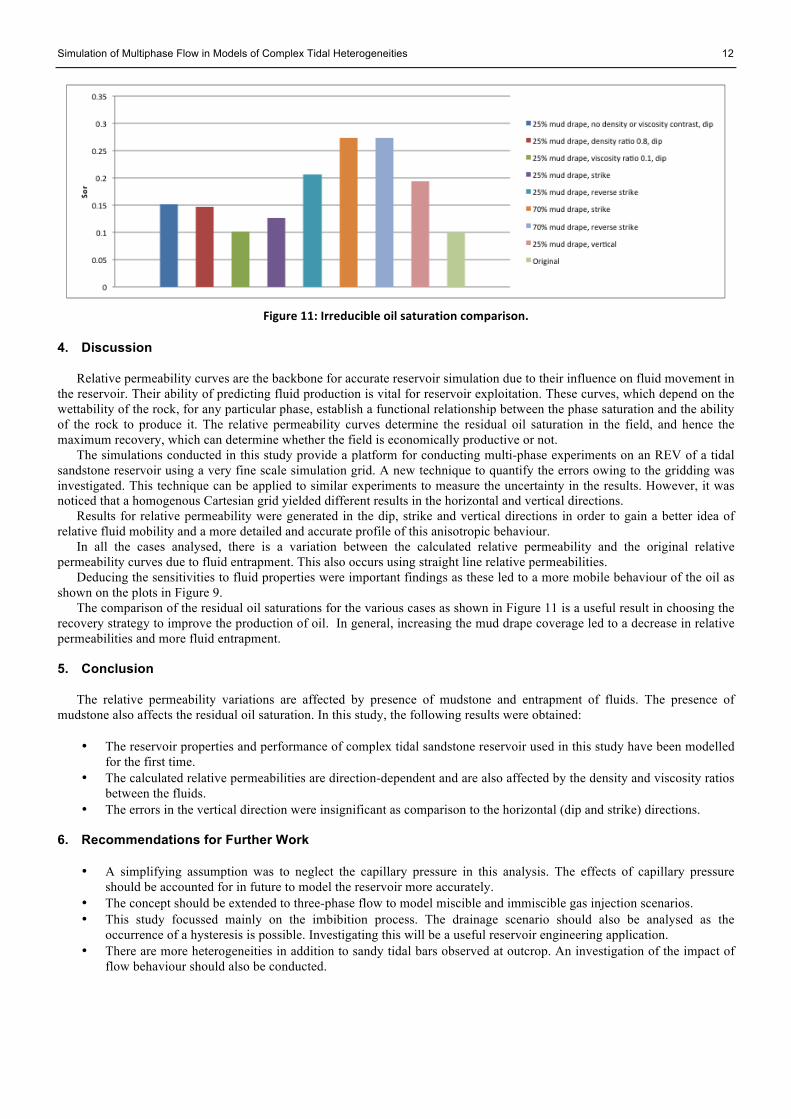
Simulation of Multiphase Flow in Models of Complex Tidal Heterogeneities 12
Figure 11: Irreducible oil saturation comparison.
4. Discussion
Relative permeability curves are the backbone for accurate reservoir simulation due to their influence on fluid movement in the reservoir. Their ability of predicting fluid production is vital for reservoir exploitation. These curves, which depend on the wettability of the rock, for any particular phase, establish a functional relationship between the phase saturation and the ability of the rock to produce it. The relative permeability curves determine the residual oil saturation in the field, and hence the maximum recovery, which can determine whether the field is economically productive or not.
The simulations conducted in this study provide a platform for conducting multi-phase experiments on an REV of a tidal sandstone reservoir using a very fine scale simulation grid. A new technique to quantify the errors owing to the gridding was investigated. This technique can be applied to similar experiments to measure the uncertainty in the results. However, it was noticed that a homogenous Cartesian grid yielded different results in the horizontal and vertical directions.
Results for relative permeability were generated in the dip, strike and vertical directions in order to gain a better idea of relative fluid mobility and a more detailed and accurate profile of this anisotropic behaviour.
In all the cases analysed, there is a variation between the calculated relative permeability and the original relative permeability curves due to fluid entrapment. This also occurs using straight line relative permeabilities.
Deducing the sensitivities to fluid properties were important findings as these led to a more mobile behaviour of the oil as shown on the plots in Figure 9.
The comparison of the residual oil saturations for the various cases as shown in Figure 11 is a useful result in choosing the recovery strategy to improve the production of oil. In general, increasing the mud drape coverage led to a decrease in relative permeabilities and more fluid entrapment.
5. Conclusion
The relative permeability variations are affected by presence of mudstone and entrapment of fluids. The presence of mudstone also affects the residual oil saturation. In this study, the following results were obtained:
• The reservoir properties and performance of complex tidal sandstone reservoir used in this study have been modelled
for the first time. • The calculated relative permeabilities are direction-dependent and are also affected by the density and viscosity ratios
between the fluids. • The errors in the vertical direction were insignificant as comparison to the horizontal (dip and strike) directions.
6. Recommendations for Further Work
• A simplifying assumption was to neglect the capillary pressure in this analysis. The effects of capillary pressure should be accounted for in future to model the reservoir more accurately.
• The concept should be extended to three-phase flow to model miscible and immiscible gas injection scenarios. • This study focussed mainly on the imbibition process. The drainage scenario should also be analysed as the
occurrence of a hysteresis is possible. Investigating this will be a useful reservoir engineering application. • There are more heterogeneities in addition to sandy tidal bars observed at outcrop. An investigation of the impact of
flow behaviour should also be conducted.

Simulation of Multiphase Flow in Models of Complex Tidal Heterogeneities 13
7. Nomenclature A Cross sectional area of flow (𝑚!) C Conversion factor of 10!"to obtain single-phase effective permeability in field units. D Conversion factor of 0.00864 to obtain relative permeabilities in field units. ∆L Distance the fluid travels (m) ∆P Pressure drop across the face (bar) Fw Injected water fraction i Grid block number in the dip direction j Grid block number in the strike direction k Grid block number in the vertical direction K Effective permeability (mD) 𝑘!" Oil relative permeability 𝑘!" Water relative permeability 𝜇! Oil viscosity (cP) 𝜇! Water viscosity (cP) OIP Oil In Place (𝑚!) 𝑞! Oil flow rate (𝑚!/𝑑𝑎𝑦) 𝑞! Water flow rate (𝑚!/𝑑𝑎𝑦) REA Representative Elementary Area REV Representative Elementary Volume So Oil saturation Sor Irreducible oil saturation Sw Water saturation Swc Connate water saturation WIP Water in place (𝑚!) 8. References Bagheri, M. & Settari, A., 2003. Methods for Modelling Full Tensor Permeability in Reservoir Simulators. In Proceedings of Canadian
International Petroleum Conference. Society of Petroleum Engineers. Bear, J., 1972. Dynamics of Fluids in Porous Media, New York: Elsevier. Brandsaeter, I. et al., 2005. Reservoir modelling and simulation of Lajas Formation outcrops (Argentina) to constrain tidal reservoirs of the
Halten Terrace (Norway). Petroleum Geoscience, 11(1), pp.37–46. Corbett, P.W.M. & Jensen, J.L., 1993. Application of probe permeametry to the prediction of two-phase flow performance in laminated
sandstones (lower Brent Group, North Sea). Marine and Petroleum Geology, p.335. Dake, L.P., 1983. Fundamentals of Reservoir Engineering, Elsevier. DeBaun, D. et al., 2005. An Extensible Architecture for Next Generation Scalable Parallel Reservoir Simulation. In Proceedings of SPE
Reservoir Simulation Symposium. Society of Petroleum Engineers. Ding, Y. & Lemonnier, P., 1995. Use of Corner Point Geometry in Reservoir Simulation. In Proceedings of International Meeting on
Petroleum Engineering. Society of Petroleum Engineers. Goldthorpe, W.H. & Chow, Y.S., 1985. Unconventional Modelling of Faulted Reservoirs: A Case Study. In Proceedings of SPE Reservoir
Simulation Symposium. Society of Petroleum Engineers. Hou, R., 2012. Deriving single-phase effective flow properties in complex tidal sandstone reservoirs. Imperial College London. Jackson, M.D. et al., 2005. Three-dimensional reservoir characterization and flow simulation of heterolithic tidal sandstones. AAPG Bulletin,
89(4), pp.507–528. Jackson, M.D. et al., 2003. Upscaling Permeability Measurements Within Complex Heterolithic Tidal Sandstones. Mathematical Geology,
35(5), pp.499–520. Johnson, E.F., Bossler, D.P. & Naumann, V.O., 1959. Calculation of Relative Permeability from Displacement Experiments. Society of
Petroleum Engineers Journal, 216, p.370. Martinius, A.W. et al., 2005. Reservoir challenges of heterolithic tidal sandstone reservoirs in the Halten Terrace , mid-Norway. , (1996). Martinius, A.W. et al., 2001. Sedimentology of heterolithic and tide-dominated tilje formation (Early Jurassic, Halten Terrace, Offshore
Mid-Norway). Norwegian Petroleum Society Special Publications, 10, pp.103–144. Massart, B. et al., 2011. Three-dimensional Characterization and Surface-based Modeling of Tide-dominated Heterolithic Sandstones. EAGE
Conference & Exhibition, (May 2011), pp.23–26. Nio, S.-D. & Yang, C.S., 2001. Diagnostic attributes of clastic tidal deposits: a review. Nordahl, K., Ringrose, P.S. & Wen, R., 2005. Petrophysical characterization of a heterolithic tidal reservoir interval using a process-based
modelling tool. Petroleum Geoscience, 11(1), pp.17–28. Norris, R.J. & Lewis, J.J.M., 1991. The geological modeling of effective permeability in complex heterolithic facies. SPE Annual Technical
Conference and Exhibition.

Simulation of Multiphase Flow in Models of Complex Tidal Heterogeneities 14
Oost, A.P. & Baas, J.H., 1994. The development of small scale bedforms in tidal environments: an empirical model for unsteady flow and its applications. Sedimentology, 41(5), pp.883–903.
Peaceman, D.W., 1996. Calculation of Transmissibilities of Gridblocks Defined by Arbitrary Corner Point Geometry. SPE. Petto, K., 2012. Impact of heterogeneity on production in tidal sandstone reservoirs - Simulation study. Imperial College London. Reineck, H.-E. & Wunderlich, F., 1968. Classification and Origin of Flaser and Lenticular Bedding. Sedimentology, 11(1-2), pp.99–104. Renard, P. & de Marsily, G., 1997. Calculating equivalent permeability: a review. Advances in Water Resources, 20(5-6), pp.253–278. Ringrose, P., Erik, S. & Carsten, E., 2003. Permeability Estimation Functions Based on Forward Modeling of Sedimentary Heterogeneity. In
Proceedings of SPE Annual Technical Conference and Exhibition. Society of Petroleum Engineers. Ringrose, P., Nordahl, K. & Wen, R., 2005. Vertical permeability estimation in heterolithic tidal deltaic sandstones. Petroleum Geoscience,
11(1), pp.29–36. Sech, R.P., Jackson, M.D. & Hampson, G.J., 2009. Three-dimensional modeling of a shoreface-shelf parasequence reservoir analog: Part 1.
Surface-based modeling to capture high-resolution facies architecture. AAPG Bulletin, 93(9), pp.1155–1181. Talabi, O.A., 2011. Impact of Heterogeneity on Production in Tidal Sandstone Reservoirs: Application to the Linnorm Field, Offshore
Norway. Imperial Collehe London. Wadsley, W. a., 1980. Modelling Reservoir Geometry with Non-rectangular Coordinate Grids. In Proceedings of SPE Annual Technical
Conference and Exhibition. Society of Petroleum Engineers. Warren, J.E. & Price, H.S., 1961. Flow in Heterogeneous Porous Media. Society of Petroleum Engineers Journal, 1(3). White, C.D. & Barton, M.D., 1998. Comparison of the Recovery on Contrasting Reservoir Analogs in the Ferron Sandstone Using Outcrop
Studies and Numerical Simulation, Wu, X.H. & Parashkevov, R.R., 2005. Effect of Grid Deviation on Flow Solutions. In Proceedings of SPE Reservoir Simulation Symposium.
Society of Petroleum Engineers. Zahoor, M.K., Derahman, M.N. & Yunan, M.H., 2009. Implementation of Brooks and Corey Correlation in Water Wet Case - With
Immobile Wetting Phase. , 60, pp.435–437.

Simulation of Multiphase Flow in Models of Complex Tidal Heterogeneities 15
Appendices

Simulation of Multiphase Flow in Models of Complex Tidal Heterogeneities 16
Appendix A – Literature Reviews SPE Journal, (1961) 1579-G. Flow in heterogenous porous media Authors: Warren, J. E., and Price, H. S. Contribution: Established techniques to measure single phase effective permeability. Methodology: Flow simulation of random heterogeneities consists of a 3-D arrangement of porous blocks. The elements in the box are allocated permeabilities conforming to a specific distribution function and anisotropy. The single-phase version of Darcy’s law was used to calculate the effective permeability between two surfaces at stead state. Conclusions: Core and well test data are sufficient to accurately represent the properties of the reservoir. Comments: Core and well test data are useful, but not entirely sufficient to represent the properties of the reservoir regardless of the number of measurements taken.

Simulation of Multiphase Flow in Models of Complex Tidal Heterogeneities 17
SPE Journal, (1961) 1579-G. Modelling Reservoir Geometry with Non-Rectangular Coordinate Grids Authors: Wadsley, W. A. Contribution: Describes a method of using non-orthogonal grid block model to investigate heterogeneity and presents the advantages of using these grids. Methodology: Curvilinear systems were used to derive finite difference equations applicable to non-rectangular grids. Conclusions: Corner point grids are beneficial when:
1. The reservoir has a fault or irregular boundaries; 2. The reservoir is anisotropic.
Comments: Describes the corner point gridding system well, but does not provide adequate information on errors due to non-orthogonality.

Simulation of Multiphase Flow in Models of Complex Tidal Heterogeneities 18
SPE Journal, (1991) 22692 The Geological Modelling of Effective Permeability in Complex Heterolithic Facies. Authors: Norris, R.J. and Lewis, J.J.M. Contribution: Discusses a new technique for quantifying single phase effective permeabilities using REVs. Methodology: A new approach described in detail to construct an REA using REV. Conclusions:
1. Standard geostatistical approaches are not valid for defining spatial permeability variation. 2. Effective permeability is dependent on sand connectivity.
Comments: Provides a good insight in to the REV technique and its impact on relative permeability.

Simulation of Multiphase Flow in Models of Complex Tidal Heterogeneities 19
SPE Journal, (1995) 29933 Use of Corner Point Geometry in Reservoir Simulation Authors: Ding, Y. and Lemonnier, P. Contribution: Describes corner point geometry and its applications from various control volume type approximations. Methodology: Different numerical methods appropriate for corner point geometry modelling were considered. Conclusions: For multi-phase flow, the flow correction scheme is more accurate than the pressure correction scheme. Comments: Provides a good description of corner point geometry, but does not describe errors due to non-orthogonality.

Simulation of Multiphase Flow in Models of Complex Tidal Heterogeneities 20
Mathematical Geology (2003), Vol. 35 Upscaling permeability measurements within complex heterolithic tidal sandstones Authors: Jackson, M.D., Muggeridge, A.H., Yoshida, S., and Johnson, H. D. Contribution: Examined the effects of sample size on the effective permeabilities of heterolithic tidal sandstones and deduced that these permeabilities vary with the sample volume. Methodology: Permeability calculations were conducted on a large rock sample, which was then sliced. The main body rock was used to model the rock structure and simulation experiments were then conducted on the grid. Conclusions: It was deduced that core plug measurements would not be representative at the reservoir grid block scale. Comments: Contradicts the outcomes described by Warren and Prince (1961).

Simulation of Multiphase Flow in Models of Complex Tidal Heterogeneities 21
SPE Journal, (2005) 93274. An Extensible Architecture for Next Generation Scalable Parallel Reservoir Simulation Authors: DeBaun, D., Byer T., Childs, P., Chen, J., Wells, M., Liu, J., Cao, H., Pianelo, L., Tilakraj, V., Crumpton, P., Walsh, D., Yardumian, H., Zorzynski, R., Lim, K.-T., Schrader, M., Zapata, V., Nolen, J., and Tchelepi, H. Contribution: Provide useful insight into how INTERSECT functions and how it comes with capabilities superior than other simulators. Methodology: The simulator is based on an unstructured graph topology that can accommodate a fully unstructured grid. It was designed to suit well when run in parallel. Conclusions: The simulator provides huge gains in parallel scalability and also reduces the CPU time. Comments: INTERSECT was the reservoir simulation software used to simulate multi-phase flow in models of complex tidal heterogeneities.

Simulation of Multiphase Flow in Models of Complex Tidal Heterogeneities 22
Paper presented at the 2011 EAGE conference, Vienna, May. Three-dimensional Characterisation and Surface-based Modelling of Tide-Dominated Heterolithic Sandstones Authors: Massart B. Y. G. et al. Contribution: Describes the in-depth detail of construction of the reservoir model used in this study. Methodology: The high resolution 3-D model of sandy tidal bar deposits was constructed using surface based modelling from outcrop measurements of Dir Abu Lifa member (Western Desert, Egypt). Conclusions: Data was extracted from different localities to reconstruct heterogeneity-defining surfaces. Ellipsoids were chosen as building volumes to match the elliptical erosive bases of the cross-bed sets and a generic function was obtained to model the geometry of the foresets and reconstruct their curvature. A mud frequency function was also used to reproduce the mud drape distribution along the foresets. Comments: At the time, this was the largest scale model of heterolithic sandstone created to obtain flow behaviour.

Simulation of Multiphase Flow in Models of Complex Tidal Heterogeneities 23
Appendix B – Milestones Table
Paper Year Title Author(s) Contribution SPE 1579-G 1961 “Flow in heterogenous porous
media” Warren, J. E., and Price H.S.
Establishes techniques to measure single phase effective permeability.
SPE 9369 1980 “Modelling Reservoir Geometry with Non-Rectangular Coordinate Grids”
Wadsley, W. A. Describes a method for using a non-orthogonal grid block model to investigate heterogeneity and presents the advantages of using these grids.
SPE 22692 1991 “The Geological Modelling of Effective Permeability in Complex Heterolithic Facies”
Norris, R. J., amd Lewis, J. J. M.
Discusses a new technique for quantifying single phase effective permeabilities using REVs.
SPE 29933 1995 “Use of Corner Point Geometry in Reservoir Simulation”
Ding, Y., and Lemonnier, P.
Describes corner point geometry and its application range from various control volume type approximations.
Mathematical Geology 35
2003 “Upscaling permeability measurements within complex heterolithic tidal sandstones”
Jackson, M.D., Muggeridge, A. H., Yoshida, S., and Johnson, H. D.
Examines the effects of sample size on the effective permeabilities of heterolithic tidal sandstones and deduced that these permeabilities vary with the sample volume.
SPE 93274 2005 “An Extensible Architecture for Next Generation Scalable Parallel Reservoir Simulation”
DeBaun, D., Byer T., Childs, P., Chen, J., Wells, M., Liu, J., Cao, H., Pianelo, L., Tilakraj, V., Crumpton, P., Walsh, D., Yardumian, H., Zorzynski, R., Lim, K.-T., Schrader, M., Zapata, V., Nolen, J., and Tchelepi, H.
Provide useful insight as to how INTERSECT functions and how it comes with capabilities superior than other simulators.
Paper presented at the 2011 EAGE conference, Vienna, May
2011 “Three-dimensional Characterization and Surface-based Modelling of Tide-dominated Heterolithic Sandstones”
Massart, B. Y. G. Describes the in-depth detail of construction of the reservoir model used in this study.