simulation of hot forming processes: using cost effective micro-structural constitutive models
TRANSCRIPT

Author's Accepted Manuscript
Simulation of hot forming processes, usingcost effective micro-structural constitutiveModels
Reza Jafari Nedoushan, Mahmoud Farzin, DorelBanabic
PII: S0020-7403(14)00169-6DOI: http://dx.doi.org/10.1016/j.ijmecsci.2014.04.026Reference: MS2720
To appear in: International Journal of Mechanical Sciences
Received date: 22 April 2012Revised date: 27 December 2012Accepted date: 26 April 2014
Cite this article as: Reza Jafari Nedoushan, Mahmoud Farzin, Dorel Banabic,Simulation of hot forming processes, using cost effective micro-structuralconstitutive Models, International Journal of Mechanical Sciences, http://dx.doi.org/10.1016/j.ijmecsci.2014.04.026
This is a PDF file of an unedited manuscript that has been accepted forpublication. As a service to our customers we are providing this early version ofthe manuscript. The manuscript will undergo copyediting, typesetting, andreview of the resulting galley proof before it is published in its final citable form.Please note that during the production process errors may be discovered whichcould affect the content, and all legal disclaimers that apply to the journalpertain.
www.elsevier.com/locate/ijmecsci

1
Simulation of Hot Forming Processes, Using Cost Effective
Micro-Structural Constitutive Models
Reza Jafari Nedoushana, Mahmoud Farzina, Dorel Banabicb
a Department of Mechanical Engineering, Isfahan University of Technology, Isfahan, 84156 Iran
b CERTETA Research Centre, Technical University of Cluj-Napoca, 28 Memorandumului, 400114 Cluj-Napoca, Romania
Abstract Constitutive models for dominant mechanisms in hot forming are proposed. These models
consider inter-granular deformation, grain boundary sliding, grain boundary diffusion and grain
growth. New stress-strain rate relationships are proposed to predict deformation due to grain
boundary sliding and grain boundary diffusion. Besides a Taylor type polycrystalline constitutive
model, a visco-plastic relation in conjunction with two different yield functions is used to predict
inter-granular deformation. Step strain rate tests and bulge forming test are simulated with the
proposed models. Results are compared with experimental data to verify the constitutive models.
It is concluded that the visco-plastic models can predict material behavior in hot deformations as
accurately as the polycrystalline model but with much less computational costs. To examine the
hardening effects, the model is calibrated with tensile test data of AA5083 at550 C , where
hardening is remarkable. Then, as an example, it is used to simulate a tray forming experiment.
Dome heights and tray thicknesses at various positions during forming process are very close to
experimental observations.
Keywords: Hot metal forming; Constitutive equations; Grain boundary mechanisms, Grain
growth hardening.
2
1. Introduction Sheet metal components with complex shapes can be made at elevated temperatures by
superplastic forming (SPF) and quick plastic forming (QPF). Finite element simulation has
reduced the number of trial forming experiments in these processes. The accuracy of a
constitutive model is currently the most significant issue to achieve useful predictions in FE
simulations of these processes.
The microstructure of a hot formed metal differs strikingly from that of a part formed at room
temperature. The difference is more evident in superplastic forming, and the deformation
mechanisms differ substantially from cold forming [1]. Several mechanisms may play some roles
in hot forming including dislocation movement inside grains, grain boundary sliding, grain
boundary diffusion, and grain boundary migration. Various micro-structural constitutive models
were proposed for better understanding of these mechanisms and/or exact prediction of material
behavior [1-5]. Contributions of grain boundary sliding and grain boundary diffusion in total
deformation have been considered by many researchers [1, 3, 6-10].
Some researchers investigated grain growth during hot deformation [11-16] and a few models
were also proposed to predict grain growth [14, 15, 17-19]. These models have been numerously
used in simulations of superplastic forming [20-23].
The previous works on hot forming constitutive equations can be generally classified into two
groups:
a. Macro constitutive equations that can be used at every material point to predict material
macro behavior in complex processes [23, 24]. Norton Half behavior is an example of
these constitutive models [25]. These types of constitutive models that include material
dependency of strain rate and grain size are applicable for limited conditions of forming.
For example some of these relations can explain material constitutive behavior when
logarithmic scale of stress and strain rate diagram is a straight line. Some other relations
can only be used for certain grain sizes that material shows superplastic behavior.
b. Micro constitutive models that consider micro-structure of material for better
understanding of deformation mechanisms [2-5]. This group can predict material
behavior in various microstructures and strain rates after calibration with fewer
experiments. However these micro-constitutive models cannot directly be used in

3
simulation of complicated processes due to high computational costs and usually a multi-
scale modeling is required for this purpose [26].
The aim of the current work is to propose micro constitutive models that can be calibrated with a
few experiments, the same as group (b) but can be directly used to predict material behavior in
macro scale simulation of complicated processes, the same as group (a). These models are
expected to properly predict material behavior for a vast range of grain sizes, strain rates and
strains similar to group (b) but with much less computational costs.
To prepare the models in this paper, material deformation is divided in to two sections: inter-
granular and grain boundary mechanisms. Grain boundary mechanisms include: grain boundary
sliding (GBS), grain boundary diffusion (GBD) and grain growth. New micro constitutive
relationships are proposed for GBS and GBD that correlate macro stresses to strain rates. These
relationships have been previously verified for various strain rates, grain sizes and stress states
[27] but grain growth and consequent hardening were not considered in these relationships. In
the other words in this model dependency of material on strain is ignored. To add this missing
part to these relationships a grain growth model that was proposed by Kim et al [17] is also used
beside these relationships to consider grain size evolution under deformation.
Besides the above mentioned boundary mechanisms, inter-granular deformation is also predicted
by three different approaches I: the Taylor type polycrystalline approach, II: Von-Mises
viscoplastic model and III: J2-J3 viscoplastic model.
It should be mentioned that initial texture or texture development during deformation causes
material anisotropic behavior in cold forming [28-30]. The Taylor type polycrystalline approach
is widely used to predict macro material behavior in cold forming processes especially when
material anisotropy due to material texture is a crucial issue [31-36]. In hot forming, especially
superplastic forming in contrast with cold forming, texture will reduce as the material undergoes
deformation [1] and in this work it is supposed that material have an isotropic behavior. The two
above mentioned macro viscoplastic models are proposed to have the same behavior with the
Taylor type polycrystalline model without considering texture for various strain rates and stress
states, but with much less computational costs. The above mentioned models are compared with
each other in different simulations. The remainder of this paper is organized as follows: At first,
assumptions and governing equations are listed for the mechanisms and models. Then step strain
rate tests and gas pressure forming are simulated to show the ability and limitations of the
4
various models. Finally, one of the viscoplastic models is used in the circumstances that grain
growth has a significant role. For this purpose, the model is calibrated with tensile test data at
different strain rates and then the model is used to simulate gas pressure tray forming.
In summary it will be shown that the proposed boundary micro-constitutive models in
conjunction with inter-granular viscoplastic models can be used in various hot forming
conditions such as temperatures, strain rates, strains and stress states in a very cost effective and
accurate manner.
2. Model description In the proposed model a material point is visualized as a representative of grains and their
boundaries. So the macroscopic deformation is a result of inter-granular deformation caused by
dislocations creep, GBS and GBD, at that point:
CR GBS GBD
ij ij ij ijL L L L= + + (1)
where ijL denotes the total velocity gradient tensor; CRijL is the velocity gradient due to inter-
granular deformation; GBSijL is the velocity gradient due to GBS;
GBDijL is the GBD velocity
gradient. 2.1 Inter-granular deformation
At first, a standard crystal plasticity model with the Taylor type polycrystalline approach is used
to approximate the response of material within the grains. Then a viscoplastic relation in
conjunction with two suitable yield functions is proposed to be substituted and compared with
Taylor type polycrystalline model. Here the objective is to find a cost effective and accurate
constitutive model which represents the inter-granular material behavior.
2.1.1 Polycrystalline constitutive model
The crystal plasticity model, used in this work employs the framework of classical crystal
plasticity by Peirce and Asaro [37, 38] and Asaro [39, 40]. Implementation of this model is based

5
on the user-material routine (UMAT) of Huang [41] in the environment of ABAQUS finite
element code. In this paper, the grains are all face-centered cubic (FCC) crystals, with twelve (1
1 1) [1 1 0] slip systems.
The velocity gradient tensor is decomposed into elastic and plastic parts as:
ij
CR e pij ijL L L= +
(2)
The symmetric and anti-symmetric parts of velocity gradient tensor can also be decomposed into
elastic and plastic parts:
CR e pij ij ijD D D= +
CR e p
ij ij ijW W W= +
(3-1)
(3-2)
Note that eijD is related to stress rate through the usual linear elastic constitutive equations. p
ijD
and pijW are computed by summing the shearing rates of the active slip systems:
1
1
1 ( )21 ( )2
NPij i j j i
NP
ij i j j i
D s m s m
W s m s m
α α α α α
α
α α α α α
α
γ
γ
=
=
= +
= −
∑
∑
(4-1)
(4-2)
where isα and imα denote, the components of unit vectors parallel to the slip direction and slip
plane normal respectively, and αγ is the shear rate on slip system α and is computed from:
00
( ) cnα
α α τγ γτ
=
(5)
here, 0αγ is a characteristic slip rate; k is the stress exponent of the slip system; and 0τ is
characteristic flow strength. Hardening is neglected in inter-granular computations and 0τ is
assumed to be constant. ατ is the resolved shear stress on the slip system α . For polycrystalline materials, a material point can be visualized as a multitude of single crystals,
and the constitutive response at this material point is taken as a suitable average of the
constitutive response of the individual crystals comprising this representative point. In the
present work, the Taylor type model [42] is used to calculate the crystal or inter-granular

6
deformation. In this model the deformation in each grain is taken to be identical to the
macroscopic deformation of the continuum. Furthermore, the macroscopic values of all
quantities, such as stresses, stress rates and elastic modules, are obtained by averaging their
respective values over grains with random orientations at that particular material point.
2.1.2 Viscoplastic models
In this section two viscoplastic constitutive models are used which represent the same inter-
granular deformation as polycrystalline model with the objective of reducing computational
costs. These models are defined to predict the same behavior as polycrystalline materials in
various strain rates and stress states.
a. Strain rate
To investigate effect of strain rate in FCC polycrystalline material, various strain rates are
applied to this material in simple tension. The simple tension is modeled in ABAQUS FEM code
as discussed in Ref. [27]. It should be emphasized that grain boundary mechanisms are ignored
here and only inter-granular deformation is considered. For this purpose Taylor type
polycrystalline model is implemented in ABAQUS code through a user defined material
subroutine (UMAT). The parameters that are used in these simulations are shown in Table 1.
Table 1 Parameters used in the simple tension simulation of FCC polycrystalline.
ValueParameter 70000MPa Young’s modulus E 0.3 Poisson’s ratio ν 6s−1 Characteristic strain rate 0γ 65MPa Slip system strength 0τ 4.35 Stress exponent of slip cn
Fig. 1 shows flow stress-strain rate relationship. The relation is exactly a straight line in a
logarithmic scale; therefore the following viscoplastic equation can be proposed to relate
effective plastic strain rate and equivalent stress: p B
e effAσ ε= (6)
where A and B are material constants and are A=124.0 and B=0.23 in this case. eσ will be
calculate by yield function proposed in next section.

7
Fig. 1 Flow stress vs. strain rate for Taylor type FCC polycrystalline
b. Stress state
The polycrystalline behavior is also examined in various stress states. For this purpose, the
material is subjected to 2D tension and compression tests with deferent stress ratios to obtain
polycrystalline yield locus. The applied boundary condition in this case is explained in [Jafari
Nedoushan, 2012 #288]. Fig. 2 shows the resulted yield locus and its comparison with Tresca
and Von Mises yield loci. As it can be seen in this figure the polycrystalline yield locus is
located between Tresca and Von Mises yield loci and is closer to Von Mises criterion. Therefore
Von Mises criterion can be used to predict FCC polycrystalline behavior in various stress states.
The following yield function is also proposed to predict polycrystalline behavior more closely: 3 2 62 3 0f J J Yϕ= − − = (9)
where 2J and 3J are second and third invariants of deviatoric stress tensor, Y is strain
dependent yield stress and ϕ is material constants. When ϕ is 1.5 the best agreement between
polycrystalline yield locus and the proposed J2J3 yield locus will be obtained.
101
10-4
10-3
10-2
10-1
σ (Mpa)
Stra
in ra
te (1
/s)

8
Fig. 2 Resulting yield loci from the Taylor type polycrystalline and also Tresca and Von Mises
yield functions
Now polycrystalline behavior can be switched with Eq. 6 and one of the above mentioned yield
functions. Although effects of strain rate and stress state were considered separately but the
resulted model behave similar to polycrystalline model in any combination of strain rates and
stress states. To confirm this fact, resulting yield loci from polycrystalline and J2J3 models are
compared for various strain rates in Fig. 3.
Fig. 3 Resulting yield loci from a Taylor type polycrystalline and J2J3 yield function in various
strain rates.
-1.5 -1 -0.5 0 0.5 1 1.5-1.5
-1
-0.5
0
0.5
1
1.5
σ1/Y
σ2/
Y
Taylor type polycrystallineVon Mises yield locusTresca yield locus
-50 0 50-50
0
50
σ1
σ2
Taylor type polycrystalline, strain rate = 0.0001Taylor type polycrystalline, strain rate = 0.001Taylor type polycrystalline, strain rate = 0.01J2J3 yield locus

9
2.2. Grain boundary sliding
Grain boundary sliding occurs due to shear tractions acting tangent to the grain boundary. For
calculating GBS deformation in a material point it is assumed that:
a. The boundaries are comprised of parallel planes in several presumed directions at a
material point. So a set of normal vectors indicates the boundaries.
b. Stress tensor is identical for all boundaries and is equal to macro stress tensor in a
material point. This assumption means that grain boundary sliding will be calculated with
the average stress applied to the entire boundaries in a material point.
c. Relative sliding velocity between two grains has the same direction with shear traction
acting on the boundary.
Shear traction acting on all parallel boundaries with a normal vector i
nβ can be calculated as
follows:
( )i j m j i iij mj tn n n n tβ β β β β β βτ σ σ σ= − =
(10)
The superscript β indicates the number of assumed boundary planes. Here tβσ is the resolved
shear stress and itβ is direction of this shear traction. If the resolved shear stress in these
boundaries is greater than a threshold stress thσ , the following viscous constitutive equation is
assumed to characterize sliding. This equation relates the relative sliding velocity of two adjacent
grains to the resolved shear stress [3, 5]:
1exp( / ) ( )
0
nGBS t tht t th
th
t t th
Q kTv ifkT
v if
ββ β
β β
η σ σ σ σσ
σ σ
⎧ Ω − −= >⎪
⎨⎪ = <⎩
(11)
Here, η is a characteristic sliding velocity; k is the Boltzmann constant; T is the absolute
temperature; 1n is the stress exponent of the slid; Ω is the atomic volume and GBSQ is the
activation energy for GBS. Shear strain rate due to GBS in all parallel boundary planes with a
normal vector i
nβ can be written as:

10
tvd
ββγ =
(12)
where, d is the average grain size. The macro deformation due to GBS in these parallel
boundaries can be written as:
1 ( )2 i iij j jD n t t nβ β β β β βγ= +
1 ( )2 i iij j jW n t t nβ β β β β βγ= −
(13-1)
(13-2)
Considering all boundaries:
1
1 ( )2
b
i i
NGBSij j jD n t t nβ β β β β
β
γ=
= +∑
(14-1)
1
1 ( )2
b
i i
NGBS
ij j jW n t t nβ β β β β
β
γ=
= −∑
(14-2)
where bN is the number of assumed boundary.
2.3. Grain boundary diffusion
Atoms (or equivalently, vacancies) adjacent to the grain boundary are assumed to be mobile.
Atoms may detach from each grain, diffuse along the boundary, and then re-attach to one of the
two adjacent grains [3]. In this process, atoms detach from regions of the grain boundary that are
subjected to compressive stress and migrate to regions that are under tensile stress [3, 5]. Hence
grain-boundary diffusion is assumed to be a function of variation of the normal stress acting on
the boundary. Therefore it is assumed that the flux of atoms tangent to each interface is related to
the normal stress [3, 5] through:

11
exp( / )2
GBt GB GBt nD Q kTjkT s
δ σΩ − ∂= −
∂
(15)
where T is absolute temperature; k is Boltzmann constant; exp( / )GBt GBtD Q kT− is the tangential
grain boundary diffusivity; GBtQ is the corresponding activation energy; 2GBδ is the thickness of
the diffusion layer in one grain. When temperature is constant, equation 15 can be simplified to:
nj qs
σ∂= −
∂ (16)
where q is a constant.
Remembering that a material point was visualized as an aggregate of grains with their
boundaries, for calculating GBD deformation it is assumed that:
a. Deformation caused by GBD in a material point can be replaced by deformation that
occurs in one grain by GBD. With this assumption atoms only move around one grain
and cannot move from one grain to another one and grain boundary migration is not
modeled. With this assumption grain boundaries cannot exchange atoms at triple
junctions and satisfaction of mass conservation at triple junctions does not need to be
considered.
b. The grain has a spherical shape.
c. Stress is constant around the grain boundary and equals to macro stress at that material
point.
With these assumptions, a grain boundary is a two-dimensional space (spherical surface) and
equations 16 is extended for a two dimensional space:
1 21 2
( )n nnj q q e e
s sσ σσ ∂ ∂
= − ∇ = − +∂ ∂
(18)
where 1e and 2e are unit base vectors on the boundary which is a two dimensional space; 1s and
2s are lengths along 1e and 2e . Considering mass conservation, the velocity discontinuity in the
direction of the normal to the grain boundary is:

12
2 2
2 21 2
[ ] ( )n nnv q
s sσ σ∂ ∂
= − +∂ ∂
(19)
It can be proved from the above equation that in GBD mechanism, rate of deformation
tensor and deviatoric stress tensor relate via [Jafari Nedoushan, 2012 #288]:
3
1.6755GBDij ij
KD Sd
= (30)
where K is a constant.
2.4. Grain growth model
Equations 12 and 30 show that grain size is effective in stress-strain rate relationship in GBS and
GBD mechanisms respectively. Therefore in order to determine the flow stress, it is necessary to
know the current grain size. In hot deformation the grain size will be changed by both static and
deformation enhanced grain growth. Static grain growth was observed to be small for materials
and temperatures under consideration [43]. There are several models proposed to describe
deformation enhanced grain growth. In the current work the following model that was proposed
by Kim et al [17] is used to predict grain size evolution during hot deformation. This model was
derived considering a micro-structural approach.
p
effd Cdε= (31)
where d , is the dynamic grain growth rate and C is an assumed constant. According to Eq. 12
and 30, for a given deformation rate as the grain size increases the flow stress also increases.
Therefore when the grain growth is considered in the proposed model, the hardening behavior in
hot deformation can be predicted.
In summary, to predict material behavior in this paper, grain growth and deformation due to
grain boundary mechanisms are computed according to the above mentioned models in all
simulations but inter-granular deformation is computed with the following three approaches:
a. Using Taylor type polycrystalline (Model I)
b. Using Eq. 6 in conjunction with Von Mises yield function (Model II)
13
c. Using Eq. 6 in conjunction with the J2J3 yield function as is proposed by Eq. 9 (Model
III)
3. Numerical implementation To add the proposed constitutive models to the Abaqus FEM code, a user subroutine UMAT is
used. In this subroutine following algorithm shown in Fig. 4 is used. In this algorithm tijdε is
total strain increment; GBDijdε is strain increment due to GBD;
GBSijdε is GBS strain increment;
Crijdε is strain increment due to inter-granular deformation. Cr
σε
∂Δ∂Δ
is the Jacobean and is
calculated from the Taylor model and it can be easily shown that is equal to t
σε
∂Δ∂Δ
which is the
total Jacobean. θ is a character that shows GBS and GBD are calculated from the stress at the
beginning or the end of the increment. For example, if 0θ = , GBS and GBD are calculated from
the stress value at the beginning of the increment and if 1θ = , the stress value at the end of the
increment will be used. In this work 0.5θ = has been used.

14
Fig. 4 Numerical algorithm used to implement constitutive equations in Abaqus software
4. Applications and results In this section, the proposed models are used in various strain rates and stress states to
investigate the capability and limitations of these models. Then Model II is used in a situation
that grain growth and hardening are also effective and predictions are compared with tray
forming experiments.

15
4.1. Simulation of step strain-rate tensile tests:
Step strain-rate tensile tests use a series of strain rates imposed upon a single specimen, to obtain
data for flow stress as a function of temperature, grain size and strain rate. Further details of the
step strain-rate testing procedure are described in Ref. [2, 26]. The flow stress vs. strain rate data
on AA5083 for six different microstructures, derived from the step strain-rate testing procedure
due to Krajewski et al [26] will be used for comparison with the predicted results in this paper.
Step strain-rate tensile test is simulated in ABAQUS FEM code with a cubic specimen with a
length of a and boundary conditions that are described in Ref. [Jafari Nedoushan, 2012 #288].
The proposed models are implemented in this code through user-material routines (UMAT).
The constitutive parameters used in these simulations were calibrated with the grain sizes of 7
mμ and 81.7 mμ . The procedure of finding the best set of constitutive parameters for Model I is
reported in Ref. [27]. For models II and III the procedure is much simpler. For these models a
one dimensional code is written in MATLAB software by using Eqs. 6, 10-14 and 30. Then the
best set of parameters obtained with this code with minimizing error between predicted stress
and stress from experiments. In fact one of the advantages of models II and III is that finding
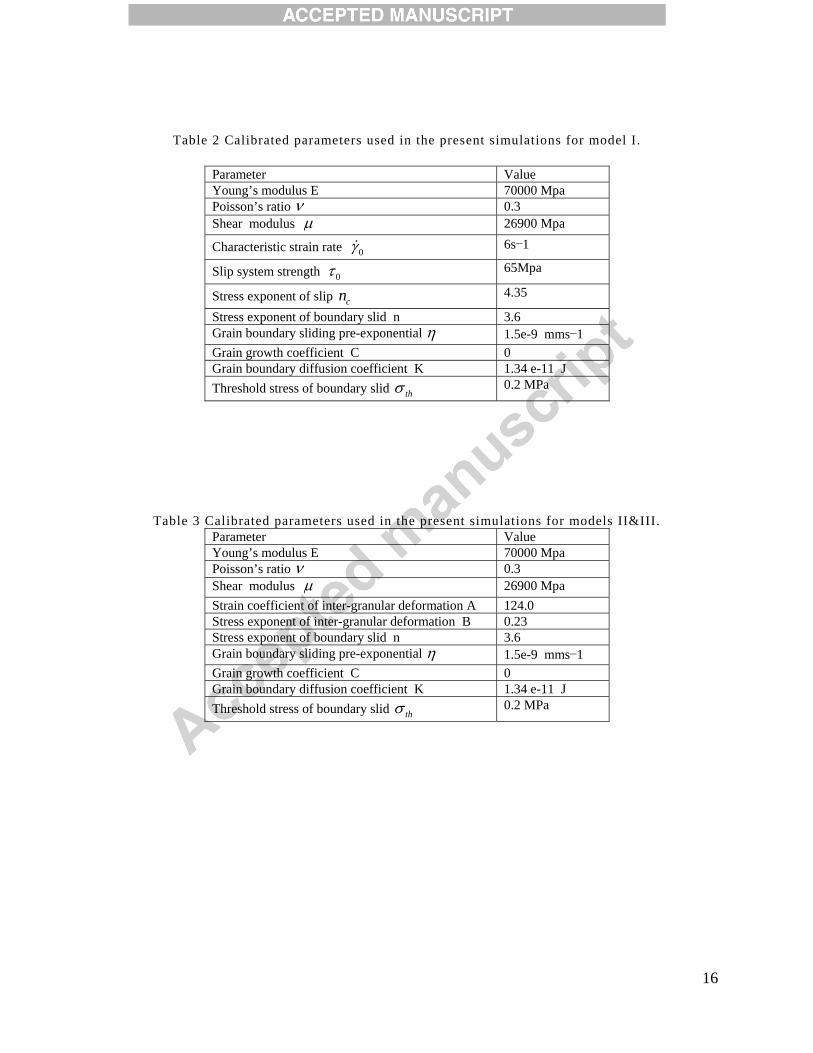
their parameters is much simpler. Table 2 and 3 show calculated parameters.
For this material strain hardening, which is typically associated with grain growth during hot
forming, was observed to be small over the temperature, strains and strain rates under
consideration [44]. Therefore the grain growth coefficient was set to be zero in these cases. The
calibrated material properties were then used to predict the behavior of specimens with other
grain sizes. Predictions of the three proposed models are identical as are compared with
Krajewski et al [26] results, in Fig. 5. It can be seen from this figure that the proposed models
predict material behavior for various grain sizes and strain rates close to experimental data. It is
worth mentioning that the three proposed models can compute contribution of each deformation
mechanisms in total deformation as it is shown in [27].
16
Table 2 Calibrated parameters used in the present simulations for model I.
Value Parameter 70000 Mpa Young’s modulus E 0.3 Poisson’s ratio ν 26900 Mpa Shear modulus μ 6s−1 Characteristic strain rate 0γ 65Mpa Slip system strength 0τ 4.35 Stress exponent of slip cn 3.6 Stress exponent of boundary slid n 1.5e-9 mms−1 Grain boundary sliding pre-exponential η 0 Grain growth coefficient C 1.34 e-11 J Grain boundary diffusion coefficient K 0.2 MPa Threshold stress of boundary slid thσ
Table 3 Calibrated parameters used in the present simulations for models II&III. Value Parameter 70000 Mpa Young’s modulus E 0.3 Poisson’s ratio ν 26900 Mpa Shear modulus μ 124.0 Strain coefficient of inter-granular deformation A 0.23 Stress exponent of inter-granular deformation B 3.6 Stress exponent of boundary slid n 1.5e-9 mms−1 Grain boundary sliding pre-exponential η 0 Grain growth coefficient C 1.34 e-11 J Grain boundary diffusion coefficient K 0.2 MPa Threshold stress of boundary slid thσ

17
Fig. 5 Comparison of current predictions with Krajewski et al results [26].
4.2. Gas pressure forming simulation
The material models are implemented in FEM simulations of gas-pressure bulge-forming to
compare the models in situations where multidirectional stress exists. In gas-pressure bulge-
forming process, the sheet is clamped between two dies and it is formed by gas pressure at a hot
temperature. Details of this procedure are reported in references [26, 45].
In current simulations initial sheet thickness is 1.04mm and the gas pressure is 0.25Mpa. The
considered material is AA5083 at 450 C and hence the calibrated parameters in table 2 and 3 are
used again. ABAQUS STANDARD is used to simulate gas-pressure bulge-forming. The material models are
applied through user subroutines. The process is considered to be axisymmetric. A mesh
101
10-4
10-3
10-2
10-1
Stress (Mpa)
Stra
in ra
te (1
/s)
Predictions of three models for d=81.7μmPredictions of three models for d=37.2μmPredictions of three models for d=22.3μmPredictions of three models for d=11.2μmPredictions of three models for d=9.2μmPredictions of three models for d=7μmData from Krajewski et al [26]

18
sensitivity study is conducted to assure that element size is sufficiently fine to provide repeatable
predictions of bulge displacements and strain rates. Fig. 6 shows initial mesh of the blank, with
160 quadrilateral CAX4 elements. The implicit formulation in Abacus requires calculation of an
initial elastic response; hence a linear ramp type pressure is applied within one second and is
then kept constant until 1800 seconds. Plastic deformation was subsequently calculated for the
duration of the simulations. It should be emphasized that all simulations have the same
circumstances except the inter-granular constitutive models. Fig. 7 shows the deformed sheet
predicted by the model II.
Fig. 6 initial mesh of the blank, with 160 quadrilateral CAX4 elements
Fig. 7 Final deformed sheet predicted by model II after 1800 Sec. and applying a constant pressure of 0.25MPa

19
Fig. 8 compares predicted dome heights during forming time for the three proposed inter-
granular models. Results of model I was previously compared with experimental data and good
agreements obtained [27]. As it can be seen in this figure, prediction of model III is very close to
model I but model II predicts dome height a little less than the other two. By comparing the
inter-granular yield loci for the three models that are shown in Fig. 2, this difference is
reasonable. In gas pressure forming, stress state locates between plane strain and biaxial tension.
Von Mises criterion predicts higher flow stresses than the others in this zone so the predicted
displacements by this model are expected to be less.
A remarkable difference between the three proposed models is the computational costs that
causes model II and III to be more attractive than model I. For the same circumstances used in
different simulations, model II and III were performed about fifty times faster than model I.
Fig. 8 Predictions of dome heights vs. time for the three models
0 200 400 600 800 1000 1200 1400 1600 18000
5
10
15
20
25
30
Time(s)
Dom
e he
ight
s(m
m)
Model IModel IIModel III

20
4.3. Simulation of superplastic tray forming In this section, model II is examined in a situation that grain growth has a significant effect. In
hot forming processes besides initial grain size and strain rate, flow stress is also usually affected
by grain size evolution and growth. In the previous sections it was shown that the model can well
predict material behaviour for various grain sizes and strain rates. If the model can also properly
predict effects of hardening due to grain growth, obviously it can be used in most hot forming
simulations. At first the model is calibrated by tensile tests with different strain rates and then it
is used to simulate superplastic gas pressure tray forming.
Fig. 9 shows the stress-strain relations under various strain rates for AA5083 at a constant test
temperature of 550 C [20]. Further details about composition of this material and its
experimental stress-strain results have been reported by Khaleel et al [20].
As it can be seen in Fig. 9, hardening is remarkable in this case. These curves were used to
calibrate the model and calibrated parameters are shown in Table 4. These parameters were
obtained from the initial yield points for four strain rates and slope of one of the curves. As it can
be seen from Fig. 9, the calibrated model closely fits the experimental data for various strain
rates and strains. These results, shows the ability of model to predict hardening behavior for
different strain rates.
Fig. 9 Stress-strain curves on AA5083 at a constant test temperature of 550 C

21
Table 4 Parameters of model II, calibrated by tensile test curves with different stain rates.
Value Parameter 67400 Mpa Young’s modulus E 0.3 Poisson’s ratio ν 8.6 mμ Initial grain size d 90.0 Strain coefficient of inter-granular deformation A 0.303 Stress exponent of inter-granular deformation B 1.3 Stress exponent of boundary slide n 1.4e-5 mms−1 Grain boundary sliding pre-exponential η 2.75 Grain growth coefficient C 5.0 e-11 J Grain boundary diffusion coefficient K 0.45 MPa Threshold stress of boundary slide thσ
In gas pressure tray forming, a sheet is clamped on a die with a rectangular cavity of 50.8mm
width, 203mm length, and 25.4mm depth. Fig. 10 shows one-quarter of the die surface and the
sheet. A flat flange is surrounding the cavity with 38mm width. A die entrance radius of 3.2mm
makes the transition from the flange to the rectangular cavity.
ABAQUS EXPLICIT finite element code is used for these simulations. The sheet is meshed with
1463 quadrilateral M3D4R elements and the die has 3713 R3D4 elements. The gas pressure
history used in Khaleel et al [20] experiments, is shown in Fig. 11. In the current simulation, this
pressure history is applied on the sheet by a user amplitude routine (VUAMP). The constitutive
model is also implemented through a user defined material routine (VUMAT). Effect of friction
coefficient on the accuracy of results is discussed by Khaleel et al [20] and in this work the
suggested friction coefficient by them is used.
Fig. 10 One-quarter of the die and the sheet in ABAQUS EXPLICIT FEM environment

22
Fig. 11 Gas pressure history that was used in experiments.
In this process, the centre of the sheet moves towards the bottom of the die. After a while this
point contacts the die and remains fixed. Then deformation at the corners increases. Fig. 12
shows the predicted and measured depth of the centre vs. time. As it can be seen from this figure,
the predictions are in good agreement with experiments. The sheet centre contact with the die
after about 360 seconds. Fig. 13 shows the deformed sheet at that time and Fig. 14 compares the
computed and predicted sheet thicknesses along its width at the contact time. In this figure
predicted thicknesses from simulation without considering grain growth, is also added. In
simulation without considering grain growth, grain growth coefficient, C set to be zero and other
circumstances are the same as other simulations. As it can be seen in this figure if grain growth
be ignored material flow stress reduces and predicted deformation is larger.
Fig. 12 Depth of the sheet centre during forming vs. time
0 100 200 300 400 500 600 700 8000
0.1
0.2
0.3
0.4
0.5
0.6
0.7
0.8
0.9
1
Pre
ssur
e (M
Pa)
Time(s)
0 100 200 300 400 500 600 700 800-30
-25
-20
-15
-10
-5
0
Tray
dep
th (m
m)
Forming time(s)
Experiments due to Khaleel et al [20]Present simulation

23
Fig. 13 Deformed sheet after 360 seconds
It can be seen from Fig. 14 that the predicted thicknesses are in good agreement with measured
thicknesses, especially at the central zone where the friction coefficient does not affect sheet
thickness. In the other word in this zone the most effective parameter on prediction accuracy is
constitutive equation. Fig. 15 shows the tray after 840 Sec. At this instance, the corners of tray
are also formed. Fig. 16 and Fig. 17 compare the predicted and measured tray thicknesses at that
time in width and length directions respectively. In Fig. 16 predicted thicknesses from simulation
without considering grain growth is also reported. Comparing figures 14 and 16, effect of
considering grain growth is more obvious when the workpiece does not touch bottom of the die.
Since at the end of the process workpiece shape is similar to the die, changing material flow
stress due to grain growth does not affects final shape of the workpiece the same as the middle of
the process.
Fig. 14 Predicted and measured sheet thicknesses in width direction after 360 second.
0 10 20 30 40 50 60 700.5
1
1.5
2
2.5
Thic
knes
s at
360
s (m
m)
Distance from tray center (mm)
Simulation with grain growthExperiments due to Khaleel et alSimulation without grain growth

24
Fig. 15 Deformed sheet after 840 seconds.
Fig. 16 Predicted and measured sheet thicknesses in width direction, after 840 seconds

25
Fig. 17 Predicted and measured sheet thicknesses in length direction, after 840 seconds. These two figures also reveal that predictions by the model are in close agreement with
experimental measurements. These results, obtained in this section prove that the model can well
be used for various strain rates; stress states and when hardening due to grain size evolution
exists.
Contribution of each deformation mechanism is distinguishable in all of the above simulations.
The interested reader can refer to Ref [27] for more details. This capability of the models can
help more understanding of the material deformation and observed phenomena.
Conclusions: In this paper, constitutive models are considered for inter-granular deformation and grain
boundary mechanisms. Grain boundary mechanisms include: grain boundary sliding (GBS),
grain boundary diffusion (GBD) and grain growth. Micro constitutive models are proposed for
GBS and GBD that correlate macro stresses to strain rates.
Besides the above mentioned boundary mechanisms, inter-granular deformation is also predicted
by three different approaches I: the Taylor type polycrystalline approach, II: Von-Mises
viscoplastic model and III: a J2-J3 viscoplastic model.
0 20 40 60 80 100 120 140 1600.5
1
1.5
2
Thic
knes
s at
840
s (m
m)
Distance from tray center (mm)
Present simulationExperiments due to Khaleel et al [20]

26
It is shown that although model II and III perform much faster than model I and can be calibrated
with less effort but they can well predict material behaviour as accurate as model I. It is also
shown that in different stress states, model III is closer to model I than model II.
The models were examined when hardening is also remarkable. It was revealed that the models
can predict material behaviour in various grain sizes, strains, strain rates and stress states. As an
example of this situation a superplastic tray forming is simulated and compared with
experimental observations.
ACKNOWLEDGMENTS
The DB work was supported by the Romanian National University Research Council (CNCSIS),
Program PCCE, Grant No. 6/2010.
References [1] N. Chandra, Constitutive behavior of superplastic materials, International Journal of Non-Linear Mechanics, 37 (2002) 461-484. [2] S. Agarwal, C. Briant, P. Krajewski, A. Bower, E. Taleff, Experimental Validation of Two-dimensional Finite Element Method for Simulating Constitutive Response of Polycrystals During High Temperature Plastic Deformation, Journal of Materials Engineering and Performance, 16 (2007) 170-178. [3] A.F. Bower, E. Wininger, A two-dimensional finite element method for simulating the constitutive response and microstructure of polycrystals during high temperature plastic deformation, Journal of the Mechanics and Physics of Solids, 52 (2004) 1289-1317. [4] D.E. Cipoletti, A.F. Bower, Y. Qi, P.E. Krajewski, The influence of heterogeneity in grain boundary sliding resistance on the constitutive behavior of AA5083 during high-temperature deformation, Materials Science and Engineering: A, 504 (2009) 175-182. [5] N. Du, A.F. Bower, P.E. Krajewski, E.M. Taleff, The influence of a threshold stress for grain boundary sliding on constitutive response of polycrystalline Al during high temperature deformation, Materials Science and Engineering: A, 494 (2008) 86-91. [6] J.H. Kim, S.L. Semiatin, C.S. Lee, Constitutive analysis of the high-temperature deformation of Ti-6Al-4V with a transformed microstructure, Acta Materialia, 51 (2003) 5613-5626. [7] T.G. Langdon, A unified approach to grain boundary sliding in creep and superplasticity, Acta Metallurgica et Materialia, 42 (1994) 2437-2443. [8] F.C. Liu, Z.Y. Ma, Contribution of grain boundary sliding in low-temperature superplasticity of ultrafine-grained aluminum alloys, Scripta Materialia, 62 (2010) 125-128. [9] S.S. Park, H. Garmestani, G.T. Bae, N.J. Kim, P.E. Krajewski, S. Kim, E.W. Lee, Constitutive analysis on the superplastic deformation of warm-rolled 6013 Al alloy, Materials Science and Engineering: A, 435-436 (2006) 687-692. [10] J. Pan, A.C.F. Cocks, Computer simulation of superplastic deformation, Computational Materials Science, 1 (1993) 95-109.

27
[11] K.B. Hyde, P.S. Bate, Dynamic grain growth in Al-6Ni: Modelling and experiments, Acta Materialia, 53 (2005) 4313-4321. [12] O.V. Rofman, P.S. Bate, Dynamic grain growth and particle coarsening in Al-3.5Cu, Acta Materialia, 58 2527-2534. [13] M.K. Rabinovich, V.G. Trifonov, Dynamic grain growth during superplastic deformation, Acta Materialia, 44 (1996) 2073-2078. [14] D.S. Wilkinson, C.H. Cáceres, On the mechanism of strain-enhanced grain growth during superplastic deformation, Acta Metallurgica, 32 (1984) 1335-1345. [15] C.H. Cáceres, D.S. Wilkinson, Large strain behaviour of a superplastic copper alloy--I. Deformation, Acta Metallurgica, 32 (1984) 415-422. [16] N. Bontcheva, G. Petzov, Microstructure evolution during metal forming processes, Computational Materials Science, 28 (2003) 563-573. [17] B.-N. Kim, K. Hiraga, Y. Sakka, B.-W. Ahn, A grain-boundary diffusion model of dynamic grain growth during superplastic deformation, Acta Materialia, 47 (1999) 3433-3439. [18] Y.-i. Yoshizawa, T. Sakuma, Grain growth acceleration during high temperature deformation in high purity alumina, Materials Science and Engineering: A, 149 (1991) 59-64. [19] M. Zhou, F.P. Dunne, Mechanism-based constitutive equation for the superplastic behaviour of a titanium alloy, Journal of Strain Analysis, 31 (1996) 187-196. [20] M.A. Khaleel, K.I. Johnson, C.H. Hamilton, M.T. Smith, Deformation modeling of superplastic AA-5083, International Journal of Plasticity, 14 (1998) 1133-1154. [21] M.K. Khraisheh, F.K. Abu-Farha, M.A. Nazzal, K.J. Weinmann, Combined Mechanics-Materials Based Optimization of Superplastic Forming of Magnesium AZ31 Alloy, CIRP Annals - Manufacturing Technology, 55 (2006) 233-236. [22] N. Ridley, P.S. Bate, B. Zhang, Material modelling data for superplastic forming optimisation, Materials Science and Engineering A, 410-411 (2005) 100-104. [23] M.A. Nazzal, M.K. Khraisheh, F.K. Abu-Farha, The effect of strain rate sensitivity evolution on deformation stability during superplastic forming, Journal of Materials Processing Technology, 191 (2007) 189-192. [24] L. Filograna, M. Racioppi, G. Saccomandi, I. Sgura, A simple model of nonlinear viscoelasticity taking into account stress relaxation, Acta Mechanica, 204 (2009) 21-36. [25] J. Bonet, A. Gil, R.D. Wood, R. Said, R.V. Curtis, Simulating superplastic forming, Computer Methods in Applied Mechanics and Engineering, 195 (2006) 6580-6603. [26] P.E. Krajewski, L.G. Hector Jr, N. Du, A.F. Bower, Microstructure-based multiscale modeling of elevated temperature deformation in aluminum alloys, Acta Materialia, 58 (2010) 1074-1086. [27] R. Jafari Nedoushan, M. Farzin, M. Mashayekhi, D. Banabic, A Microstructure-Based Constitutive Model for Superplastic Forming, Metallurgical and Materials Transactions A, 43 (2012) 4266-4280. [28] P.R. Dawson, S.R. MacEwen, P.D. Wu, Advances in sheet metal forming analyses: dealing with mechanical anisotropy from crystallographic texture, International Materials Reviews, 48 (2003) 86-122. [29] T. Kuwabara, A. Van Bael, E. Iizuka, Measurement and analysis of yield locus and work hardening characteristics of steel sheets wtih different r-values, Acta Materialia, 50 (2002) 3717-3729.

28
[30] F. Roters, P. Eisenlohr, L. Hantcherli, D.D. Tjahjanto, T.R. Bieler, D. Raabe, Overview of constitutive laws, kinematics, homogenization and multiscale methods in crystal plasticity finite-element modeling: Theory, experiments, applications, Acta Materialia, 58 1152-1211. [31] K. Inal, K.W. Neale, A. Aboutajeddine, Forming limit comparisons for FCC and BCC sheets, International Journal of Plasticity, 21 (2005) 1255-1266. [32] K. Inal, P.D. Wu, K.W. Neale, Finite element analysis of localization in FCC polycrystalline sheets under plane stress tension, International Journal of Solids and Structures, 39 (2002) 3469-3486. [33] K. Inal, P.D. Wu, K.W. Neale, Instability and localized deformation in polycrystalline solids under plane-strain tension, International Journal of Solids and Structures, 39 (2002) 983-1002. [34] J. Gawad, D. Banabic, D.S. Comsa, M. Gologanu, A. Van Bael, P. Eyckens, P. Van Houtte and D. Roose, Evolving texture-informed anisotropic yield criterion for sheet forming, In: AIP Conference Proceedings of the 9th International Conference and Workshop on Numerical Simulation of 3D Sheet Metal Forming Processes, 1567 (2013) 350-356. [35] M. Schurig, A. Bertram, H. Petryk, Micromechanical analysis of the development of a yield vertex in polycrystal plasticity, Acta Mechanica, 194 (2007) 141-158. [36] P. Tugcu, K.W. Neale, P.D. Wu, K. Inal, Crystal plasticity simulation of the hydrostatic bulge test, International Journal of Plasticity, 20 (2004) 1603-1653. [37] D. Peirce, R.J. Asaro, A. Needleman, An analysis of nonuniform and localized deformation in ductile single crystals, Acta Metallurgica, 30 (1982) 1087-1119. [38] D. Peirce, R.J. Asaro, A. Needleman, Material rate dependence and localized deformation in crystalline solids, Acta Metallurgica, 31 (1983) 1951-1976. [39] R.J. Asaro, Crystal plasticity J. Appl. Mech., 50 (1983) 921-934. [40] R.J. Asaro, W.H. John, Y.W. Theodore, Micromechanics of Crystals and Polycrystals, in: Advances in Applied Mechanics, Elsevier, 1983, pp. 1-115. [41] Y. Huang, A user material subroutine incorporating single crystal plasticity in the ABAQUS finite element program, in, Harvard University, Massachusetts, 1992. [42] G.I. Taylor, Plastic Strain in Metal, Journal of the Institute of Metals, 62 (1938) 307-324. [43] T.R. McNelley, K. Oh-Ishi, A.P. Zhilyaev, S. Swaminathan, P.E. Krajewski, E.M. Taleff, Characteristics of the Transition from Grain-Boundary Sliding to Solute Drag Creep in Superplastic AA5083, Metallurgical and Materials Transactions A, 39 (2008) 50-64. [44] M.-A. Kulas, W.P. Green, E.M. Taleff, P.E. Krajewski, T.R. Mcnelley, Deformation mechanisms in superplastic AA5083 materials, Metallurgical and Materials Transactions A, 36A (2005) 1249-1261. [45] M.T. Eric, G.H. Louis, R.B. John, V. Ravi, E.K. Paul, The effect of stress state on high-temperature deformation of fine-grained aluminum-magnesium alloy AA5083 sheet, 57 (2009) 2812-2822.
29
Research highlights: • Constitutive models are proposed for hot forming
• Three dimensional constitutive equations are proposed for grain boundary mechanisms
• Visco-plastic models are proposed to decrease computational costs
• The models consider affecting parameters such as grain size, strain and strain rate
• The models predictions are compared with hot forming experiments