simulation of crowd evacuation scenarios using netlogo
TRANSCRIPT

Simulation of crowd evacuation scenarios using
NetLogo
Federico D’Amato
March 18, 2016
1 Introduction
The aim of this work is to model the evacuation of a group of people from asimple area. The area to evacuate is represented by a simple grid; the peopleflow from a fixed number of entry-points towards a fixed number of exit-points.In pedestrian simulation, most modellers focus on the locomotion level, thatis, how to get from one place to another. However, pedestrian behaviour andmotion does not only depend on the locomotion. It is important to includesocial behaviours which impact the results of the simulation. In this work weinclude two main social behaviours:
• Altruism
• Conformism
With altruism we denote the propension of an individual to help a disadvan-taged person (like a disabled). In [1] this is referred as “helping behaviour”.We denote conformism as the tendency of a person to follow the most commonbehaviour of the others, i.e. to go in the most crowded areas of the grid. Con-formists people tend to agree with the average opinion of their neighbors whileanti-conformists tend to disagree [2].In this work we distiguish between two types of pedestrians: normals and dis-ableds. Each class of pedestrians has some characteristic attributes, such as themoving speed (obviously normal pedestrians are faster than the disabled ones).The implementation and all the simulations are performed using NetLogo 5.3[3], which is “a multi-agent programmable modeling environment”.
1
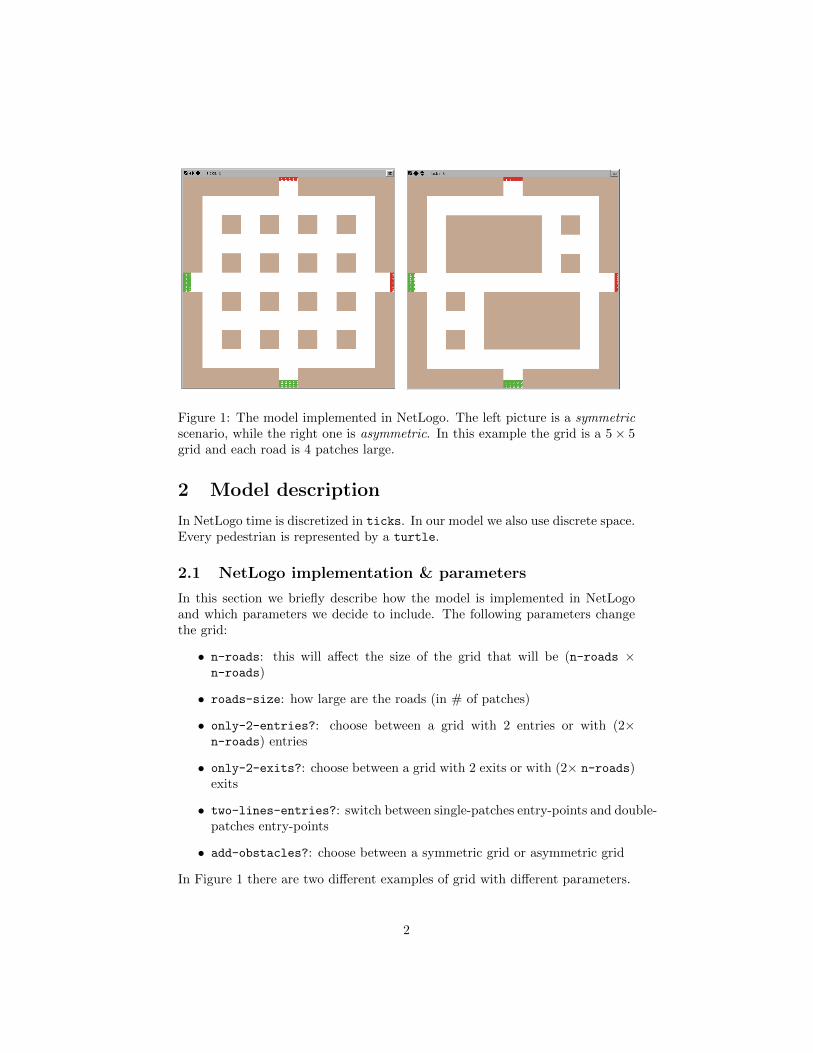
Figure 1: The model implemented in NetLogo. The left picture is a symmetricscenario, while the right one is asymmetric. In this example the grid is a 5× 5grid and each road is 4 patches large.
2 Model description
In NetLogo time is discretized in ticks. In our model we also use discrete space.Every pedestrian is represented by a turtle.
2.1 NetLogo implementation & parameters
In this section we briefly describe how the model is implemented in NetLogoand which parameters we decide to include. The following parameters changethe grid:
• n-roads: this will affect the size of the grid that will be (n-roads ×n-roads)
• roads-size: how large are the roads (in # of patches)
• only-2-entries?: choose between a grid with 2 entries or with (2×n-roads) entries
• only-2-exits?: choose between a grid with 2 exits or with (2× n-roads)exits
• two-lines-entries?: switch between single-patches entry-points and double-patches entry-points
• add-obstacles?: choose between a symmetric grid or asymmetric grid
In Figure 1 there are two different examples of grid with different parameters.
2
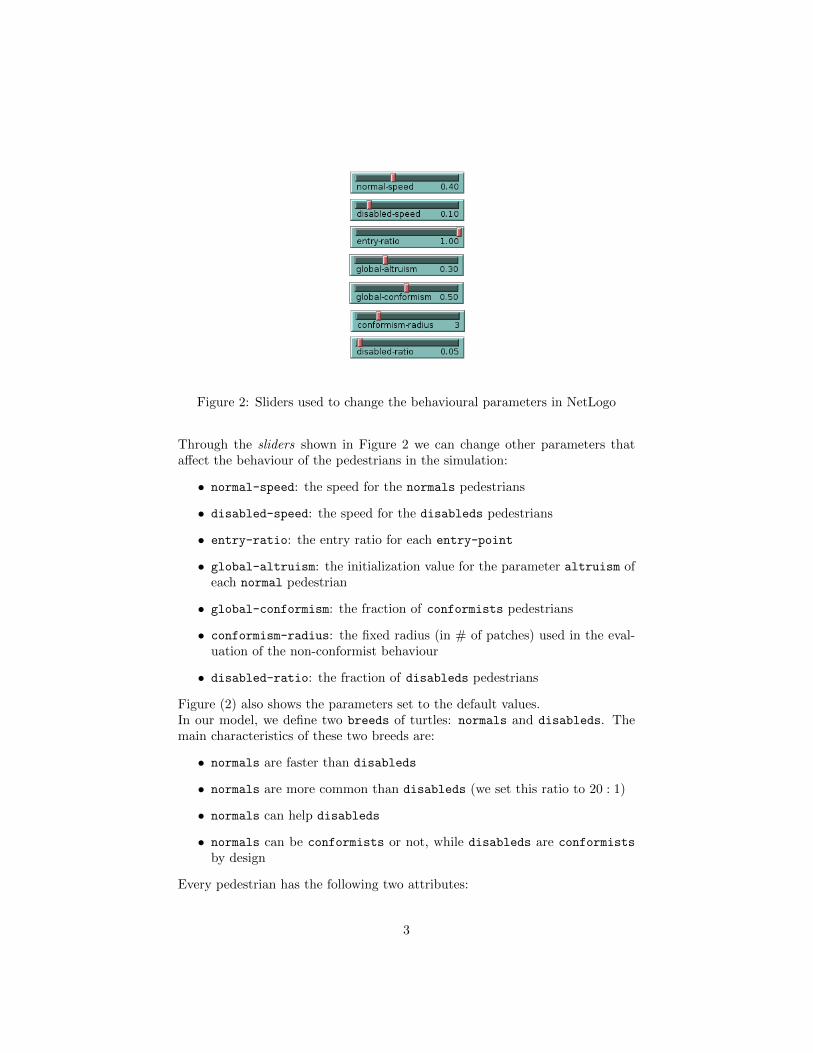
Figure 2: Sliders used to change the behavioural parameters in NetLogo
Through the sliders shown in Figure 2 we can change other parameters thataffect the behaviour of the pedestrians in the simulation:
• normal-speed: the speed for the normals pedestrians
• disabled-speed: the speed for the disableds pedestrians
• entry-ratio: the entry ratio for each entry-point
• global-altruism: the initialization value for the parameter altruism ofeach normal pedestrian
• global-conformism: the fraction of conformists pedestrians
• conformism-radius: the fixed radius (in # of patches) used in the eval-uation of the non-conformist behaviour
• disabled-ratio: the fraction of disableds pedestrians
Figure (2) also shows the parameters set to the default values.In our model, we define two breeds of turtles: normals and disableds. Themain characteristics of these two breeds are:
• normals are faster than disableds
• normals are more common than disableds (we set this ratio to 20 : 1)
• normals can help disableds
• normals can be conformists or not, while disableds are conformists
by design
Every pedestrian has the following two attributes:
3
• speed ∈ (0, 1]
• altruism ∈ [0, 1]
• conformist? ∈ {true, false}
2.2 Arrival process
The arrival process at the i-th entry-point is geometrically distributed, i.e. wegenerate a pedestrian at entry-point i at the k-th tick if the entry-point is freeand
x(k) ∈ X ∼ U [0, 1] < λi (1)
where U [0, 1] is the uniform distribution and λi is the entry-ratio of entry i.
2.3 Moving behaviour
In our model, in one tick one pedestrian can move only by one position, chosenwith some criterion in his neighborhood (we consider cross-like neighborhoods).At each tick, every pedestrian decides whether to move or not according to hisspeed. Each pedestrian’s speed express the probability to move in one tick.The moving behaviour is explained in Algorithm 1.
Algorithm 1: Moving behaviour, i-th pedestrian, k-th tick
1 if # free patch in my neighborhood > 0 then2 choose y(k, i) ∈ X ∼ U [0, 1]
3 if y(k, i) < speedki then
4 Move to a free patch in the neighborhood according to somecriterion
2.4 Altruism
At each tick, every normal turtle decides whether to help or not a disabled
in his neighborhood. The helping behaviour is explained in Algorithm 2.Instruction 7 of Algorithm 2 has 2 meanings: on one hand, it means that eachnormal pedestrian can help at most one disabled; on the other hand it meansalso that if a pedestrian choose not to help a disabled at time k, he will nothelp anybody else in the future.We will use the term altruists for those pedestrian who execute Instruction 5at least one time, while we will call non-altruists the others.
2.5 Conformism
The moving strategy used in Instruction 4 of Algorithm 1 strongly depends onthe attribute conformist? of the pedestrian.
4

Algorithm 2: Helping behaviour, i-th pedestrian, k-th tick
1 if altruismki > 0 then
2 if # disableds in my neighborhood > 0 then3 choose a(k, i) ∈ X ∼ U [0, 1]
4 if a(k, i) < altruismki then
5 Help a random disabled j in my neighborhood
6 speedk+1i =
speedki +speedk
j
2
7 altruismk+1i = 0
2.5.1 Conformist behaviour
Conformists pedestrians aim to the nearest exit-point regardless of how crowdedthe path is. The conformist behaviour is explained in Algorithm 3.
Algorithm 3: Conformist behaviour, i-th pedestrian, k-th tick
1 Let nearest-exitki the nearest exit
2 Compute headingki as the angle between me and nearest-exitki3 for each free patchj in my neighborhood do4 Compute heading-patchj as the angle between patchj and
nearest-exitki
5 Let best-patchki = arg minj |headingki − heading-patchj |
6 Move to best-patchki
2.5.2 Non-Conformist behaviour
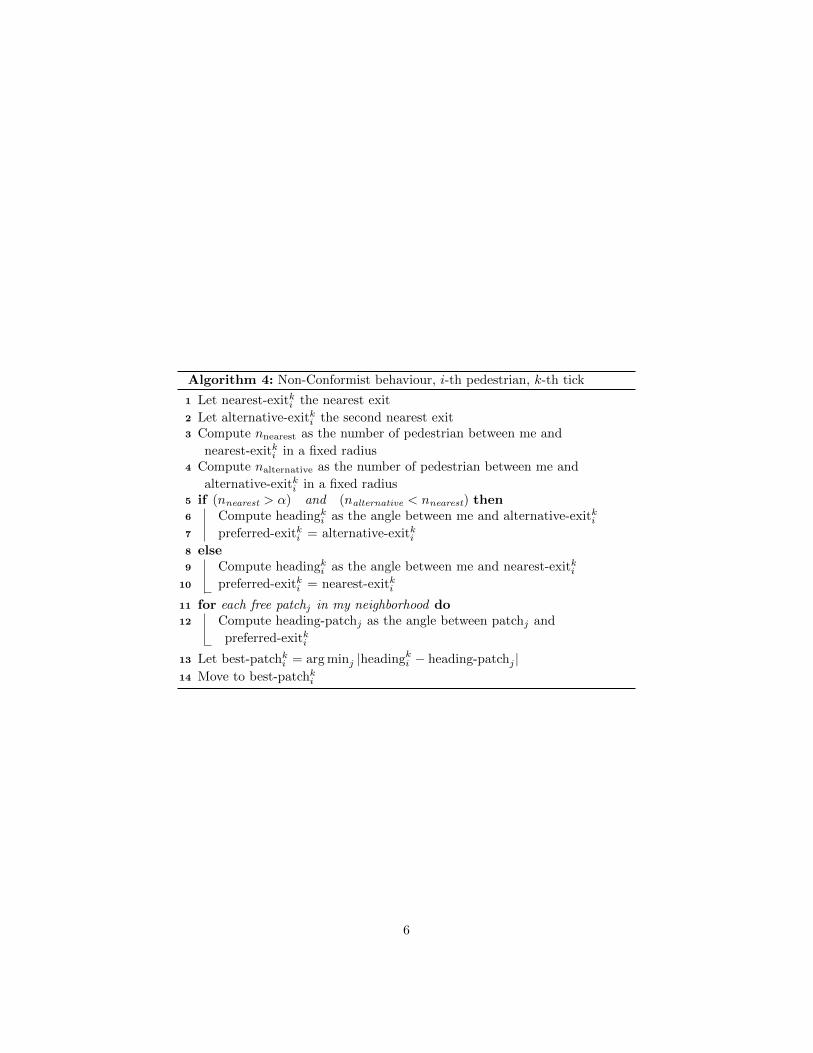
Non-conformists pedestrians have a more complex behaviour. They try to avoidoverly crowded paths; if the path to the nearest exit is too crowded, a non-conformist pedestrian change his mind and heads to another exit. The non-conformist behaviour is explained in Algorithm 4.Instruction 5 of Algorithm 4 deserves some explanations. We have two condi-tions:
• nnearest > α express the fact that the path between the pedestrian andthe nearest exit-point is too crowded. α is a parameter of the model.
• nsecond < nnearest express the fact that the second exit-point in less crowdedthan the nearest exit-point.
If these two conditions are satisfied, the non-conformist pedestrian heads to thesecond nearest exit-point instead of the nearest one.
5
Algorithm 4: Non-Conformist behaviour, i-th pedestrian, k-th tick
1 Let nearest-exitki the nearest exit
2 Let alternative-exitki the second nearest exit3 Compute nnearest as the number of pedestrian between me and
nearest-exitki in a fixed radius4 Compute nalternative as the number of pedestrian between me and
alternative-exitki in a fixed radius5 if (nnearest > α) and (nalternative < nnearest) then6 Compute headingki as the angle between me and alternative-exitki7 preferred-exitki = alternative-exitki8 else9 Compute headingki as the angle between me and nearest-exitki
10 preferred-exitki = nearest-exitki
11 for each free patchj in my neighborhood do12 Compute heading-patchj as the angle between patchj and
preferred-exitki
13 Let best-patchki = arg minj |headingki − heading-patchj |
14 Move to best-patchki
6
0 100 200 300 400 500 600 700 800 900 1,000
0
0.2
0.4
0.6
k
Fi,j(k)
Entry 1
Exit 1
Exit 2
0 100 200 300 400 500 600 700 800 900 1,000
0
0.5
1
k
Fi,j(k)
Entry 2
Exit 2
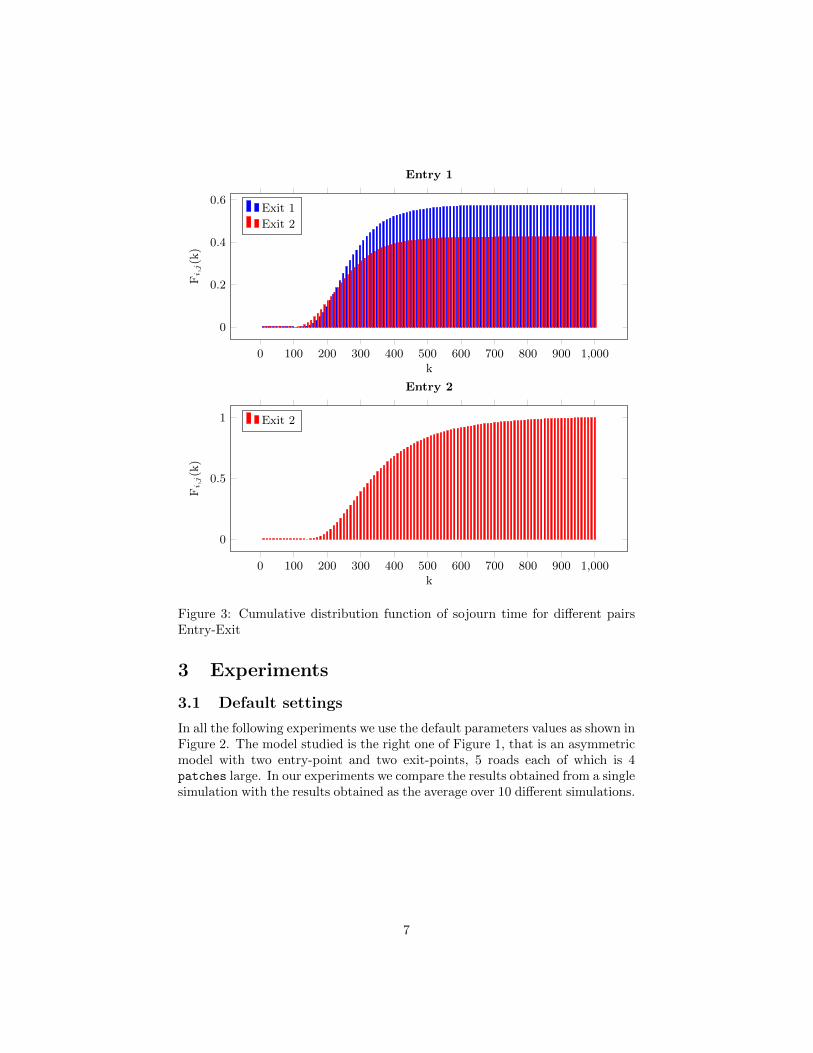
Figure 3: Cumulative distribution function of sojourn time for different pairsEntry-Exit
3 Experiments
3.1 Default settings
In all the following experiments we use the default parameters values as shown inFigure 2. The model studied is the right one of Figure 1, that is an asymmetricmodel with two entry-point and two exit-points, 5 roads each of which is 4patches large. In our experiments we compare the results obtained from a singlesimulation with the results obtained as the average over 10 different simulations.
7
3.2 Numerical results
Let i an entry-point and j an exit-point, we can define the cumulative distribu-tion function of the sojourn time of pedestrians as:
Fi,j(k) = P {exit at Exitj with sojourn time ≤ k | enter at Entryi} (2)
Figure 3 shows Fi,j(k) for all the Entry-Exit combinations. As we can see fromFigure 3, using the default settings, pedestrians that enter from Entry 2 alwaysexit in Exit 2. On the other hand, pedestrians that enter from Entry 1 exit bothfrom Exit 1 or Exit 2. In particular, with the default settings, we have:
P1,1 = P {exit at Exit1| enter at Entry1} = 0.574
P1,2 = P {exit at Exit2| enter at Entry1} = 0.426
P2,1 = P {exit at Exit1| enter at Entry2} = 0.000
P2,2 = P {exit at Exit2| enter at Entry2} = 1.000
(3)
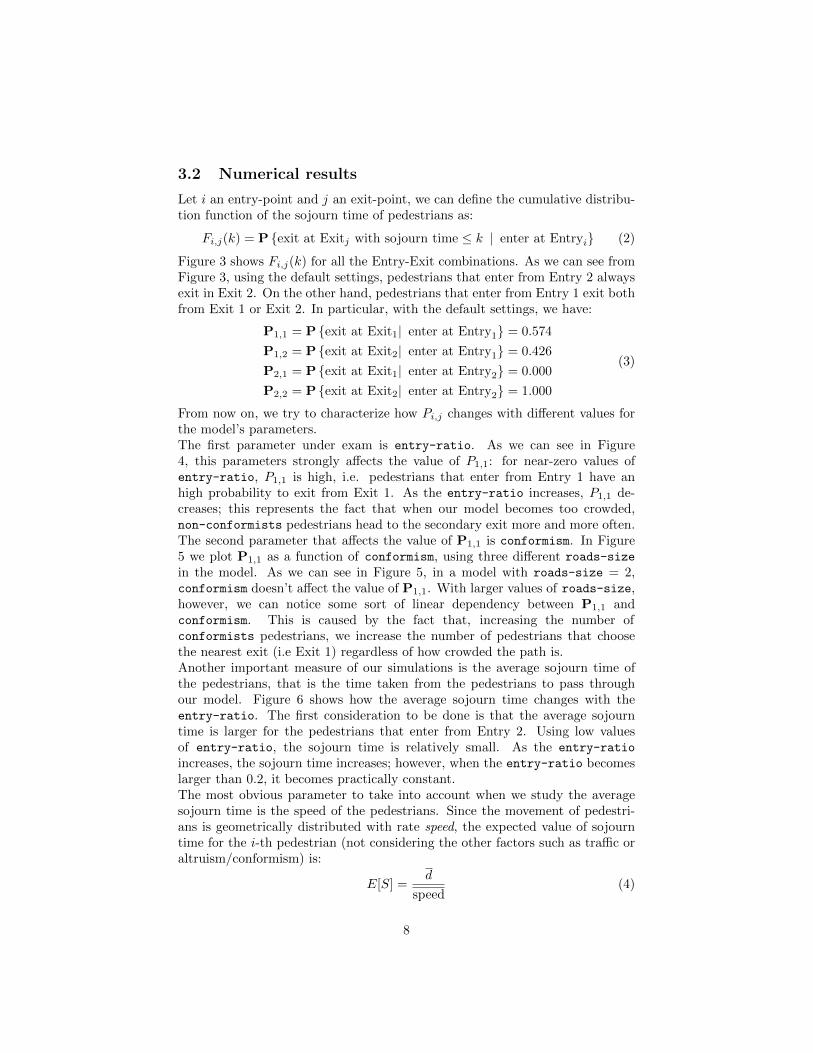
From now on, we try to characterize how Pi,j changes with different values forthe model’s parameters.The first parameter under exam is entry-ratio. As we can see in Figure4, this parameters strongly affects the value of P1,1: for near-zero values ofentry-ratio, P1,1 is high, i.e. pedestrians that enter from Entry 1 have anhigh probability to exit from Exit 1. As the entry-ratio increases, P1,1 de-creases; this represents the fact that when our model becomes too crowded,non-conformists pedestrians head to the secondary exit more and more often.The second parameter that affects the value of P1,1 is conformism. In Figure5 we plot P1,1 as a function of conformism, using three different roads-size
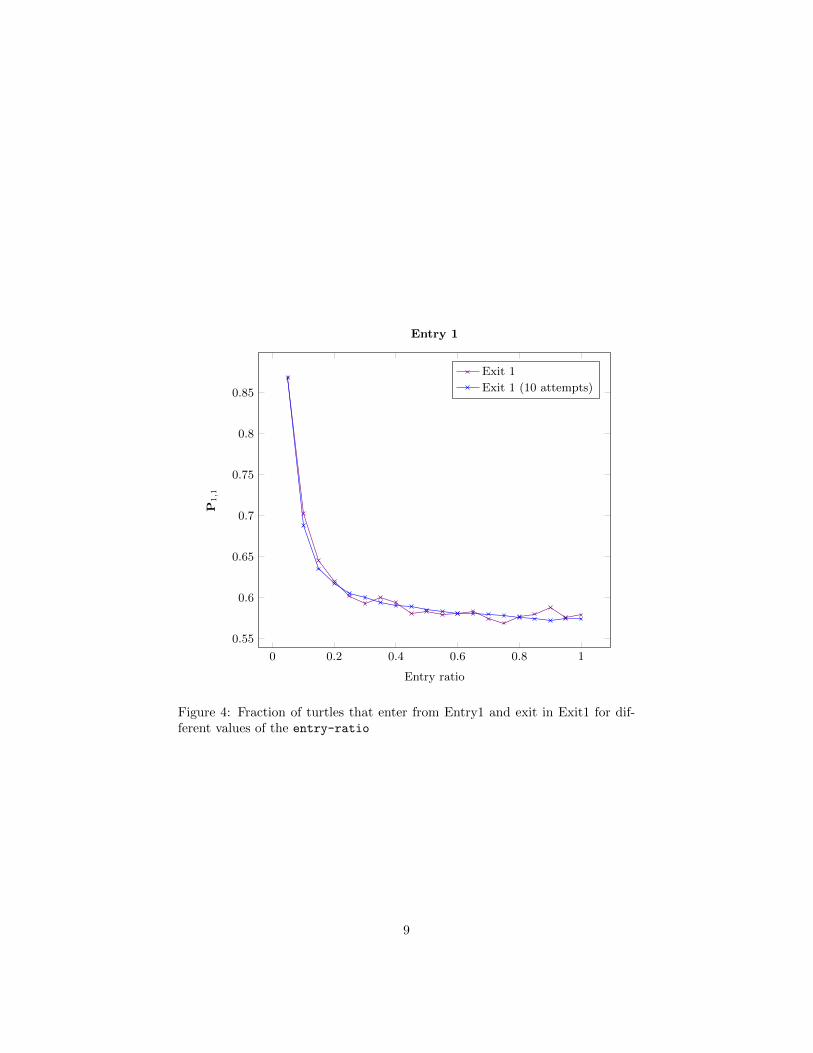
in the model. As we can see in Figure 5, in a model with roads-size = 2,conformism doesn’t affect the value of P1,1. With larger values of roads-size,however, we can notice some sort of linear dependency between P1,1 andconformism. This is caused by the fact that, increasing the number ofconformists pedestrians, we increase the number of pedestrians that choosethe nearest exit (i.e Exit 1) regardless of how crowded the path is.Another important measure of our simulations is the average sojourn time ofthe pedestrians, that is the time taken from the pedestrians to pass throughour model. Figure 6 shows how the average sojourn time changes with theentry-ratio. The first consideration to be done is that the average sojourntime is larger for the pedestrians that enter from Entry 2. Using low valuesof entry-ratio, the sojourn time is relatively small. As the entry-ratio
increases, the sojourn time increases; however, when the entry-ratio becomeslarger than 0.2, it becomes practically constant.The most obvious parameter to take into account when we study the averagesojourn time is the speed of the pedestrians. Since the movement of pedestri-ans is geometrically distributed with rate speed, the expected value of sojourntime for the i-th pedestrian (not considering the other factors such as traffic oraltruism/conformism) is:
E[S] =d
speed(4)
8
0 0.2 0.4 0.6 0.8 1
0.55
0.6
0.65
0.7
0.75
0.8
0.85
Entry ratio
P1,1
Entry 1
Exit 1
Exit 1 (10 attempts)
Figure 4: Fraction of turtles that enter from Entry1 and exit in Exit1 for dif-ferent values of the entry-ratio
9

0 0.2 0.4 0.6 0.8 1
0.4
0.45
0.5
0.55
0.6
0.65
0.7
Conformism
P1,1
Entry 1
Exit 1 (roads-size=2)
Exit 1 (roads-size=2, 10 attempts)
Exit 1 (roads-size=4)
Exit 1 (roads-size=4, 10 attempts)
Exit 1 (roads-size=6)
Exit 1 (roads-size=6, 10 attempts)
Figure 5: Fraction of turtles that enter from Entry1 and exit in Exit1 for dif-ferent values of the conformism and roads-size
10
0 0.2 0.4 0.6 0.8 1
200
220
240
260
280
300
320
340
360
380
Entry ratio
Averagesojourn
time(#
ticks)
Entry 1
Entry 1 (10 attempts)
Entry 2
Entry 2 (10 attempts)
Figure 6: Average sojourn time (in # of ticks) of pedestrians that enter fromEntry1 and Entry2 for different values of the entry-ratio
11
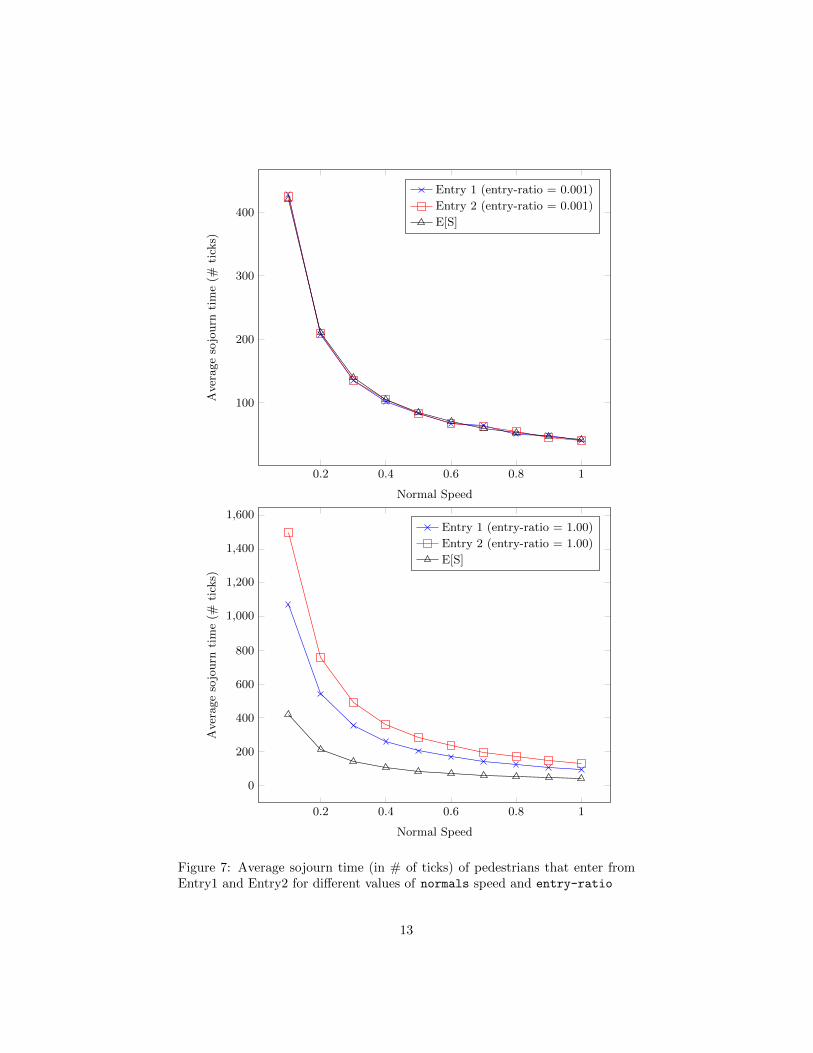
where d is the (fixed) distance between Entry 1 and Exit 1 (or Entry 2 andExit 2) and speed is the average speed of the pedestrians. Figure 7 shows thatusing a low value of the entry-ratio, the average sojourn time of pedestriansis nearly E[S]. When we set the entry-ratio to an higher value, the averagesojourn time increases: this happens because of the traffic in the area causedby the high entry-ratio.
12
0.2 0.4 0.6 0.8 1
100
200
300
400
Normal Speed
Averagesojourn
time(#
ticks)
Entry 1 (entry-ratio = 0.001)
Entry 2 (entry-ratio = 0.001)
E[S]
0.2 0.4 0.6 0.8 1
0
200
400
600
800
1,000
1,200
1,400
1,600
Normal Speed
Averagesojourn
time(#
ticks)
Entry 1 (entry-ratio = 1.00)
Entry 2 (entry-ratio = 1.00)
E[S]
Figure 7: Average sojourn time (in # of ticks) of pedestrians that enter fromEntry1 and Entry2 for different values of normals speed and entry-ratio
13

4 Conclusions
In this work is presented a Netlogo implementation of a variety of crowd evac-uation scenarios. The model is highly customizable, in terms of the structurethe area to evacuate and in terms of the pedestrians’ behaviours. In particular,we have implemented two social behaviour: altruism and conformism. Thanksto the flexibility of the model, we were able to study how this two behaviourscan affect the values of:
• the cumulative distribution function of the sojourn time for all the en-try/exit pair
• the probability of the pedestrian to exit using an exit-point instead ofanother one
• the average sojourn time of the pedestrians in the area
Even if this work presents a reasonable set of experiments, more tests can bedone using different default settings. In particular it might be interesting to usedifferent types of asymmetries in the grid.
References
[1] I. von Siversa, A. Templetonc, G. Kostera, J. Druryc, A. Philippidesc, Hu-mans do not always act selfishly: social identity and helping in emergencyevacuation simulation, 2014.
[2] F. Bagnoli, R. Rechtman, Bifurcations in models of a society of reasonablecontrarians and conformists, 2015.
[3] Netlogo, http://ccl.northwestern.edu/netlogo/, 1999.
14